Application of EPS Geofoam to a Soil–Steel Bridge to Reduce Seismic Excitations


Faculty of Civil Engineering and Architecture, Opole University of Technology, 45-758 Opole, Poland
*
Author to whom correspondence should be addressed.
Geosciences 2019, 9(10), 448; https://0-doi-org.brum.beds.ac.uk/10.3390/geosciences9100448
Submission received: 25 September 2019
/
Revised: 16 October 2019
/
Accepted: 17 October 2019
/
Published: 21 October 2019
Abstract
:There have only been a limited number of analyses of soil–steel bridges under seismic and anthropogenic (rockburst) excitations. Rockbursts are phenomena similar to low-intensity natural earthquakes. They can be observed in Poland (Upper and Lower Silesia) as well as in many parts of the world where coal and gas are mined. The influence of rockbursts and natural earthquakes on soil–steel bridges should be investigated because the ground motions caused by these two kinds of excitations differ. In the present paper, a non-linear analysis of a soil–steel bridge was carried out. Expanded polystyrene (EPS) geofoam blocks were used in a numerical model of the soil–steel bridge to buffer the seismic wave induced by a rockburst (coming from a coal mine) as well as a natural earthquake (El Centro record). The analyzed soil–steel bridge had two closed pipe arches in its cross-section. The span of the shells was 4.40 m and the height of the shells was 2.80 m. The numerical analysis was conducted using the DIANA program based on the finite element method (FEM). The paper presents the FEM results of a 3D numerical study of a soil–steel bridge both with and without the application of the EPS geofoam under seismic excitations. The obtained results can be interesting to bridge engineers and scientists dealing with the design and analysis of bridges situated in seismic and mining areas.
1. Introduction
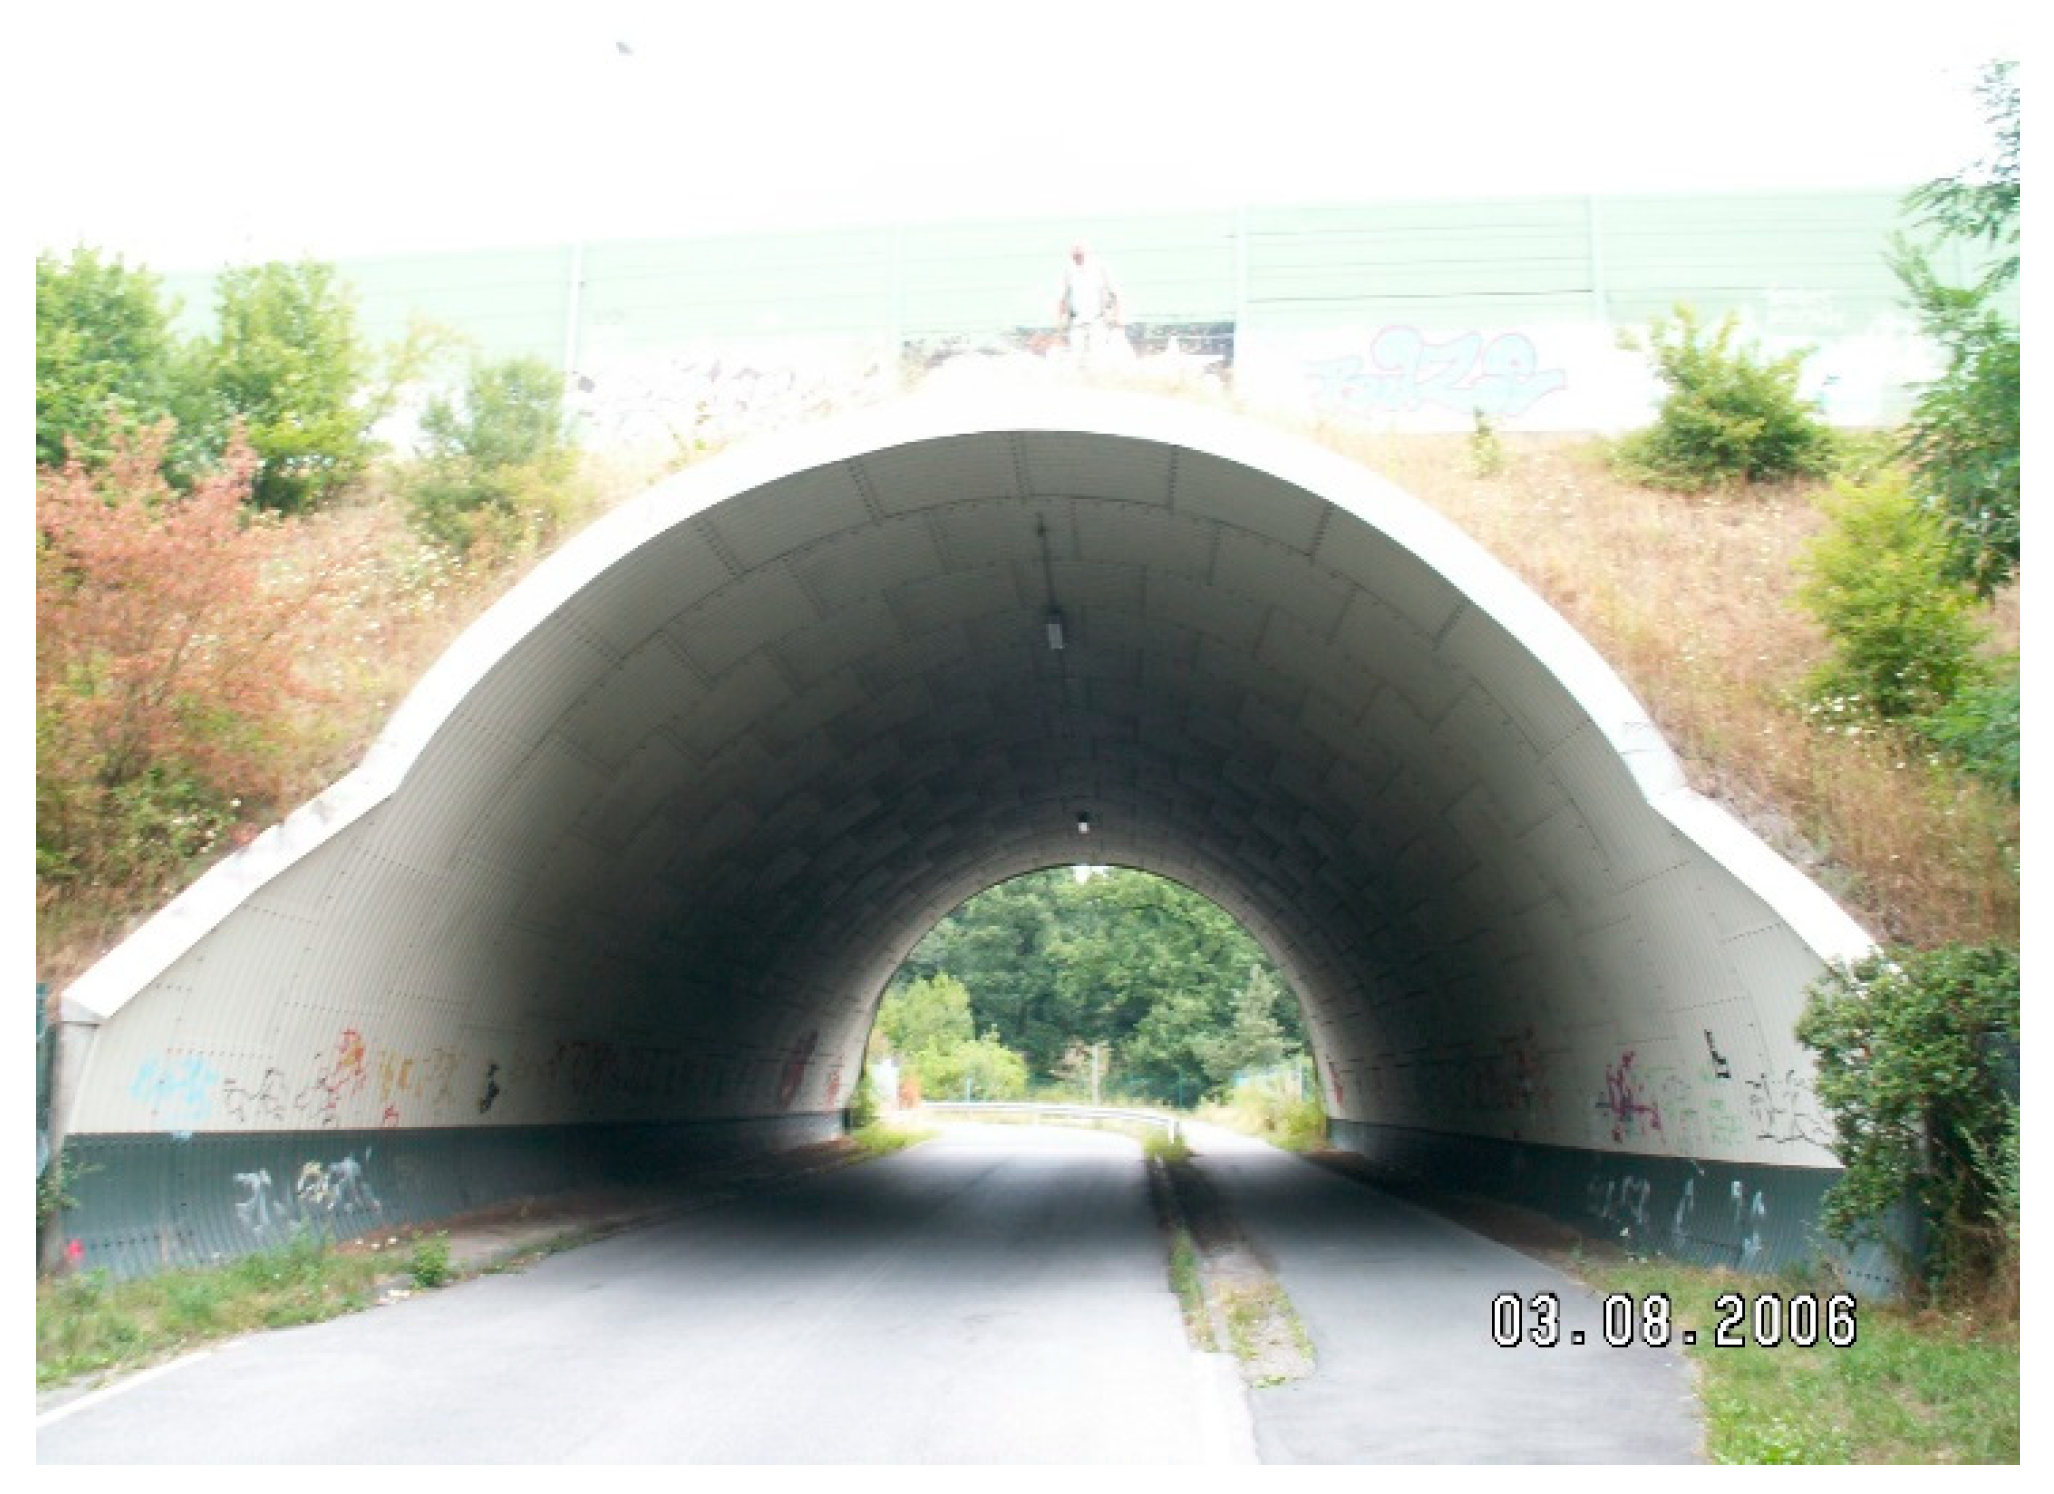
In road and bridge construction, there are many structures closely interacting with the soil, e.g., bridgeheads, concrete road culverts, retaining walls, integrated bridges, and soil–steel bridges (Figure 1). It is very important that the interaction between the soil and the structure is properly maintained in those structures. The current design of soil–steel bridges is based on adopting quite significant simplifications in their structural behaviour [1,2,3]. Consideration of the static and dynamic loads caused by service loads, as well as natural factors (earthquakes) and anthropogenic processes (rockbursts caused by mining and gas exploitation), are associated with the use of advanced computer programs. The existing standards and guidelines take into account the impact of seismic and anthropogenic loads on this type of bridge in a fairly general way [2]. Only the maximum design ground acceleration for which the structure should be designed is given in these standards.
In recent years, research has focused on the use of various materials for relieving and strengthening soil–steel bridges, e.g., reinforced concrete (RC) relieving slabs, steel reinforcing ribs, filling the ribs with concrete, RC cross beams, geosynthetics, and expanded polystyrene (EPS) [4,5,6,7,8,9,10]. EPS is being used more and more in roads and bridges, being a super-light material to replace part of the soil and decreasing the ground pressure on the structures. In Europe, lightweight fills, such as EPS–block geofoam, are very often used to construct the road embankments over soft soils. The first application of EPS geofoam as a lightweight fill material was the Flom Bridge in Norway (1972). EPS geofoam was used there to rebuild a road over soft soil that had significant settlement problems [11]. In Japan, EPS is widely used for lightweight fill applications including slope applications. Extensive research and development of the use of EPS has been performed in Japan for seismic loading applications [11]. Moorsel et al. [12] gave general information about EPS and its standardization, e.g., thermal conductivity, thermal resistance, and mechanical properties. The guidelines for designing highway embankments using EPS geofoam were developed by Stark et al. [13]. The geotechnical properties of EPS blocks, such as their compressive strength and Poisson’s ratio, were examined.
In addition, Arellano et al. [14] determined the most important benefits of using EPS as a lightweight fill material, such as: (1) Ease and quickness of construction, (2) ability to easily implement phased construction, (3) easy storage for use in emergency slope stabilization repairs, (4) ability to reuse the EPS blocks, (5) ability to be used in unfavorable weather conditions, (6) reduction of lateral pressure on bridge abutments, (7) excellent durability, and (8) ability to damp seismic tremors. Sun et al. [15] analyzed the effect of the use of EPS on a concrete road culvert. The results showed that the EPS behaved as a perfectly elastic–plastic material, suitable for use in soft foundation soils. The use of EPS caused a decrease in vertical stresses in the culvert by approx. 90% compared to the situation without EPS. In addition, it was found that during the 5-year monitoring of the culvert, the application of EPS caused a significant reduction (to close to zero) in the deformation of the top slab of the RC culvert. Ahmed et al. [16] investigated the effect of the use of EPS on the stress distribution in a pipe buried in the soil. During experimental tests, the EPS blocks were placed above the cross-section of the pipe and a static vertical load was applied. For the defined test parameters (type and thickness of EPS, geometry and type of filling material), the presence of EPS caused a significant reduction in the soil pressure at the crown and the lower part of the culvert. Bartlett et al. [17] analyzed the behavior of bridges founded directly on EPS blocks, showing that its use stabilized foundation settlements. Aabøe et al. [18] developed a compendium on the ways and benefits of the EPS used so far. That article presented the possibilities of using EPS blocks in various engineering structures, including road culverts. Meguid et al. [19] conducted experimental and numerical analyses of the interaction between the ground, the EPS, and the steel in a combined structure. In order to determine the effect of EPS on the steel structure, tests were carried out using the EPS in various configurations. Comparative tests were carried out on three culverts, one without EPS and two with different densities of EPS (15 kg/m3 and 22 kg/m3). It was found that increasing the density of EPS reduced the stress concentration in the walls of the analyzed culvert. It should be noted that the research was carried out on a small number of structures and only on a small scale, therefore, the results should be verified on larger scale structures. Vaslestad and Sayd [20] presented the numerical modelling of the load reduction on buried rigid culverts using EPS blocks. Abuhajtar et al. [21] and Maleska and Beben [22] conducted numerical analyses of soil–steel bridges under seismic and anthropogenic (rockburst) excitations, respectively.
The existing experimental studies and numerical analyses on the subject of the application of EPS to, e.g., RC culverts, demonstrated the great potential usefulness of this material for soil–steel bridges situated in seismic and mining areas. But, so far, there have only been a very limited number of studies on the behavior of soil–steel bridges under seismic excitations.
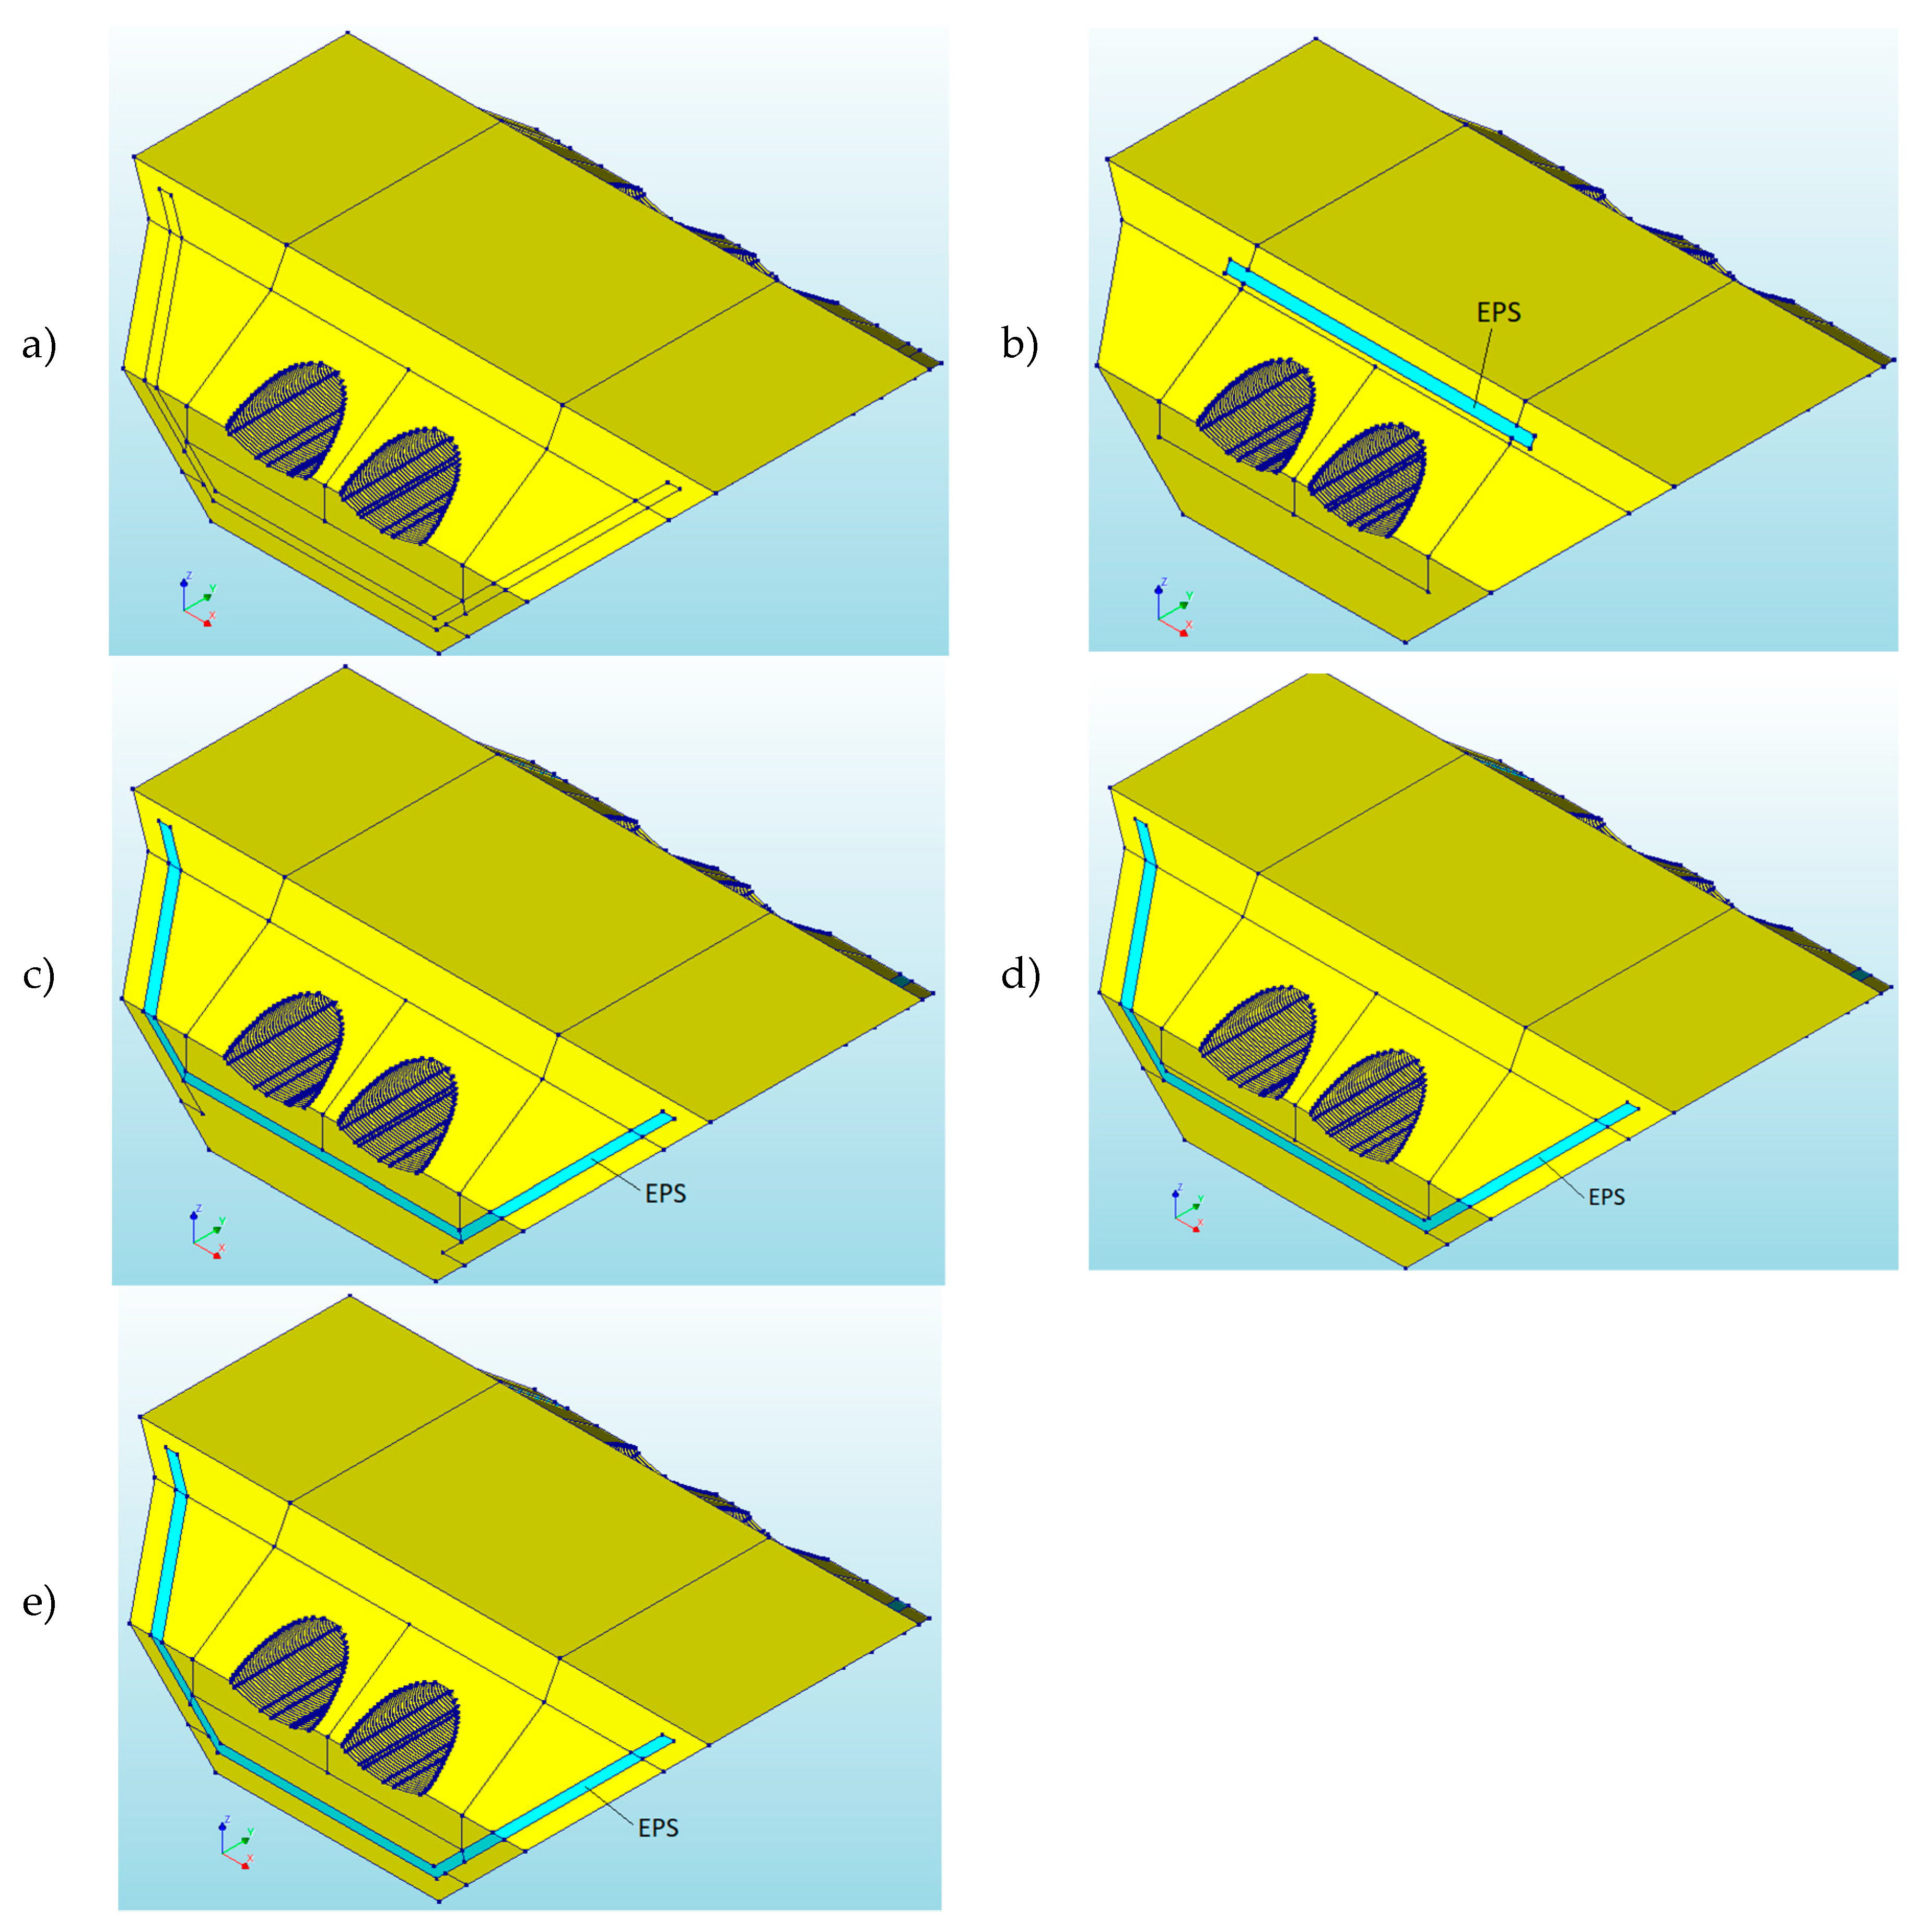
The main aim of the present paper is to determine the impact of the use of EPS blocks on the behavior of soil–steel bridges under seismic excitations: Rockbursts (a) and earthquakes (b). The tendency of the behavior of such structures with EPS applied, which will be useful for further research (involving more detailed parametric analysis and experimental testing), will also be presented. Five numerical models of soil–steel bridges have been created: (1) without EPS (model Ia, Ib), (2) with EPS geofoam located 1.0 m above the corrugated steel plate (CSP) shell of the bridge (model IIa, IIb), (3) with EPS geofoam placed 1.0 m below the lower part of the bridge foundation (model IIIa, IIIb), (4) with EPS geofoam placed 1.75 m below the lower part of the bridge (model IVa, IVb), and (5) with EPS geofoam situated 2.5 m below the bridge foundation (model Va, Vb). In addition, in models III, IV, and V, EPS blocks were also used on both sides of the bridge (at a distance of 2.0 m from the walls of the structure according to a slope inclination of 1:1). Moreover, in model II, the EPS blocks were extended over the side edge of the CSP shell by 3.0 m.
2. Description of the Soil–Steel Bridge
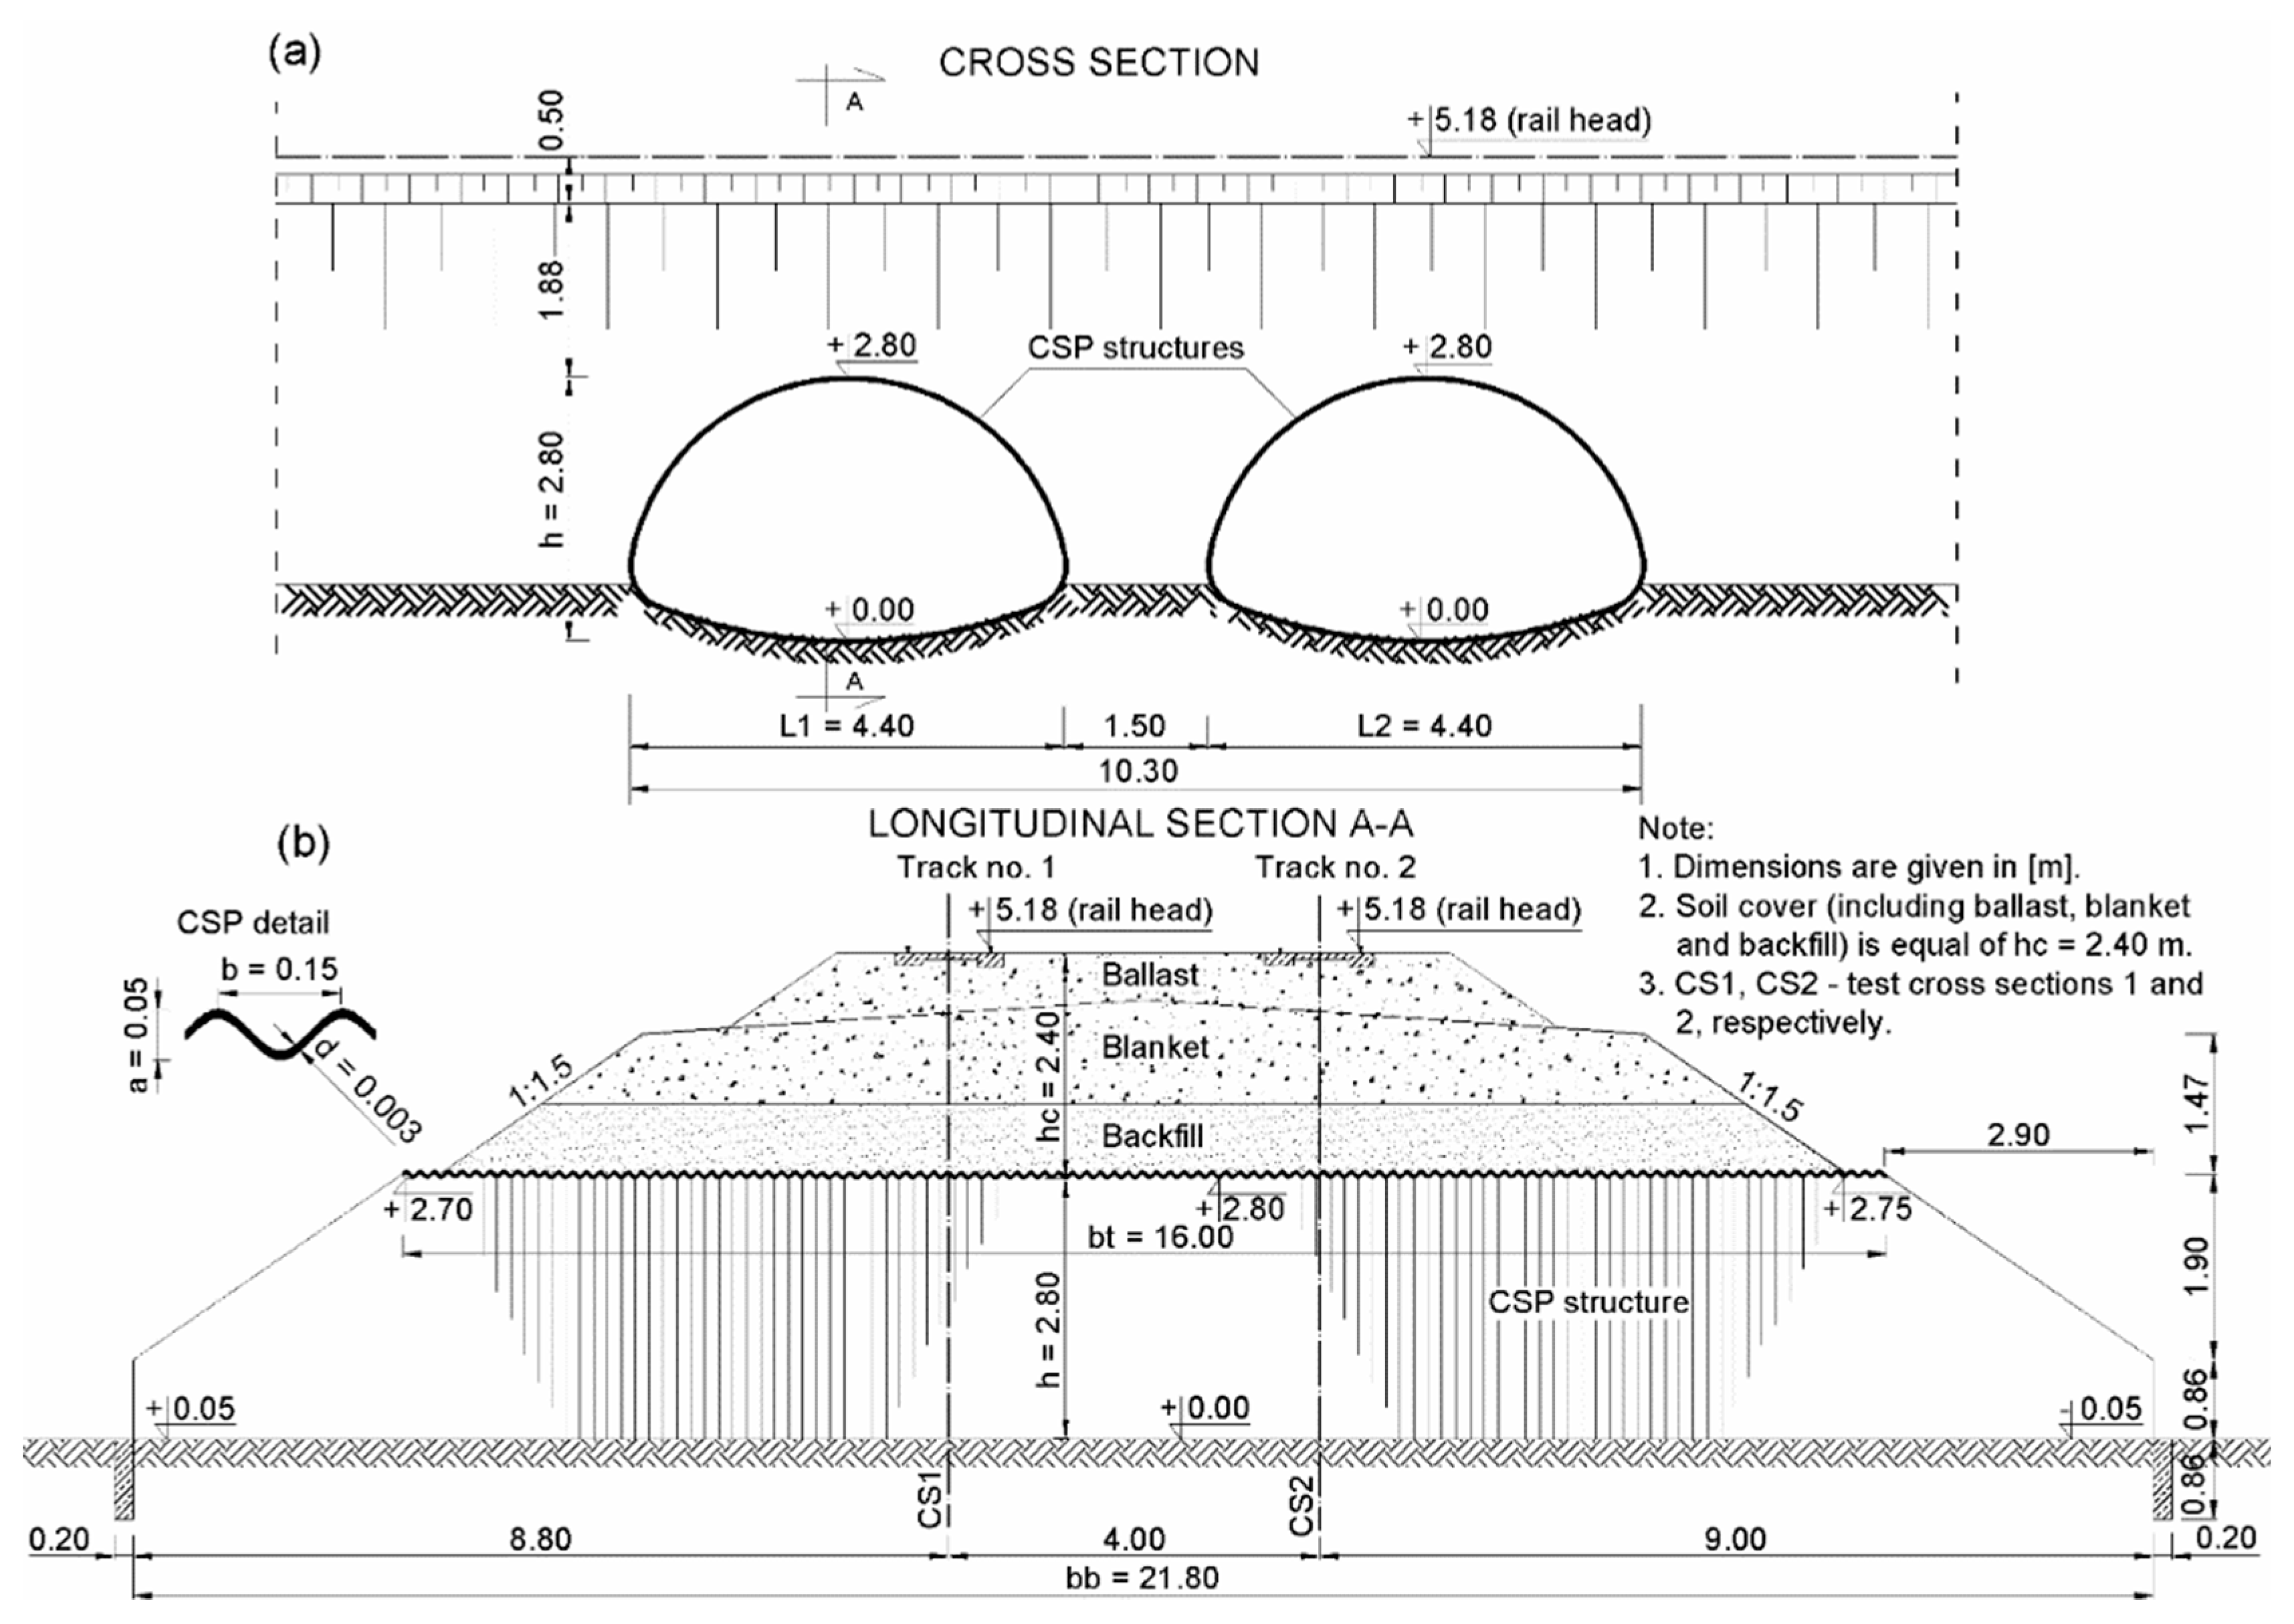
The influence of the use of EPS on a soil–steel bridge in Krosnowice, Poland subjected to seismic (El Centro) and anthropogenic (rockbursts coming from a coal mine) excitations was analyzed. This bridge consists of two identical spans of corrugated steel plate (CSP). These spans have a cross-sectional pipe-arch shape with lengths L1 = L2 = 4.40 m (Figure 2). The thickness of the steel plates is 0.003 m. The pitch and depth of corrugation are 0.15 m and 0.05 m, respectively. The height of the soil cover above the CSP shell is 2.40 m. The soil–steel bridge is 21.80 m long at the support and 16.00 m long at the shell crown.
3. Numerical Modelling of Soil-Steel Bridge
3.1. General Remarks
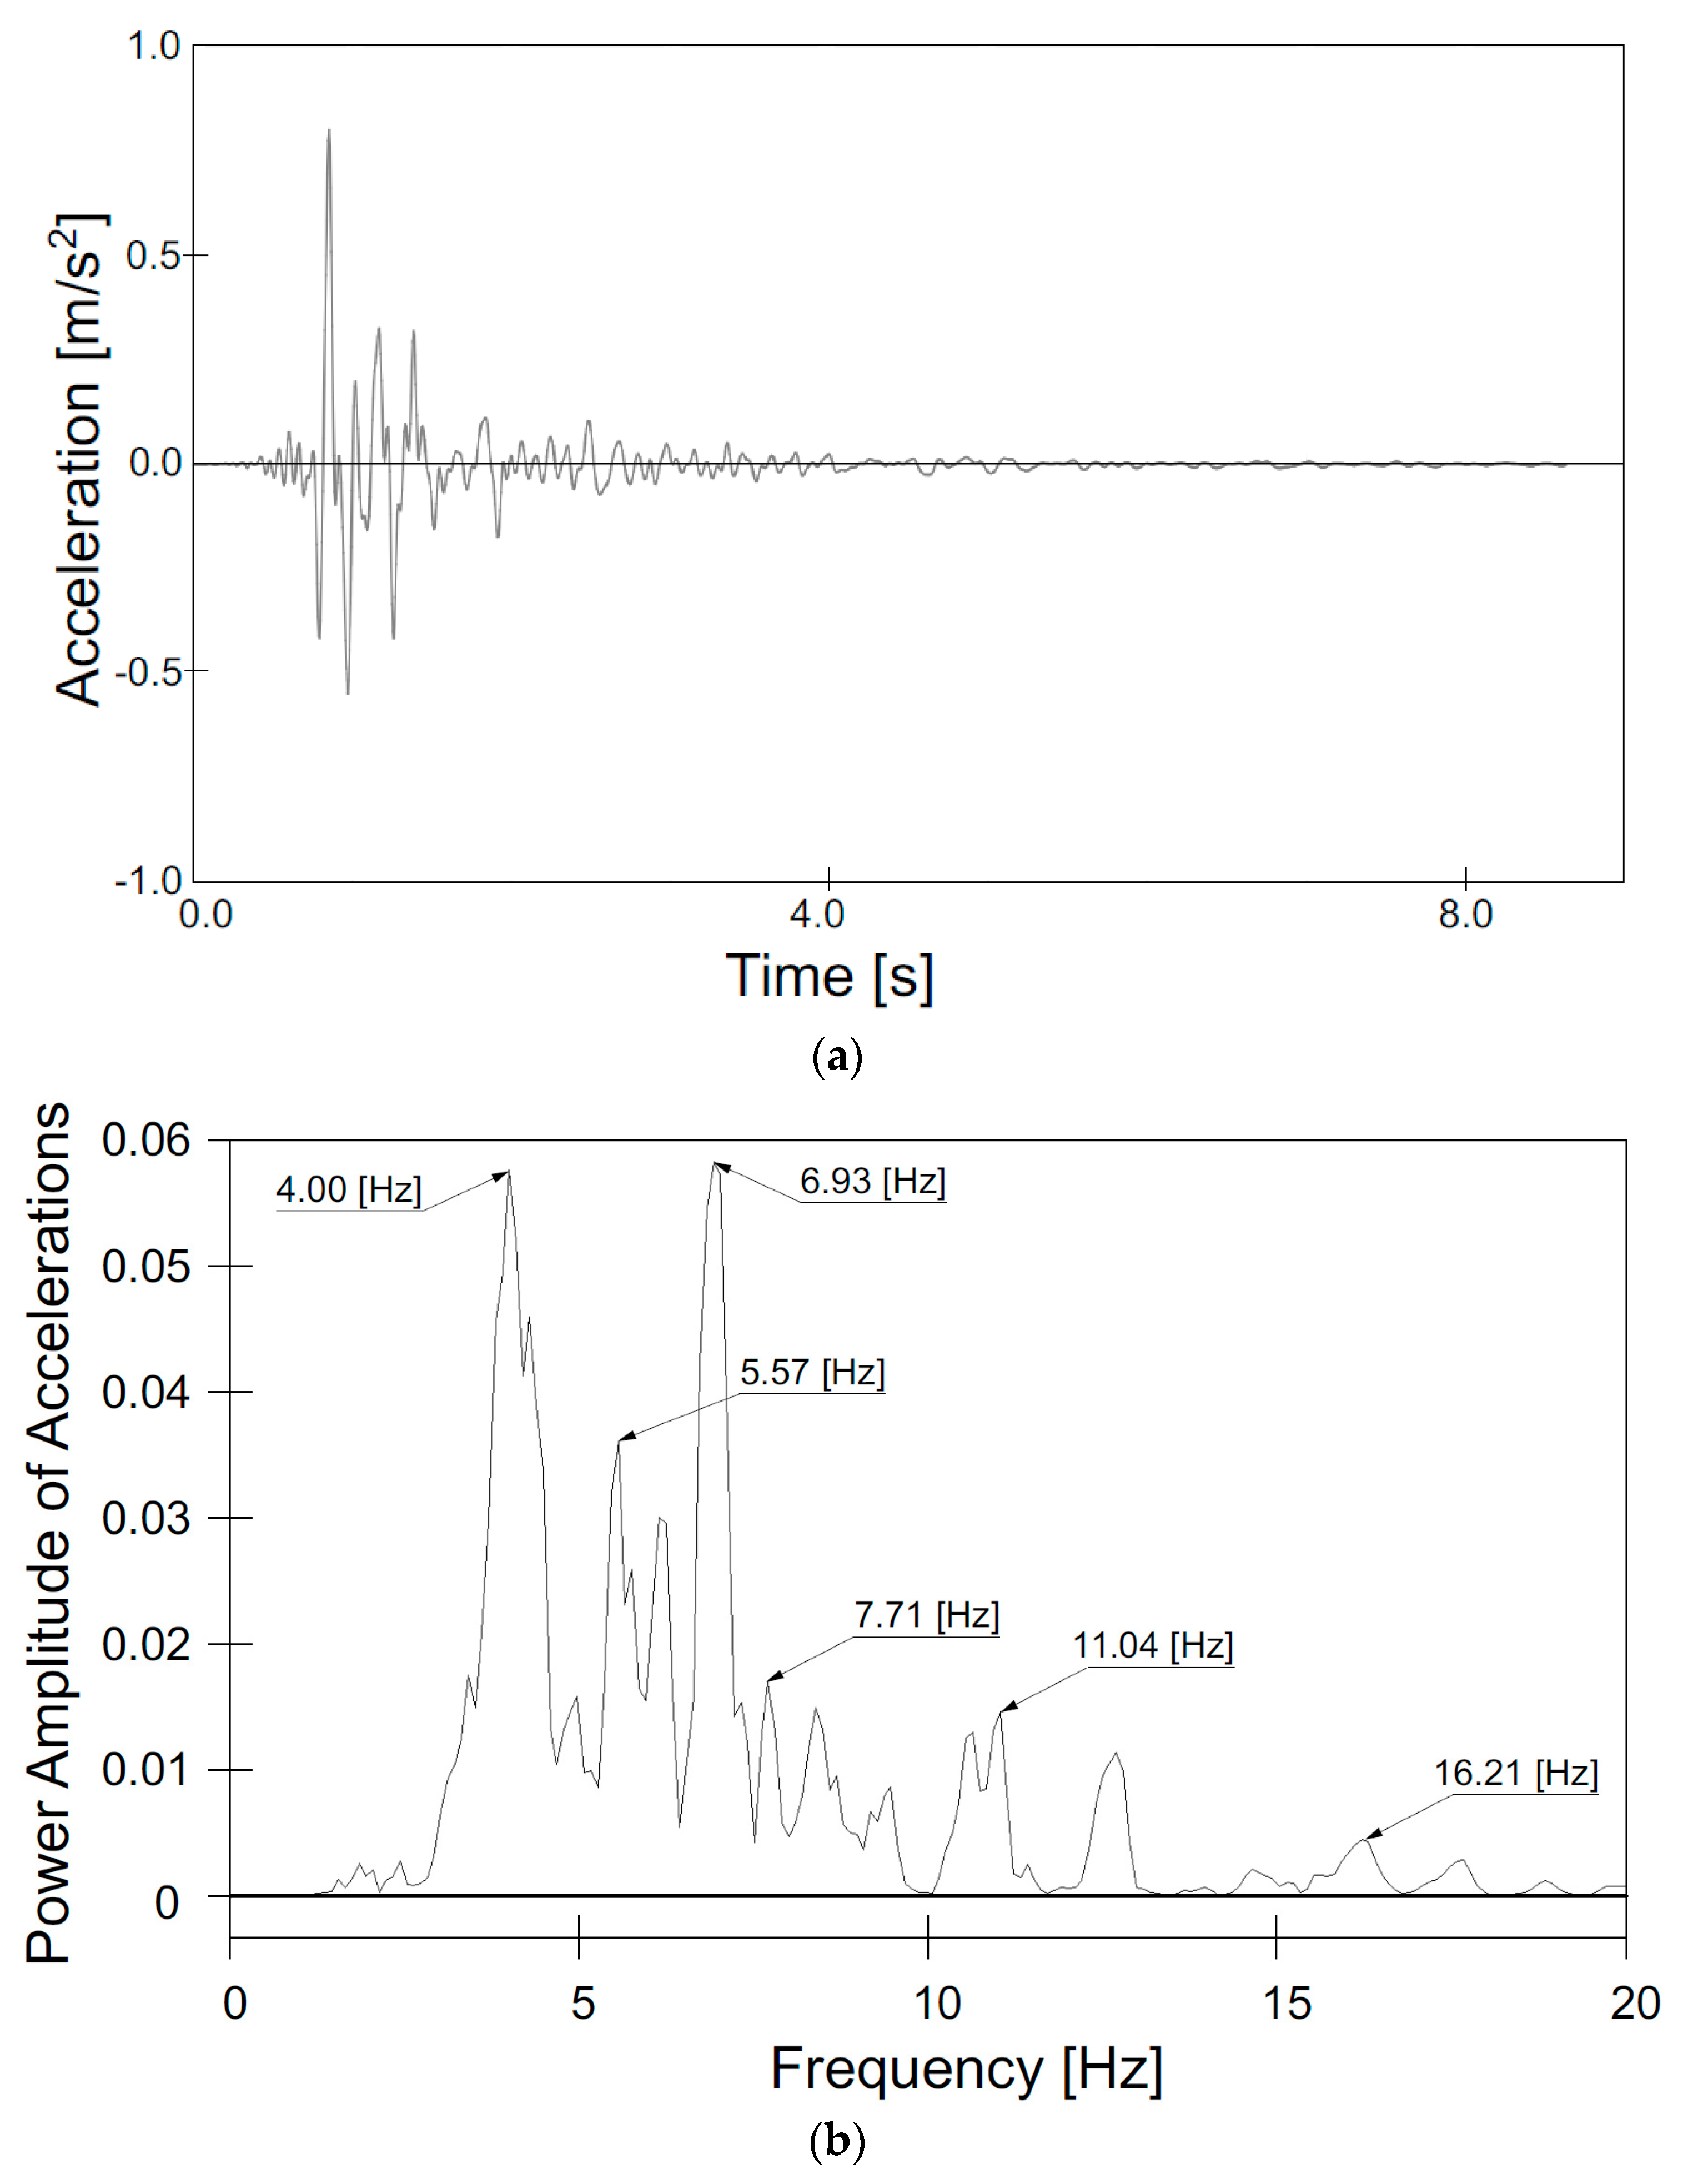
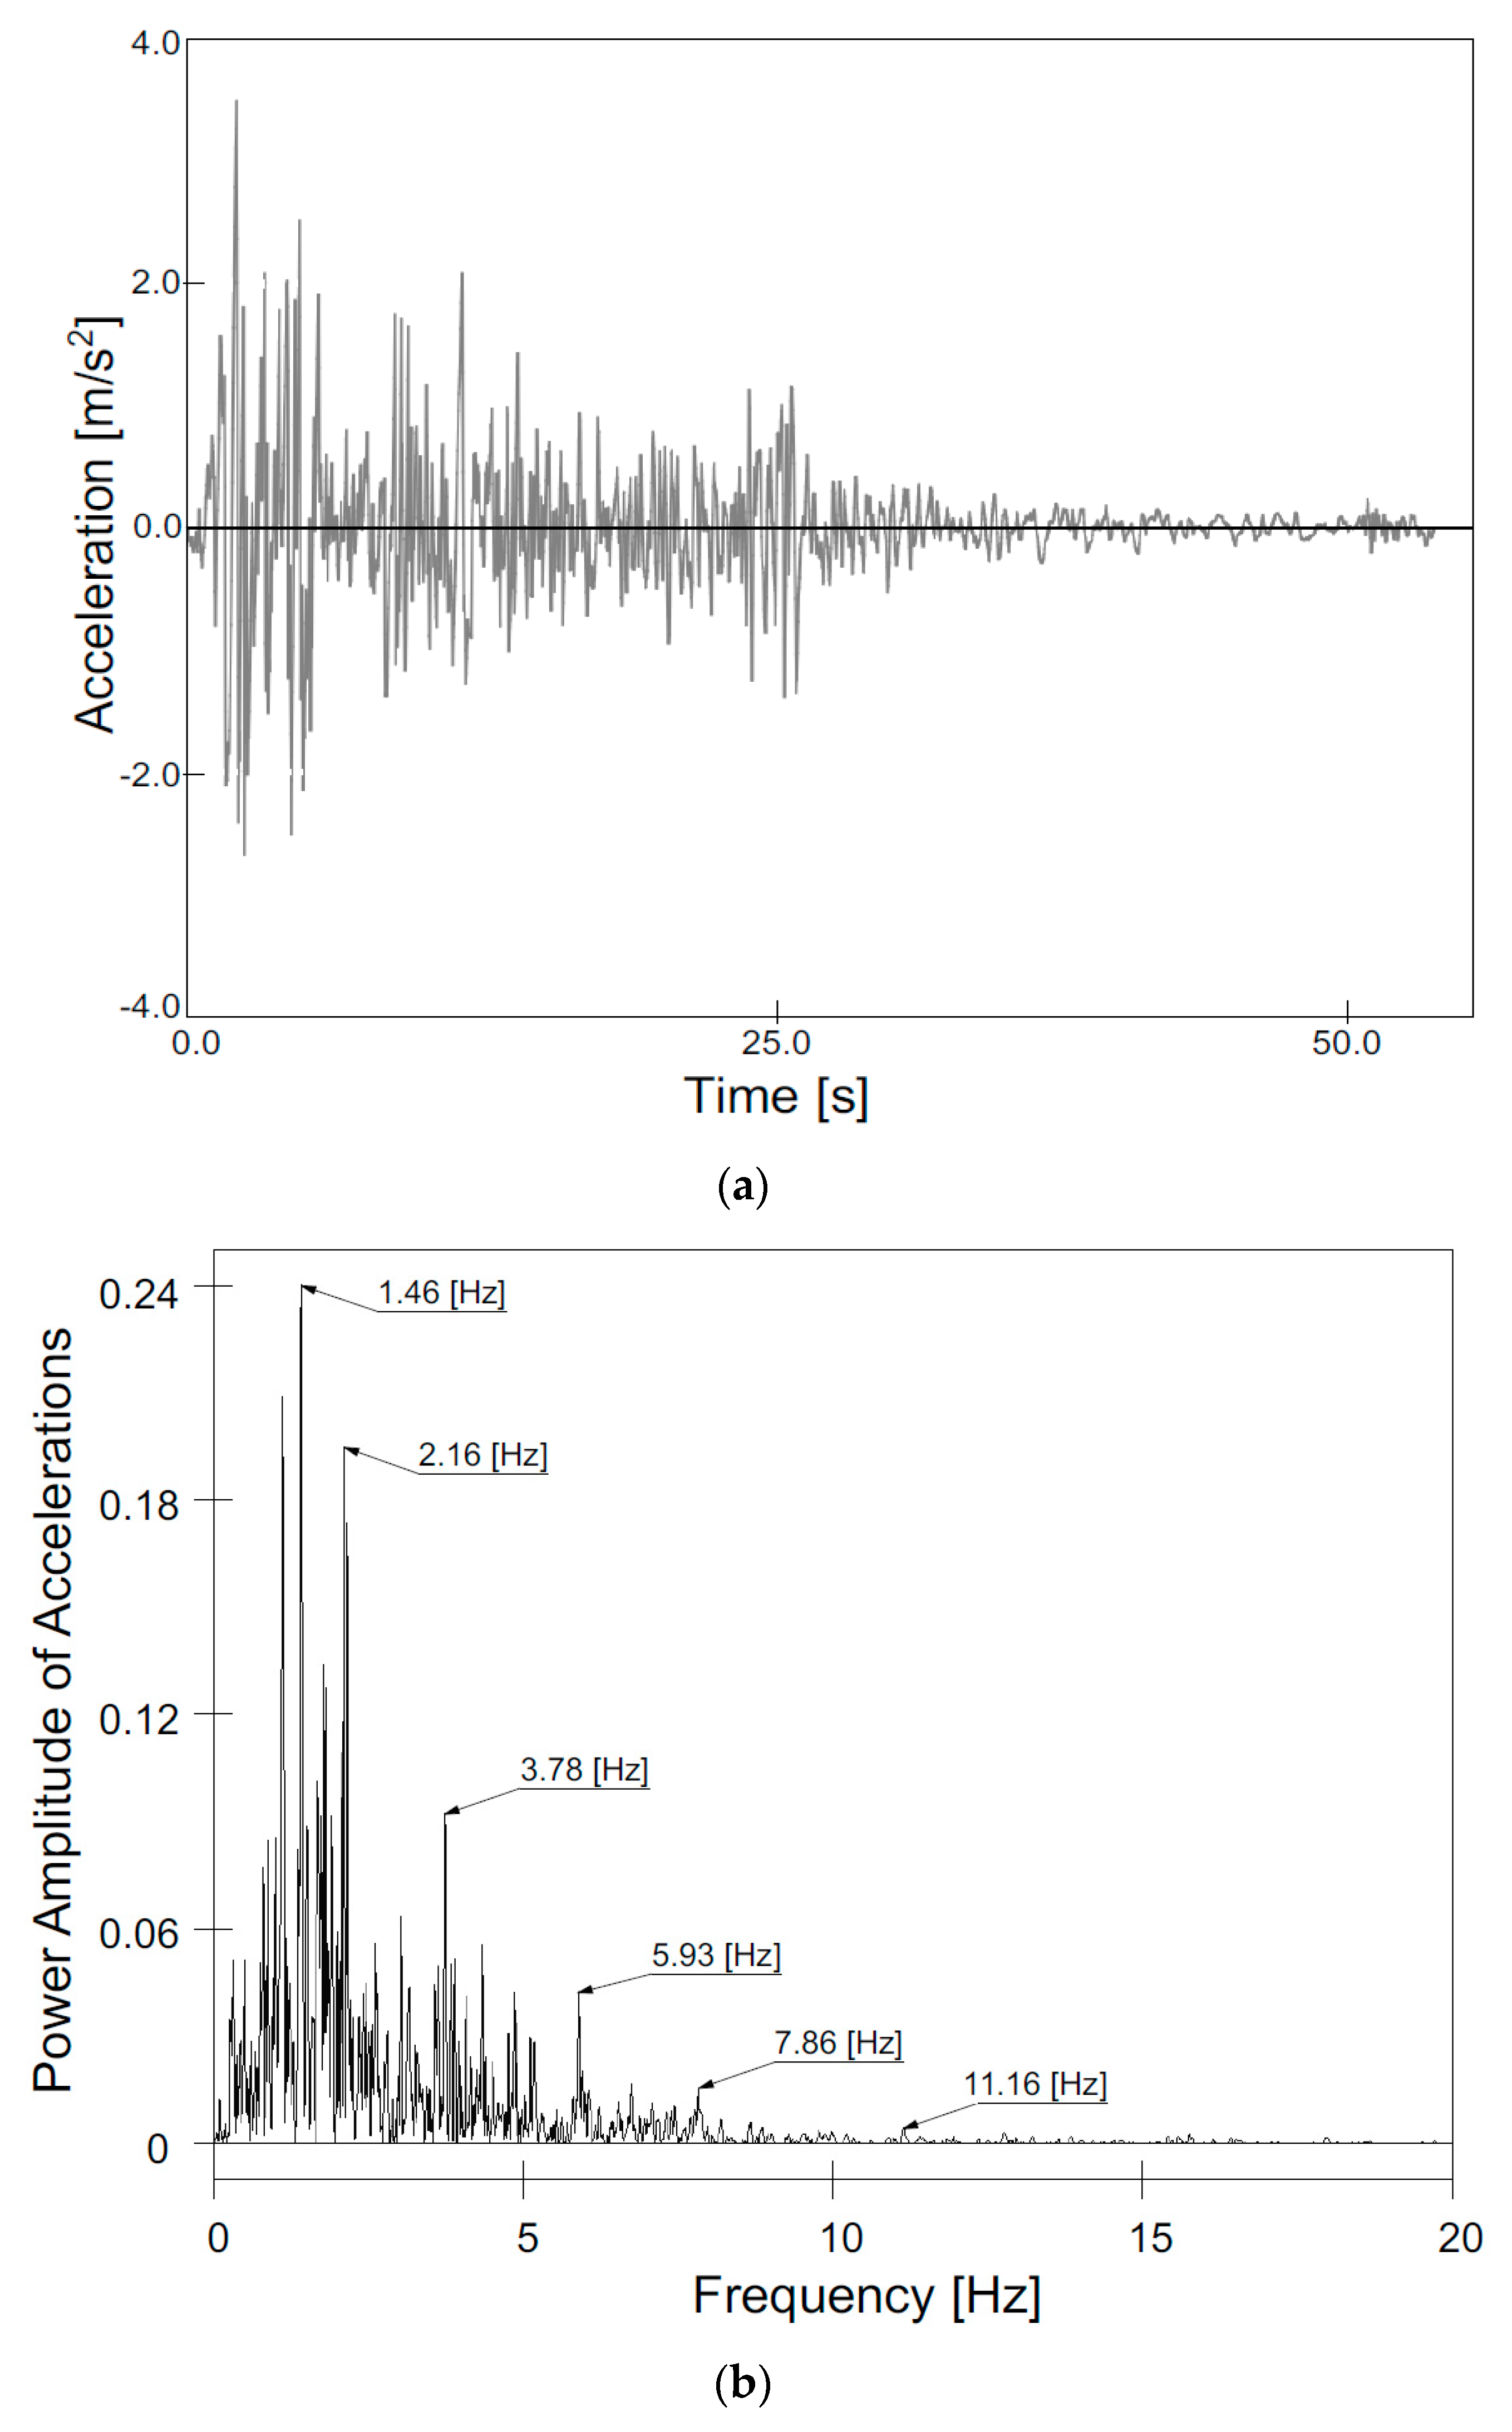
In this paper, the results of finite element (FE) analyses of the behavior of the soil–steel bridge subjected to seismic and anthropogenic excitations will be presented. The rockburst record from 12 December 2015 of the Upper Silesian Coal Basin was used (Figure 3). Additionally, the obtained results from the anthropogenic excitation (rockburst) were compared to the results obtained using the record of the El Centro earthquake from 18 May 1940 (Figure 4). The El Centro benchmark record was chosen for its wide spectral content and easy comparison with other results mentioned in the literature. Nevertheless, the best course would be to prepare a Monte Carlo response analysis with 100 Time History response analyses properly processed according to selected site properties. However, it is not the main purpose of the paper. In addition, a more rigorous analysis would require an approach presented, for example, by Bommer and Acevedo [23] and Iervolino and Cornell [24].
In order to obtain the response of the bridge under these seismic excitations, the Time History method was used. This method analyzes the structure according to some given time steps (step–by–step). For the selected rockburst and El Centro excitations, the time steps were set at 0.005 and 0.02 s, respectively. According to Eurocode 8 [23], in the dynamic analysis one must use sufficiently many modes of natural vibrations such that the modal mass is 90% of the total mass of the analyzed model. In the analysis of the soil–steel bridge, 90% of the modal mass was reached at the 12th mode of natural vibrations. The FE analyses were made in two (XY) and three (XYZ) directions for the rockburst and El Centro excitation, respectively. Although an analysis was also conducted for only two directions (XY) of the El Centro excitation, it is not presented in this paper because the results were significantly smaller than those obtained for three (XYZ) directions.
The seismic excitations in the perpendicular direction (NS = X), the direction parallel to the bridge (Y direction), and the vertical direction (Z) were applied simultaneously. This paper presents the influence of the use of EPS on the behavior of the soil–steel bridge under anthropogenic (a) and earthquake (b) excitations (Figure 3 and Figure 4). Five numerical models were used for the FE analysis. Models Ia and Ib (Figure 5a) include the analysis without the EPS blocks. In models II (a and b) the EPS blocks were located 1.0 m above the CSP shell of the bridge (Figure 5b). In these models, the EPS blocks were extended from both sides of the CSP shell by 3.0 m. In other models, i.e., III (a and b), IV (a and b), and V (a and b), EPS blocks were located 1.0 m, 1.75 m, and 2.5 m below the CSP shell, respectively (Figure 5c–e). In models III, IV, and V, additional EPS blocks were applied on both sides of the shells, at the same distance of 2.0 m (according to the slope of 1:1).
3.2. Numerical Model Description
The DIANA program, based on the finite element method (FEM), was used for the numerical analysis. The bridge was modelled as a 3D object using shell curved elements for the shell structure and solid elements for the soil (backfill) and EPS geofoam. The individual components of the analyzed bridge were as follows:
- The corrugated steel plate was modelled as shell curved elements (Q24IF) with Young modulus of 205 GPa, Poisson ratio of 0.3, elastic–plastic model with density of 7850 kg/m3, the yield strength of the steel 235 MPa, moment of inertia 1176.6 mm4/mm, cross-sectional area 3.77 mm2/mm, and a plate thickness of 0.003 m.
- The backfill was modelled as solid elements (HX24L) with the Duncan-Chang nonlinear elastic hyperbolic model. The backfill parameters were as follows: Young modulus 100 MPa, Poisson ratio 0.2, dilation angle 5°, angle of internal friction 39°, cohesion 3 kPa, failure ratio 0.7, density 2050 kg/m3, unloading-reloading stiffness 1000 N/m2, reference pressure 101,350 N/m2, exponent for unloading-reloading curve 0.25, exponent for backbone curve 1.1, minimum compressive stress 350 N/m2, and minimum tangential stiffness of backbone curve 1200 N/m3. In addition, the backfill was considered as a gravel with compaction of ID = 0.98 according to the Proctor scale and a classification of group I of soil materials according to Canadian Highway Bridge Design Code (CHBDC) [2].
- The EPS geofoam for all considered models was modelled as solid elements (HX24L) with Young modulus 2.8 MPa, Poisson ratio 0.09, density 15 kg/m3, and EPS blocks with a thickness of 0.50 m.
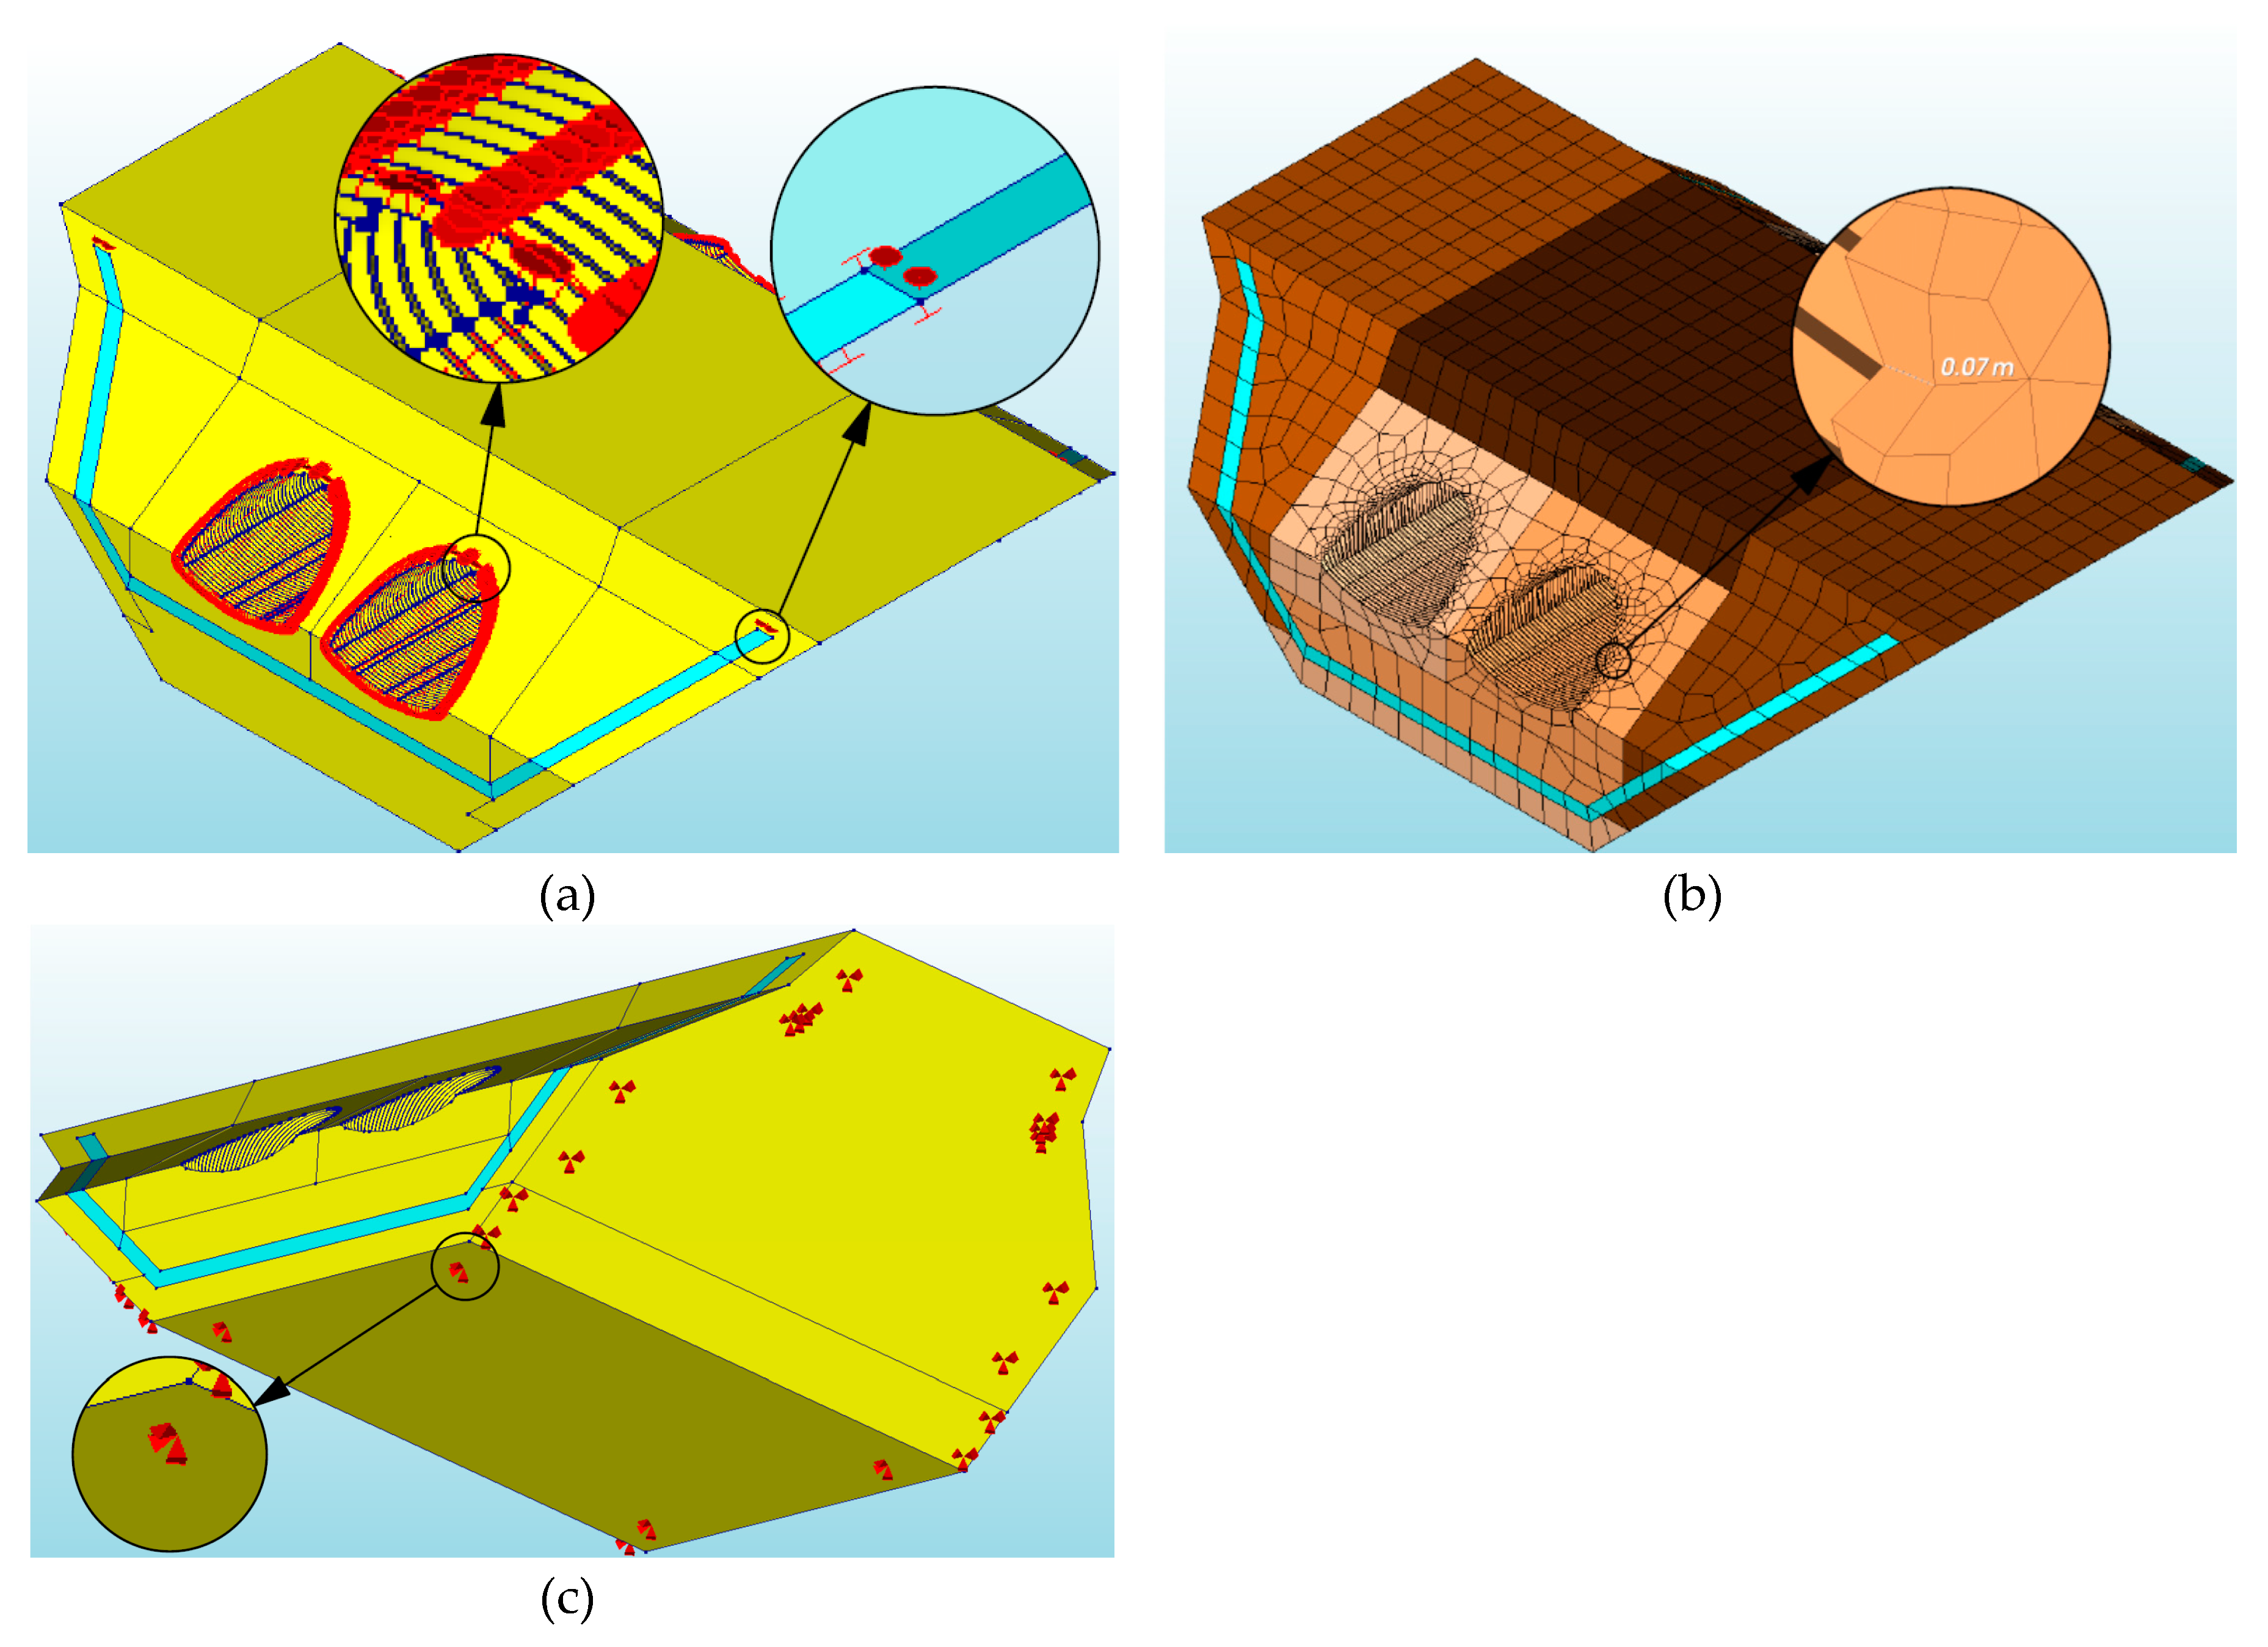
- The connections between the backfill and CSP shell, as well as between the backfill and the EPS geofoam, were modelled as an automatic interface (Figure 6a) by applying the function “Coulomb friction” with an angle of internal friction of 39°, a dilation angle of 5°, a rigidity 100,000 kN/m3, and a cohesion of 3 kPa.
The boundary conditions for all considered models were modelled as hinged supports for the bridge model (backfill) for the X, Y, and Z directions (Figure 6c). A hinge support allows free rotation about the backfill surface or steel shell. Hence, linear displacements were allowed for the horizontal and vertical directions. Therefore, the reaction at the support had two components (vertical and horizontal), i.e., without moments.
The finite elements were automatically divided into maximum dimensions of 1.0 m × 1.0 m for backfill, CSP shell, and EPS geofoam. In the contact zones (interface layer) between the CSP shell, geofoam, and the backfill, the finite element mesh was denser (Figure 6b). In addition, the number of finite elements were 69,324 in model I, 69,397 in model II, 72,061 in model III, 73,030 in model IV, and 71,079 in model V. The numerical models had the following dimensions: (1) width 30.6 m at the top and 12.00 m at the bottom, (2) length 11.27 m at the top and 21.75 m at the bottom, (3) height 9.30 m.
4. Results and Discussion
Both for rockburst and El Centro records, the positive effect of the use of EPS blocks on the obtained values of stresses, axial forces (this, only in the rockburst excitation), bending moments, and accelerations for the CSP shell (Table 1 and Table 2) can be observed.
4.1. Vertical Displacements of the CSP Shell
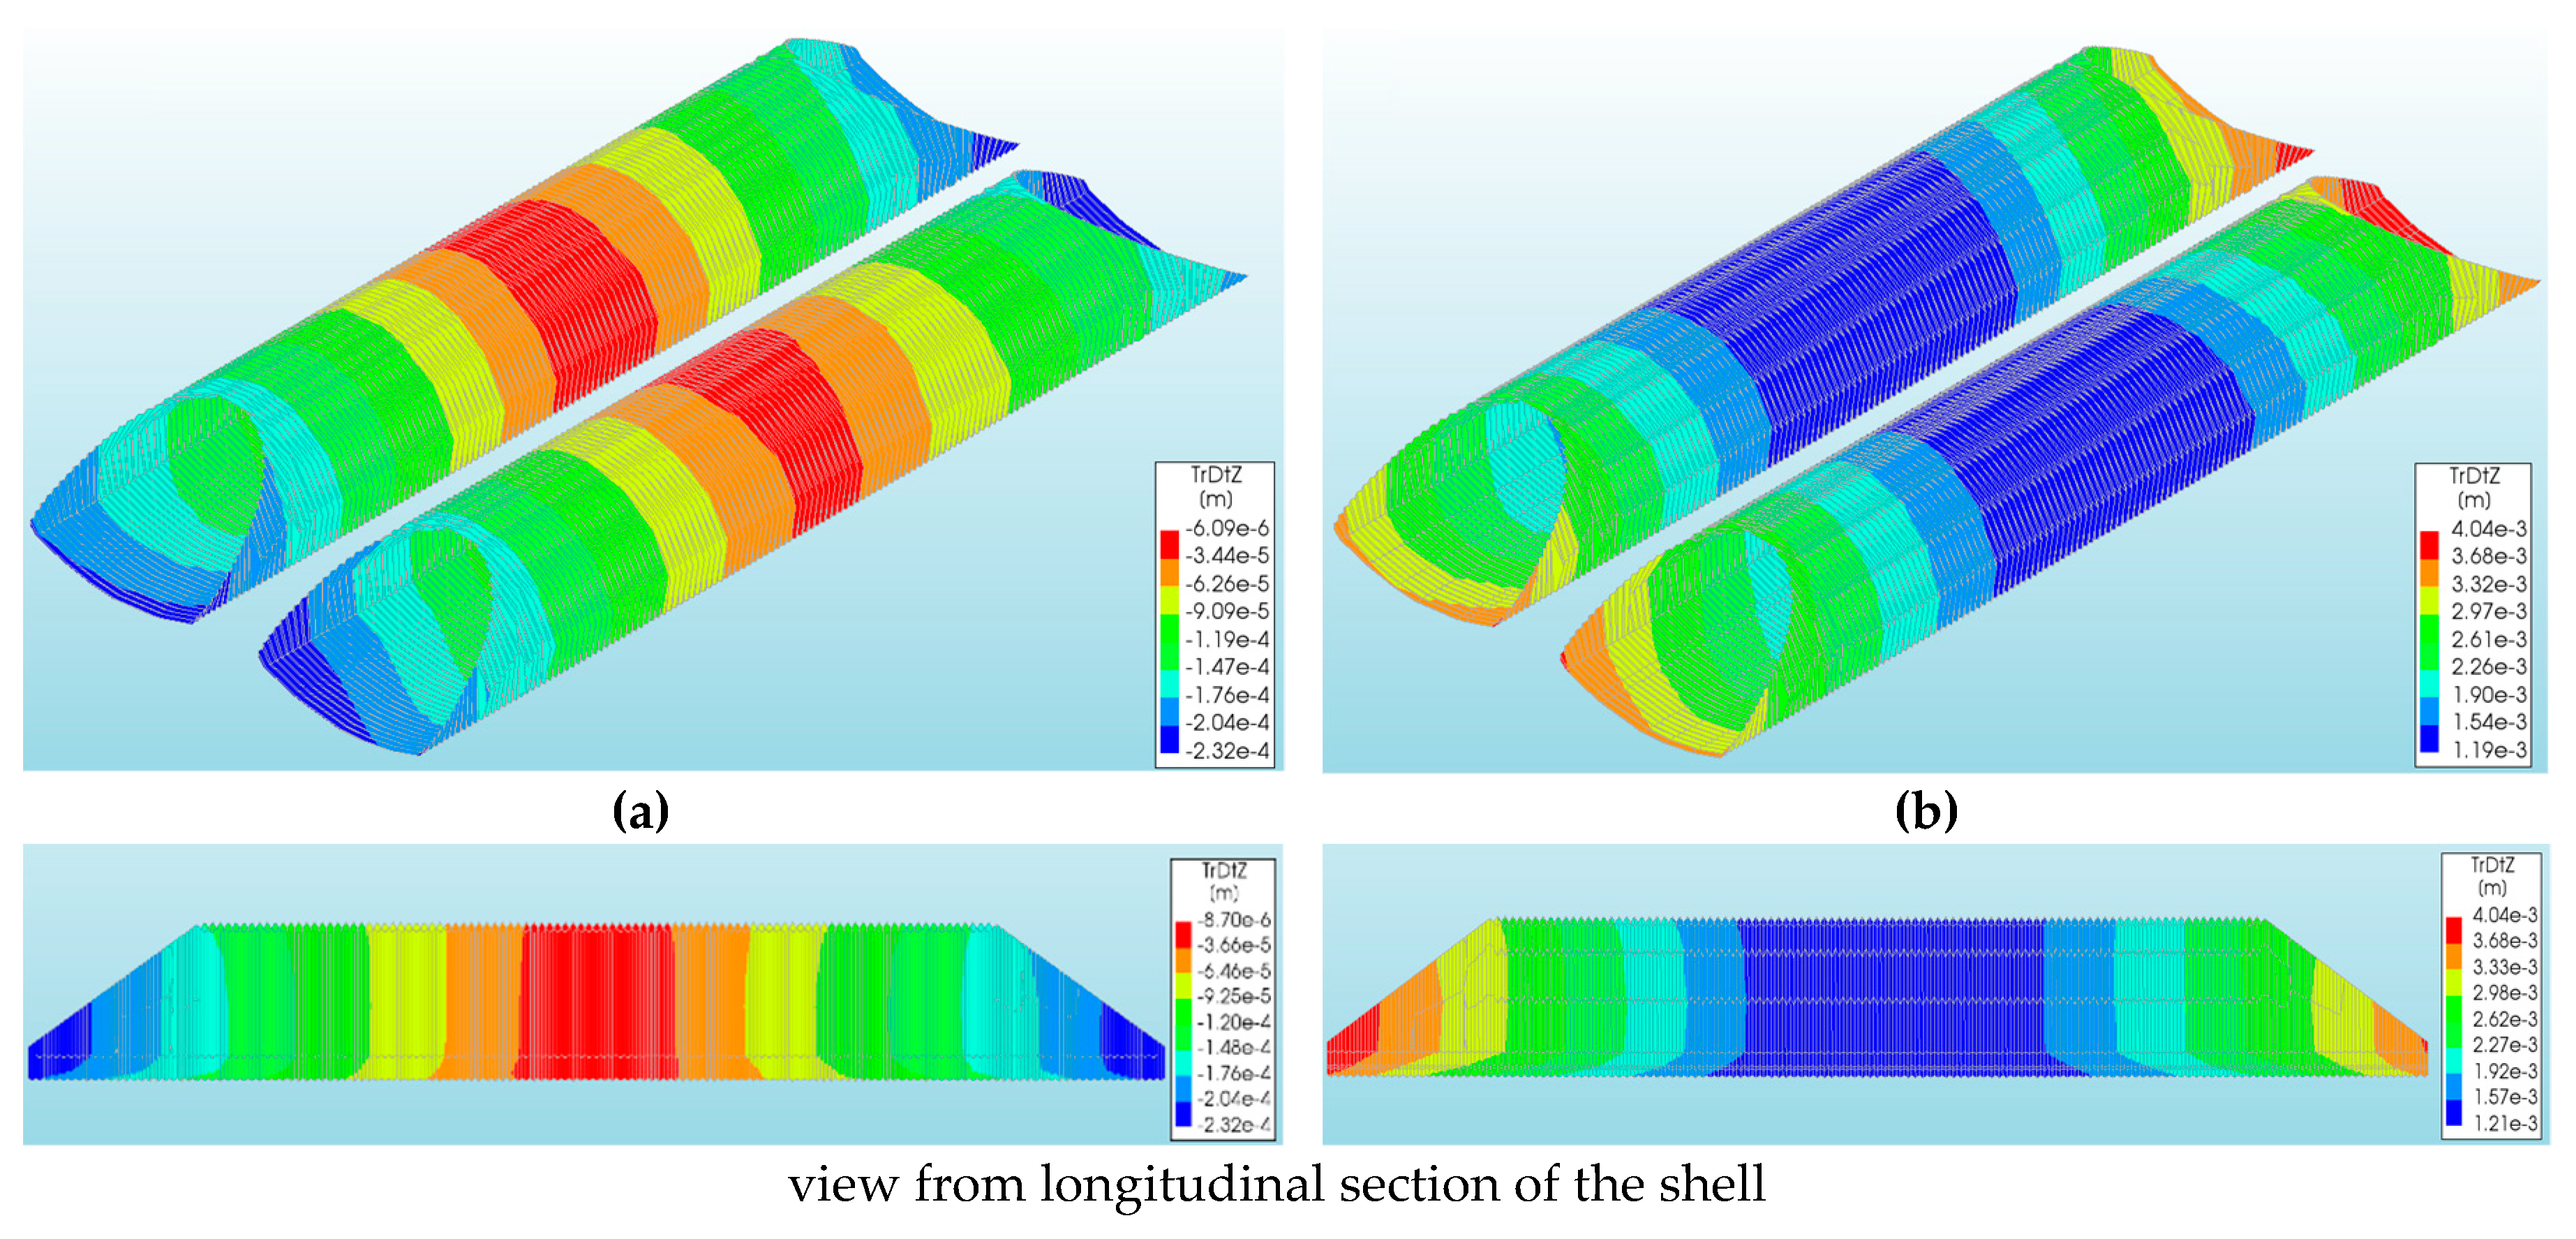
The overall level of vertical displacements caused by a rockburst and the El Centro earthquake was low (Table 1 and Table 2). The largest vertical displacements of the CSP shell were observed in models Vb and Va (Table 1 and Table 2) for the rockburst and El Centro excitations, respectively. They amounted to 4.04 × 10⁻³ m (Figure 7b) and were larger than the vertical displacements from the model Va (rockburst) by about 17 times (−2.32 × 10⁻⁴ m: Figure 7a).
The maximum vertical displacements appeared in the lower parts of the shell, at its ends (inlet and outlet), both for the model subjected to the rockburst and to the El Centro excitation. In other parts of the CSP shell, the vertical displacements were smaller.
The smallest value was obtained for model IIa (−8.95 × 10⁻⁵ m), which was 11 times smaller than the value obtained for the model IIb (−9.89 × 10⁻⁴ m). Comparing individual vertical displacements of the concerned numerical models, it can be noticed that the use of EPS blocks (below the CSP shell foundation) increased the vertical displacements of the steel shell. In the considered cases, using EPS blocks, at a distance of 1.0 m, 1.75 m, and 2.5 m from the foundations, resulted in an increase of vertical displacements by 23%, 26%, and 35% for models IIIa, IVa, and Va, and by 65%, 64%, and 70% for models IIIb, IVb, and Vb, respectively. In addition, only in model II (EPS above the CSP shell) were the maximum vertical displacements smaller than those obtained from the model without EPS (model I). The vertical displacements were smaller by 41% with the rockburst and 20% with the El Centro record.
4.2. Stresses of CSP Shell
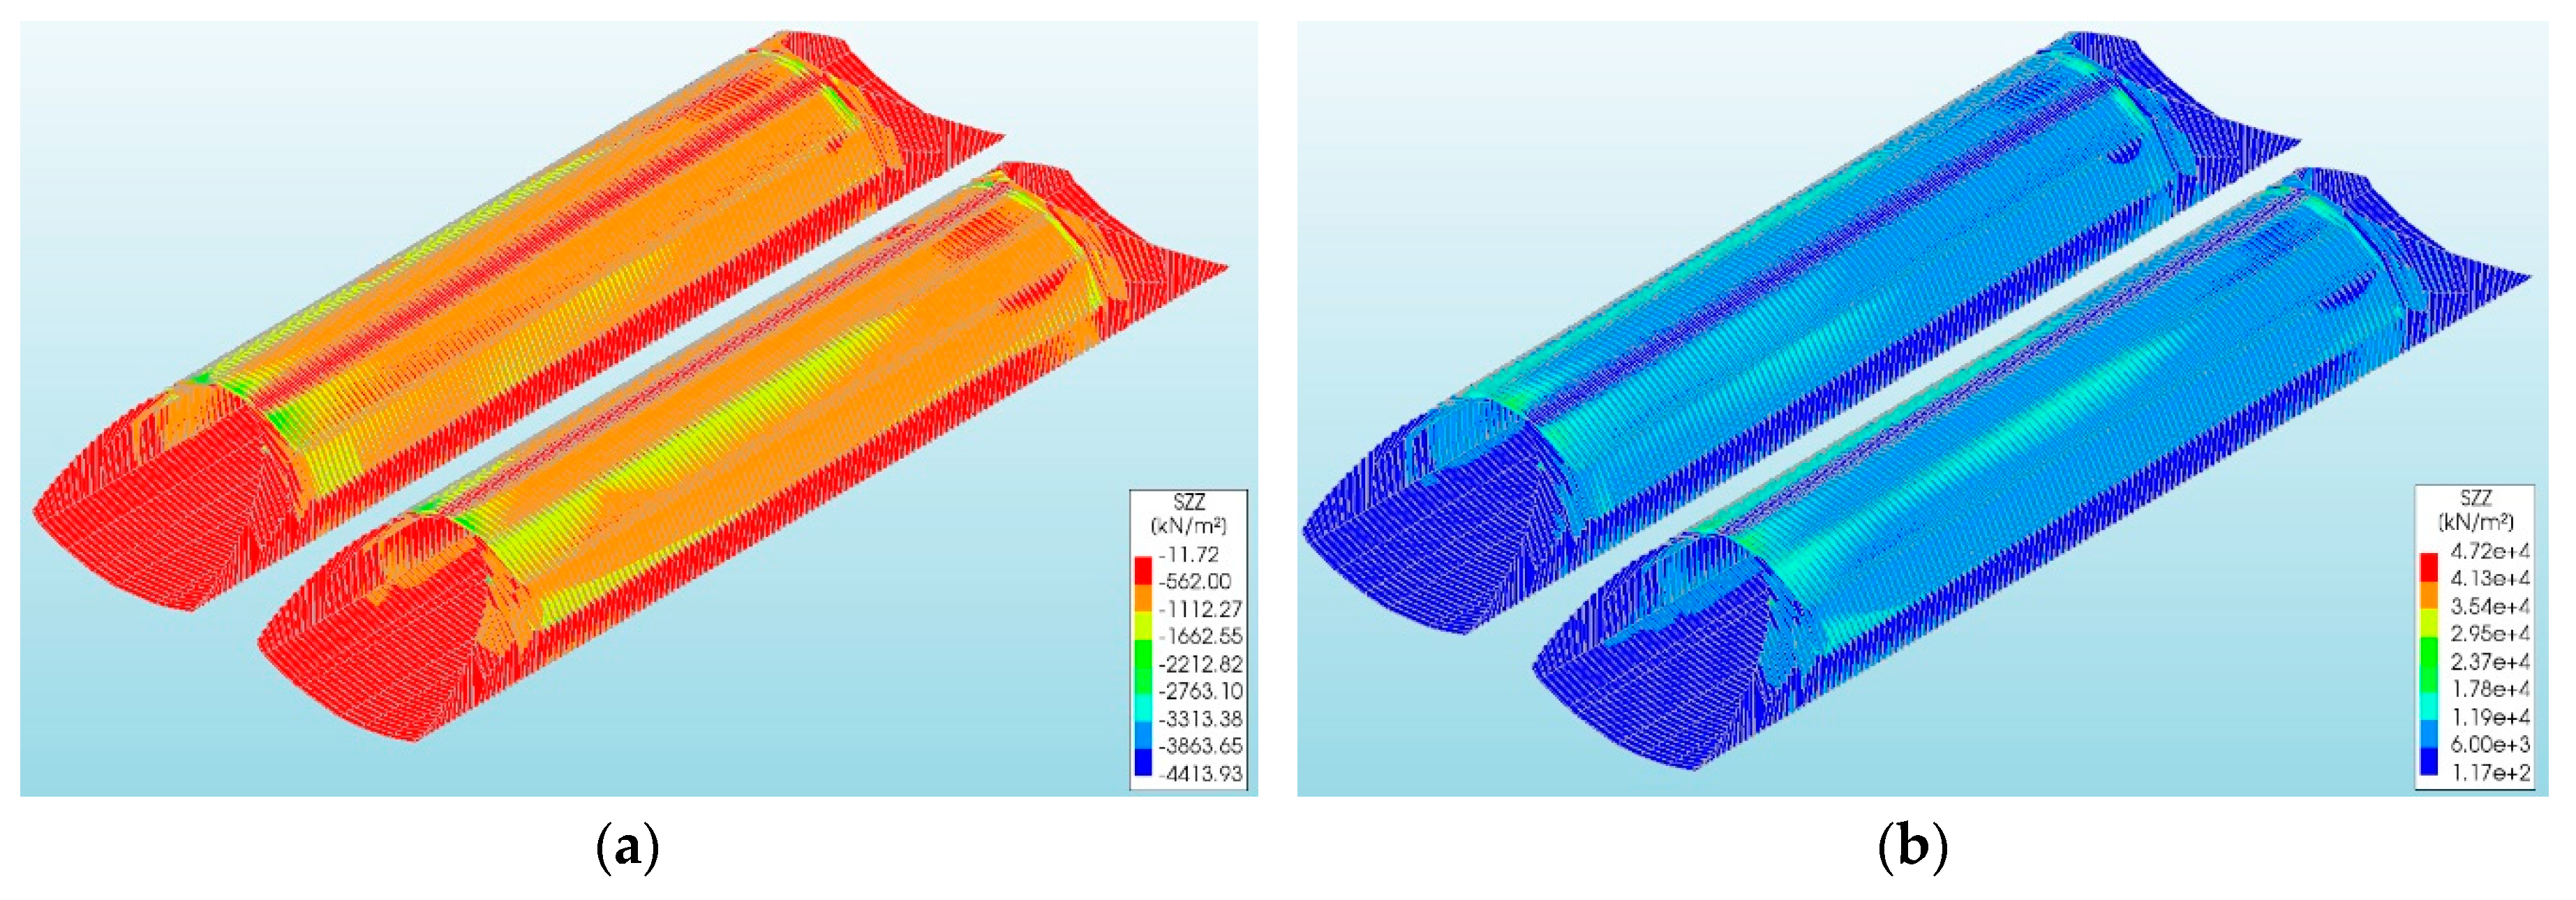
For both types of excitation, the maximum stresses were observed in model I (without EPS). They amounted to 4.62 MPa for model Ia (Table 1 and Figure 8a) and 47.2 MPa for model Ib (Table 2 and Figure 8b). Thus, the stresses in the shell caused by the earthquake (El Centro) were much larger (about 10 times) than those caused by the rockburst. In other models, much lower values were obtained (Table 1 and Table 2). The stresses in the shell, in models IIa (2.95 MPa), IIIa (−2.90 MPa), IVa (−1.80 MPa), and Va (3.22 MPa), were lower than in model Ia by 36%, 37%, 61%, and 30%, respectively. In the case of models IIb (28.1 MPa), IIIb (−39.1 MPa), IVb (−34.7 MPa), and Va (−46.5 MPa) the stresses were lower than in model Ib by 40%, 17%, 26%, and 2%, respectively.
This proves that the EPS had a beneficial effect on the stresses in the bridge shell. It should be emphasized that the character of the stresses, in the case of the rockburst excitation and El Centro record, was almost the same. Tensile stresses were obtained in models Ia, IIa, Va, Ib, and IIb. Compressive values were obtained for models IIIa, IVa, IIb, IVb, and Vb. In both cases, the maximum stresses were observed at the inlet and outlet, in the upper parts of the shell.
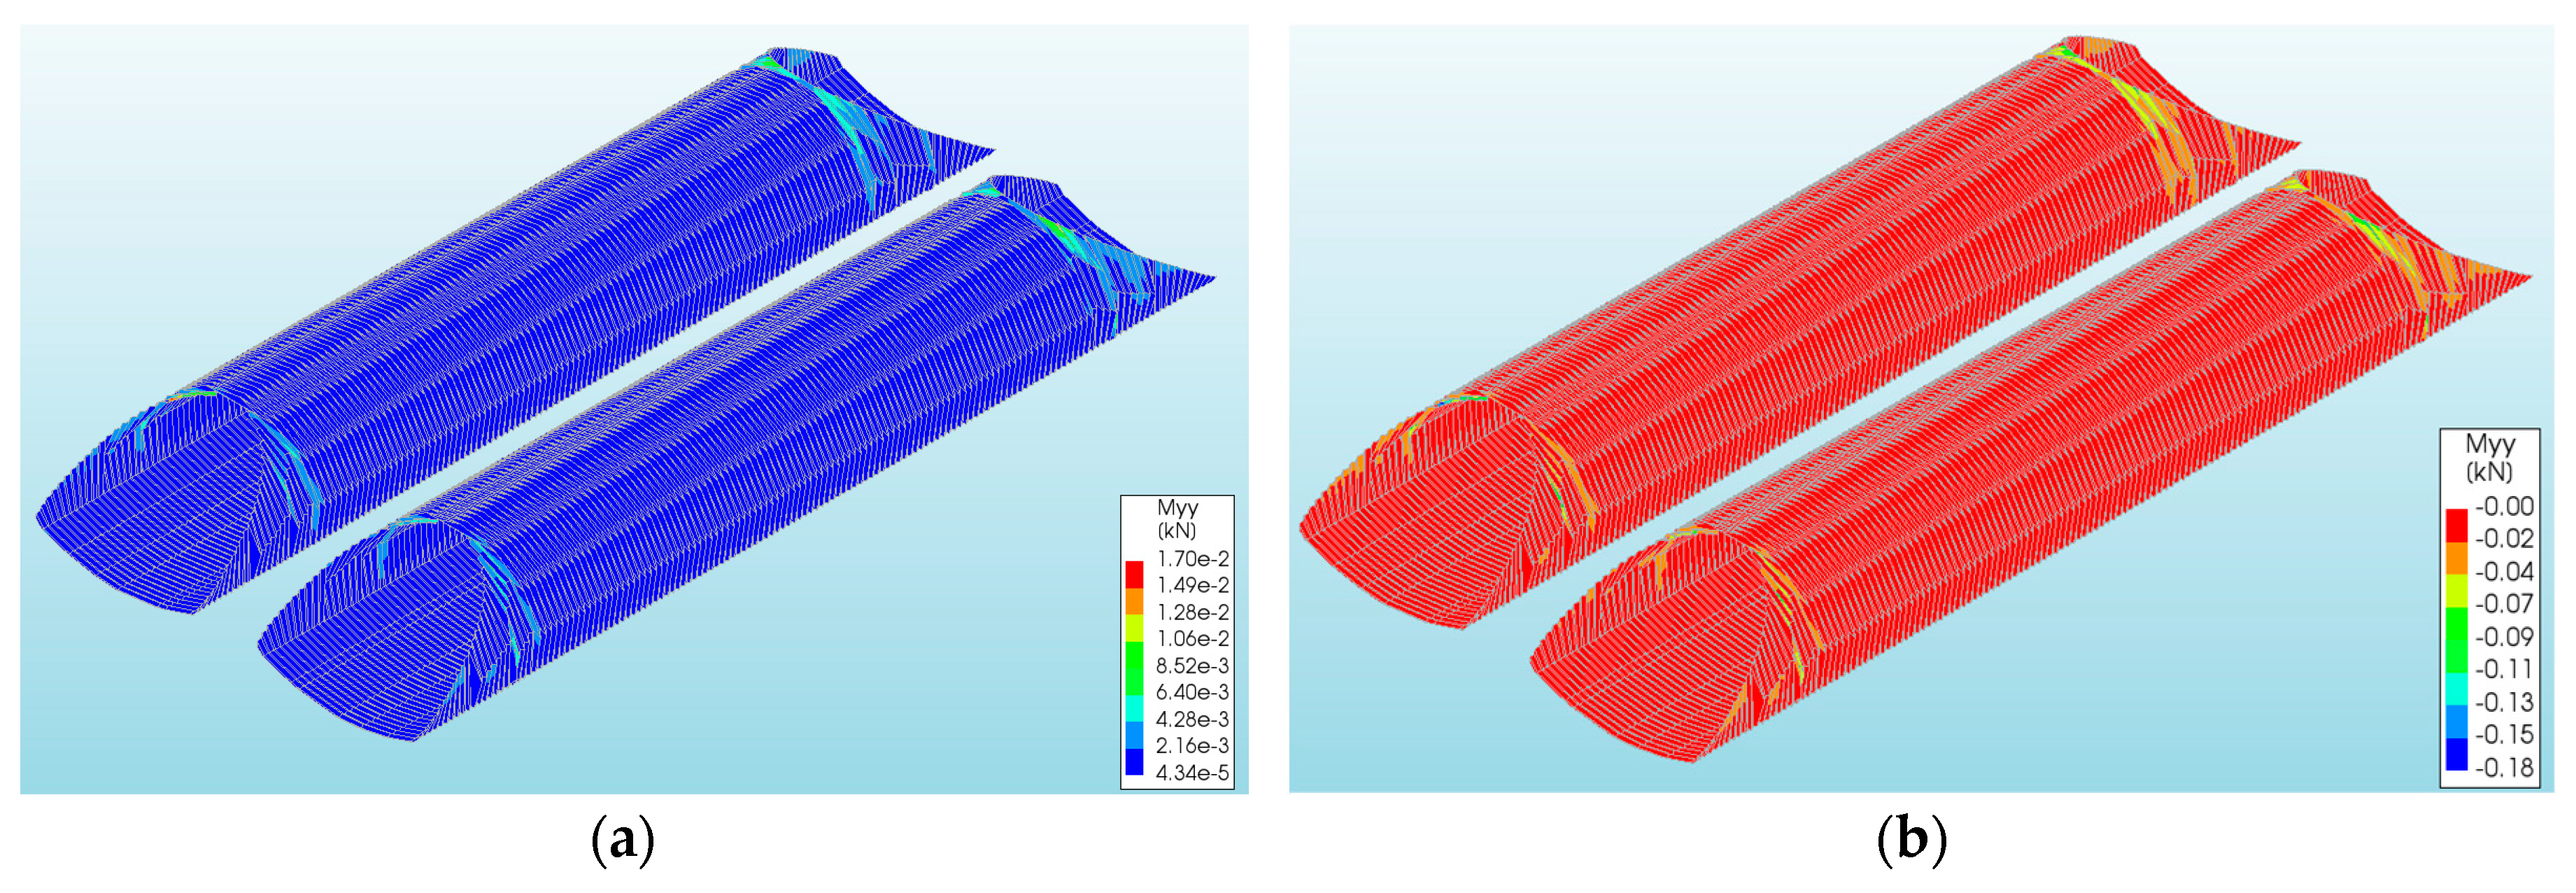
4.3. Bending Moments of CSP Shell
As in the case of the stresses, the greatest bending moments occurred in models Ia and Ib (Table 1 and Table 2). The maximum bending moments were obtained in model Ib (−0.18 kNm/m): They were about 11 times larger than the value obtained for model Ia (1.70 × 10⁻² kNm/m). They occurred at the inlet and outlet of the shell in its upper part. The smallest bending moments were obtained for models IVa and Vb: They amounted to 7.37 × 10⁻³ kNm/m and 8.84 × 10⁻² kNm/m, respectively. This clearly demonstrated the positive impact of the EPS on the reduction of bending moments, a reduction that ranged from 17% to 57% for the rockburst excitation and 22% to 51% for El Centro. In addition, it should be added that the nature of the maximum bending moments for the two load cases (rockburst and El Centro) was different. In the case of El Centro, they were compressive (Figure 9b) for models Ib–IVb. Only in model Vb did the bending moment have the same character as the bending moment in models Ia–Va. The maximum bending moments caused by the rockburst (model Ia) had a tensile character (Figure 9a).
4.4. Axial Forces of CSP Shell
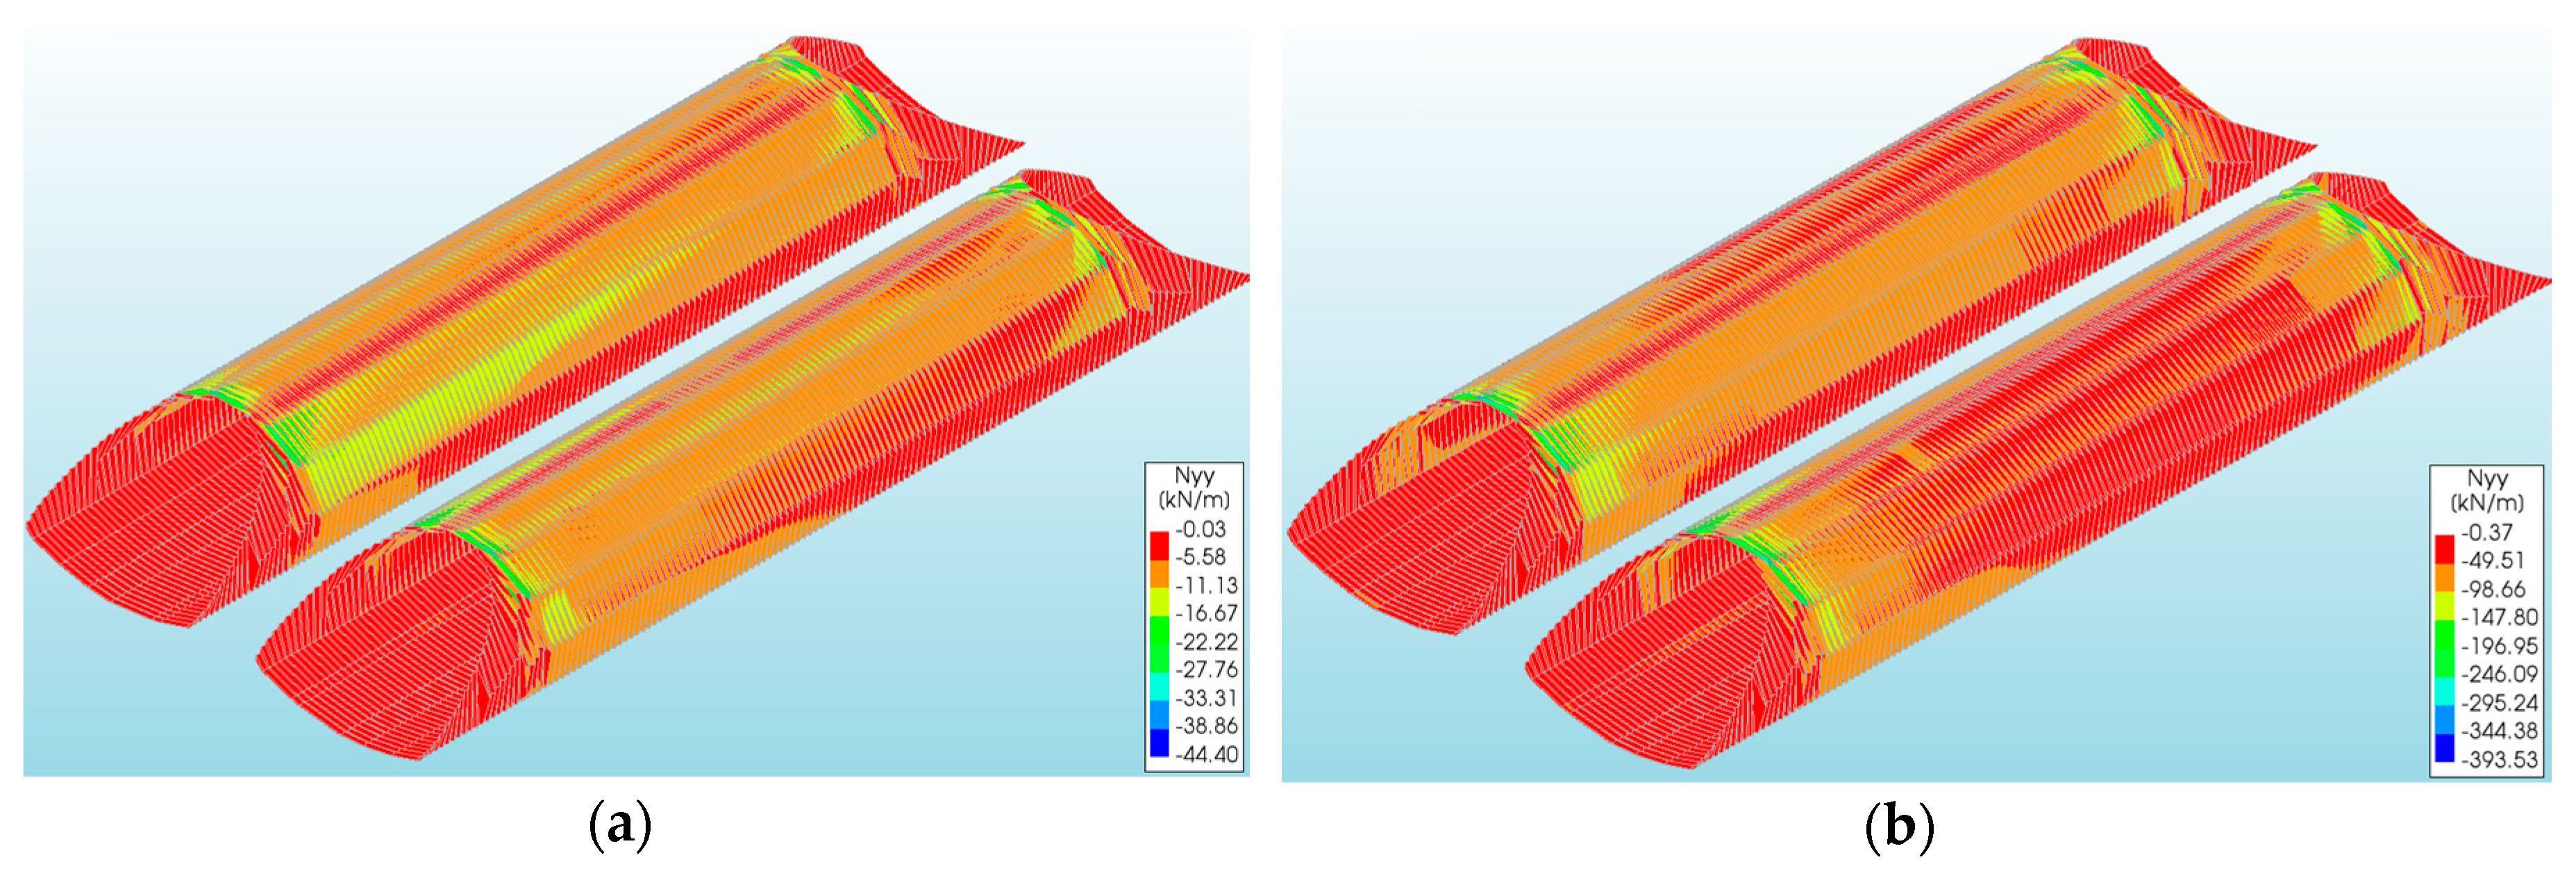
Generally, the rockburst caused a relatively small response of the CSP shell in comparison to the El Centro excitation (Figure 10). Indeed, the maximum value from the rockburst (44.40 kN/m) was about nine times smaller than those obtained from the El Centro earthquake (393.53 kN/m). The first three considered bridge models (Ib, IIb, and IIIb) exposed to the El Centro excitation had almost the same maximum axial forces in the CSP shell (the differences did not exceed a few percent). But significant differences in axial forces can be observed for models IVb and Vb, where a considerable decrease is obtained, by 9% and 38%, respectively, compared to the model Ib (without EPS). This means that the location of the EPS blocks influenced the amount of reduction of the axial forces. When the EPS was situated more deeply, the axial forces decreased. Both in the case of the rockburst and El Centro excitation, the maximum axial forces appeared from the inlet and outlet sides, in the upper parts of the shell (Figure 10). In addition, they had the same character for both the rockburst and El Centro excitations.
4.5. Acceleration of CSP Shell
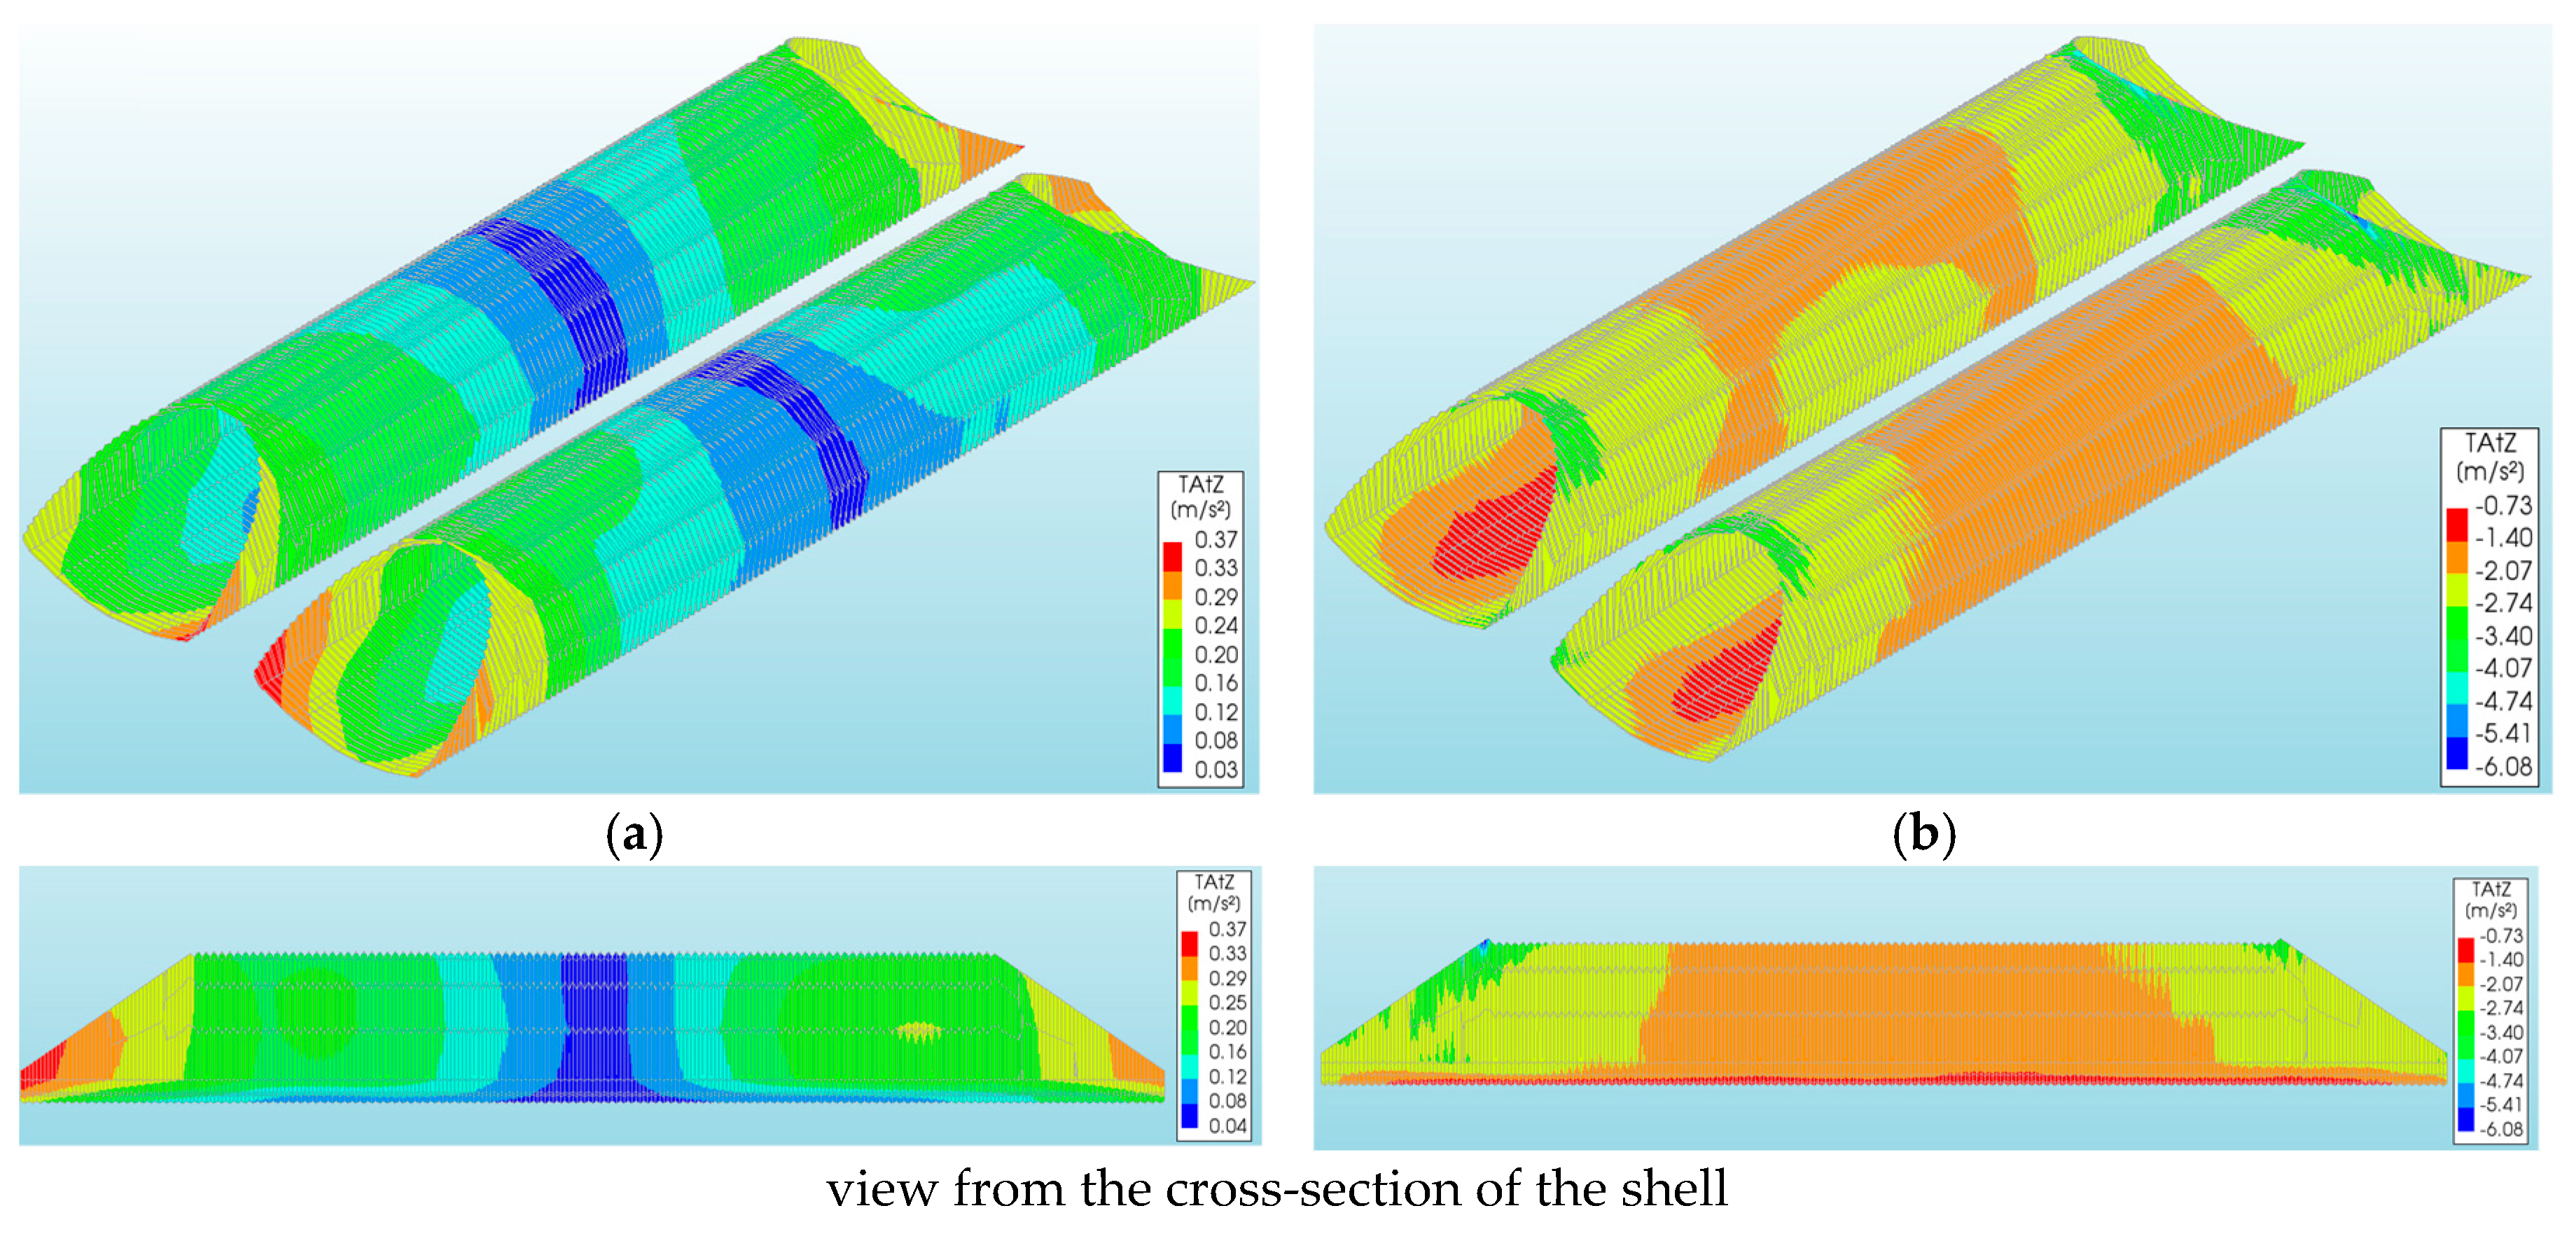
The largest values of the accelerations of the CSP shell caused by the rockburst excitation were obtained in model Ia (Table 1 and Figure 11a). This acceleration was equal to 0.37 m/s2 and was obtained at the inlet and outlet of the bridge, from the side of the neighboring shell (bottom parts of the shell). In the models with EPS blocks (IIa IIIa, IVa, and Va), the lowest values of the shell accelerations were observed (Table 1). They were smaller by 32% (model IIa), 14% (model IIIa), 41% (model IVa), and 49% (model Va) in relation to the model Ia (without EPS). In the case when the FE models were loaded with a higher intensity record (El Centro), the results of the shell accelerations were much higher than in the case of the rockburst. In model Ib, the maximum shell accelerations did not exceed 6.08 m/s2 and were 16 times larger than those obtained from rockbursts (model Ia, 0.37 m/s2). However, in models IIb, IIIb, IVb, and Vb, the shell accelerations were reduced by 45%, 54%, 43%, and 62% in relation to model Ib (without EPS), respectively. It should be noted that the maximum shell accelerations, for the El Centro excitation, occurred from the inlet and outlet sides (model I), in the upper parts of the shell (Figure 11b), that is, at a different location than the shell accelerations for rockburst (Figure 11a).
4.6. Vibration Velocity of the CSP Shell
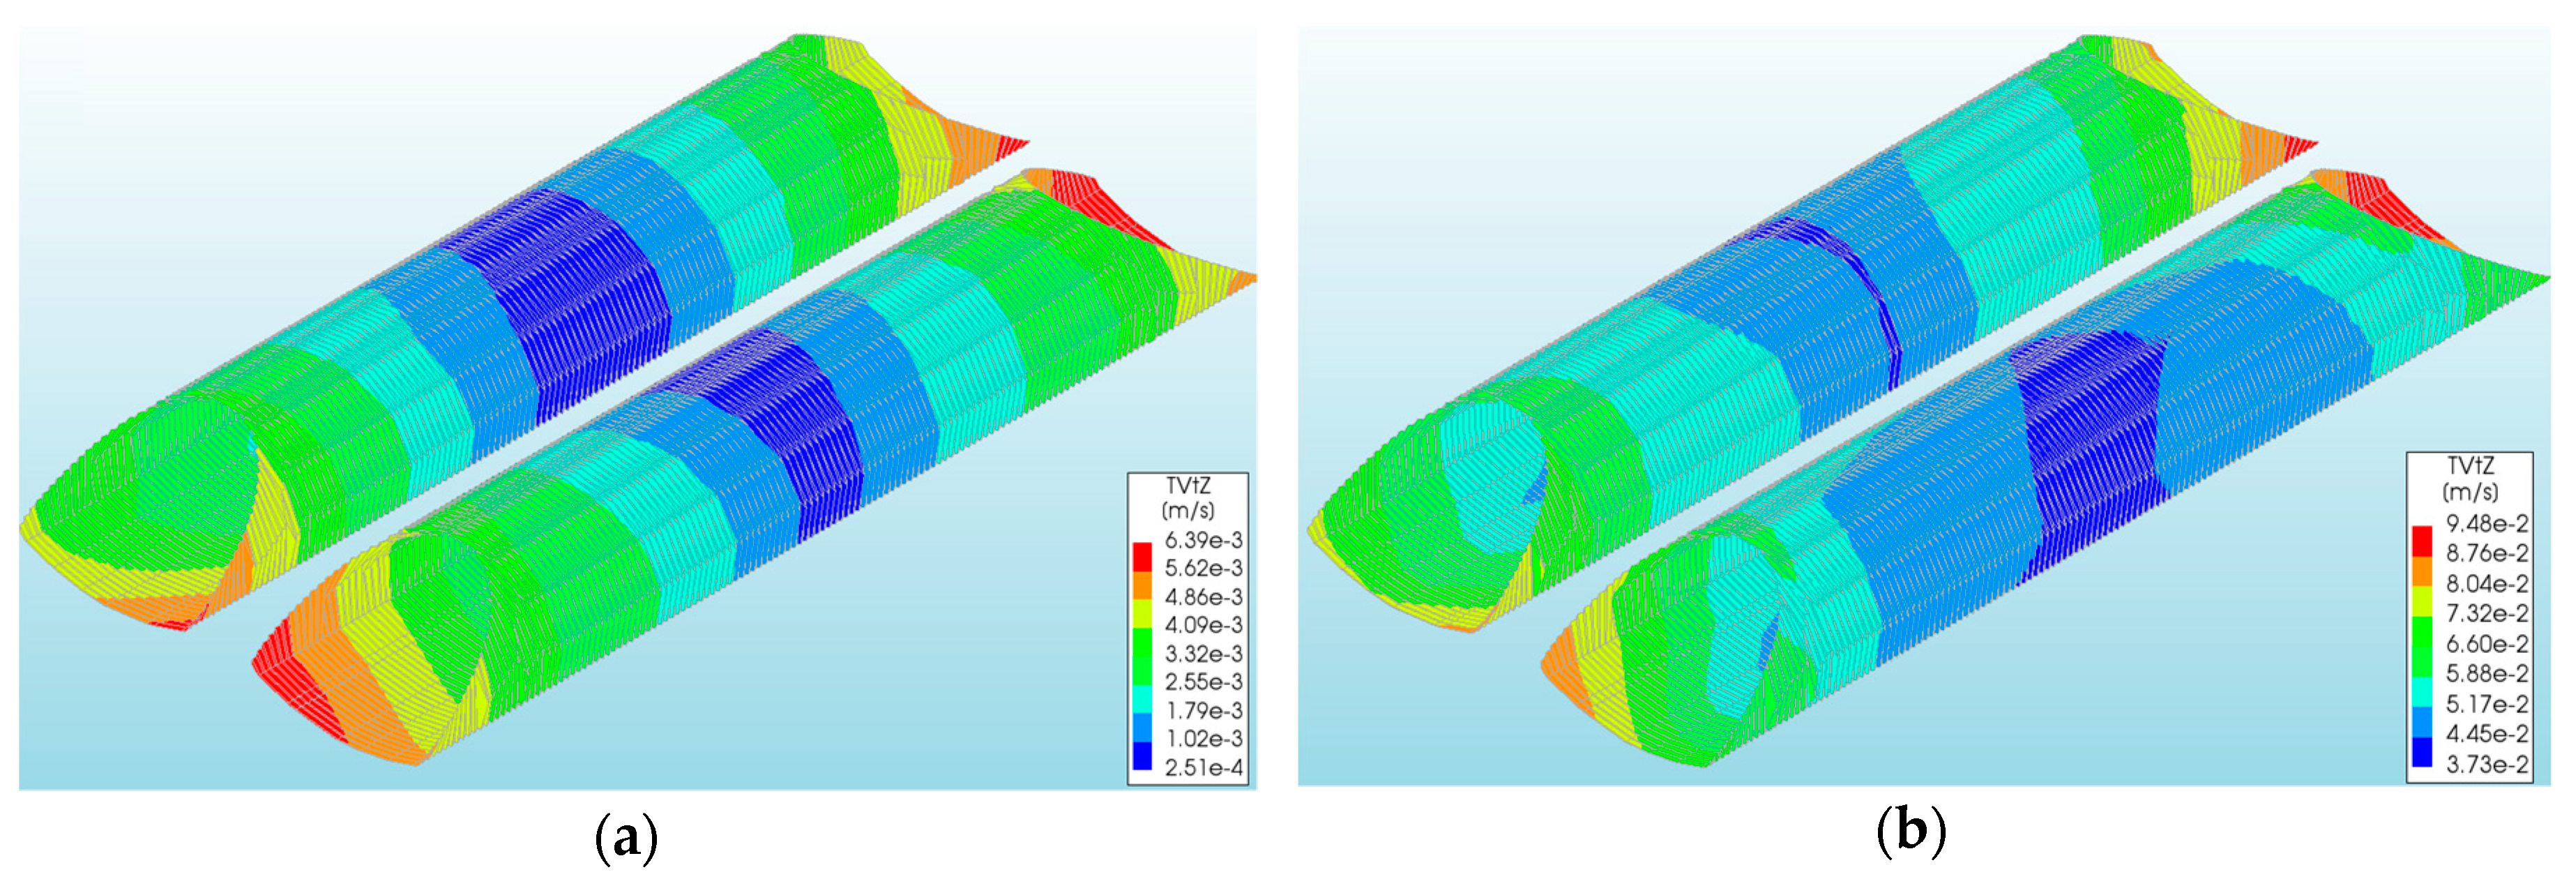
Generally, the vibration velocities of the CSP shell were low (both during the rockburst and El Centro excitation). The maximum values caused by the rockburst were obtained in model Va (Table 1 and Figure 12a) and amounted to 6.39 × 10⁻³ m/s. However, for models Ia, IIa, IIIa, and IVa, the vibration velocities of the CSP shell were smaller by 3%, 30%, 17%, and 21%, respectively. It is worth noting that the maximum vibration velocities were obtained at the ends of the CSP shell, i.e., at the inlet and outlet of the bridge (from the bottom of the shell). However, in the case where the model of the bridge was loaded with El Centro excitation, much larger vibration velocities of the shell were obtained (Table 2). The maximum vibration velocities of the CSP shell were observed in model IVb and were equal to 9.48 × 10⁻² m/s (Figure 12b). They were about 15 times larger than in model Va (6.39 × 10⁻³ m/s). In other models (Ib, IIb, IIIb, and Vb), the maximum values were smaller by a factor the range of 2–47% than the vibration velocity in model IVb. In addition, the maximum vibration velocities of the CSP shell (model IVb) were observed at the inlet and outlet of the bridge shell (Figure 12b), as were the maximum vibration velocities in model Va, where the rockburst excitation was used.
4.7. Behavior of Backfill under Seismic Loads
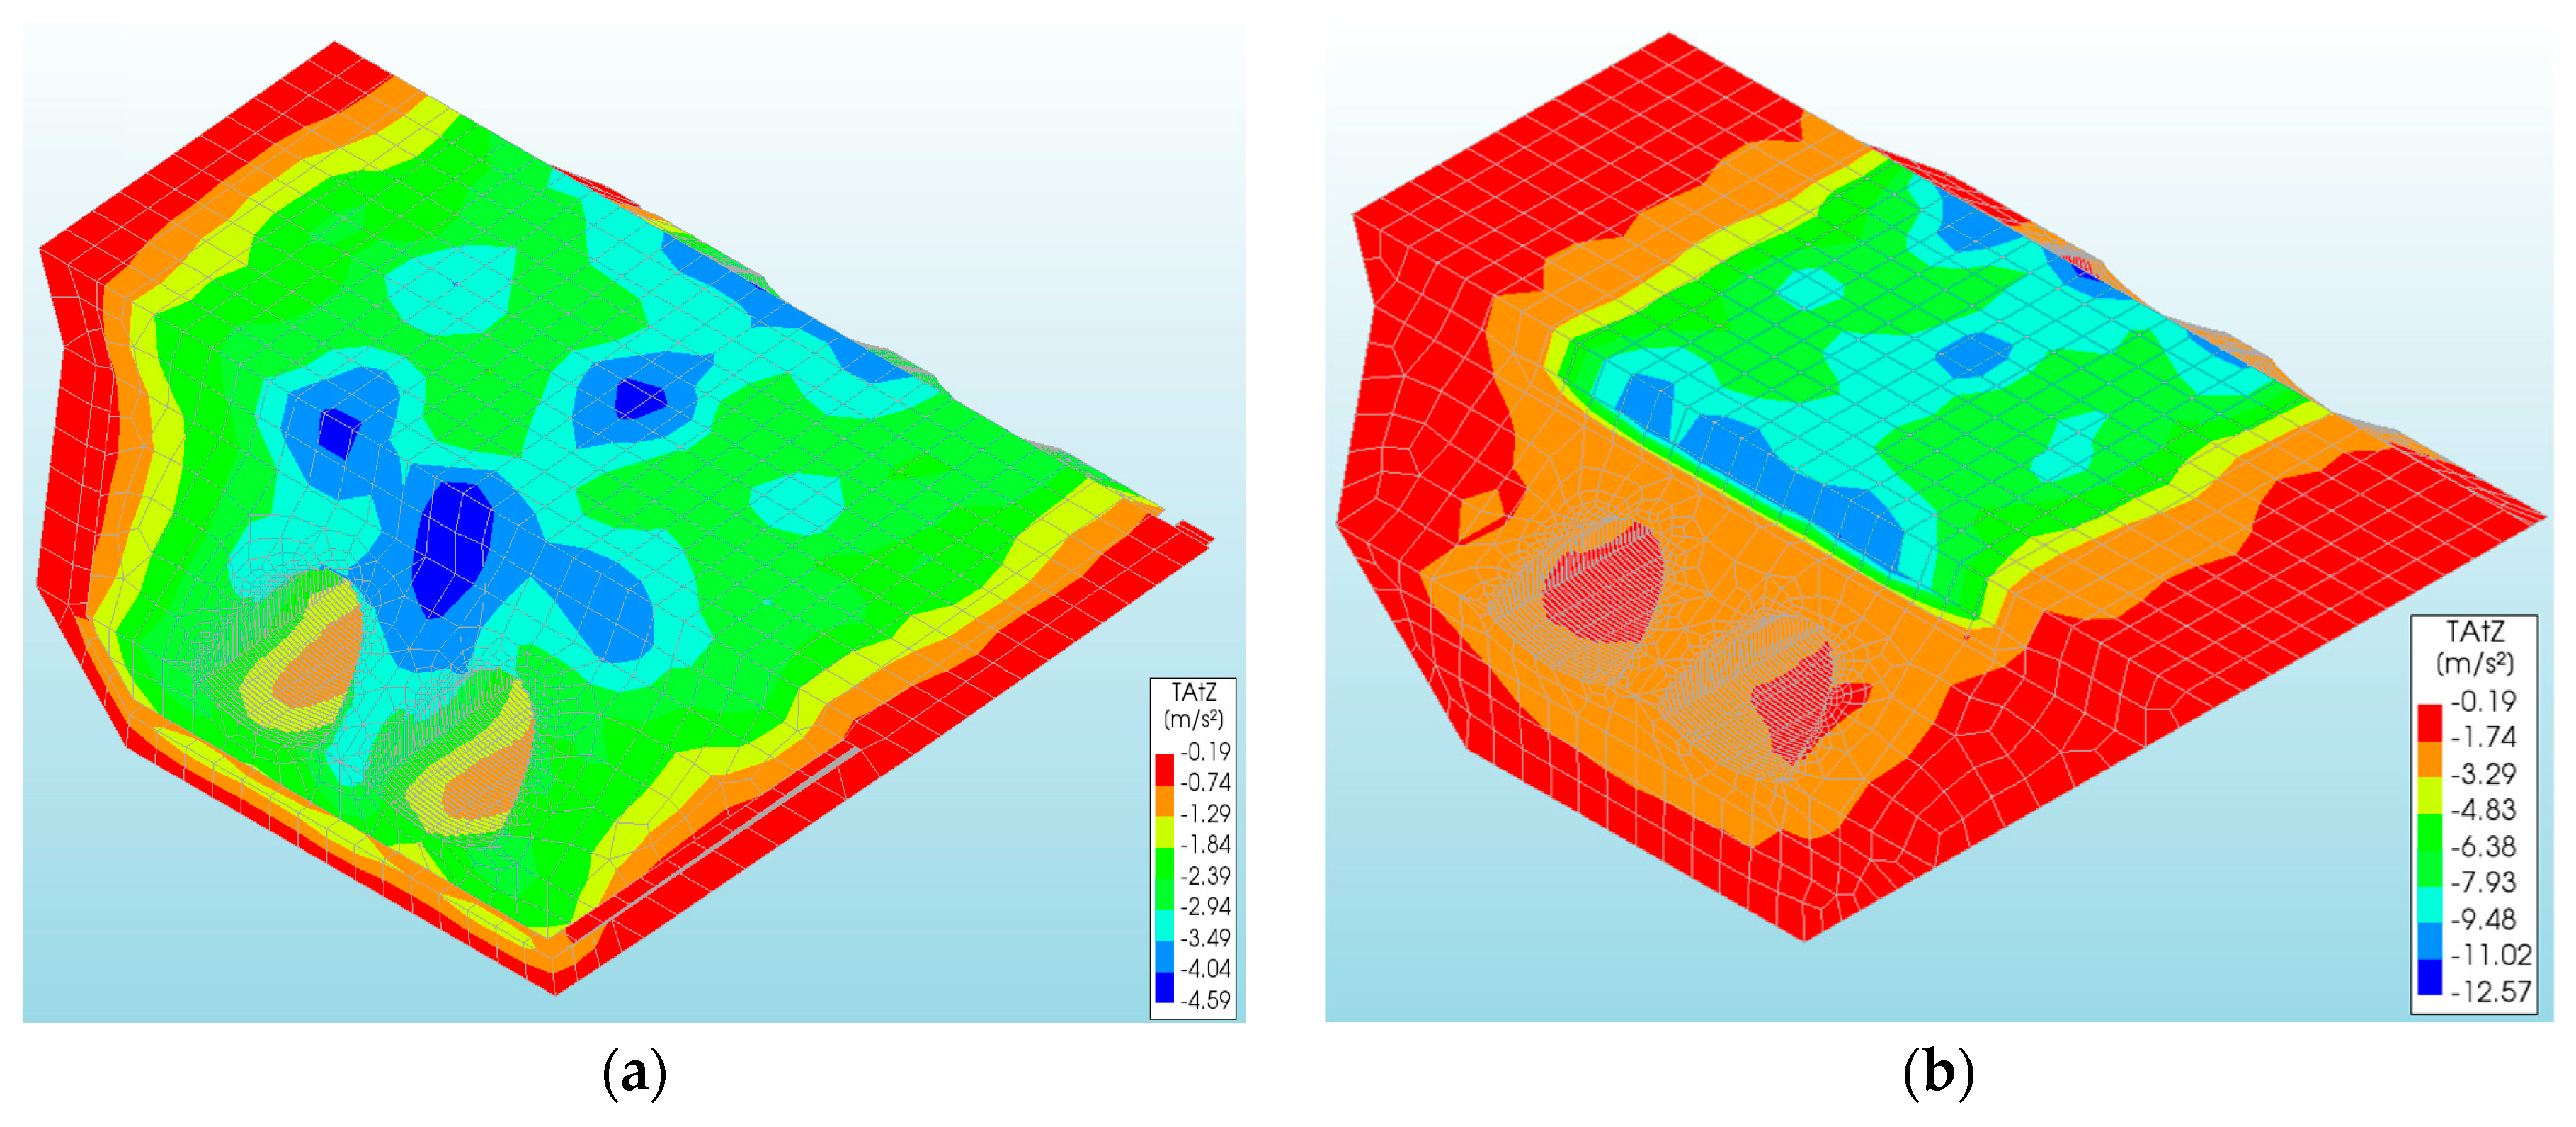
The vertical displacements, stresses, and accelerations of the backfill caused by the rockburst and El Centro excitations in particular bridge models were also analyzed. It should be noted that the values obtained from the rockburst (Table 1) were much smaller than the results caused by the El Centro excitation (Table 2). This difference is significant. In models using the El Centro excitation, the values obtained were 10 to 13 times larger than those obtained in models using the rockburst excitation. This trend was noticed for both the shell and the backfill analysis. In addition, an increase in the maximum backfill accelerations (12.57 m/s2) can be observed (Figure 13b) in the models in which the EPS blocks were situated quite close to the CSP shell: 1.0 m over (model IIb) and under (model IIIb) the shell. In model IIb the maximum accelerations were focused above the EPS blocks, at the inlet and outlet.
However, in the models with EPS blocks situated more deeply, the range of maximum backfill accelerations was smaller and was concentrated only at the inlets and outlets of the bridge. The distribution of backfill accelerations, without the EPS blocks, is presented in Figure 13a. It can be seen that the maximum accelerations were located only below CSP shells (between shell and EPS block) and were more uniform.
The largest backfill vertical displacements were similar to those obtained in the CSP shell for both types of excitations. They were observed in model IIa (rockburst) and IIb (El Centro), where the EPS was situated over the CSP shell. They amounted to 4.33 × 10⁻⁴ m and −4.45 × 10⁻³ m, respectively. The maximum values occurred under the bottom part of the backfill (between the CSP shells). The maximum stresses in the backfill did not exceed 0.630 MPa, which were obtained in model IVb (above the shell crown). Generally, the level of backfill stresses was quite low. The backfill stresses were also significantly lower than those for the CSP shell.
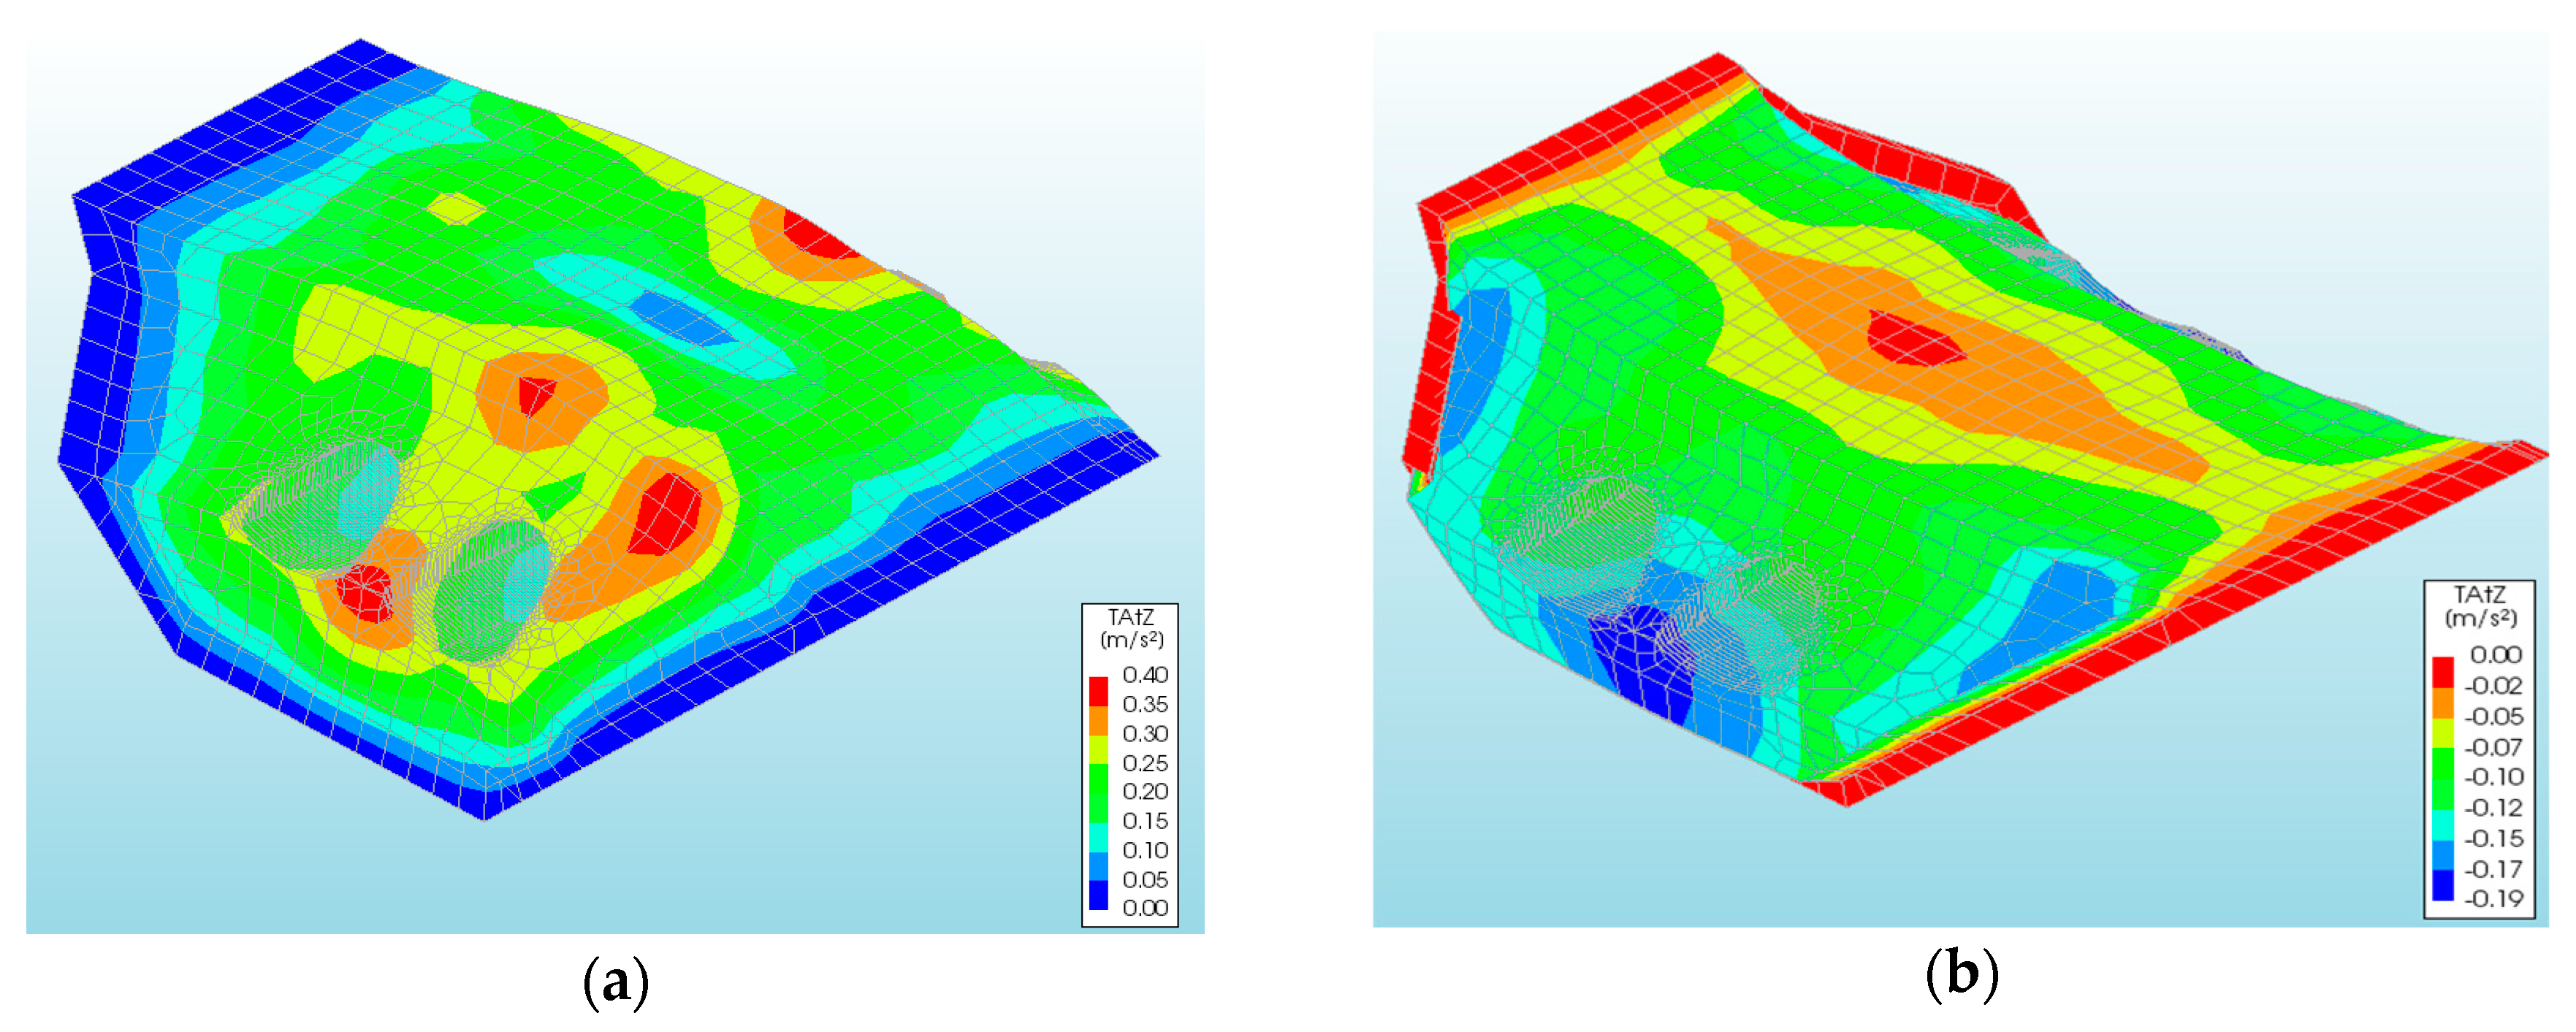
It should be added that the maximum backfill accelerations were observed at the lower parts of the numerical model of the bridge. Analyzing the backfill behavior, it is clearly seen that the application of EPS slightly affected the increase of vertical displacements. It can be emphasized that the EPS reduced the stresses (except for models IIIb, IVb) and accelerations (except for models IIa, IIb, IIIb) in the backfill. In addition, the use of EPS caused a uniform distribution of vertical displacements, stresses, and accelerations in the backfill (Figure 14).
4.8. Summary of FE Analysis
The conducted FEM analysis shows that the most important results, from the safety point of view of soil–steel bridges under seismic excitations, are accelerations (CSP shell and soil) and axial forces in the steel shell and to a lesser extent of displacement (shell and soil). The results show that the use of the EPS layer had a positive effect on reducing the maximum accelerations of the steel shell. In addition, in models where the EPS layer was located more than 1.0 m below the steel shell (models IV and V), a reduction of axial forces was observed. The best effect of the EPS layer can be seen in models where the EPS layer was located 2.5 m below the CSP shell (model Va and Vb). There was a reduction of the axial forces by 39% (model Vb) for the El Centro excitation and 64% (model Va) for the rockburst in relation to models without EPS layer (model Ia and Ib). In addition, the obtained accelerations of the CSP shell in models Va and Vb, in relation to models Ia and Ib, show the positive behavior of these objects in seismic areas. A reduction of CSP shell acceleration by 49% (model Va) was observed for the rockburst and 62% (model Vb) for El Centro in relation to models without an EPS layer (models Ia and Ib). In addition, the results obtained for models IIa and IIb (EPS located above the CSP shell) show that such a placement of the EPS caused an increase in axial forces and accelerations in the backfill and in the CSP shell. Thus, it should not be employed in objects located in seismic areas.
It should be noted that the vertical displacements were bigger in models where the EPS layer was below the steel shell (models IIIa–Va and models IIIb–Vb) in relation to models without the EPS layer (models Ia and Ib). Increased vertical displacements due to excitations did not produce an exceeding of the allowed displacements for soil–steel bridges. Thus, the EPS layer used will allow the safe transfer of loads through the soil–steel bridge structure.
It should also be added that the results obtained were affected by the intensity and duration of the seismic excitation. It has been observed that in models with low intensity and short duration, the positive effect of the EPS layer was better seen. In addition, in the analysis carried out for the El Centro record, where only two horizontal directions (XY) were used, the impact of the EPS layer on the soil–steel bridges was not clear. Only the use of a full record of the soil acceleration (in three directions: XYZ) made evident the satisfactory impact of the EPS layer on soil–steel bridges subjected to seismic excitations.
4.9. Standards Approach
In general, the seismic response of soil–steel bridges is not commonly addressed in the standards. Eurocode 8 [25] defines the horizontal design ground acceleration (maximum acceleration of the most intensive seismic area in Europe equal to about 4.91 m/s2) which a structure must be able to transfer during an earthquake. The American Association of State Highway and Transportation Officials (AASHTO) [3] omits the aspect of the seismic impact on objects buried in the soil. This standard assumes that due to the proper compaction of the soil around the steel shell, the seismic effect on the shell can be neglected. In addition, a seismic analysis using the Time History or Pushover methods is not required for single–span objects. Only in bridge structures with a number of spans greater than one should the seismic impact on the given bridge be taken into account in relation to one of these methods.
The CHBDC [2] standard allows the determination of the seismic effects (axial forces and bending moments) on soil–steel objects. In order to compare the obtained results from the numerical analysis, calculations for the analyzed bridge were made, according to the CHBDC standard [2]. Axial forces and bending moments were calculated for both the rockburst record of 12 December 2015 and the El Centro earthquake. For comparative purposes, models Ia and Ib were used, without the use of EPS blocks, as the CHBDC [2] standard does not allow for their inclusion. In the case of axial forces for the El Centro record (model Ib), a quite high compatibility of results (at the level of 72%) was obtained. The calculated axial forces were equal 534.32 kN/m and 384.88 kN/m for CHBDC and FEM, respectively. Lower compliance was observed in case of rockburst excitation (model Ia). Axial forces were equal to 124.62 kN/m and −44.40 kN/m for CHBDC and FEM, respectively. The results from the numerical analysis constitute only 36% of the value obtained according to the CHBDC standard. However, the largest differences were observed in case of bending moments. According to the CHBDC standard, the bending moment was equal −1.55 kNm/m (for the El Centro record), and in the numerical analysis, the value was equal −0.18 kNm/m, which is only 12% of the value from the standard. Even greater differences between CHBDC (−0.36 kNm/m) and FEM (1.70 × 10⁻² kNm/m) were observed for the rockburst record. The value of the bending moment, from the rockburst, was only 5% of the maximum bending moment from FEM.
The above shows that the current approach in standards for the design of soil-steel bridges for earthquakes is insufficient. Only the CHBDC [2] standard gives the opportunity to estimate the impact of these types of loads on buried bridges, but the assumptions are conservative.
5. Conclusions
Based on the analysis of a soil–steel bridge, both with and without EPS geofoam, subjected to seismic excitations (El Centro and rockburst), it can be concluded that:
- The obtained values in the soil–steel bridge model subjected to the rockburst were much smaller than the results obtained through the use of the seismic effect (the El Centro earthquake). The difference between the obtained results was significant and exceeded the values obtained from rockbursts by a factor of up to 17 times. This shows that the intensity and duration of the excitation has a significant impact on the level of deformation of the bridge, as well as on the place and range of the occurrence of the maximum values. The results also show that the accelerations (shell and backfill) and axial forces of the CSP shell were the crucial parameters. The displacements of the shell and backfill were also important but to a lesser extent. Placing the EPS more deeply under the shell foundation influenced positively the behavior of the bridge. When the EPS is close to the shell structure, the situation was the opposite.
- The highest axial forces in the CSP shell were observed in model I (−44.40 kN/m for model Ia and 393.53 kN/m for model IIIb) while the smallest were in model V (−15.94 kN/m for model Va and −240.40 kN/m for model Vb). In these cases, a significant reduction in axial forces, by up to 64% (rockburst) and 39% (El Centro), due to the use of EPS was also observed.
- The use of EPS blocks reduced the shell accelerations by up to 49% for the rockburst and 62% for El Centro excitations when the EPS was placed more deeply. Smaller accelerations were the result of larger deformations, which gives the highest vertical displacements. The maximum values of shell accelerations occurred in different places: For the rockburst, they appeared from the inlet and outlet sides, in the lower parts of the shell. However, in the case of El Centro, they also occurred from the inlet and outlet sides, but in the upper parts of the shell. Increased maximum backfill accelerations (12.57 m/s2 and 1.37 m/s2) were observed when the EPS blocks were situated quite close (models IIa and IIb) to the CSP shell (1.0 m over the shell).
- The level of the largest shell and backfill vertical displacements was low. The maximum vertical displacements of CSP shell did not exceed −2.32 × 10⁻⁴ m (model Va, rockburst excitation) and 4.04 × 10⁻³ m (model Vb, El Centro). They were observed at the inlet and outlet of the bridge. The largest values were obtained for models using EPS and this was a negative effect of the rockburst excitation. In addition, it was noticed that the range of maximum vertical displacements of the bridge for rockburst (model Ia) and El Centro excitations (model Ib) was different. In the case of the rockburst, a larger range of maximum vertical displacements occurred.
- The highest stresses in the shell were obtained for model I (4.62 MPa for model Ia and 47.2 MPa for model Ib). It should be noted that the characters of the maximum stresses in individual models were different. Tensile stresses were obtained in models Ib and IIb of El Centro and models Ia, IIa, IVa and Va of rockburst. Compressive values were obtained for model III (model IIIa and model IIIb), IVb, and model Vb. In bridge models with EPS, a reduction of stresses in the shell in the range of 30–61% (rockburst) and up to 40% (El Centro) were observed and their distributions were more uniform.
- The application of EPS blocks reduced bending moments in CSP shell by up to 57%. The largest values were obtained for model I and the smallest for models with EPS blocks under rockburst and El Centro excitations.
- The application of EPS (models II through by V) does not reduce the vibration velocity of the shell, i.e., they are at a similar level to those for a bridge without EPS (model I). The maximum vibration velocities of the CSP shell were obtained at the ends of the shell, i.e., at the inlet and the outlet of the bridge (the bottom of shell) for models Va and Vb (with EPS).
- The use of EPS produced a reduction (by about 63%) of backfill stresses (rockburst) and backfill accelerations by up to 53% (rockburst) in cases when the EPS were located below the CSP shell (model Va). Moreover, the backfill vertical displacements were quite similar to the shell vertical displacements, except where the EPS were located above the CSP shell (models IIa and IIb). It should be also noted that the vertical displacements in models IIa, IIb, IIIa, IVa, and Va (with EPS) were negative. In addition, as a result of the EPS application, a uniform distribution of vertical displacements, stresses, and accelerations in the backfill was observed for both models with rockburst and El Centro excitations.
- Increasing the distance of the EPS blocks from the CSP shell foundation (from 1.0 m to 2.5 m) led to an increase in the vertical displacements of the shell and backfill. A reduction of the stresses (caused by rockburst excitations), axial forces, bending moments, and accelerations in the shell was observed. In addition, the backfill stresses were also reduced in models excited with the rockburst. It can be seen that the location of the EPS had an effect on the behavior of the soil–steel bridge under seismic excitation. However, to obtain more detailed conclusions would require further analysis taking into account a more diversified location of the EPS blocks in relation to the bridge.
- The significance of the impact of the intensity and duration of the seismic excitation should also be noted. This difference is well described in the CHBDC standard, which estimated the value of axial forces (72%) in relation to the numerical models in a quite similar way (for the El Centro excitation). However, in the case of the rockburst, the differences were larger and the obtained axial force values, according to the FE analysis, were only 36% of the values calculated from the CHBDC standard. In addition, the two records were characterized by a different topology of origin. In the analyzed case, El Centro is a tectonic record, and the rockburst record is an anthropogenic record. In addition, it seems important that the appropriate norms regarding the design of soil–steel bridges for seismic excitations be taken into account.
The performed analysis may be helpful in the design of soil–steel bridges in areas exposed to seismic excitations, such as earthquakes or anthropogenic phenomena.
Author Contributions
Conceptualization, D.B.; Formal analysis, T.M., J.N. and D.B.; Investigation, T.M. and J.N.; Methodology, T.M. and D.B.; Software, T.M. and J.N.; Supervision, D.B.; Visualization, T.M.; Writing—original draft, T.M. and J.N.; Writing—review & editing, T.M., J.N. and D.B.
Funding
This research received no external funding. The APC was funded by Faculty of Civil Engineering and Architecture of Opole University of Technology.
Conflicts of Interest
The authors declare no conflict of interest.
References
- Pettersson, L.; Sundquist, H. Design of Soil-Steel Composite Bridges; Royal Institute of Technology: Stockholm, Sweden, 2014. [Google Scholar]
- Canadian Highway Bridge Design Code; CAN/CSA-S6-14; Canadian Standards Association International: Mississauga. ON, Canada, 2014.
- Standard Specifications for Highway Bridges; American Association of State Highway and Transportation Officials: Washington, DC, USA, 2014.
- Bathurst, R.J.; Knight, M.A. Analysis of geocell reinforced-soil covers over large span conduits. Comp. Geotech. 1998, 22, 205–219. [Google Scholar] [CrossRef]
- Vaslestad, J.; Janusz, L.; Bednarek, B. Instrumental full-scale test with geogrid above crown of corrugated steel box culvert. In Proceedings of the Seventh International Conference on Geosynthetics (7ICG), Nice, France, 22–27 September 2002. [Google Scholar]
- Essery, D.P.; Williams, K. Buried flexible steel structures with wire mesh reinforcements for cut plates. Arch. Inst. Civil Eng. 2007, 1, 65–79. [Google Scholar]
- Bartlett, S.F.; Lingwall, B.N.; Vaslestad, J. Methods of protecting buried pipelines and culverts in transportation infrastructure using EPS geofoam. Geotext. Geomemb. 2015, 43, 450–461. [Google Scholar] [CrossRef]
- Beben, D.; Stryczek, A. Numerical analysis of corrugated steel plate bridge with reinforced concrete relieving slab. J. Civ. Eng. Manag. 2016, 22, 585–596. [Google Scholar] [CrossRef]
- Vaslestad, J. Soil Structure Interaction of Buried Culverts. Ph.D. Thesis, Geotechnical Division, Norwegian Institute of Technology, Trondheim, Norway, 1990. [Google Scholar]
- Vaslestad, J.; Johansen, T.H.; Holm, W. Load reduction on rigid culverts beneath high fills- long term behaviour. Transport. Res. Rec. 1993, 1415, 58–68. [Google Scholar]
- Arellano, D.; Stark, T.D.; Horvath, J.S.; Leshchinsky, D. Guidelines for Geofoam Applications in Slope Stability Projects, Research Results Digest 380; National Cooperative Highway Research Program, The National Academies Press: Washington, DC, USA, 2013. [Google Scholar] [CrossRef]
- Moorsel, D.; Kilpeläinen, T.; Meuwissen, E.; Neirinckx, L.; Tepper, H.; Thompsett, D.; Zipp, K. EPS White Book, Background Information on Standardization of EPS; EUMEPS: Maaseik, Belgium, 2014. [Google Scholar]
- Stark, T.D.; Arellano, D.; Horvath, J.S.; Leshchinsky, D. Guideline and Recommended Standard for Geofoam Applications in Highway Embankments; NCHRP REPORT 529; Transportation Research Board of the National Academies: Washington, DC, USA, 2004. [Google Scholar]
- Arellano, D.; Stark, T.D.; Horvath, J.S.; Leshchinsky, D.; Kafash, M.H.; Wang, C. Overview of NCHRP design guideline for EPS-block geofoam in slope stabilization and repair. In Proceedings of the 4th International Conference on Geofoam Blocks in Construction Applications, At Lillestrom, Norway, 6–8 June 2011. [Google Scholar]
- Sun, L.; Hopkins, T.C.; Beckham, T.L. Long-term monitoring of culvert load reduction using an imperfect ditch backfilled with geofoam. Transp. Res. Rec. 2011, 2212, 56–64. [Google Scholar] [CrossRef]
- Ahmed, M.R.; Meguid, M.; Whalen, J.; Eng, P. Laboratory measurement of the load reduction on buried structures overlain by EPS geofoam. In Proceedings of the 66th Canadian Geotechnical Conference, Montreal, QC, Canada, 29 September–3 October 2013. [Google Scholar]
- Bartlett, S.; Arellano, D.; Vaslestad, J.; Aabøe, R.; Ahmed, T. Bridge foundations supported by EPS geofoam embankments on soft soil. In Proceedings of the 5th International Conference on Geofoam Blocks in Construction Applications, Kyrenia, Cyprus, 9–11 May 2018. [Google Scholar]
- Aabøe, R.; Bartlett, S.F.; Duškov, M.; Frydenlund, T.E.; Mandal, J.N.; Negussey, D.; Özer, A.T.; Tsukamoto, H.; Vaslestad, J. Geofoam blocks in civil engineering applications. In Proceedings of the 5th International Conference on Geofoam Blocks in Construction Applications, Kyrenia, Cyprus, 9–11 May 2018. [Google Scholar]
- Meguid, M.A.; Hussein, M.G.; Ahmed, M.R.; Omeman, Z.; Whalen, J. Investigation of soil-geosynthetic-structure interaction associated with induced trench installation. Geotext. Geomemb. 2017, 45, 320–330. [Google Scholar] [CrossRef]
- Vaslestad, J.; Sayd, M. Load reduction on buried rigid culverts, instrumented case histories and numerical modelling. In Proceedings of the 5th International Conference on Geofoam Blocks in Construction Applications, Kyrenia, Cyprus, 9–11 May 2018. [Google Scholar]
- Abuhajtar, O.; El Naggar, H.; Newson, T. Seismic soil-culvert interaction. Can. Geotech. J. 2015, 52, 1649–1667. [Google Scholar] [CrossRef]
- Maleska, T.; Beben, D. The effect of mine induced tremors on seismic response of soil-steel bridges. In MATEC Web of Conferences; Beben, D., Rak, A., Perkowski, Z., Eds.; EDP Sciences: Les Ulis, France, 2018; Volume 174, p. 04002. [Google Scholar]
- Bommer, J.J.; Acevedo, A.B. The use of real earthquake accelerograms as input to dynamic analysis. J. Earthq. Eng. 2004, 1, 43–91. [Google Scholar] [CrossRef]
- Iervolino, I.; Cornell, C.A. Record selection for nonlinear seismic analysis of structures. Earthq. Spectra 2005, 21, 685–713. [Google Scholar] [CrossRef]
- Eurocode, C. 8: Actions Design of Structures for Earthquake Resistance-Part 2: Bridges; (EN 1998-2: 2005); European Committee for Standardization: Brussels, Belgium, 2005. [Google Scholar]
Figure 1.
Side view of a soil–steel bridge in Germany.

Figure 2.
Analyzed soil–steel bridge located in Krosnowice, Poland.

Figure 3.
Rockburst on 12 December 2015: (a) Record of ground motion of north-south (NS) component, (b) frequency of vibration.
Figure 3.
Rockburst on 12 December 2015: (a) Record of ground motion of north-south (NS) component, (b) frequency of vibration.

Figure 4.
El Centro earthquake from 18 May 1940: (a) Record of ground motion of (NS) component, (b) frequency of vibration.
Figure 4.
El Centro earthquake from 18 May 1940: (a) Record of ground motion of (NS) component, (b) frequency of vibration.

Figure 5.
Numerical models of the soil–steel bridge with various locations of the expanded polystyrene (EPS) geofoam: (a) I, (b) II, (c) III, (d) IV, and (e) V.
Figure 5.
Numerical models of the soil–steel bridge with various locations of the expanded polystyrene (EPS) geofoam: (a) I, (b) II, (c) III, (d) IV, and (e) V.

Figure 6.
View of numerical model of the soil–steel bridge: (a) Connection-interface, (b) mesh, (c) boundary conditions (hinged supports).
Figure 6.
View of numerical model of the soil–steel bridge: (a) Connection-interface, (b) mesh, (c) boundary conditions (hinged supports).

Figure 7.
Maximal values of vertical displacements of CSP shell: (a) Rockburst for model Va, (b) El Centro for model Vb.
Figure 7.
Maximal values of vertical displacements of CSP shell: (a) Rockburst for model Va, (b) El Centro for model Vb.

Figure 8.
Maximal values of stresses of: (a) Rockburst for model Ia, (b) El Centro for model Ib.

Figure 9.
Maximal values of bending moments of: (a) Rockburst for model Ia, (b) El Centro for model Ib.
Figure 9.
Maximal values of bending moments of: (a) Rockburst for model Ia, (b) El Centro for model Ib.

Figure 10.
Maximal values of axial forces of: (a) Rockburst for model Ia, (b) El Centro for model IIIb.
Figure 10.
Maximal values of axial forces of: (a) Rockburst for model Ia, (b) El Centro for model IIIb.

Figure 11.
Maximal values of acceleration of the CSP shell: (a) Rockburst for model Ia, (b) El Centro for model Ib.
Figure 11.
Maximal values of acceleration of the CSP shell: (a) Rockburst for model Ia, (b) El Centro for model Ib.

Figure 12.
Maximal values of vibration velocity of: (a) Rockburst for model Va, (b) El Centro for model IVb.
Figure 12.
Maximal values of vibration velocity of: (a) Rockburst for model Va, (b) El Centro for model IVb.

Figure 13.
Distribution of backfill acceleration of El Centro for bridge models: (a) Ib and (b) IIb.
Figure 13.
Distribution of backfill acceleration of El Centro for bridge models: (a) Ib and (b) IIb.

Figure 14.
Distribution of backfill acceleration of rockburst for bridge models: (a) Ia and (b) VIa.
Figure 14.
Distribution of backfill acceleration of rockburst for bridge models: (a) Ia and (b) VIa.


Table 1.
The results of the numerical analyses of the soil–steel bridge with and without the EPS, under rockburst excitation (anthropogenic) simultaneously in two directions (XY).
Table 1.
The results of the numerical analyses of the soil–steel bridge with and without the EPS, under rockburst excitation (anthropogenic) simultaneously in two directions (XY).
| Considered Values: | Model Ia | Model IIa | Model IIIa | Model IVa | Model Va |
|---|---|---|---|---|---|
| Direction of Applied Excitation: | XY | XY | XY | XY | XY |
| Shell vertical displacement dz-s [m] | 1.51 × 10⁻⁴ | −8.95 × 10⁻⁵ | −1.96 × 10⁻⁴ | −2.03 × 10⁻⁴ | −2.32 × 10⁻⁴ |
| Backfill vertical displacement dz-b [m] | 1.49 × 10⁻⁴ | −4.33 × 10⁻⁴ | −1.96 × 10⁻⁴ | −2.01 × 10⁻⁴ | −2.34 × 10⁻⁴ |
| Stresses in shell Szz-s [MPa] | 4.62 | 2.95 | −2.90 | −1.80 | 3.22 |
| Stresses in backfill Szz-b [MPa] | 0.048 | 0.036 | −0.022 | 0.033 | 0.018 |
| Bending moments in shell Myy-s [kNm/m] | 1.70 × 10⁻² | 1.41 × 10⁻² | 7.16 × 10⁻³ | 7.37 × 10⁻³ | 6.86 × 10⁻³ |
| Axial forces in shell Nyy-s [kN/m] | −44.40 | 44.21 | 21.91 | −25.10 | −15.94 |
| Shell vertical acceleration az-s[m/s2] | 0.37 | 0.25 | 0.32 | 0.22 | 0.19 |
| Backfill vertical acceleration az-b [m/s2] | 0.40 | 1.37 | 0.30 | 0.22 | 0.19 |
| Vibration vertical velocity in shell vz-s [m/s] | 6.23 × 10⁻³ | 4.47 × 10⁻³ | 5.31 × 10⁻³ | 5.02 × 10⁻³ | 6.39 × 10⁻³ |
| Vibration vertical velocity in backfill vz-b [m/s] | 6.19 × 10⁻³ | 2.22 × 10⁻² | 5.41 × 10⁻³ | 5.09 × 10⁻³ | 6.44 × 10⁻³ |
Table 2.
The results of the numerical analyses of the soil–steel bridge with and without the EPS, under seismic excitation (El Centro earthquake) simultaneously in three directions (XYZ).
Table 2.
The results of the numerical analyses of the soil–steel bridge with and without the EPS, under seismic excitation (El Centro earthquake) simultaneously in three directions (XYZ).
| Considered Values: | Model Ib | Model IIb | Model IIIb | Model IVb | Model Vb |
|---|---|---|---|---|---|
| Direction of Applied Excitation: | XYZ | XYZ | XYZ | XYZ | XYZ |
| Shell vertical displacement dz-s [m] | 1.23 × 10⁻³ | −9.88 × 10⁻⁴ | 3.45 × 10⁻³ | 3.41 × 10⁻³ | 4.04 × 10⁻³ |
| Backfill vertical displacement dz-b [m] | 1.43 × 10⁻³ | 4.45 × 10⁻³ | 3.46 × 10⁻³ | 3.42 × 10⁻³ | 4.02 × 10⁻³ |
| Stresses in shell Szz-s [MPa] | 47.2 | 28.1 | −39.1 | −34.7 | −46.5 |
| Stresses in backfill Szz-b [MPa] | −0.341 | −0.305 | −0.349 | 0.630 | 0.271 |
| Bending moments in shell Myy-s [kNm/m] | −0.18 | −0.14 | −0.12 | −0.11 | 8.84 × 10⁻² |
| Axial forces in shell Nyy-s [kN/m] | −384.88 | 389.08 | −393.53 | 351.59 | 240.40 |
| Shell vertical acceleration az-s [m/s2] | 6.08 | 3.36 | 2.78 | 3.44 | 2.32 |
| Backfill vertical acceleration az-b [m/s2] | 4.59 | 12.57 | 8.17 | 3.58 | 2.36 |
| Vibration vertical velocity in shell vz-s [m/s] | 6.16 × 10⁻² | 5.07 × 10⁻² | 9.32 × 10⁻² | 9.48 × 10⁻² | 8.16 × 10⁻² |
| Vibration vertical velocity in backfill vz-b [m/s] | 7.41 × 10⁻² | 0.21 | 9.41 × 10⁻² | 9.72 × 10⁻² | 8.20 × 10⁻² |
© 2019 by the authors. Licensee MDPI, Basel, Switzerland. This article is an open access article distributed under the terms and conditions of the Creative Commons Attribution (CC BY) license (http://creativecommons.org/licenses/by/4.0/).
Share and Cite
MDPI and ACS Style
Maleska, T.; Nowacka, J.; Beben, D. Application of EPS Geofoam to a Soil–Steel Bridge to Reduce Seismic Excitations. Geosciences 2019, 9, 448. https://0-doi-org.brum.beds.ac.uk/10.3390/geosciences9100448
AMA Style
Maleska T, Nowacka J, Beben D. Application of EPS Geofoam to a Soil–Steel Bridge to Reduce Seismic Excitations. Geosciences. 2019; 9(10):448. https://0-doi-org.brum.beds.ac.uk/10.3390/geosciences9100448
Chicago/Turabian StyleMaleska, Tomasz, Joanna Nowacka, and Damian Beben. 2019. "Application of EPS Geofoam to a Soil–Steel Bridge to Reduce Seismic Excitations" Geosciences 9, no. 10: 448. https://0-doi-org.brum.beds.ac.uk/10.3390/geosciences9100448
Note that from the first issue of 2016, this journal uses article numbers instead of page numbers. See further details here.