Article

Preliminary Thermal Investigations of Calcium Antimonate Opacified White Glass Tesserae

by
Cristina Boschetti
1,*,†,
Cristina Leonelli
2,†,
Roberto Rosa
2,
Marcello Romagnoli
2,
Miguel Ángel Valero Tévar
3 and
Nadine Schibille
1,*
1
IRAMAT-CEB, UMR5060, CNRS/Université d’Orléans, 3D rue de la Férollerie, CS 60061, 45071 Orléans CEDEX 2, France
2
Dipartimento di Ingegneria “Enzo Ferrari”, Università degli Studi di Modena e Reggio Emilia, Via Pietro Vivarelli 10, 41125 Modena, Italy
3
Departamento de Historia Antigua, Facultad de Humanidades y Ciencias de la Educación, Universidad de Castilla-La Mancha, Av. de los Altares s/n, 16071 Cuenca, Spain
*
Authors to whom correspondence should be addressed.
These authors contributed equally to this work.
Submission received: 11 May 2020 / Revised: 23 June 2020 / Accepted: 24 June 2020 / Published: 26 June 2020
(This article belongs to the Section Archaeological Heritage)

Abstract

:
Calcium antimonate (in the hexagonal or cubic form) dispersed in the glass matrix is an artificially synthesized phase commonly documented as opacifier for white glasses during the Roman period. Glasses of this type occasionally contain variable amounts of lead oxide. There is no consensus about the origin and role of the lead component in white glasses, whether it was functional to modify the workability of the glass and/or to help the precipitation of the particles, or whether it was an unintentional pollutant introduced with the raw materials. A group of lead and lead-free white mosaic tesserae from the fourth-century CE villa of Noheda in Spain were analyzed by differential scanning calorimetry (DSC) and high temperature X-ray diffraction (HTXRD) to evaluate the impact of variable amounts of lead oxide in the precipitation of calcium antimonate on the viscosity of the glass. The analyzed glasses show thermal events that have been related to the composition of the glass via multicomponent linear regression model. CaSb2O6 and Ca2Sb2O7 formed in the glass during the cooling phase and the glass was not reheated. Lead oxide influences the thermal behavior of the glass, lowering the onset temperatures of all the events, implying a more cost-effective production process. We propose that lead was added intentionally or that lead-bearing raw materials were selected specifically by the ancient glass artisans.

1. Introduction

Opacity of glass implies either the addition of mineral pigments to the base glass or the in situ precipitation of crystals during the thermal cycle. Calcium antimonate, a synthetized pigment which does not exist in nature, is attested in the form of hexagonal (CaSb2O6) or cubic (Ca2Sb2O7) crystals to generate opaque white glass. The use of antimony as opacifier is documented since the very beginnings of glass making in the Late Bronze Age, both in Mesopotamia as well as in Egypt [1,2,3]. Calcium antimonate was used not exclusively for making white glass, but in combination with strongly coloured glasses; it also achieves a number of cool shades, for instance blue, aqua-green, turquoise, grey, and light purple. During the same period, lead antimonate (Pb2Sb2O7) served to produce opaque yellow and shades of green [1,2,3]. Unlike calcium antimonate, lead antimonate occurs in nature as bindheimeite (Pb2Sb2O6 [O, OH]) and was probably used by glass artisans both in its mineral and in its synthetized form [4,5]. The appearance of both calcium antimonate and lead antimonate as pigments seem to be related to the origins of glass making. No use of either calcium or lead antimonate prior to the invention of vitreous materials has been reported [1]. Calcium antimonate-based pigments continued to be used as opacifiers during the Hellenistic and the Roman period, and have been discussed in the literature particularly in connection with Hellenistic mosaic tesserae and vessels [6,7], as well as Roman mosaic tesserae [8,9,10,11,12,13,14,15,16,17,18,19] and opus sectile panels [20,21]. For reasons not well understood, the use of calcium antimonate as an opacifying agent for glass ceased towards the end of the Western Roman Empire, when it was replaced by calcium stannate [22]. Mosaic tesserae opacified by calcium antimonate can still be found during the Early Middle Ages in the Italian Peninsula, but these incidents are likely to represent the reuse of older Roman tesserae rather than the continued use of calcium antimonate [17,23]. In the eastern Mediterranean, the transition to a tin-based opacification seems to have been a much faster process [22]. Alongside the use of calcium stannate, eastern Mediterranean glasses are occasionally opacified by calcium phosphate from the fifth century onwards ([24] and references therein). Antimony white re-appears in the Islamic world in connection with Egypt 2 natron-type glass in the ninth century for a short period and then only as patches on some Islamic glass weights [25]. This isolated re-appearance is difficult to explain because, at present, calcium antimonate has not been documented in other contemporary productions. In contrast, investigations conducted on glazed pottery revealed a revival of lead antimonate in ninth–tenth century Egypt [26]. In the fifteenth century, calcium antimonate re-surfaces in context of glass technologies. It is mentioned as the white opacifier of choice in Venetian glass recipe books [27], while lead antimonate is listed as yellow pigment for glazes in a number of Italian treatises on ceramics [28]. From the sixteenth century, lead antimonate was a popular pictorial pigment, known as Naples Yellow, while calcium antimonate remains confined to the realm of glass opacification [28].
Interestingly, calcium antimonate-opacified glasses are often quite atypical in terms of their composition, because they sometimes have unusually high lead oxide concentrations. Elevated lead oxide occurs as early as the Hellenistic period and examples are documented throughout the Roman Period [9,27,28,29,30,31]. In glasses where antimony acts as a decolourant, lead oxide contents were found to gradually decrease from the late Hellenistic period through to the second century CE, when high lead contents finally disappeared [32]. The role of elevated lead oxide concentrations in these glasses has triggered a major debate, especially in relation to the forming technology of cameo glass. Cameo glass is a complex working technique used for vessels and decorative plaques [33], where a core of usually translucent blue or purple glass is covered with a layer of opaque white glass, which is subsequently cold-carved to create a low-relief decoration. It has been argued that the elevated lead oxide contents served to lower the viscosity and the hardness of the glass [29]. In the cameo-glass technology the use of a softer glass for the external white layer can be advantageous in different ways. Firstly, in order to achieve a good final result, the white layer has to be perfectly homogeneous. A glass with a high viscosity is more likely to trap air bubbles, which can potentially compromise the low-relief decoration. At the same time, glass containing lead is softer and easier to carve. Lead-white glass often underlies Migration period beads opacified by calcium stannate and formed by winding [34]. The winding technique involves the manipulation of a gob of hot glass around an iron rod, the mandrel. A glass with a lower viscosity can be advantageous for this operation, because it allows working at a lower temperature. Hence, elevated lead contents have been frequently interpreted as an intentional additive, instrumental in secondary working processes [34]. In contrast, some scholars attributed lead in white glasses to impurities in the raw materials and consider its presence accidental [35].
If the intentional addition of lead or the intentional selection of lead-bearing raw materials for the production of cameo glass or wound beads can be justified due to improved working properties, the presence of lead in mosaic tesserae is more difficult to explain, because the addition of lead would not bring any advantage in terms of glass-forming techniques. In case of tesserae, lead oxide may have instead benefited the optical properties, homogeneity and brilliance of the glass. The formation of calcium antimonate in natron glasses has been experimentally reproduced in the laboratory and it was found that the crystals were formed by in situ crystallisation after antimony oxide (as Sb2O4 or Sb2O5) was added to a base glass [14,36]. A long thermal cycle of 20 h at approximately 1100 °C has produced a result very close to the texture of Roman glasses. Experimental reproductions of calcium antimonate-opacified glasses have furthermore shown that lead oxide has an influence in the precipitation of the crystals [32]. Although these experimental studies offer a valuable approximation of how Roman and medieval opaque white glasses may have been generated, the effects have never been investigated directly in archaeological glass samples. In order to explore the role of lead oxide in the precipitation process of hexagonal (CaSb2O6) and orthorhombic (Ca2Sb2O7) forms of calcium antimonate, we compared the thermal behaviour with the crystalline phases in mosaic tesserae with different concentrations of lead oxide. This paper thus presents new insights into the production of Roman antimony white tesserae, and a potential explanation for their elevated lead contents adopting an in situ high temperature X-ray diffraction.

2. Materials and Methods

Ten white tesserae containing antimony from the extensive floor mosaic of the fourth-century villa of Noheda (Cuenca, Spain) were selected based on their varying levels of magnesium and lead oxide previously determined by LA-ICP-MS (Table 1, Table S1). This case study was selected to represent the opacification technology commonly attested in the Roman Empire. The full chemical composition, microtextural analysis and the values obtained for the certified glass standards were previously published [37]. The tesserae were freshly fractured and fragments of non-weathered glass were finely hand ground in an agate mortar (grain size less than 20 micrometre). The thermal behaviour of the samples was investigated by non-isothermal differential scanning calorimetry (DSC, Netzsch, Selb, Germany, model DSC 404). The measurements were performed on the finely powdered samples between room temperature and 1200 °C, with heating rates of 10 °C/min in static air. All DSC measurements were carried out on approximately 20.0-25.0 mg samples against an empty Pt-Rh crucible. Being aware that the finesse of the powder affects the thermal events, we carefully ground all the specimens to achieve the same final grain size [38].
Multicomponent Liner Regression (MLR) was adopted to probe the variations of independent variables (oxides content in wt%) on the dependent variables (Tg) with the aim to determine which one has a significant impact. According to the relationship between the dataset, a straight-line regression was used [39].
X-ray diffraction was conducted on the finely powdered glass and frontally loaded on a Si sample holder. X-ray diffraction patterns were acquired by the X’PERT PRO Panalytical diffractometer (Panalytical, Almelo, Netherlands) equipped with a real-time multiple strip detector X’Celerator with the following experimental settings: Ni filtered Cu Kα radiation (λ = 1.5418 Å); voltage 40 kV; tube current 40 mA; divergence and anti-scatter slits 0.5°; 1/2° divergence and receiving slits, incident beam with Soller 0.04 rad, mask fixed at 10 mm, and step scan of 0.0167113 °2θ, angular range 10° < 2θ < 60°. The application software version was X’Pert Date collector.
The heat treatment was carried out in a precisely controllable high temperature chamber (Anton Paar HTK 16) capable of reaching 1600 °C in air. Such high temperature chambers are a well-proven instrument for in situ X-ray diffraction studies. Employing the published instrumental setup and calibration [40] the X-ray diffraction patterns were acquired in the angular range of 20° <2θ < 35° at the following nominal temperatures: 540, 600, 660, 720, 840, 960, 1080, 1200 °C of the powdered glassy samples. Additional measurements were performed in the angular range of 14° < 2θ < 32°. Temperatures were increased at 50 °C/min from 25 to 500, then at 10 °C/min to the next value. After the calibration procedure reported in the literature, the correction of the nominal temperatures resulted in the following real temperatures: 450, 500, 550, 600, 700, 800, 900, 1000 °C [40]. Due to the use of an X’Celerator detector, phase transformation events were recorded along the indicated 2θ range for 9.26 min per temperature. The powdered glass samples were singularly mixed with bi-distilled water and dropwise placed upon the Pt strip, which acted as thermocouple, heating element, and sample holder at the same time. After each sample was tested, the Pt strip was washed with HF solution to completely dissolve the glassy powder.

3. Results and Discussion

Of the 10 mosaic tesserae selected, five samples are natron-type glasses with typically low magnesia and potash levels (< 1.5 wt.%) and varying lead concentrations (1 < PbO < 2.5 wt.%), while five specimens have an excess of magnesia (1.5 < MgO < 4 wt.%) and low potash and phosphorus levels [37]. The concentration of antimony oxide in all the tesserae corresponds well with the presence of calcium antimonate crystals as the main pigment (for a detailed discussion on the chemical composition and the microstructure see [37]).

3.1. Identification of Thermal Events

Non-isothermal differential scanning calorimetry reveals different thermal events that appear as one, two or three endothermic peaks in the corresponding DSC curves (Figure 1, Figures S1–S10). All samples show a glass transition temperature (Tg) and the corresponding peak [41] between 520 and 553 °C that seems to correspond to a peak at 540 °C observed in some recently conducted glass model experiments [36]. Three samples (Noheda 76, 86, 93) display only this single endothermic peak, while six samples (Noheda 71, 77, 80, 92, 99 and 106) have an additional peak between 589 and 620 °C. This peak also represents a glass transition temperature, as already observed in Roman natron glasses opacified with calcium antimonate (see for comparison Figure 8 in [36]). These two Tg peaks correspond to two different glassy phases, one richer in silica, and the other one richer in network modifier cations. The peak at the higher temperature is usually attributed to the presence of a silica-rich phase in a phase-separated glass, which appears to be a relatively common phenomenon in silicate glasses, especially when the cooling rate is slow [40,41,42]. This phase separation can augment the perceived opalescence in the bulk glasses. Six samples (Noheda 77, 80, 84, 92, 99, 106) show a third endothermic event indicative of incipient melting. Melting, visible as a broad endothermic peak, occurs at different temperatures, ranging from 1122 to 1155 °C (Figure 1). All the DSC present trends similar to those reported in Figure 1. It should be noted that our differential thermal analysis did not identify any crystallisation event, typically exothermic, in contrast to previous reports of experimental replica of natron glass opacified by Ca2Sb2O7 at temperature ranges from 100 to 1100 °C [36].
All samples with the highest lead concentrations (PbO > 1%) show melting temperatures below 1200 °C (Table 1). This is in good agreement with the results obtained during experimental reproductions of glass melting in Roman-type wood-fired furnaces that reach a maximum temperature of approximately 1100 °C [43]. High lead concentrations do not have an effect on the position of the slope change at 300 °C, but clearly shift the peak corresponding to the first thermal event from 553 to 520 °C, and the peak of the second thermal event from 620 to 589 °C. There appears to be an inverse correlation between the temperature of the first thermal event and the lead concentrations, which becomes more pronounced at higher concentrations (PbO > 2 wt.%) (Figure 2). This result is in line with the workability interval measured for a raw glass from Pompeii (685‒892 °C) [38]. The curves from our non-isothermal differential thermal analysis overlap perfectly with those reported in the literature for laboratory replicas of Roman calcium antimonate-opacified glasses. However, since we recorded the curves across a broader temperature range (from 20 °C/293K to 1200 °C/1473K), our data additionally disclosed a change in the slope of the curve at 300 °C/573K, which was not clearly visible in previous experimental results [36].

3.2. Linear Regression Model

Multicomponent linear regression (MLR) was applied to the temperature of the first endothermic peak (Tg), for the five oxides reported in Table 2, together with the coefficients used for each oxide. MLR model shows good values for both R-squared and adjusted R-squared, equal to 0.9734 (also reported in Figure 3, under the equation of the line) and 0.9401, respectively. When the values of these two coefficients are close to the unit and are close to each other, the condition indicates that the parameters used for the fitting, in this case the oxide percentages, are appropriate and not redundant. In particular, we noticed that when SiO2 and/or Na2O were introduced into the model, the two values for R-squared and adjusted R-squared diverge more, indicating an excess of parameters to describe the thermal behavior, at least in the percentage ranges considered. As the conclusions of this statistical study, we can say that the five oxides listed in Table 2 are the minimum, yet sufficient, number of chemical variables able to justify the trend in the thermal behavior. Please notice that, even though each single oxide has its own variability in the chemical composition (see Table 1), a high concentration in the glass formula is not necessarily relevant to the statistical model. This is the case for silica, where, statistically speaking, the compositional variations have a very mild effect on the temperature of the glass transition.
Concerning the coefficient assigned to each oxide by the model (Table 2), the higher the absolute value, the more significant the coefficient is for the model. The positive sign of the coefficient indicates that the increase in temperature is coupled with the increase of oxide concentration, while the negative sign indicates the opposite. Alumina, magnesium and antimony oxides evidently increase the Tg temperatures, whereas lead and calcium oxide have the opposite effect (Table 2). This trend partially contradicts what is documented in the literature [44,45], because antimony in silicate glass is said to lower Tg, and calcium is supposed to increase the Tg. However, given that the glasses are opaque, it can be assumed that part of the calcium and antimony oxides are in the crystalline phases. This may explain the inversion of their typical behaviour in silicate glass. In fact, the presence of a crystalline phase impedes the viscous flow with a slight increase in Tg.
Thus, the most relevant oxides in the glassy phase are alumina and lead oxide, characterised respectively by a positive and a negative coefficient. Their concentration in the glass is very low (< 3 wt.%), but their effect on the transition glass temperature is highly significant. While alumina is a contaminant of the silicate raw materials used for the preparation of the glass batch during glass-making, lead was added only during the secondary process of opacification.
The MLR model, adopting the coefficients presented in Table 2, propose the following equation:
Tg = 449.05 + 4.9168·MgO + 52.0224·Al2O3 - 6.4054· CaO + 3.6050·Sb2O3 - 6.3829·PbO
where Tg is the temperature of the first endothermic peak and MgO, Al2O3, CaO, Sb2O3 and PbO the wt% of the oxides. This model predicts the Tg values with an incredibly good correlation of R2 = 0.9734, accompanied by a slope of almost 45°, slope value = 0.9734 (Figure 3). The regression model fits well with the experimental Tg values since the fitted values are not systematically too high or low anywhere in the observation space. Additionally, the statistical significance of the estimated parameters is extremely good, evaluated by the test F, that is very low (F = 0.003014). We can, therefore, state that the addition of the lead oxide lowers the glass transition temperature, hence the glass workability.

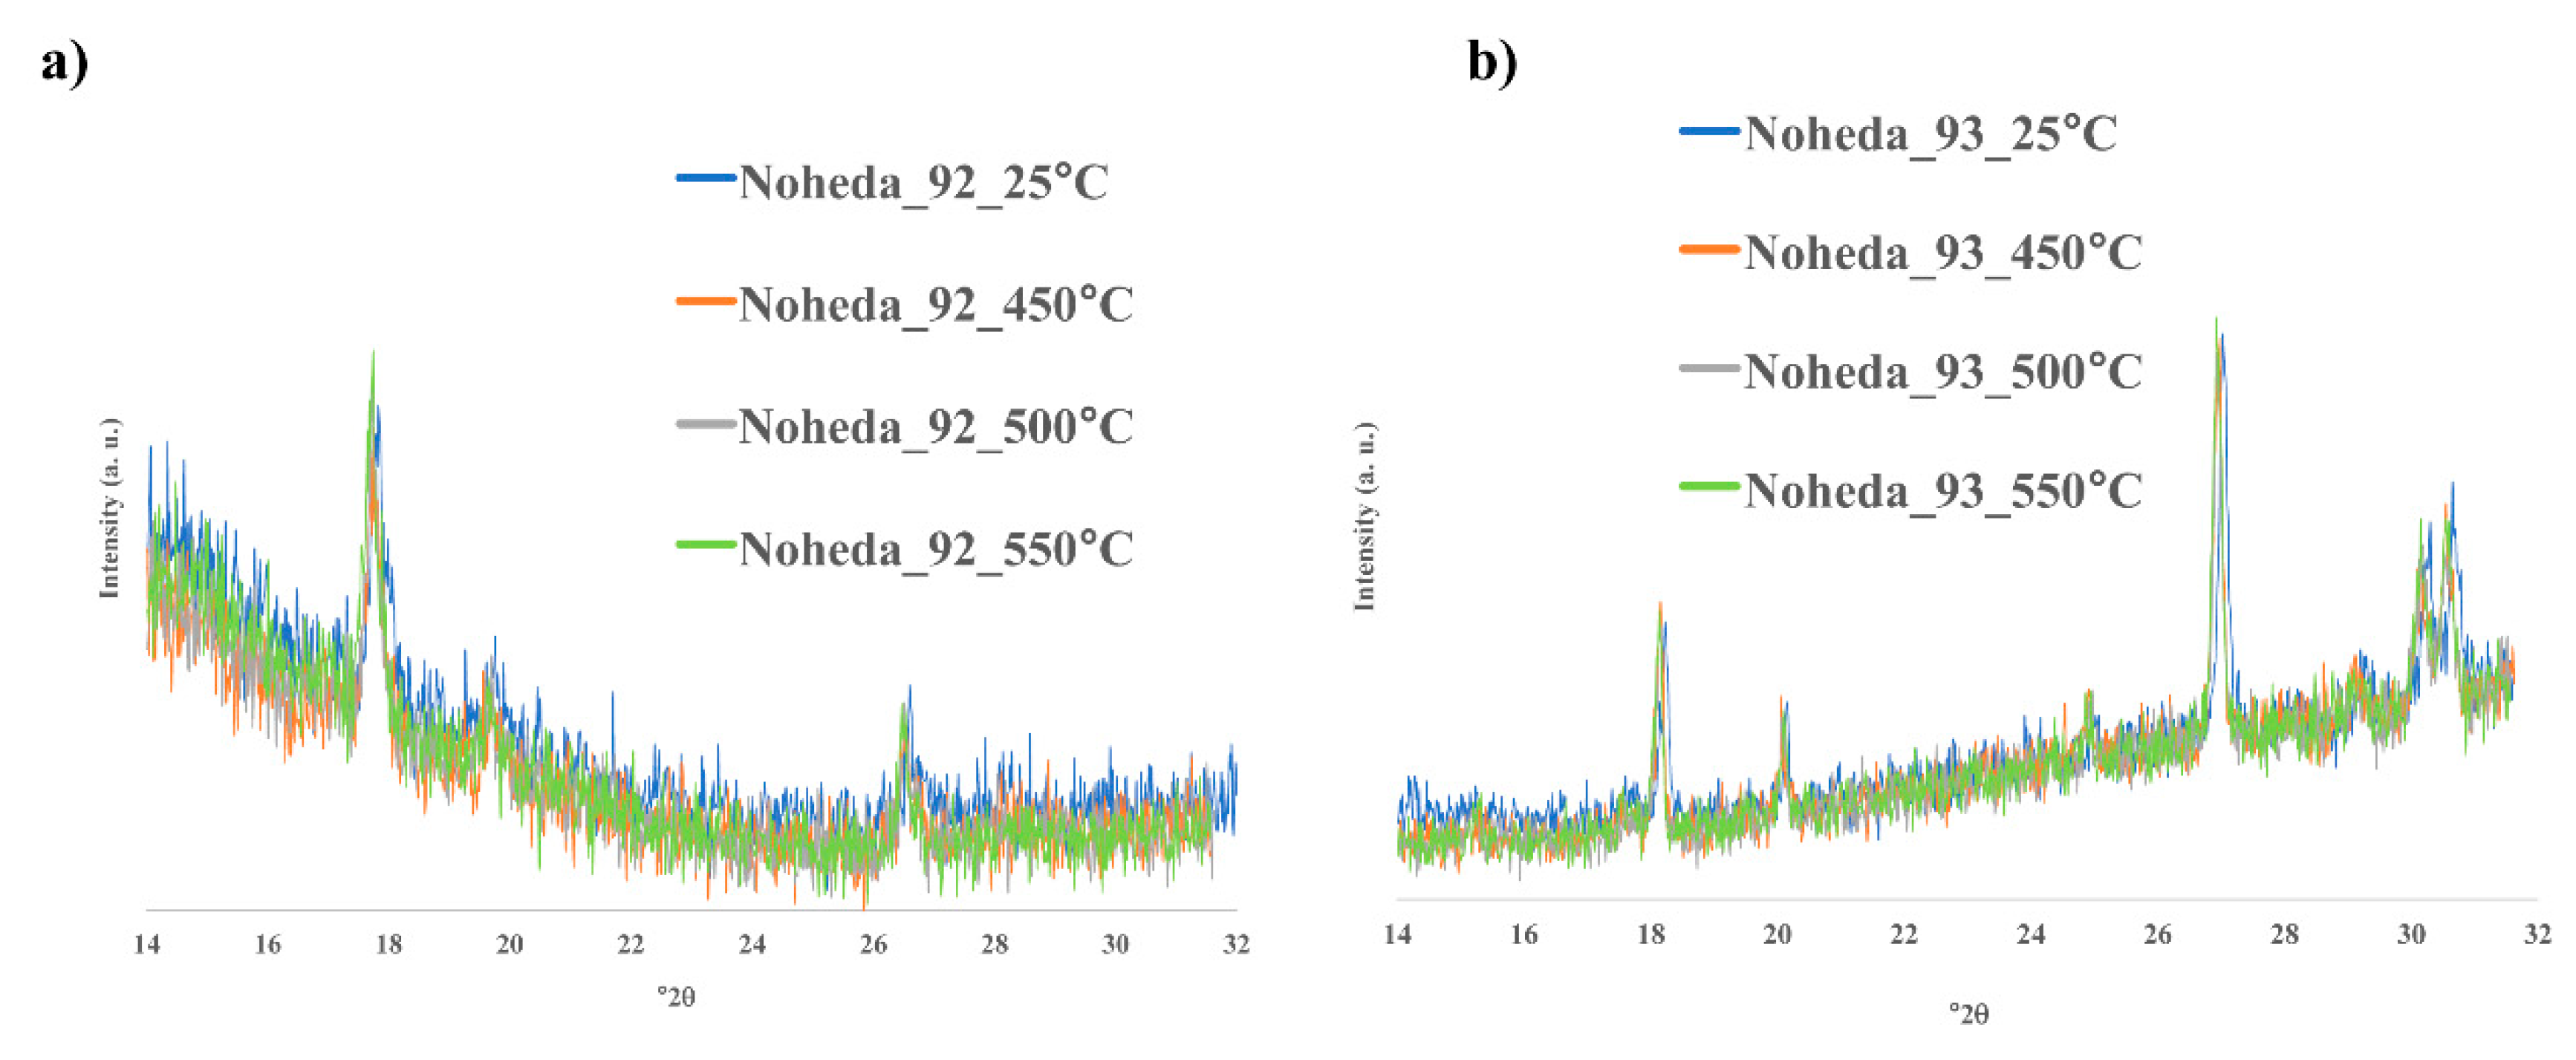
3.3. Identification of Crystalline Phases

The X-ray diffraction analyses identify two main crystalline phases (CaSb2O6 and Ca2Sb2O7) and two different diffraction patterns, represented by samples Noheda 92 and 93 (Figure 4). Sample 92 is a low-magnesium, high-lead glass, while sample 93 is high in magnesium and low in lead (Table 1). The two samples are characterized by one and two peaks in the XRD pattern, respectively, that show similar thermal behaviors in the 450-500 °C range. In both samples the XRD patterns remain practically unchanged (Figure 4), thus no crystallization processes can be identified up to 550 °C, in accordance with the absence of an exothermic crystallisation process in the DSC curve in this temperature interval. For both glass compositions, the high temperature measurements established the thermal stability of the CaSb2O6 and Ca2Sb2O7 crystalline phases in the temperature range of 25–550 °C.
High-temperature XRD between 600 and 1000 °C (14–32 °2θ) confirmed that sample Noheda 92 contains only the hexagonal crystalline phase (CaSb2O6) (Figure 5a), while in sample Noheda 93 orthorhombic crystals (Ca2Sb2O7) were also detected (Figure 5b). As the temperature approaches approximately 700 °C, the diffraction peak centred at about 18° in 2θ increases in intensity in both samples. This phenomenon is due to the growth of a new additional crystal, identified as one of the forms of SiO2. (ICSD file no: 01-082-1576, Crystal System: Anorthic, Space Group: P1, Space group number: [46]). Since only endothermic peaks occur above 600 °C in the DSC curves, it is likely that the formation of the new phase was due to the slow heating schedule adopted for the XRD in situ high temperature measurements. Both the CaSb2O6 and Ca2Sb2O7 crystalline phases proved to be stable up to a temperature of 1000 °C (magnification detail, Figure 5b). This result supports the hypothesis that the opacifier—here calcium antimonate (CaSb2O6)—was formed during the cooling phase of the glass melt [14]. The XRD patterns of both samples re-collected at the same temperatures during the cooling phase, from 1000 to 25 °C, showed no further changes compared to the patterns obtained during the first heating step, indicating that the two opaque glasses were not submitted to any further reheating cycle, such as annealing processes at temperatures higher than 700-800 °C. The crystalline form of SiO2 was irreversibly developed during heating, since it was equally observed during cooling.
The XRD patterns generally show very low intensities of the crystalline phases, indicating that the major phase is the amorphous glass matrix. The principal crystalline phase is CaSb2O6, with only small quantities of Ca2Sb2O7 crystals in some of the high magnesia samples. There is no correlation between the presence of the two crystalline phases and lead concentration. In contrast, high magnesia levels appear to have a favourable impact on the formation of calcium antimonate and, more specifically, on the precipitation of the orthorhombic form (Ca2Sb2O7). Mg2+ is a glass modifier with high field strength [47,48], and the presence of MgO appears to contribute to the segregation of CaO, which in turn may promote the formation of Ca2Sb2O7, according to the chemical reaction CaSb2O6 + CaO = Ca2Sb2O7. This hypothesis should be validated by further investigations. The absence of a crystalline silica-phase at room temperature indicates that the glass tesserae were not subjected to secondary thermal treatment that would otherwise have fostered the growth of a SiO2 phase, as observed from about 700 °C in both samples Noheda 92 and 93. The thermal stability of both Ca2Sb2O7 and CaSb2O6 crystalline forms during heating up to 1000 °C and cooling confirms that the crystals precipitated from the fluid glass during the cooling phase, starting at temperatures lower than 1000 °C (Figs. 1, 3). The presence of an appreciable amount of lead oxide dissolved in the glass matrix (PbO > 2 wt.%) has shown to favour all thermal events by reducing the peak temperature by about 20 °C (Figure 2).

4. Conclusions

The present investigation has shown that lead has no direct influence on the synthesis of either form of calcium antimonate (CaSb2O6 or Ca2Sb2O7). However, even low concentrations of lead oxide in the glass matrix lowers the temperature of all the thermal events during the process of opacification. Considering the formation of the SiO2 phase above 700 °C, we conclude that the working temperature for glass opacification was likely significantly lower than the 1100 °C estimated in the literature for the precipitation of the calcium antimonate crystals. A long thermal cycle above this temperature would have induced the separation of the silica phase, which is absent in the mosaic tesserae. Glass opacification could have been thus practiced at the same temperatures needed for glass working. It can be assumed that the elevated concentrations of lead oxide had an impact on the economy of the opacification process. The introduction of some lead, most likely as lead oxide, to the glass batch allows the glass artisans to save fuel and to shorten the times of the production process. It is, therefore, conceivable that lead oxide was deliberately added, or that raw materials containing lead were intentionally selected for this purpose.

Supplementary Materials

The following are available online at https://0-www-mdpi-com.brum.beds.ac.uk/2571-9408/3/2/32/s1.

Author Contributions

Conceptualization, C.B., C.L. and N.S.; Data curation, C.B., C.L., R.R. and N.S.; Formal analysis, C.L., R.R., M.R. and N.S.; Funding acquisition, N.S.; Methodology, C.B., C.L., M.R. and N.S.; Visualization, C.B., C.L., R.R., N.S., M.R., M.Á.V.T.; Writing – original draft, C.B., C.L., R.R., M.R. and N.S.; Writing – review & editing, C.B., C.L., R.R., M.R. and N.S. The archaeological material was provided by M.Á.V.T. All authors have read and agreed to the published version of the manuscript.

Funding

This project has received funding from the European Research Council (ERC) under the European Union’s Horizon 2020 research and innovation programme (GlassRoutesfigure, grant agreement No. 647315 to NS).

Acknowledgments

We wish to thank Cecilia Rossi and Massimo Tonelli (CIGS-Università di Modena e Reggio Emilia) for their assistance during the XRD analyses and Paola Miselli (Dipartimento di Ingegneria “Enzo Ferrari”, Università di Modena e Reggio Emilia) for her assistance during the DSC analyses.

Conflicts of Interest

The authors declare no conflict of interest. The funding organisations had no influence in the study design, data collection and analysis, decision to publish, or preparation of the manuscript.

References

  1. Shortland, A.J. The use and origin of antimonate colorants in early Egyptian glass. Archaeometry 2002, 44, 517–530. [Google Scholar] [CrossRef]
  2. Tite, M.; Shortland, A.; Paynter, S. The beginnings of vitreous materials in the Near East and Egypt. Acc. Chem. Res. 2002, 35, 585–593. [Google Scholar] [CrossRef] [PubMed]
  3. Turner, W.E.S.; Rooksby, H.P. A study of the opalising agents in ancient opal glasses throughout three thousand four hundred years. Glastech. Ber. 1959, 8, 17–28. [Google Scholar]
  4. Rutten, F.J.M.; Briggs, D.; Henderson, J.; Roe, M.J. The application of time-of-flight secondary ion mass spectrometry (Tof-SIMS) to the characterization of opaque ancient glasses. Archaeometry 2009, 51, 966–986. [Google Scholar] [CrossRef]
  5. Duckworth, C.N.; Henderson, J.; Rutten, F.J.M.; Nikita, K. Opacifiers in Late Bronze Age glasses: The use of ToF-SIMS to identify raw ingredients and production techniques. J. Archaeol. Sci. 2012, 39, 2143–2152. [Google Scholar] [CrossRef] [Green Version]
  6. Licenziati, F.; Calligaro, T. Study of mosaic glass tesserae from Delos, Greece using a combination of portable μ-Raman and X-ray fluorescence spectrometry. J. Archaeol. Sci. Rep. 2016, 7, 640–649. [Google Scholar] [CrossRef]
  7. Venclová, N.; Křížová, Š.; Dillingerová, V.; Vaculovič, T. Hellenistic cast monochrome glass vessels from Staré Hradisko, 2nd–1st cent. BCE. J. Archaeol. Sci. Rep. 2018, 22, 540–549. [Google Scholar] [CrossRef]
  8. Boschetti, C.; Henderson, J.; Evans, J.; Leonelli, C. Mosaic tesserae from Italy and the production of Mediterranean coloured glass (4rd century BCE–4th century CE). Part I: Chemical composition and technology. J. Archaeol. Sci. Rep. 2016, 7, 303–311. [Google Scholar] [CrossRef]
  9. Boschetti, C.; Mantovani, V.; Leonelli, C. Glass coloring and recycling in Late Antiquity: A new case study from Aquileia (Italy). J. Glass Stud. 2016, 58, 69–86. [Google Scholar]
  10. Gliozzo, E.; Santagostino Barbone, A.; Turchiano, M.; Memmi, I.; Volpe, G. The coloured tesserae decorating the vaults of the Faragola balneum (Ascoli Satriano, Foggia, Southern Italy). Archaeometry 2012, 54, 311–331. [Google Scholar] [CrossRef]
  11. Henderson, J. The raw materials of early glass production. Oxf. J. Archaeol. 1985, 4, 267–291. [Google Scholar] [CrossRef]
  12. Lahlil, S.; Biron, I.; Cotte, M.; Susini, J. New insight on the in situ crystallization of calcium antimonate opacified glass during the Roman period. Appl. Phys. A Mater. Sci. Process. 2010, 100, 683–692. [Google Scholar] [CrossRef]
  13. Lahlil, S.; Biron, I.; Cotte, M.; Susini, J.; Menguy, N. Synthesis of calcium antimonate nano-crystals by the 18th dynasty Egyptian glassmakers. Appl. Phys. A Mater. Sci. Process. 2010, 98, 1–8. [Google Scholar] [CrossRef] [Green Version]
  14. Lahlil, S.; Biron, I.; Galoisy, L.; Morin, G. Rediscovering ancient glass technologies through the examination of opacifier crystals. Appl. Phys. A Mater. Sci. Process. 2008, 92, 109–116. [Google Scholar] [CrossRef]
  15. Maltoni, S.; Silvestri, A.; Marcante, A.; Molin, G. The transition from Roman to Late Antique glass: New insights from the Domus of Tito Macro in Aquileia (Italy). J. Archaeol. Sci. 2016, 73, 1–16. [Google Scholar] [CrossRef]
  16. Neri, E.; Verita, M.; Conventi, A. Glass mosaic tesserae from the 5th-6th century baptistery of San Giovanni alle Fonti, Milan, Italy. Analytical investigations. In New Light on Old Glass: Recent Research on Byzantine Mosaics and Glass; Entwistle, C., James, L., Eds.; British Museum Press: London, UK, 2013; pp. 1–10. [Google Scholar]
  17. Schibille, N.; Neri, E.; Ebanista, C.; Ammar, M.R.; Bisconti, F. Something old, something new: The late antique mosaics from the catacomb of San Gennaro (Naples). J. Archaeol. Sci. Rep. 2018, 20, 411–422. [Google Scholar] [CrossRef]
  18. Silvestri, A.; Tonietto, S.; Molin, G.; Guerriero, P. The palaeo-Christian glass mosaic of St. Prosdocimus (Padova, Italy): Archaeometric characterisation of tesserae with antimony-or phosphorus-based opacifiers. J. Archaeol. Sci. 2012, 39, 2177–2190. [Google Scholar] [CrossRef]
  19. Wypyski, M.T.; Becker, L. Glassmaking technology at Antioch: Evidence from the Atrium House Triclinium and later mosaics. In The Arts of Antioch—Art Historical and Scientific Approaches to Roman Mosaics; Becker, L., Kondoleon, C., Eds.; Worcester Art Museum: Worcester, MA, USA, 2005; pp. 115–175. [Google Scholar]
  20. Gliozzo, E.; Barbone, A.S.; D’Acapito, F.; Turchiano, M.; Memmi, I.T.; Volpe, G. The Sectilia Panels of Faragola (Ascoli Satriano, Southern Italy): A Multi-Analytical Study of the Green, Marbled (Green and Yellow), Blue and Blackish Glass Slabs. Archaeometry 2010, 52, 389–415. [Google Scholar] [CrossRef]
  21. Tesser, E.; Verità, M.; Lazzarini, L.; Falcone, R.; Saguì, L.; Antonelli, F. Glass in imitation of exotic marbles: An analytical investigation of 2nd-century AD Roman sectilia from the Gorga collection. J. Cult. Herit. 2019. [Google Scholar] [CrossRef]
  22. Tite, M.; Pradell, T.; Shortland, A. Discovery, production and use of tin-based opacifiers in glasses, enamels and glazes from the late iron age onwards: A reassessment. Archaeometry 2008, 50, 67–84. [Google Scholar] [CrossRef]
  23. Uboldi, M.; Verita, M. Scientific analyses of glasses from Late Antique and Early Medieval archeological sites in Northern Italy. J. Glass Stud. 2003, 45, 115–137. [Google Scholar]
  24. Neri, E.; Jackson, M.; O’Hea, M.; Gregory, T.; Blet-Lemarquand, M.; Schibille, N. Analyses of glass tesserae from Kilise Tepe: New insights into an early Byzantine production technology. J. Archaeol. Sci. Rep. 2017, 11, 600–612. [Google Scholar] [CrossRef]
  25. Schibille, N.; Gratuze, B.; Ollivier, E.; Blondeau, É. Chronology of early Islamic glass compositions from Egypt. J. Archaeol. Sci. 2019, 104, 10–18. [Google Scholar] [CrossRef]
  26. Tite, M.; Watson, O.; Pradell, T.; Matin, M.; Molina, G.; Domoney, K.; Bouquillon, A. Revisiting the beginnings of tin-opacified Islamic glazes. J. Archaeol. Sci. 2015, 57, 80–91. [Google Scholar] [CrossRef] [Green Version]
  27. Moretti, C.; Salerno, C.S.; Ferroni, S.T. Ricette Vetrarie Muranesi: Gasparo Brunoro e il Manoscritto di Danzica; Nardini Florence: Florence, Italy, 2004. [Google Scholar]
  28. Wainwright, I.N.; Taylor, J.M.; Harley, R.D. Lead antimonate yellow. In Artists’ Pigments: A Handbook of Their History and Characteristics; National Gallery of Art; Cambridge University Press: Washington DC, USA, 1986; Volume 1, pp. 219–254. [Google Scholar]
  29. Freestone, I.C. Laboratory studies of the Portland Vase. J. Glass Stud. 1990, 32, 103–107. [Google Scholar]
  30. Freestone, I.C.; Stapleton, C. Composition technology and production of coloured glasses from Roman mosaic vessels. In Glass of the Roman World; Bayley, J., Freestone, I.C., Jackson, C., Eds.; Oxbow: Oxford, UK, 2015; pp. 61–76. [Google Scholar]
  31. Gedzevičiūtė, V.; Welter, N.; Schüssler, U.; Weiss, C. Chemical composition and colouring agents of Roman mosaic and millefiori glass, studied by electron microprobe analysis and Raman microspectroscopy. Archaeol. Anthropol. Sci. 2009, 1, 15–29. [Google Scholar] [CrossRef] [Green Version]
  32. Paynter, S.; Jackson, C. Clarity and brilliance: Antimony in colourless natron glass explored using Roman glass found in Britain. Archaeol. Anthropol. Sci. 2018, 1–19. [Google Scholar] [CrossRef] [Green Version]
  33. Roberts, P.; Gudenrath, W.; Tatton-Brown, V.; Whitehouse, D. Roman Cameo Glass in the British Museum; British Museum Publications Limited: London, UK, 2010. [Google Scholar]
  34. Sablerolles, Y.; Henderson, J.; Dijkman, W. Early medieval glass bead-making in Maastricht (Jodenstraat 30), The Netherlands. An archaeological and scientific investigation. In Perlen: Archäologie, Techniken, Analysen; Akten des Internationalen Perlensymposiums in Mannheim vom 11. bis 14. November 1994; von Freeden, U., Wiczorek, A., Eds.; Habelt: Bonn, Germany, 1997; pp. 225–226, 293–314. [Google Scholar]
  35. Verità, M. Perle vitree dalle necropoli longobarde in Italia. Natura dei materiali e tecniche di lavorazione. In Archeologia Medievale a Trezzo Sull’Adda. Il Sepolcreto Longobardo e l’Oratorio di San Martino. Le chiese di Santo Stefano e San Michele in Sallianense; Contributi di Archeologia; V&P Vita e Pensiero: Milano, Italy, 2012; pp. 355–378. [Google Scholar]
  36. Drünert, F.; Palamara, E.; Zacharias, N.; Wondraczek, L.; Möncke, D. Ancient Roman nano-technology: Insight into the manufacture of mosaic tesserae opacified by calcium antimonate. J. Eur. Ceram. Soc. 2018, 38, 4799–4805. [Google Scholar] [CrossRef]
  37. Schibille, N.; Boschetti, C.; Valero Tévar, M.Á.; De Juan Ares, J.; Veron, E. The colour palette of the mosaics in the Roman villa of Noheda (Spain). Minerals 2020, 10, 272. [Google Scholar] [CrossRef] [Green Version]
  38. Montanari, F.; Miselli, P.; Leonelli, C.; Boschetti, C.; Henderson, J.; Baraldi, P. Calibration and use of the heating microscope for indirect evaluation of the viscosity and meltability of archeological glasses. Int. J. Appl. Glass Sci. 2014, 5, 161–177. [Google Scholar] [CrossRef]
  39. Jobson, J.D. Applied Multivariate Data Analysis Volume I: Regression and Experimental Design; Springer: Berlin/Heidelberg, Germany, 1991. [Google Scholar]
  40. Gualtieri, A.F.; Andreozzi, G.B.; Giacobbe, C.; Lusvardi, G.; Viti, C. Structural and spectroscopic characterization of anorthite synthesized from secondary raw materials. Periodico di Mineralogia 2011, 80, 231–245. [Google Scholar] [CrossRef]
  41. Zheng, Q.; Zhang, Y.; Montazerian, M.; Gulbiten, O.; Mauro, J.C.; Zanotto, E.D.; Yue, Y. Understanding Glass through Differential Scanning Calorimetry. Chem. Rev. 2019, 119, 7848–7939. [Google Scholar] [CrossRef] [PubMed]
  42. Lara, C.; Pascual, M.; Duran, A. Glass-forming ability, sinterability and thermal properties in the systems RO–BaO–SiO2 (R = Mg, Zn). J. Non-Cryst. Solids 2004, 348, 149–155. [Google Scholar] [CrossRef]
  43. Wiesenberg, F. Experimentelle Archäologie: Römische Glasöfen: Rekonstruktion und Betrieb einer Glashütte nach römischem Vorbild in der Villa Borg: “Borg Furnace Project 2013”. 2014. Available online: http://openarchaeology.info/bibliography/experimentelle-archaologie-romische-glasofen-rekonstruktion-und-betrieb-einer-glashutte (accessed on 25 June 2020).
  44. Shelby, J.E. Introduction to Glass Science and Technology; Royal Society of Chemistry: Cambridge, UK, 2005. [Google Scholar]
  45. Mee, M.; Davies, B.C.; Orman, R.G.; Thomas, M.F.; Holland, D. Antimony and silicon environments in antimony silicate glasses. J. Solid State Chem. 2010, 183, 1925–1934. [Google Scholar] [CrossRef]
  46. Nakagawa, K.; Izumitani, T. Metastable phase separation and crystallization of Li2O Al2O3 SiO3 glasses: Determination of miscibility gap from the lattice parameters of precipitated β-quartz solid solution. J. Non-Cryst. Solids 1972, 7, 168–180. [Google Scholar] [CrossRef]
  47. Boisen, M.B., Jr.; Gibbs, G.V.; Bukowinski, M.S.T. Framework silica structures generated using simulated annealing with a potential energy function based on an H 6 Si 2 O 7 molecule. Phys. Chem. Miner. 1994, 21, 269–284. [Google Scholar] [CrossRef]
  48. Vogel, W. Glass Chemistry; Springer Science & Business Media: Berlin/Heidelberg, Germany, 1994. [Google Scholar]
Figure 1. DSC curves of Noheda 93, 84 and 92 samples, showing one, two and three endothermic peaks, respectively. Sample 93: one peak, at 542 °C. Sample 84: one peak at 539 °C and one peak at 1129 °C (the tiny peak at 610 °C is not significant for a thermal event, but is probably an effect of sample preparation). Sample 92: one peak at 520, second peak at 613 and third peak at 1146 °C. In the three samples, some peaks (around 120 and 300 °C) might be due to the loss of water absorbed by the powdered sample.
Heritage 03 00032 g001
Figure 2. Correlation between the temperature and lead oxide concentration for the first (blue) and the second (orange) thermal event.
Heritage 03 00032 g002
Figure 3. Correlation between the first Tg temperature for the DSC curves (X) and the value predicted by the MLR model (Y) adopting the coefficients presented in Table 2. Error bar is reported only for experimental values.
Heritage 03 00032 g003
Figure 4. High temperature in situ XRD patterns collected on samples Noheda 92 (a) and Noheda 93 (b) during heating, in the temperature range 25-550 °C.
Heritage 03 00032 g004
Figure 5. XRD pattern for the samples 092 (a) and 093 (b) at the most significant temperatures.
Heritage 03 00032 g005
Table 1. Major and minor elements of the 10 white tesserae from Noheda analysed by LA-ICP-MS (wt%) [37] and temperatures (°C) of the three endothermic peaks observed by DSC analysis (DSC peak temperature ±2 °C, due to peak maximum identification).
SampleNa2OMgOAl2O3SiO2P2O5ClK2OCaOTiO2MnOFe2O3CuOSb2O3PbOFirst Peak (Tg)Second Peak (Tg)Third Peak (Tm)
Noheda 07115.83.091.9766.10.030.850.446.130.070.030.440.004.800.02545619-
Noheda 07614.74.031.6862.70.020.900.436.710.060.010.340.008.090.16539--
Noheda 07713.30.352.4866.80.100.840.346.760.050.030.310.007.101.435536201154
Noheda 08016.80.401.9665.50.021.100.495.430.080.100.430.015.062.475226091132
Noheda 08415.93.621.9063.90.040.680.466.890.080.020.570.005.170.64539-1129
Noheda 08615.92.571.9765.40.040.710.507.020.080.020.520.005.140.01536--
Noheda 09217.10.401.9565.40.031.250.525.270.080.100.430.014.902.345206131146
Noheda 09314.61.511.6964.70.080.880.516.010.070.040.450.029.230.03541--
Noheda 09916.90.402.0267.60.030.940.505.250.090.070.490.014.501.085316161122
Noheda 10613.20.392.0666.30.180.630.565.950.050.620.360.017.881.685375891155
Table 2. Coefficients adopted in the MLR for the five oxides that provided the better data fitting (See Equation (1) and Figure 3).
CoefficientStandard Error
MgO4.9168±1.5874
Al2O352.0224±7.8020
CaO−6.4054±2.9516
Sb2O33.6050±0.6639
PbO−6.3829±1.3941

