Article

Visual Quality Assessment of Historical Street Scenes: A Case Study of the First “Real” Street Established in Baghdad

1
Department of Landscape Architecture, Faculty of Design and Architecture, Universiti Putra Malaysia, Serdang 43400, Malaysia
2
Department of Architecture, Faculty of Built Environment, University of Malaya, Kuala Lumpur 50603, Malaysia
3
The Doctoral School of Architecture, “Ion Mincu” University of Architecture and Urban Planning, 010014 Bucharest, Romania
4
Department of Architecture, College of Engineering, Mustansiriya University, Baghdad 14022, Iraq
*
Author to whom correspondence should be addressed.
Submission received: 25 October 2022 / Revised: 23 November 2022 / Accepted: 24 November 2022 / Published: 27 November 2022

Abstract

:
Historical street scenes materialize essential cultural and artistic values for the cities in which they are located and their citizens. However, the visual quality of historical scenes is susceptible to a number of causes that could result in their deterioration. These causes can be environmental or man-made, with either generating elements that may influence the perceived visual quality of historical scenes. Therefore, this research is to assess the visual quality of historical street scenes and identify the elements that can potentially impact them. The study adopted a photo survey approach employing a Likert Scale as the main method to assess visual quality. In addition, a heatmap analysis technique was utilized to identify the elements that impact the visual quality of historical street scenes. The results indicate respondents’ high levels of dissatisfaction with the visual quality of Baghdad’s historical street scenes. The results also showed that modern facade materials, security concrete walls, and degraded buildings’ facades are elements that had a negative impact to the overall scenic quality. On the other hand, historical religious buildings, urban greenery, and unique historical buildings are elements that have a positive impact on the visual quality of historical street scenes. This research represents an approach for evaluating the visual impact and visual quality of historical street scenes, providing a quantitative tool for future initiatives focusing on the visual quality of historical legacy scenes. This research is a starting point for both researchers in urban conservation and architectural history, and municipal offices of improving the visual quality of historic streets scenes.

1. Introduction

A heritage area that contains scenes of historical buildings and expresses the country’s culture is crucial for the sustainability of the community’s culture [1]. In Section 1 of the United Nations Educational, Scientific, and Cultural Organization (UNESCO), the World Heritage Convention states that a historic district with distinctive groups of buildings has historical, artistic, or scientific value. UNESCO’s definition of groupings of buildings, on the other hand, depends on evaluation criteria for cultural heritage values. Similarly, UNESCO proposed in Goal 11 of the Sustainable Development Goals (SDGs) of the United Nations 2030 Agenda that “cities and urban areas be made inclusive, safe, resilient, and sustainable by reinforcing efforts to protect and safeguard the world’s cultural and natural heritage”. Historic districts are part of the city’s cultural history and the preservation of historic urban views can contribute to the development of sustainable urban elements [2]. This is owing to the fact that historic buildings are not only beautiful and attractive due to the designated building materials, structure, and architectural style, but also the human cultural traits and local elements of historical scenes [3]. In heritage scenes, historical elements are physical parts of cultural heritage that create an identity we identify with, reminding us that historic buildings provide a “sense of place” in addition to aesthetic appreciation [4]. However, these regions have been subjected over time to numerous political, economic, and physical influences. As a result, numerous historic areas have been demolished and rebuilt with newer functions in order to meet the demands of modern development, which has negatively impacted their economic and social value.
Historic districts and their streets are among the most significant components of historical city centers, placing them at the forefront of places needing clear guidelines to address their issues so that they can be sustained for future generations [5,6]. As one of the multifunctional components of a city, street space is a common open area that not only serves as a traffic conduit but also connects urban environmental elements; also, it is significant in determining the cultural, social, economic, and political functions of a city and is the first distinguishing feature that determines the character of a place [7,8,9]. Street environments encourage outdoor activities and hence influence community behavior [10,11]. Urban streets are essential to the livability of any city highlighting lifestyle features that are determined by activity patterns based on a population’s cultural values [12]. Subsequently, the character of a place depends on the community’s appreciation. Investigating the perceptual preferences of the public will significantly contribute to the visual quality assessment of historical street scenes, ultimately leading to the preservation of the heritage scenes [13].

1.1. Research Background

The visual experience in urban spaces is essential for developing a fulfilling experience for users of historical urban streets. The manifestation of a positive visual image of urban space will foster the creation of positive impressions and connotations, therefore inspiring the users to react favorably to its urban environment [14]. In addition, to build effective urban street assessment tools, it is vital to increase and encourage community engagement in the process of controlling the visual quality of urban areas by assessing the visual quality of street scenes. Tang and Long [11] mentioned that, when streets are equipped with an adequate form or design, they have the potential to increase physical functionality and may trigger an emotional appeal. Furthermore, the social meaning and symbolic image of a street space may be associated with its perceived feeling [15].
The relationship between the historical character of the environment and local culture is intimately and inseparably interrelated. This relationship results from the human preference for each physical environment and generates unique and inimitable scenes. Moreover, the historic character and local culture play an important role in determining human activities in public spaces [3]. This distinguishing specificity can be extrapolated by visual quality within the districts of historical street scenes [16]. The visual quality assessment constitutes an umbrella concept that is composed of an ideal way to analyze scenes in terms of how it is perceived by the general public [17]. The value of visual quality assessment has become an integral component of protecting cultural landscapes. The human visual system is primarily responsible for the perception of scenes [18]. Visual perception is superior to all other senses in terms of perceptual capacity, level of cognition, and utilization of time and space [19]. The assessment of the visual quality of historical street scenes can go from “point” work with a single conserved building to systematic, complicated initiatives, resulting in an expansion of scene scope. Furthermore, the historical scene’s humanitarian component is being bolstered, which needs a comprehension of the distinctive characteristics and “spirit” of a scene in relation to its place, people, preferences, and identity [20]. The visual quality is used to assess street scenes in relation to their environmental conditions and level of service, safety, comfort, convenience, continuity, and aesthetics [11]. However, environmental conditions can impact the visual quality of a place; with scenes of a place that can have either a negative or positive visual impact [13]. According to Cengiz [21], the visual quality is the positive or negative effects evoked by the characteristics of the environment on people. Additionally, according to Mohamed et al. [22], the visual quality is related to positive or negative preferences and it is described as the condition, character, and manner in which it is desired and valued by both experts and the public.
Tang and Long [11] have identified five categories of approaches that have been employed to assess the visual quality of urban streets in general. These approaches are: (1) the subjective perception assessment category, which includes interviews [23] or in-person questionnaires [24]; (2) the systematic observation and rating of streetscapes, which includes the rating of site surveying based imagery through various techniques such as videotaping or street view pictures [25]; (3) physiological monitoring and analysis, which includes Electroencephalograms (EEG) [26] and eye tracking metrics [27]; (4) laboratory experiments and analysis, which includes virtual reality (VR) [28] and augmented reality (AR) [29]; and (5) computer-assisted auditing and evaluation, which includes the incorporation of GIS data, remote sensing, and image processing, as well as the incorporation of machine-learning-assisted methods [30,31]. This study proposes a user-cantered assessment approach with a mixture between the “systematic observation and rating of streetscapes approach” through the rating of the perceived pictorial visual quality using a Likert scale technique and clicks heatmap analysis that can be interpreted as a “physiological monitoring and analysis approach” through a triggered response to a click on a pictorial region. Therefore, this study attempts to assess the visual quality of urban streets through the inclusion of the streets’ users as the basis of the assessment in terms of rating the street’s scenic visual quality as well as identifying the influencing factors through click heatmap analysis. Consequently, the results may aid in the identification of critical aspects and factors of the perceived visual quality of a built environment

1.2. The Study Aim

The conservation and sustainability of historical street scenes consider the community’s cultural approach as a key influence for local communities. Therefore, sustainable development of the historical street scenes requires not just the preservation of old buildings, but also a focus on the requirements of local communities. A study by Azizi et al. [4] indicated that a lack of conservation-trained staff and a lack of specialists were the greatest obstacles to the preservation of historic street scenes. Therefore, the issue of historical scenic conservation became a concern for both researchers and local authorities alike, with monitoring/surveying efforts being at the center of these initiatives. In addition, the necessity to identify elements and factors that impact the sustainability of the visual quality of historical street scenes is apparent. However, there is a paucity of research initiatives that have been conducted on the assessment of visual quality historical street scenes. Hence, this study has a twofold aim:
  • To assess the visual quality of historical street scenes in Baghdad.
  • To identify elements and factors their impact on the visual quality assessment of historical street scenes in Baghdad.

2. Materials and Methods
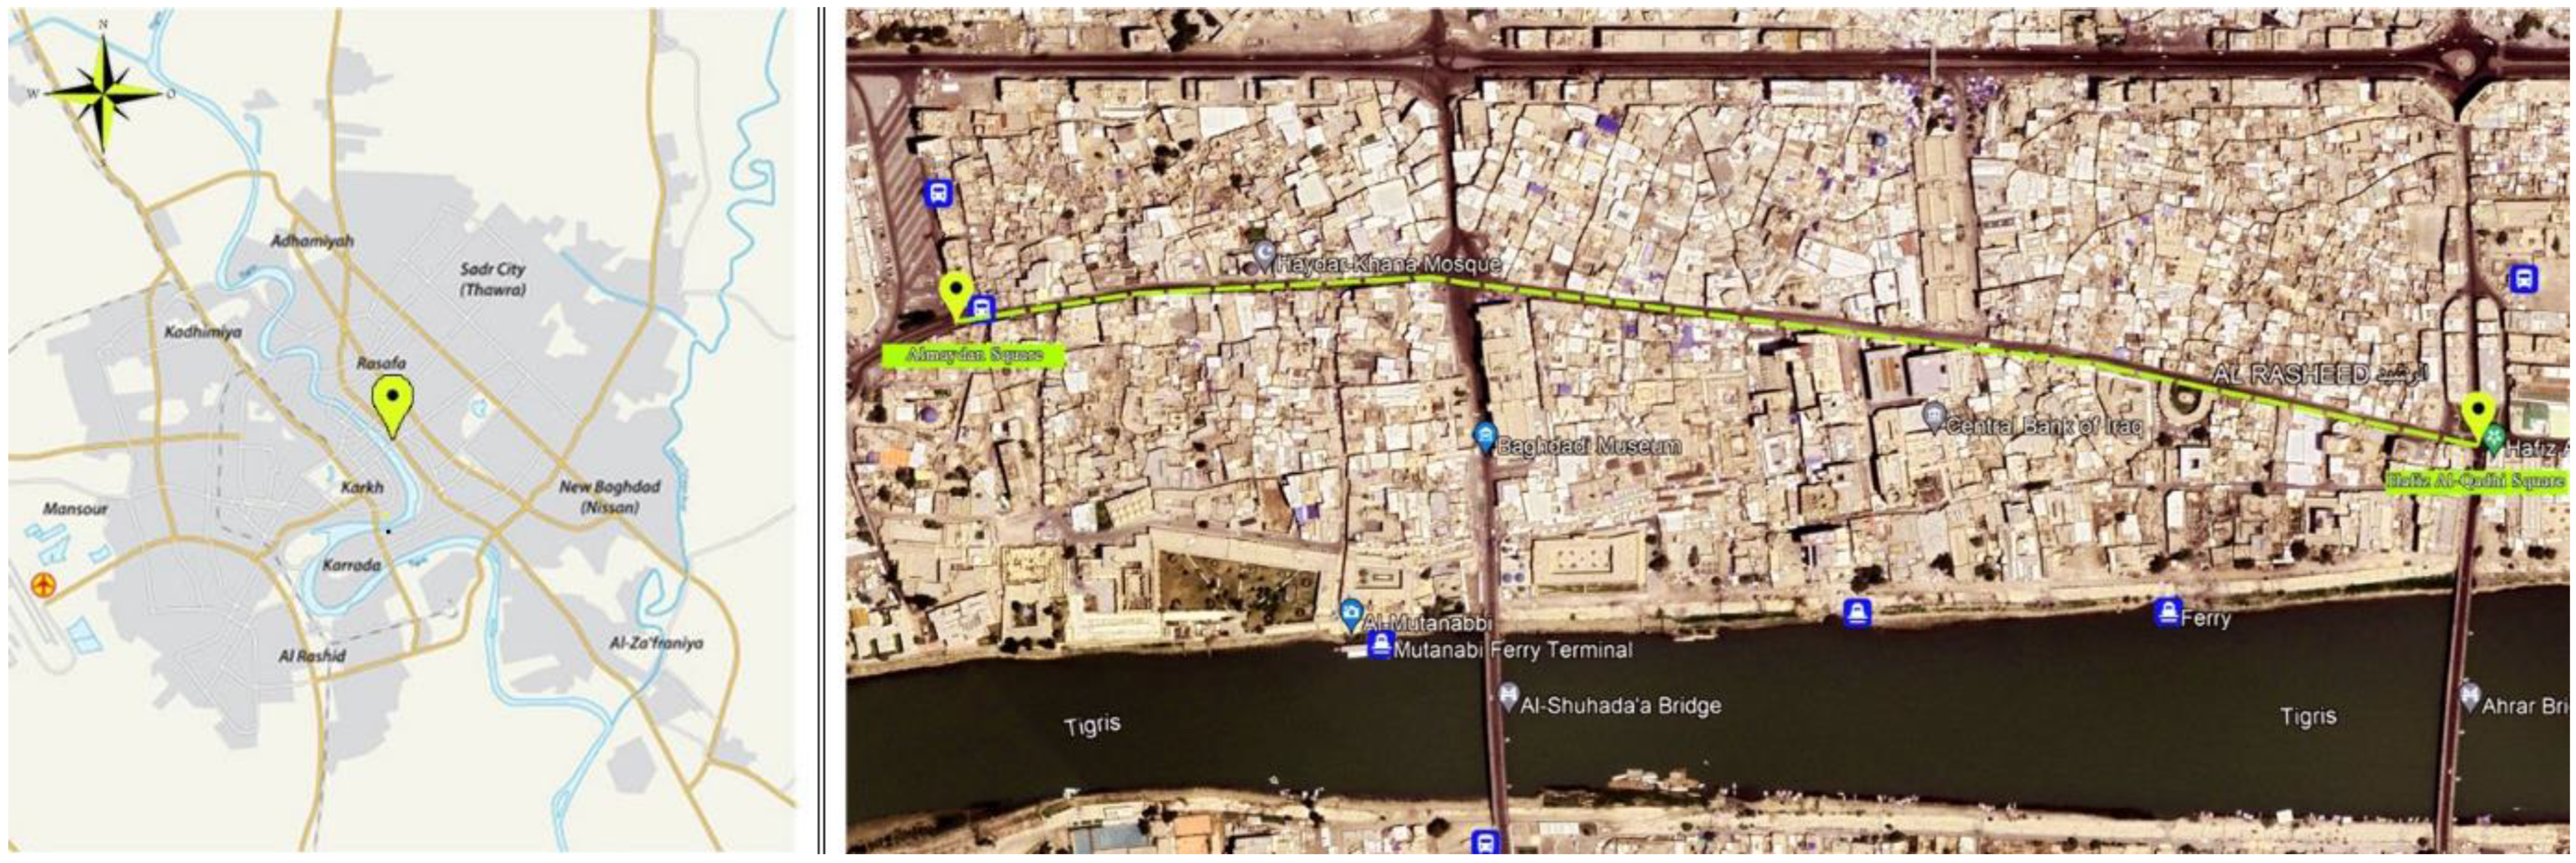
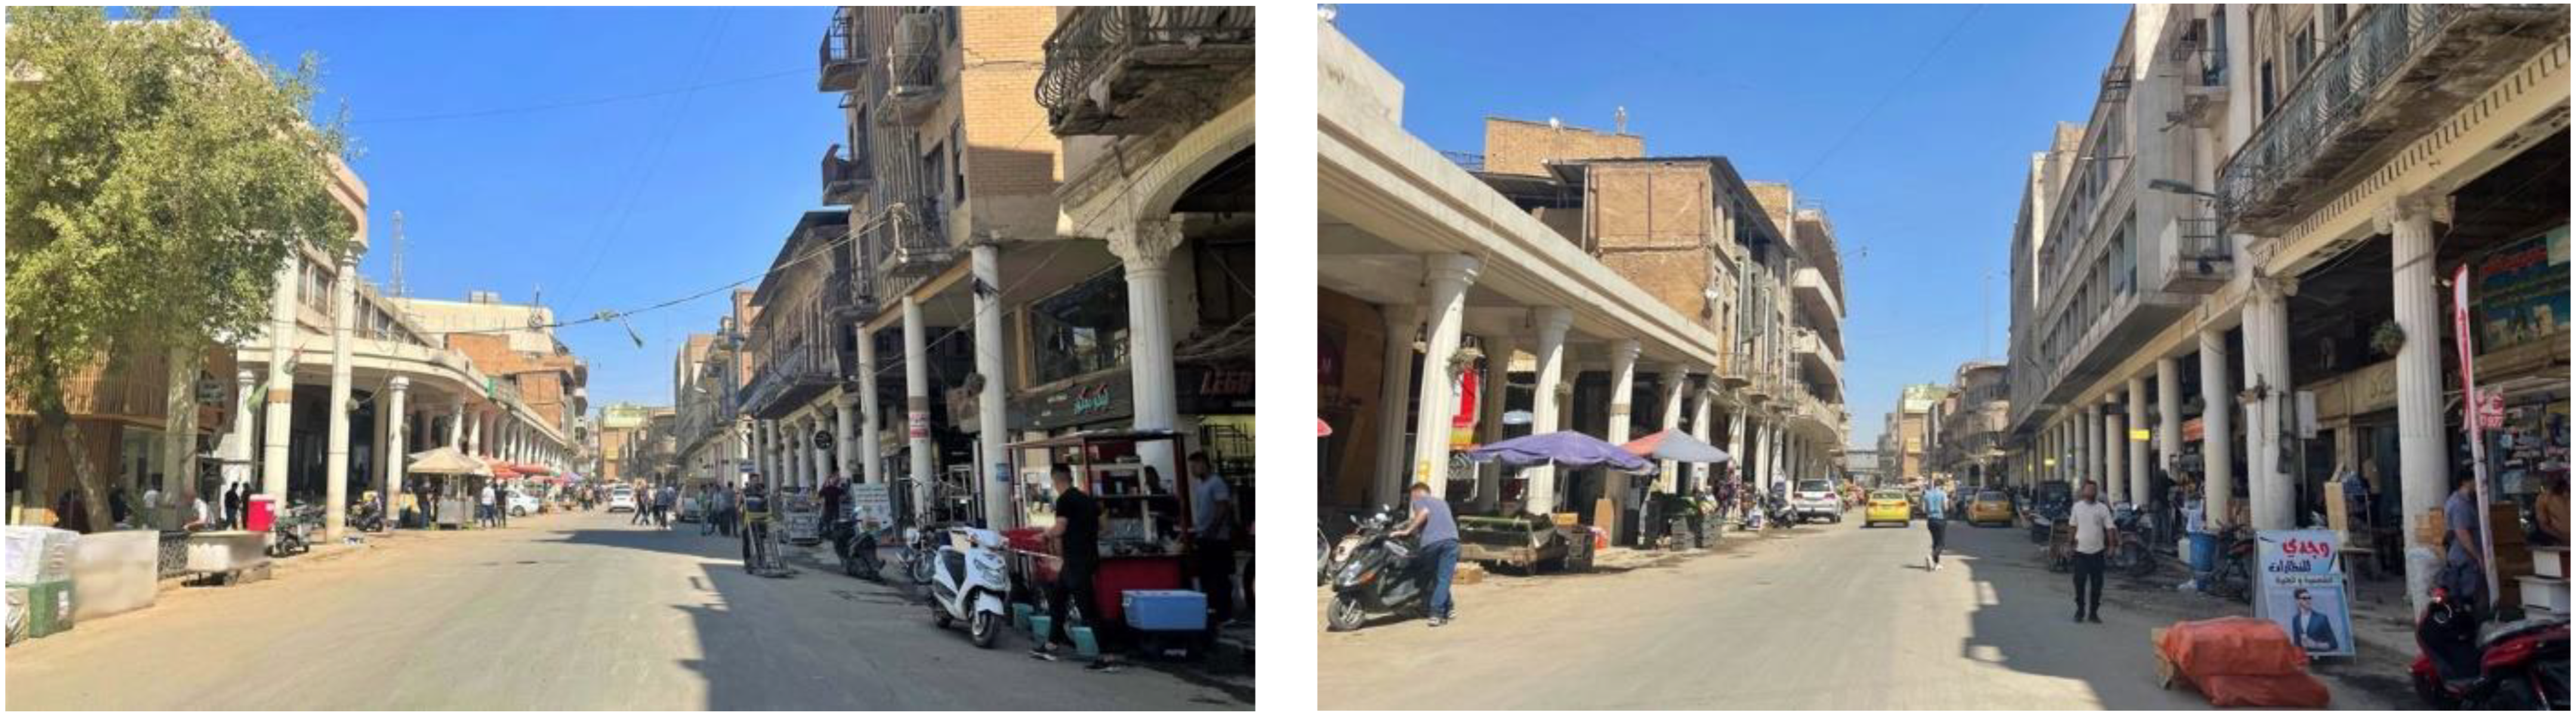
2.1. Study Area

Baghdad, the Round City and the capital of the Abbasid Caliphate, was constructed on the western banks of the Tigris River in the year 762 A.D. Since then, Baghdad has experienced a multitude of obstacles that have destroyed some of its architectural gems. The Round City could not withstand the powers of nature and was destroyed in the 10th century by a massive flood. Since then, the new Baghdad at Rusafa on the river’s eastern bank has thrived. However, floods and foreign invasions have continuously damaged the city’s historical monuments. However, the medieval city core of Baghdad still contains some of the city’s most fascinating heritage sites. The majority of Baghdad’s monuments and heritage sites are located between the Tigris River and Khulafa’a Street, the primary historic district of Baghdad’s historical city center [32]. This district is comprised of three important urban components: Al Rashid Street, the Tigris River, and the alleyways of the old souk.
This study was conducted on a portion of Al-Rashid Street, a historic street with numerous historical buildings in Baghdad’s city center; despite many factors that led to the degradation of its historic city center over the years, the Al-Rashid historical street still retains many historically significant buildings. Al-Rashid Street is considered as the first “real” street to be constructed in Baghdad. At the time, it was a political decision that was made for military purposes by the Ottoman ruler of the city. Al Rashid Street was also a symbol of the modern movement after the introduction of cars. The street was first opened to the public on 23 July 1916. Al-Rashid Street is approximately 3120 m long and from 9 to 14 m in width and it does not span in a straight line. The street begins at Al-Jumhuriya Bridge and it runs almost parallel to the Tigris River until it reaches Al-Maydan Square [33]. The arcaded buildings on both of its sides provide the colonnaded walkways and a sense of unity and continuity. There are 379 buildings on the street that vary greatly in age, architectural style, and the number of levels. The majority of the buildings are in a bad physical condition, although a few are in an acceptable shape. The street is suffering from deterioration and other issues as a result of the surrounding inflated wholesale markets. Al-Rashid Street’s initial architectural style was influenced by the Ottoman architectural style, which ruled Iraq from 1534 to 1918. However, due to the diverse sequence of regimes that subsequently ruled the country, a lot of the buildings have changed. Substantially, Al-Rashid Street serves as a repository of Baghdad’s history and represents the cultural and architectural heritage of one of the Middle East’s major cities [34].
Al-Rashid Street is currently in a condition of disorder, congestion, and deterioration and it is in danger of losing its urban character despite containing significant heritage buildings and a nearly homogenous urban pattern. Therefore, a section of Al-Rashid Street was chosen that contains the majority of its historically significant section for Baghdad’s residents. The selected section extends around 1.55 km from Hafiz Al-Qadhi Square (the street’s midpoint) to Al-Maydan Square (Figure 1).

2.2. Materials of the Study

According to Mao et al. [3], survey techniques are the most commonly adopted method for the assessment of the relationship between historical scenes and human preference. In this study, a photo survey was used for the selected part of Al-Rasheed Street. Therefore, the photos were taken at approximately 50 m distances while walking from east to west (from Hafiz Al-Qadhi Square to Al-Maydan Square). All the photos were taken at the same perspective and size, using a mobile camera (Figure 2). A total of 32 photos were captured and each was then allocated a unique code (V01–V32) to include in the online survey (Appendix A).

2.3. Methods of the Study

A photo survey was adopted as the main method of visual quality assessments. The method was limited to a social media photo survey because it was difficult to do more due to it being beyond control circumstances. The photo survey was administered through an online platform called Qualtrics. When designing the survey, photos were randomly placed to obtain better responses from the survey respondents. Additionally, two photos were added (one at the beginning and one at the end) to allow survey participants as dummies. However, the results from these additional photos were disregarded. The survey was distributed on social media using purposive sampling by limiting participation to Baghdad. A period of 30 days was provided starting from 25 May 2022 in order to collect the survey data.
The online preference survey was separated into two sections: (A) demographic and (B) photo survey. Seven questions constitute the demographic section of the survey (A), such as gender, marital status, age, and others that are important for the research. Section (B) comprises two subsections. In the first subsection, the respondents were asked to rate the visual quality of the photos consisting of a 5-point Likert Scale. The ratings for the scale for each photo were categorized from −2 (highly bad scene) as a negative visual quality to +2 (highly nice scene) as a positive visual quality (Figure 3). This classification of the Likert Scale was utilized by Wartmann et al. [17] to find the influencing visual quality perceived by the public. The primary benefit of the positive and negative poles of the Likert Scale is that respondents are not required to select a single choice for the visual quality assessment. This method of classification, Likert Scale assessment, is consistent with [35,36]. In the second subsection, the respondents were asked to determine the element that has an impact on the visual quality assessment for each image by clicking on the element inside the photo.
The analysis in this study focuses on the indicator of perceived visual quality assessment and the detailed statistical analysis of how this perception varies between people. To obtain results, this study used two techniques: First, Qualtrics heatmap analysis was used to identify elements that impact the visual quality assessment. Second, the SPSS V.26 program was used to analyze the survey findings to determine factors that impacted the visual quality assessment. Figure 4 shows the overall method process in the study.

3. Results

3.1. Demographic Composition of Survey Respondents

In this survey, 225 respondents completed this survey out of a total of 282 respondents; males (N = 125, 55.56%) were more likely to participate than females (N = 100, 44.44%). The percentage of single people (N = 119, 52.89%) was slightly greater than married people (N = 106, 47.11%). While (N = 99, 44.00%) of respondents were between the ages of 28–37. In addition, (N = 145, 64.44%) of the participants lived in modern urban areas, whereas a small minority resided in locations with heritage areas (N = 20, 8.89%). As many as (N = 135, 60.00%) of the participants reported a monthly income greater than IQD one million, which is considered a reasonable income for an Iraqi person. In addition, (N = 163, 72.45%) of respondents reported having visited Al-Rasheed Street in the last year. In general, the participants in this study are likely to be well-educated young adults, reside in modern urban areas, have a comfortable income, and have visited Al-Rasheed Street within the last year, which means they are completely familiar with the study area (Table 1).

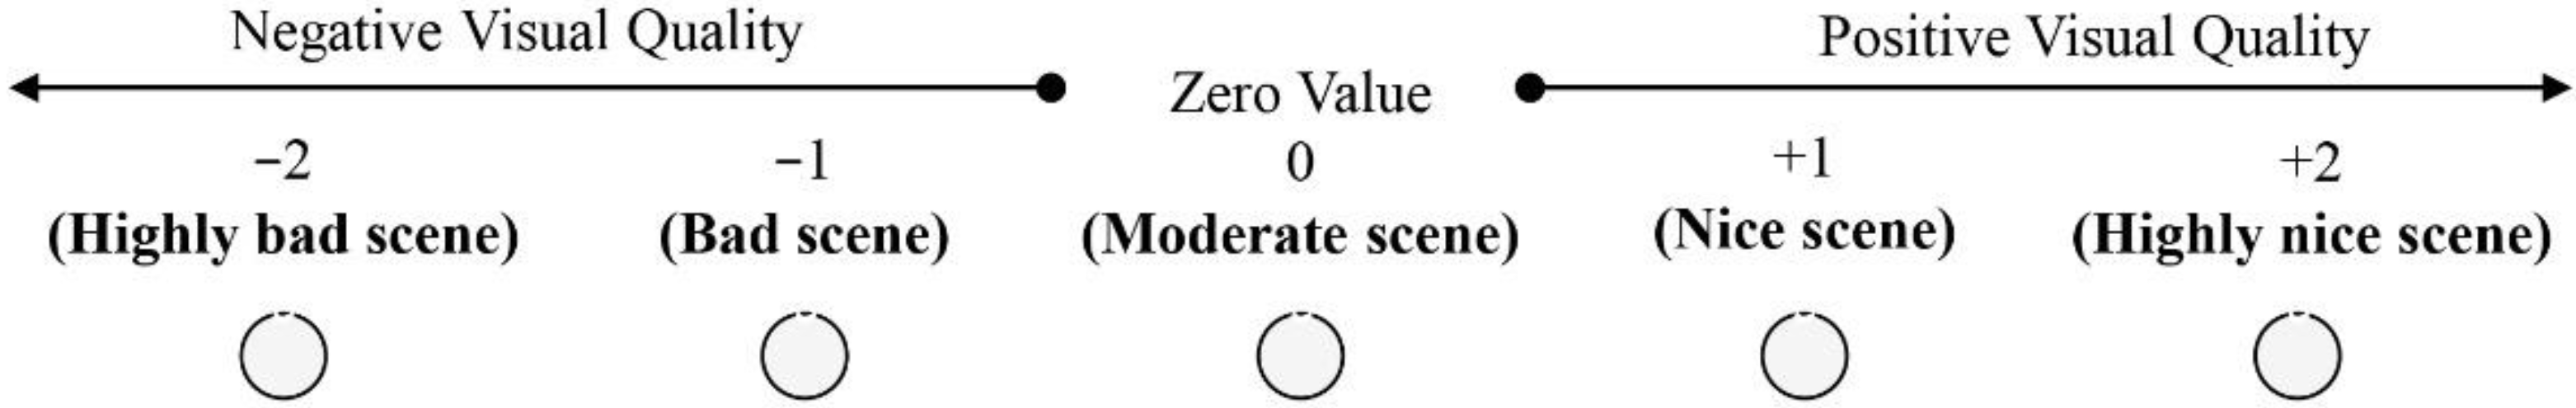
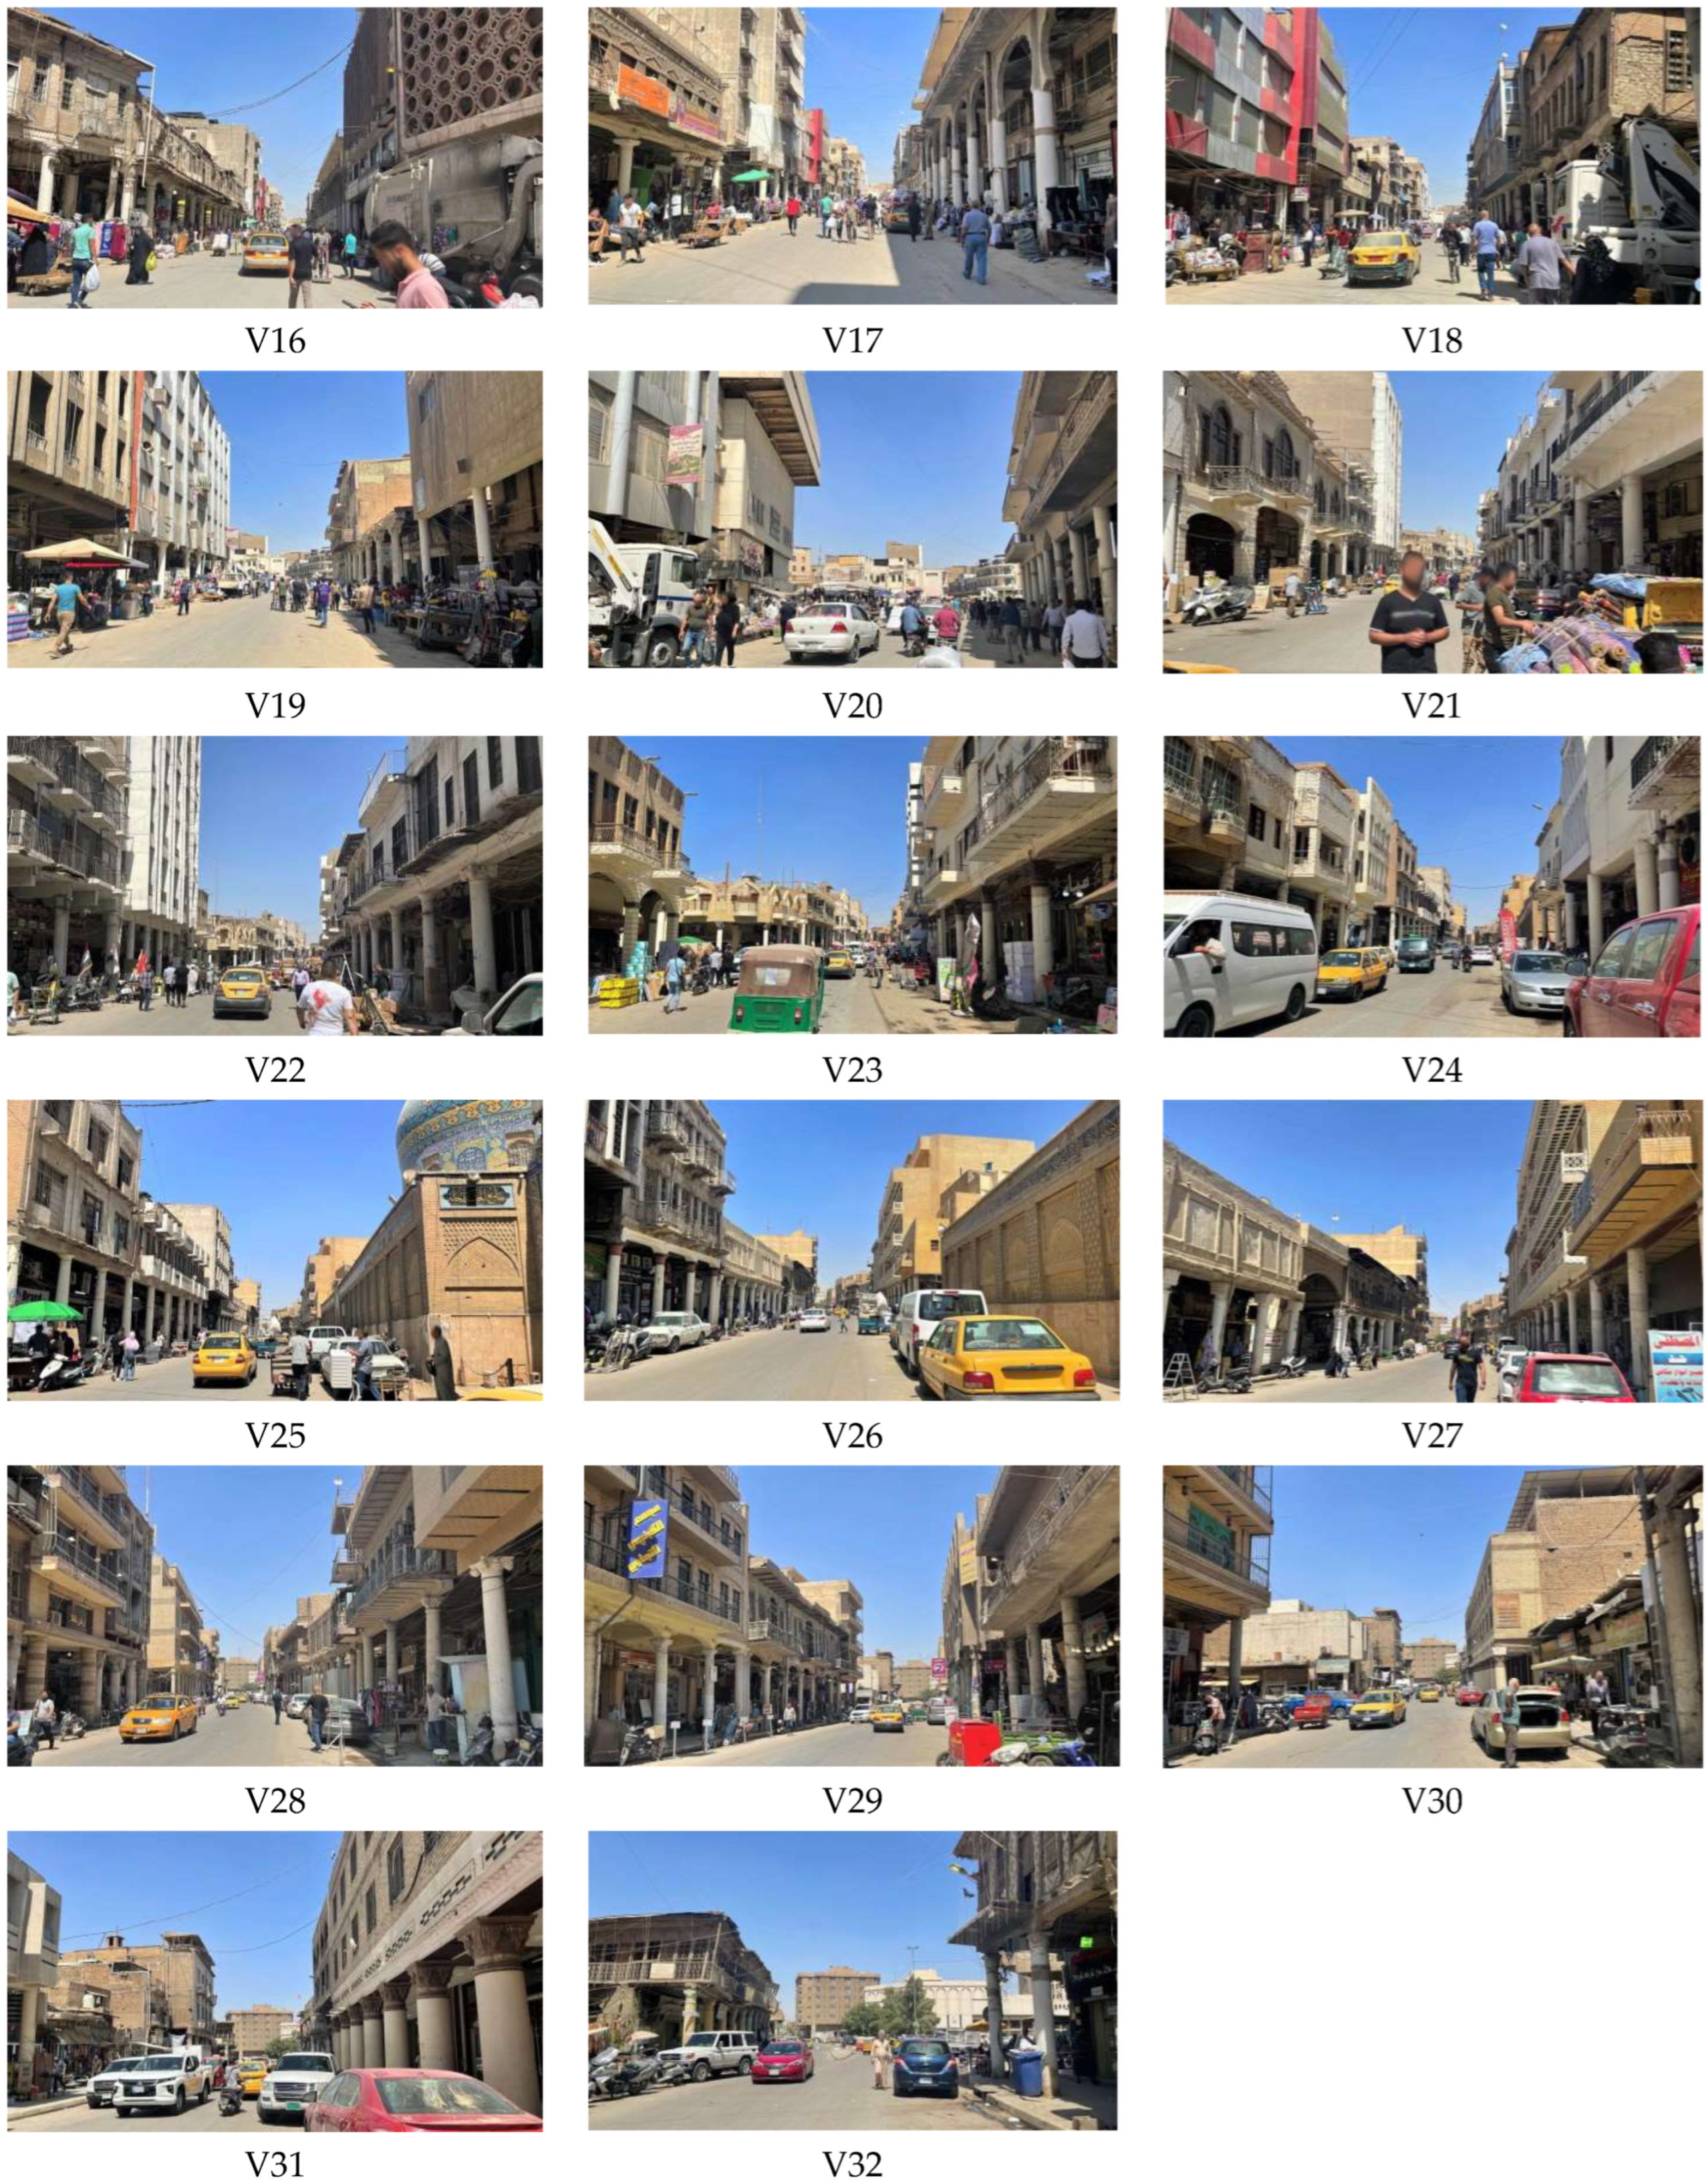
3.2. Visual Photo Survey Rating

The visual quality scores for each of the 32 photos in the survey were averaged. This visual photo survey employed a Likert scale from −2 to +2. The outcome was that no image achieved an average score of +1, indicating a relatively low perceived visual quality. The results of screening the photos revealed that just 7 photos express a positive visual quality, while the remaining 25 photos express a negative visual quality (Table 2). Therefore, this study will be able to identify the most influential elements in seven photos with a positive visual quality and the highest seven photos with a negative visual quality, considering that the other negative visual quality photos do not have different elements from the seven chosen photos in any way (Table 3).
Based on Table 3, the seven photos with the lowest visual quality scores also reveal three groups of landscape characteristics. The lowest scores were, respectively, V02, V32 (m = −0.94, −0.90) degraded historical building view; V12, V14, V15 (m = −1.24, −0.93, and −0.91) a concrete wall with historical building view; and V18, V19 (m = −1.29, −0.83) a modern facade of historical building view. The negative visual quality results indicate that participants do not prefer visual pollution caused by dilapidated buildings and the restoration of buildings with new materials that are added to old buildings; they also do not prefer the presence of security concrete walls in the old historical street. On the other hand, the seven photos with the highest visual quality scores reveal three groups of landscape characteristics. The highest scores were, respectively, V03, V05, V06 (m = +0.18, +0.31, and +0.48) unique historical building view; V07, V08 (m = +0.42, +0.22) a landscape with historical building view; and V25, V26 (m = +0.10, +0.20) a historical mosque view. The positive visual quality results indicate that participants prefer the uniqueness of historical buildings, their appreciation of their aesthetics, and their desire for green spaces in the old historical street.

3.3. Heatmap and Elements Impact of the Visual Quality Assessment

A heatmap analysis was utilized to identify elements that impact the visual quality assessment of Baghdad’s historical old town scenes. The heatmap analysis is performed based on the respondents’ “click density” (the area with the red color has the most clicks, while the blue color indicates the area with the least clicks) (Table 4). The negative visual quality results indicated that participants had identified a number of landscape characters as visual pollution, such as “degraded historical building views” (m = −0.92), “concrete wall with historical building views” (m = −1.02), and “modern facade of historical building views” (m = −1.06). The negative visual quality results reveal that respondents perceived various street elements, such as degraded historical buildings, concrete walls, carts, motorbikes, trolleys, and billboards, as leading to an increase in visual pollution. In addition, the findings indicate that buildings with inappropriate modern facades in an old historical district have a negative effect on the area’s visual quality.
On the other hand, positive visual quality results indicate that participants have identified a number of landscape characters as visually aesthetic scenes such as “historical mosque views” (m = +0.15), “landscape with historical building views” (m = +0.32), and “unique historical building views” (m = +0.32). Additionally, the positive visual quality results indicate that participants considered specific elements such as the historical architectural style, plants, and mosques as visual aesthetic elements. The carts, motorbikes, and trolleys contribute less to the visual aesthetic and are why we do not have a high visual aesthetic quality. This view is supported by the scenes that are rated as very bad scenes. Carts, motorbikes, and trolley elements have been demonstrated to diminish the aesthetics of the old historic street.
Based on the heatmap analysis, Table 5 highlights the findings and element impact of the visual quality assessment obtained for each landscape character.

3.4. Factors Impact on the Visual Quality Assessment

Using SPSS, a comparison of the respondents’ demographic factors and their effect on their perceived visual quality has been performed. Prior to commencement, a reliability test was undertaken to determine the accuracy of the respondents’ responses. The reliability test statistic was (Cronbach’s Alpha = 0.874), which is an acceptable level of scale reliability. Moreover, all items have indicated a high level of scale reliability, thus the respondents’ replies are considered correct, as shown in Table 6.
Additionally, the normality test of the samples’ distribution was conducted to choose the most relevant tests. Regarding the normality test, the Shapiro–Wilk and Kolmogorov–Smirnov tests showed that the data were not normally distributed, which means that the null hypothesis for all the demographic data was significant (p < 0.05). This leads to the conclusion that non-parametric analytical tests were required due to the abnormal distribution of the data.
The independent-samples Mann–Whitney test results showed that the null hypothesis was rejected due to the significant relationship between genders in the three landscape character groups, as shown in Table 7 and Figure 5. In the negative visual quality, two groups showed statistically significant differences, showing the “modern facade of historical building view” character group showed a significant difference registering a Sig. value of 0.027 between males (N = 125, M = 104.80) and females (N = 100, M = 123.25). Additionally, the “concrete wall with historical building view” character group showed a significant difference registering Sig. value of 0.031 between males (N = 125, M = 105.00) and females (N = 100, M = 123.00). In both groups, the female respondents were found to have a higher mean rank than the male respondents. This suggested that the female respondents were more sensitive toward the visual pollution caused by elements such as concrete security walls and modern façades within the historical scenes than the male respondents. On the other hand, in the positive visual quality, the “historical mosque view” character group showed a statistically significant difference registering a Sig. value of 0.015 between males (N = 125, M = 122.19) and females (N = 100, M = 101.52). The male respondents were found to have a higher mean rank than the female respondents; this suggested that the male respondents were more appreciative of the visual aesthetics of the elements that had a positive impact such as the scene of the historical mosques than the female respondents.
As for the marital status, the independent-samples Mann–Whitney test results showed no statistically significant differences between the marital status groups in all the landscape character groups.
Similarly, the independent-samples Kruskal–Wallis test was conducted to understand the differences between demographic groups’ responses to all landscape character groups. The independent-samples Kruskal–Wallis test results showed that the null hypothesis was rejected as there was a significant relationship between the age groups in the two landscape character groups, as shown in Table 8 and Figure 6. In the positive visual quality, the two groups showed statistically significant differences. The “Historical Mosque view” character group showed a significant difference registering a Sig. value of 0.024 and the “Landscape with historical building view” character group showed a statistically significant difference registering a Sig. value of 0.020 indicating that the null hypothesis cannot be accepted. In both groups, the 38–47 age responders were found to have a higher mean than other age respondents. This suggested those respondents had a more positive response toward elements that have contributed to the scenes’ visual aesthetics of the landscape.
As for the education level, the independent-samples Kruskal–Wallis test results showed that the null hypothesis could not be rejected due to the fact that there was no statistically significant difference between the respondents from various education levels detected in all the landscape character groups.
The independent-samples Kruskal–Wallis test results showed the null hypothesis was rejected because there was a significant difference between the living area groups in the two landscape character groups, as shown in Table 9 and Figure 7. In negative visual quality, the “Modern facade of historical building view” character group showed a statistically significant difference registering a Sig. value of 0.035, indicating that the null hypothesis cannot be accepted. In this character, the results indicate that people who lived in historic urban areas had a higher mean response than people who lived in modern urban and semi-urban areas. This indicates that compared to other groups residing in other living areas, those who live in historic urban areas felt they had a more negative response regarding the visual quality impact by modern facades in historical areas within Baghdad’s old historical streets. Additionally, in the positive visual quality, the “Historical Mosque view” character group showed a statistically significant difference by registering a Sig. value of 0.004 indicating that the null hypothesis cannot be accepted. In this character, the analysis indicates that people who lived in historical and modern urban areas had a higher mean than people who lived in semi-urban areas. This indicates that compared to other groups, those respondents felt more positively about the visual aesthetics of historical mosques.
Additionally, in this study, the independent-samples Kruskal–Wallis test results showed that the null hypothesis could not be accepted as they registered a statistically significant difference between the groups with various monthly incomes in two landscape character groups, as shown in Table 10 and Figure 8. In the negative visual quality, the two groups showed statistically significant differences. The “Modern facade of historical building view” character group showed a statistically significant difference registering a Sig. value of 0.003. Similarly, the “Degraded historical building view” character group showed a significant difference by registering a Sig. value of 0.009, indicating that the null hypothesis cannot be accepted. In both groups, the results indicate that those who have a monthly income of 0–499,000 IQD have a higher mean than other monthly income groups. This indicates that compared to other monthly income groups, those who had lower monthly incomes were more sensitive about the visual quality of the modern facade of the historical buildings and the degraded historical building.
Finally, for visiting Al-Rashid Street during the previous year, the independent-samples Kruskal–Wallis test results showed that the null hypothesis could not be rejected because there were no significant differences in responses between those who did not visit, 1–2 times, and 3 times or more respondents in all the landscape character groups.

4. Discussion

This study investigates the impact of urban facades’ visual quality on historical street characters in the capital city of Baghdad. This study employed a Likert scale to categorize landscape characters into negative visual quality and positive visual quality. The results of this study indicated that scenes of the urban landscape of the historic street in Baghdad had received a relatively negative visual quality rating on average. The following two sections of this study categorize the urban scenes employed in this study based on the perceptual visual impact into “negative visual quality” and “positive visual quality” scenes. Furthermore, the elements that may have an effect on the respondent’s visual preferences are discussed.

4.1. Negative Visual Quality

Negative visual quality refers to visual pollution or the condition of polluted visual resources. In other words, visual pollution is the leading cause of negative visual quality [37]. Some sites are assessed as having a negative visual quality for reasons related to visual pollution and human activities [15]. Visual pollution significantly affects public appreciation of the urban environment; sources of visual pollution such as waste, billboards, unsightly buildings, and degraded buildings can cause discomfort to one’s ability to enjoy a scene or view [38]. In this study, the overall findings revealed a level of dissatisfaction from responders with the visual quality and the necessity for a physical environment upgrade. Additionally, the results show that the respondents’ choices for the urban modern facade of historical buildings, security concrete walls of the scene, and degraded historical buildings as visual pollution elements negatively correlated with the visual quality assessment of historical street scenes.
The respondents’ choice of the facade of historical buildings to non-historical, modern materials as having a negative visual quality is evident. The results revealed that women and those with the lowest income levels are more sensitive to negative visual quality and a sensation of visual pollution when the materials of a historical building’s facade are replaced with modern materials. It also revealed that residents in historic urban areas are more negative about the visual quality and consider changing the facade materials of historic buildings to modern materials as a form of visual pollution. These results are expected because during the maintenance or renovation of a historical building, the concept of maintenance will be utilized to conserve as much original material as possible. Arioglu and Acun [39] confirms that if the maintenance is not sufficient to preserve the historical building, then restoration should be performed and only materials that are compatible or similar to the original should be used. However, conservation permits extensive alterations so long just as the alterations are of architectural and historical interest and improve the current building’s character, all under a wide range of legal protection measures, such as using similar materials and styles for the historical buildings. It may be necessary for municipal authorities to impose stricter regulations on the use of modern facade-finishing materials in historic buildings. This strategy strengthens the commitment of private building owners to the materials used to finish historical facades. Therefore, it is not permissible to replace the materials used to finish the historical facades with modern materials, as this would mark the end of the architectural heritage.
The concrete wall that obstructs the view of the historical building is one of the elements contributing to the highly negative visual quality. The results clarified that women are more sensitive to negative visual quality and a sensation of visual pollution when having a concrete wall that obstructs the scenes of the historical buildings. This variance in the response between male and female respondents toward certain elements of the urban scene cannot be justified by the available literature; therefore, it represents room for future research in establishing how sex could influence people’s perceived visual quality. Indeed, these concrete walls were erected for safety, control, and crime prevention; still, they have a detrimental effect on the aesthetic value as a visually polluting element for the surrounding historical area; these results are consistent with the findings of [40,41]. As a result, concrete walls can add to a sense of detachment and spatial fragmentation, which runs counter to the notion of a connection between the community and historical street scenes. Therefore, it is necessary for the relevant authorities to remove these concrete walls and apply other suitable security protocols in order to increase the visual quality and decrease the presence of visually negative elements.
The degraded historical building scenes are one of the elements that contribute to increasing the negative visual quality. The results revealed that those with the lowest income levels are more sensitive to negative visual quality and a sensation of visual pollution when the degraded historical buildings scenes. The degradation of a historical building is viewed as the loss of its function and significance for the people, resulting from underestimating its value and social, economic, and cultural potential. It appears that those with lower incomes are more sensitive and observant of this loss of function and the deterioration of its economic effects. This is because it is well-known that historical sites and structures offer several potentials to stimulate economic activity. For instance, economic benefits include creating local jobs and gaining profits from the entry prices associated with historic buildings similar to museums. The monetary motivations that influence human conduct frequently have a substantial impact and are crucial in determining whether heritage sites or buildings result in positive or negative outcomes; these results are consistent with the findings of [42]. The local citizens with the lowest income levels anticipate that the economic benefits of historical and heritage areas would improve their income and thus motivate the maintenance and rehabilitation of heritage scenes.

4.2. Positive Visual Quality

Positive visual quality refers to the aesthetic quality or condition of the element’s aesthetic resources. In other words, the visual aesthetics of the elements is the primary aspect of achieving positive visual quality. Urban designers focus on the strength of a positive visual quality when discussing the visual aesthetics of historical street scenes [13]. Visual aesthetics significantly affect the public appreciation of the urban environment; the aesthetics can influence psychology and human behavior by influencing a person’s emotions [43]. In addition to their direct role in shaping emotions such as familiarity, sympathy, and memory, aesthetic principles play related roles in influencing place, identity, and uniqueness [44]. The results show that the responder’s preference for the historical mosque, a green urban landscape, and unique historical buildings are elements that have impacts positively correlated with the visual quality assessment of historical street scenes.
Furthermore, the respondents indicated that the historical mosque has a positive visual quality. While it is difficult to establish a connection between the perceived visual quality and buildings’ functionality, which in this case serves as a worship place, it is suggested that these religious buildings may have a symbolic representation to their users, which in turn influences their sense of belonging and spatial appreciation [45,46]. The results also revealed that residents in historic urban and modern urban areas are more positive toward historical mosque visual quality than those who stay in semi-urban areas. The residents of the urban area emphasize elements they perceive to be important for their future children and it reinforces their affiliation with the cultural and religious values in historical sites; these results are consistent with the findings of [47,48]. Historic religious structures are significant because of their spiritual and aesthetic importance. There is interdependence between the historic mosques and aesthetic quality in terms of their visual, sensory, and functional features.
The urban green landscape is one of the elements that contribute to the highly positive visual quality. It has long been one of the most desired aspects, especially in urban areas. In several aesthetic quality studies, people attributed high ratings and reacted positively to scenes they liked, such as urban forests and urban green [49,50,51]. The results found that those between the ages of 38 and 47 appreciate the positive visual quality and attractive landscape appearance with a historical building view. The urban green landscape is an essential component of the urban environment, which possesses high value from urban dwellers. This result is predominantly natural, especially in densely populated urban areas; therefore, street trees are an attractive addition to the urban landscape. Psychologically, the urban green street is soothing and relaxing and is the most desired element since it casts a variety of shade patterns on the street and produce an aesthetically pleasing perspective; these results are consistent with the findings of [52,53]. The aesthetic is regarded as one of the most important purposes of urban green qualities since inhabitants sense it visually and directly. Subsequently, the urban green landscape aesthetics on the street can improve the city’s inhabitants’ well-being and increase their satisfaction.
The architectural style and aesthetics of unique historical buildings were crucial in attracting more human attention; the historic building’s long history and cultural inherence also affected human preferences. The results revealed no differences in attitudes based on respondent demographics; everyone believes the aesthetic of unique historical buildings has a positive visual quality impact and should be preserved.

5. Limitations and Future Studies

Despite the findings of this study, this study has several limitations. Firstly, 225 respondents participated in the survey; a larger sample size could offer a better representation of the target sample and would help the generalization of the results. Secondly, this study employed Al-Rashid Street as the only case study to investigate the visual quality due to time and team limitations. Conducting a similar study in another historical street could offer the possibility to generalize the results. Thirdly, the methodology was confined to a photo survey that was distributed via social media due to uncontrollable factors that caused it to be impossible to conduct approaches such as in-person surveys and interviews. Obtaining the necessary authorization to conduct in-person surveys and interviews in such locations is challenging, especially with important structures nearby, such as the Central Bank of Iraq’s headquarters. Consequently, this study has focused only on the quantitative elements when investigating the visual quality; further studies employing a qualitative approach using qualitative techniques, such as conducting interviews alongside the photo survey could offer another dimension to understanding visual quality assessment in historical streets. Fourthly, several socio-demographic factors investigated in this study have shown statistically significant differences among various demographic groups that were hard to justify. Future research initiatives focusing on establishing such connections between socio-demographic backgrounds with their visual preferences for historical street scenes are needed.

6. Conclusions

This manuscript investigated the visual quality assessment of historical streets with Al-Rashid Street in the capital city of Baghdad as a case study. The study’s findings indicated that the street’s urban landscape had received an overall negative visual quality rating by the study’s respondents. In addition, the results indicated that the materials choices for the urban facade of historical buildings, security concrete walls, and degraded historical buildings have a negative impact on the perceived visual quality. On the contrary, the results indicate that the respondents’ preferred scenes that included historical worship places, greenery within the urban landscape, and unique historical buildings’ facades had a positive impact on the respondents’ perceived visual quality. This research contributes to the body of knowledge by identifying the elements and characteristics that influence visual quality. Furthermore, the results of this study have managed to group the influencing elements into two types depending on their influence into positive and negative visual quality-influencing elements. Moreover, this study represents a starting point for future visual quality assessment initiatives in historical streets conducted by both researchers and municipal offices whereby improvements to urban streets’ scenes are required. Overall, the findings of this study indicate that areas with historical significance, such as the case study employed in this study, can be considered visually unpleasant by their community due to urban facade physical degradation and the presence of visually unpleasant elements or inconsistent with the urban visual fabric.

Author Contributions

Conceptualization, R.M. and S.A.B.; methodology, R.M. and A.A.-S.; data collection, M.A.-H.; formal analysis, R.M. and H.G.; writing—original draft preparation, R.M.; writing—review and editing, A.A.-S.; visualization, R.M.; supervision, S.A.B. All authors have read and agreed to the published version of the manuscript.

Funding

This research received no external funding.

Institutional Review Board Statement

Not applicable.

Informed Consent Statement

Not applicable.

Data Availability Statement

Not applicable.

Conflicts of Interest

The authors declare no conflict of interest.

Appendix A

Figure A1. Shows each of the 32 photos have a unique code.
Heritage 05 00192 g0a1aHeritage 05 00192 g0a1b

References

  1. Zhu, X.; Chiou, S.-C. A Study on the Sustainable Development of Historic District Landscapes Based on Place Attachment among Tourists: A Case Study of Taiping Old Street, Taiwan. Sustainability 2022, 14, 11755. [Google Scholar] [CrossRef]
  2. Larkham, P.J.; Adams, D. Persistence, Inertia, Adaptation and Life Cycle: Applying Urban Morphological Ideas to Conceptualise Sustainable City-Centre Change. Iconarp Int. J. Arch. Plan. 2019, 7, 73–94. [Google Scholar] [CrossRef] [Green Version]
  3. Mao, Y.; Qi, J.; He, B.-J. Impact of the heritage building façade in small-scale public spaces on human activity: Based on spatial analysis. Environ. Impact Assess. Rev. 2020, 85, 106457. [Google Scholar] [CrossRef]
  4. Azizi, N.Z.M.; Razak, A.A.; Din, M.A.M.; Nasir, N.M. Recurring Issues in Historic Building Conservation. Procedia Soc. Behav. Sci. 2016, 222, 587–595. [Google Scholar] [CrossRef] [Green Version]
  5. Mehanna, W.A.E.-H.; Mehanna, W.A.E.-H. Urban renewal for traditional commercial streets at the historical centers of cities. Alex. Eng. J. 2019, 58, 1127–1143. [Google Scholar] [CrossRef]
  6. Bassily, V.; Abufarag, T.; Goubran, S. Heritage Buildings’ Façades as Facilitators for Local Sustainable Development: The Case of Cairo’s El Korba Area. Heritage 2022, 5, 2689–2731. [Google Scholar] [CrossRef]
  7. Bharadwaj, M.; Kumari, S. Spatio-Temporal Efficacy of Historic Street Forms in Preserving Domesticity of Vernacular Set-tlements: Ulsoor, Bangalore, India. ISVS E-J. 2021, 8, 1–19. Available online: https://www.researchgate.net/publication/349644254 (accessed on 2 September 2022).
  8. Carmona, M. London’s local high streets: The problems, potential and complexities of mixed street corridors. Prog. Plan. 2015, 100, 1–84. [Google Scholar] [CrossRef] [Green Version]
  9. Hassen, N.; Kaufman, P. Examining the role of urban street design in enhancing community engagement: A literature review. Health Place 2016, 41, 119–132. [Google Scholar] [CrossRef]
  10. Hernández, A.A.S.; Léon, M.T.; Mireles, M.H. Where are Going to Definitions Historical Centers in Latinoamerican? Territory, City and Heritage. Procedia Soc. Behav. Sci. 2016, 225, 27–33. [Google Scholar] [CrossRef] [Green Version]
  11. Tang, J.; Long, Y. Measuring visual quality of street space and its temporal variation: Methodology and its application in the Hutong area in Beijing. Landsc. Urban Plan. 2018, 191, 103436. [Google Scholar] [CrossRef]
  12. Balasubramanian, S.; Irulappan, C.; Kitchley, J.L. Aesthetics of urban commercial streets from the perspective of cognitive memory and user behavior in urban environments. Front. Arch. Res. 2022, 11, 949–962. [Google Scholar] [CrossRef]
  13. Ernawati, J. Imageability of a Historic Street and Its Influence on People Preference. In International International Conference of Heritage & Culture in Integrated Rural-Urban Context (HUNIAN 2019); Atlantis Press: Dordrecht, The Netherlands, 2020; pp. 184–189. [Google Scholar] [CrossRef]
  14. Santosa, H.; Ernawati, J.; Wulandari, L.D. Visual quality evaluation of urban commercial streetscape for the development of landscape visual planning system in provincial street corridors in Malang, Indonesia. IOP Conf. Series: Earth Environ. Sci. 2018, 126, 012202. [Google Scholar] [CrossRef]
  15. Johansson, M.; Sternudd, C.; Ferreira, I. The Walkshop: A tool to integrate research on human aspects of sustainable urban design in teaching. Högre Utbild. 2015, 5, 145–157. [Google Scholar]
  16. Llopis, J.; Torres, A.; Serra, J.; García, Á. The preservation of the chromatic image of historical cities as a cultural value. The old city of Valencia (Spain). J. Cult. Heritage 2015, 16, 611–622. [Google Scholar] [CrossRef]
  17. Wartmann, F.M.; Frick, J.; Kienast, F.; Hunziker, M. Factors influencing visual landscape quality perceived by the public. Results from a national survey. Landsc. Urban Plan. 2021, 208, 104024. [Google Scholar] [CrossRef]
  18. Krause, C.L. Our visual landscape: Managing the landscape under special consideration of visual aspects. Landsc. Urban Plan. 2001, 54, 239–254. [Google Scholar] [CrossRef]
  19. Zhao, Y.; Liu, J.; Zheng, Y. Preservation and Renewal: A Study on Visual Evaluation of Urban Historical and Cultural Street Landscape in Quanzhou. Sustainability 2022, 14, 8775. [Google Scholar] [CrossRef]
  20. Bystrova, T.Y. Determining the degree of degradation of a historical and architectural object: Assessment Scale. IOP Conf. Series Mater. Sci. Eng. 2020, 962, 032070. [Google Scholar] [CrossRef]
  21. Cengiz, T. Visual Quality Method in Assessing Landscape Characteristics: Case Study of Bozcaada Island. J. Coast. Res. 2014, 294, 319–327. [Google Scholar] [CrossRef]
  22. Mohamed, N.; Othman, N.; Ariffin, M.H. Value of Nature in Life: Landscape Visual Quality Assessment at Rainforest Trail, Penang. Procedia Soc. Behav. Sci. 2012, 50, 667–674. [Google Scholar] [CrossRef]
  23. Mandeli, K. Public space and the challenge of urban transformation in cities of emerging economies: Jeddah case study. Cities 2019, 95, 102409. [Google Scholar] [CrossRef]
  24. Verma, D.; Jana, A.; Ramamritham, K. Predicting human perception of the urban environment in a spatiotemporal urban setting using locally acquired street view images and audio clips. Build. Environ. 2020, 186, 107340. [Google Scholar] [CrossRef]
  25. Petropoulos, Z.E.; Levy, J.I.; Scammell, M.; Fabian, M.P. Characterizing community-wide housing attributes using georeferenced street-level photography. J. Expo. Sci. Environ. Epidemiol. 2019, 30, 299–308. [Google Scholar] [CrossRef] [Green Version]
  26. Paikan, E.; Pourjafar, M.R.; Ranjbar, E. The Effects of Physical—Spatial Measures of Urban Streets on Pedestrians Emotional Responses Using EEG. Motaleate Shahri 2022, 11, 47–62. [Google Scholar] [CrossRef]
  27. Simpson, J.; Freeth, M.; Simpson, K.J.; Thwaites, K. Visual engagement with urban street edges: Insights using mobile eye-tracking. J. Urban. Int. Res. Placemaking Urban Sustain. 2018, 12, 259–278. [Google Scholar] [CrossRef] [Green Version]
  28. Al-Sharaa, A.; Adam, M.; Nordin, A.S.A.; Alhasan, A.; Mundher, R.; Zaid, O. Enhancing Wayfinding Performance in Existing Healthcare Facilities Using Virtual Reality Environments to Revise the Distribution of Way-Showing Devices. Buildings 2022, 12, 790. [Google Scholar] [CrossRef]
  29. Maruhn, P.; Dietrich, A.; Prasch, L.; Schneider, S. Analyzing Pedestrian Behavior in Augmented Reality—Proof of Concept. In Proceedings of the 2020 IEEE Conference on Virtual Reality and 3D User Interfaces (VR), Atlanta, GA, USA, 22–26 March 2020; pp. 313–321. [Google Scholar] [CrossRef]
  30. Biljecki, F.; Ito, K. Street view imagery in urban analytics and GIS: A review. Landsc. Urban Plan. 2021, 215, 104217. [Google Scholar] [CrossRef]
  31. Ye, Y.; Zeng, W.; Shen, Q.; Zhang, X.; Lu, Y. The visual quality of streets: A human-centred continuous measurement based on machine learning algorithms and street view images. Environ. Plan. B Urban Anal. City Sci. 2019, 46, 1439–1457. [Google Scholar] [CrossRef]
  32. Al-Hasani, M.K. Urban Space Transformation in Old City of Baghdad—Integration and Management. Megaron 2012, 7, 79–90. Available online: http://www.journalagent.com/z4/vi.asp?pdir=megaron&plng=tur&un=MEGARON-14633&look4=#.UslXMdKA2M8 (accessed on 19 October 2022).
  33. Al-Hinkawi, W.S.; Hasan, N.A.; Zedan, S.K. Facadism: An Approach for Spatial Reconfiguration. Int. J. Des. Nat. Ecodynamics 2021, 16, 631–640. [Google Scholar] [CrossRef]
  34. Hussein, S.A.; Al-Taee, M.D. The management of heritage buildings in historical urban areas according to cost-benefit methods. IOP Conf. Series Earth Environ. Sci. 2021, 779, 012045. [Google Scholar] [CrossRef]
  35. Jahani, A.; Saffariha, M. Aesthetic preference and mental restoration prediction in urban parks: An application of environmental modeling approach. Urban For. Urban Green. 2020, 54, 126775. [Google Scholar] [CrossRef]
  36. Wang, R.; Zhao, J.; Meitner, M.J.; Hu, Y.; Xu, X. Characteristics of urban green spaces in relation to aesthetic preference and stress recovery. Urban For. Urban Green. 2019, 41, 6–13. [Google Scholar] [CrossRef]
  37. Al, M.E. Visual pollution manifestations negative impacts on the people of the Saudi Arabia. Int. J. Adv. Appl. Sci. 2021, 8, 94–101. [Google Scholar] [CrossRef]
  38. Abu Bakar, S.; Al-Sharaa, A.; Suhardi, M.; Munther, R. Measuring Visual Pollution Threshold Along Kuala Lumpur Historic Shopping District Streets Using Cumulative Area Analysis. In Proceedings of the Visual Resource Stewardship Conference, Lemont, IL, USA, 27–30 October 2019; State University of New York: Albany, NY, USA, 2019. Available online: https://digitalcommons.esf.edu/vrconference/16 (accessed on 14 September 2022).
  39. Arıoğlu, N.; Acun, S. A research about a method for restoration of traditional lime mortars and plasters: A staging system approach. Build. Environ. 2006, 41, 1223–1230. [Google Scholar] [CrossRef]
  40. Blander, A.; Moser, S.; Avni, N. Religio-nationalism and ‘soft boundaries’: Urban gating in West Jerusalem and Tel Aviv. Geoforum 2018, 96, 227–235. [Google Scholar] [CrossRef]
  41. Landman, K.; Schönteich, M. URBAN FORTRESSES. Afr. Secur. Rev. 2002, 11, 71–85. [Google Scholar] [CrossRef]
  42. Gould, P.G.; Burtenshaw, P. Heritage Sites: Economic Incentives, Impacts and Commercialization. In Encyclopedia of Global Archaeology; Springer: Cham, Switzerland, 2019; pp. 1–7. [Google Scholar] [CrossRef]
  43. Mundher, R.; Abu Bakar, S.; Maulan, S.; Yusof, M.J.M.; Al-Sharaa, A.; Aziz, A.; Gao, H. Aesthetic Quality Assessment of Landscapes as a Model for Urban Forest Areas: A Systematic Literature Review. Forests 2022, 13, 991. [Google Scholar] [CrossRef]
  44. Mundher, R.; Abu Bakar, S.; Al-Helli, M.; Gao, H.; Al-Sharaa, A.; Yusof, M.J.M.; Maulan, S.; Aziz, A. Visual Aesthetic Quality Assessment of Urban Forests: A Conceptual Framework. Urban Sci. 2022, 6, 79. [Google Scholar] [CrossRef]
  45. Ghouchani, M.; Taji, M. Promoting spirituality in the architectural thought of the mosque: A sense of place approach. J. Islam. Arch. 2021, 6, 151–159. [Google Scholar] [CrossRef]
  46. Najafi, M.; Mustafa Kamal, M.S. Place Attachment To Contemporary Public-Funded Mosques in Malaysia. Alam Cipta 2012, 5, 65–76. Available online: https://frsb.upm.edu.my/upload/dokumen/FKRSE1_2-298-1-PB.pdf (accessed on 18 November 2022).
  47. Adriani, H.; Saleh, I.; Syahadat, R.M.; Patih, T.; Putra, P.T. The Mosque as a Hybrid Space: A Place for Worship and Tourism. KnE Soc. Sci. 2022, 538–548. [Google Scholar] [CrossRef]
  48. Koşun, S.B.; Turan, M.H. Effect of urban transformation on the values of historic sites around mosques: Two cases in Manisa, Turkey. Front. Arch. Res. 2020, 9, 890–899. [Google Scholar] [CrossRef]
  49. Mundher, R.; Abu Bakar, S.; Maulan, S.; Yusof, M.J.M.; Osman, S.; Al-Sharaa, A.; Gao, H. Exploring Awareness and Public Perception towards the Importance of Visual Aesthetics for Preservation of Permanent Forest Reserve (PFR) in Malaysia. Land 2022, 11, 1280. [Google Scholar] [CrossRef]
  50. Othman, N.; Mohamed, N.; Ariffin, M.H. Landscape Aesthetic Values and Visiting Performance in Natural Outdoor Environment. Procedia Soc. Behav. Sci. 2015, 202, 330–339. [Google Scholar] [CrossRef] [Green Version]
  51. Todorova, A.; Asakawa, S.; Aikoh, T. Preferences for and attitudes towards street flowers and trees in Sapporo, Japan. Landsc. Urban Plan. 2004, 69, 403–416. [Google Scholar] [CrossRef]
  52. Dang, H.; Li, J. The integration of urban streetscapes provides the possibility to fully quantify the ecological landscape of urban green spaces: A case study of Xi’an city. Ecol. Indic. 2021, 133, 108388. [Google Scholar] [CrossRef]
  53. Hu, T.; Wei, D.; Su, Y.; Wang, X.; Zhang, J.; Sun, X.; Liu, Y.; Guo, Q. Quantifying the shape of urban street trees and evaluating its influence on their aesthetic functions based on mobile lidar data. ISPRS J. Photogramm. Remote Sens. 2022, 184, 203–214. [Google Scholar] [CrossRef]
Figure 1. The location of the study area.
Heritage 05 00192 g001
Figure 2. Examples of the photos taken at approximately 50 m distances.
Heritage 05 00192 g002
Figure 3. Likert scale that used in this study.
Heritage 05 00192 g003
Figure 4. Shows the methodology framework.
Heritage 05 00192 g004
Figure 5. The independent-samples Mann–Whitney test shows the significant difference between gender groups in the three landscape character groups.
Heritage 05 00192 g005
Figure 6. The independent-samples Kruskal–Wallis test shows the significant difference between age groups in the two landscape character groups.
Heritage 05 00192 g006
Figure 7. The independent-samples Kruskal–Wallis test shows the significant difference between living groups in the two landscape character groups.
Heritage 05 00192 g007
Figure 8. The independent-samples Kruskal–Wallis test shows the significant difference between monthly income (IQD) groups in the two landscape character groups.
Heritage 05 00192 g008
Table 1. Overall data of the demographic survey.
Category Demographic Percentages (%)N
Gender1Male55.56%125
2Female44.44%100
Marital Status1Single52.89%119
2Married47.11%106
Age118–2721.78%49
228–3744.00%99
338–4720.00%45
448–578.89%20
558–705.33%12
Educational level1High school10.22%23
2Undergraduate/Bachelor’s degree46.67%105
3Postgraduate/Master’s or Ph.D. degree43.11%97
Living area1Semi-urban area26.67%60
2Historical urban area8.89%20
3Modern urban area64.44%145
Monthly income (IQD)10–499,00017.33%39
2500,000–999,00022.67%51
31,000,000–1,499,00028.00%63
41,500,000–1,999,00015.56%35
52,000,000–and above 16.44%37
How often did you visit Al-Rashid Street during the previous year?1Did not visit 27.56%62
21–2 times 33.78%76
33 times or more38.67%87
Table 2. Shows the rating details from the photo survey.
Negative Visual QualityPositive Visual Quality
No.Photos CodeMean ValueNo.Photos CodeMean Value
01V18−1.2901V25+0.10
02V12−1.2402V03+0.18
03V02−0.9403V26+0.20
04V14−0.9304V08+0.22
05V15−0.9105V05+0.31
06V32−0.9006V07+0.42
07V19−0.8307V06+0.48
08V31−0.81
09V20−0.80
10V01−0.75
11V16−0.74
12V17−0.71
13V30−0.70
14V13−0.69
15V23−0.60
16V10−0.60
17V24−0.57
18V29−0.52
19V27−0.51
20V21−0.51
21V22−0.51
22V09−0.32
23V28−0.28
24V11−0.26
25V04−0.18
Table 3. Shows the positive and negative visual quality photo survey rating.
Code (Mean)Negative Visual Quality PhotoCode (Mean)Positive Visual Quality Photo
V19 (m = −0.83)Heritage 05 00192 i001V25 (m = +0.10)Heritage 05 00192 i002
V32 (m = −0.90)Heritage 05 00192 i003V03 (m = +0.18)Heritage 05 00192 i004
V15 (m = −0.91)Heritage 05 00192 i005V26 (m = +0.20)Heritage 05 00192 i006
V14 (m = −0.93)Heritage 05 00192 i007V08 (m = +0.22)Heritage 05 00192 i008
V02 (m = −0.94)Heritage 05 00192 i009V05 (m = +0.31)Heritage 05 00192 i010
V12 (m = −1.24)Heritage 05 00192 i011V07 (m = +0.42)Heritage 05 00192 i012
V18 (m = −1.29)Heritage 05 00192 i013V06 (m = +0.48)Heritage 05 00192 i014
V18 highly negative visual quality score V06 highly positive visual quality score
Table 4. Heatmap analysis to identify elements and characters for visual quality.
Landscape Character
(Mean)
Code (Mean)Before
Heatmap Analysis
After
Heatmap Analysis
Negative visual qualityModern facade of historical building view
(m = −1.06)
V19 (m = −0.83)Heritage 05 00192 i015Heritage 05 00192 i016
V18 (m = −1.29)Heritage 05 00192 i017Heritage 05 00192 i018
Concrete wall with historical building view
(m = −1.02)
V15 (m = −0.91)Heritage 05 00192 i019Heritage 05 00192 i020
V14 (m = −0.93)Heritage 05 00192 i021Heritage 05 00192 i022
V12 (m = −1.24)Heritage 05 00192 i023Heritage 05 00192 i024
Degraded historical building view
(m = −0.92)
V32 (m = −0.90)Heritage 05 00192 i025Heritage 05 00192 i026
V02 (m = −0.94)Heritage 05 00192 i027Heritage 05 00192 i028
0
Positive visual qualityHistorical mosque view
(m = +0.15)
V26 (m = +0.20)Heritage 05 00192 i029Heritage 05 00192 i030
V25 (m = +0.10)Heritage 05 00192 i031Heritage 05 00192 i032
Landscape with historical building view
(m = +0.32)
V08 (m = +0.22)Heritage 05 00192 i033Heritage 05 00192 i034
V07 (m = +0.42)Heritage 05 00192 i035Heritage 05 00192 i036
Unique historical building view
(m = +0.32)
V06 (m = +0.48)Heritage 05 00192 i037Heritage 05 00192 i038
V05 (m = +0.31)Heritage 05 00192 i039Heritage 05 00192 i040
V03 (m = +0.18)Heritage 05 00192 i041Heritage 05 00192 i042
Table 5. Shows heatmap and elements impact of the visual quality assessment.
Landscape Character CodeElements ImpactFindings
Negative visual qualityHeritage 05 00192 i043Modern facade of historical building view
(m = −1.06)
V19Building—Modern facade
Cart
Trolley
The highly negative visual quality is a result of buildings with new modern facades that are inconsistent with the old historical area. In addition, carts and trolleys contribute to visual pollution.
V18Building—Modern facade
Historical building—Degraded
Cart
Concrete wall with historical building view
(m = −1.02)
V15Concrete wall
Cart
Building—Unique design
The highly negative visual quality is the result of a concrete wall and carts on the street, as well as the building’s divergent architectural style from that of the surrounding historical district. Billboards also contribute to visual pollution.
V14Concrete wall
Cart
Building—Unique design
V12Concrete wall
Cart
Billboards
Degraded historical building view
(m = −0.92)
V32Historical building—DegradedThe negative visual quality is the result of degraded historical buildings. Motorbikes, trolleys, and planter boxes on the street also contribute to visual pollution.
V02Historical building—Degraded
Motorbike
Trolley
Planter box on the street
0
Positive visual qualityHeritage 05 00192 i044Historical mosque view
(m = +0.15)
V26Historical building—Mosque
Historical building—Unique
Trolley
The positive visual quality is a result of the historical mosque, On the other hand, carts, motorbikes, and trolleys contributed to the lower visual aesthetic quality of the historical district.
V25Historical building—Mosque
Historical building—Degraded
Cart
Motorbike
Trolley
Landscape with historical building view
(m = +0.32)
V08Plant
Cart
Electricity wires
Motorbike
The positive visual quality is a result of mixing landscape with the historical buildings. On the other hand, carts, motorbikes, and electricity wires contributed to the lower visual aesthetic quality of the historical district.
V07Plant
Cart
Historical building—Unique
Unique historical building view
(m = +0.32)
V06Historical building—Unique
Cart
Motorbike
The positive visual quality is a result of a unique historical building style. On the other hand, carts and motorbikes contributed to the lower visual aesthetic quality of the historical district.
V05Historical building—Unique
Trolley
V03Historical building—Unique
Cart
Motorbike
Table 6. Shows the results of the statistical analysis of reliability.
Visual QualityLandscape CharacterCodeReliability
Cronbach’s Alpha
Negative visual quality
NVQ
Modern facade of historical building viewV190.863
V180.876
Concrete wall with historical building viewV150.863
V140.869
V120.873
Degraded historical building viewV320.869
V020.863
Positive visual quality
PVQ
Historical mosque viewV260.860
V250.864
Landscape with historical building viewV080.862
V070.859
Unique historical building viewV060.863
V050.865
V030.863
Total reliability (Cronbach’s Alpha) for 14 photos0.874
Table 7. The independent-samples Mann–Whitney test results show differences in responses between genders.
VQNull HypothesisGenderSig.Decision
Male
(N = 125)
Mean Rank
Female
(N = 100)
Mean Rank
NVQThe distribution of “Modern facade of historical building” view is the same across categories of Gender.104.80123.250.027 *Reject the null hypothesis
The distribution of “Concrete wall with historical building” view is the same across categories of Gender.105.00123.000.031 *Reject the null hypothesis
PVQThe distribution of “Historical mosque” view is the same across categories of Gender.122.19101.520.015 *Reject the null hypothesis
Note 1: the “*” sign indicates that the significant level is smaller or equal to 0.05. Note 2: VQ = Visual Quality, PVQ = Positive visual quality, and NVQ = Negative visual quality.
Table 8. The independent-samples Kruskal–Wallis test results show differences in responses between respondents with different ages.
VQNull HypothesisAgeSig.Decision
18–27
N = 49
Mean
28–37
N = 99
Mean
38–47
N = 45
Mean
48–57
N = 20
Mean
58–70
N = 12
Mean
PVQThe distribution of “Historical mosque” view is the same across categories of Age.113.19108.06137.8986.28104.170.024 *Reject the null hypothesis
The distribution of “Landscape with historical building” view is the same across categories of Age.109.07107.03140.9195.20103.330.020 *Reject the null hypothesis
Note 1: the “*” sign indicates that the significant level is smaller or equal to 0.05. Note 2: VQ = Visual quality, PVQ = Positive visual quality.
Table 9. The independent-samples Kruskal–Wallis test results show differences in responses between respondents with different living areas.
VQNull HypothesisLiving AreaSig.Decision
Semi-
Urban
N = 60
Mean
Historical Urban
N = 20
Mean
Modern Urban
N = 145
Mean
NVQThe distribution of “Modern facade of historical building” view is the same across categories of Living.124.13135.32105.320.035 *Reject the null hypothesis
PVQThe distribution of “Historical mosque” view is the same across categories of living.89.79121.98121.370.004 *Reject the null hypothesis
Note 1: the “*” sign indicates that the significant level is smaller or equal to 0.05. Note 2: VQ = Visual quality, PVQ = Positive visual quality, and NVQ = Negative visual quality.
Table 10. The independent-samples Kruskal–Wallis test results show differences in responses between respondents with different monthly incomes (IQD).
VQNull HypothesisMonthly Income (IQD) 000Sig.Decision
(0–499)
N = 39
Mean
(500–999)
N = 51
Mean
(1000–1499)
N = 63
Mean
(1500–1999)
N = 35
Mean
(2000–above)
N = 37
Mean
NVQThe distribution of “Modern facade of historical building” view is the same across categories of Income.138.54125.4493.33114.57100.930.003 *Reject the null hypothesis
The distribution of “Degraded historical building view” is the same across categories of Income.132.23124.80103.09119.1187.550.009 *Reject the null hypothesis
Note 1: the “*” sign indicates that significant level is smaller or equal to 0.05. Note 2: VQ = Visual Quality, NVQ = Negative visual quality.
Publisher’s Note: MDPI stays neutral with regard to jurisdictional claims in published maps and institutional affiliations.

