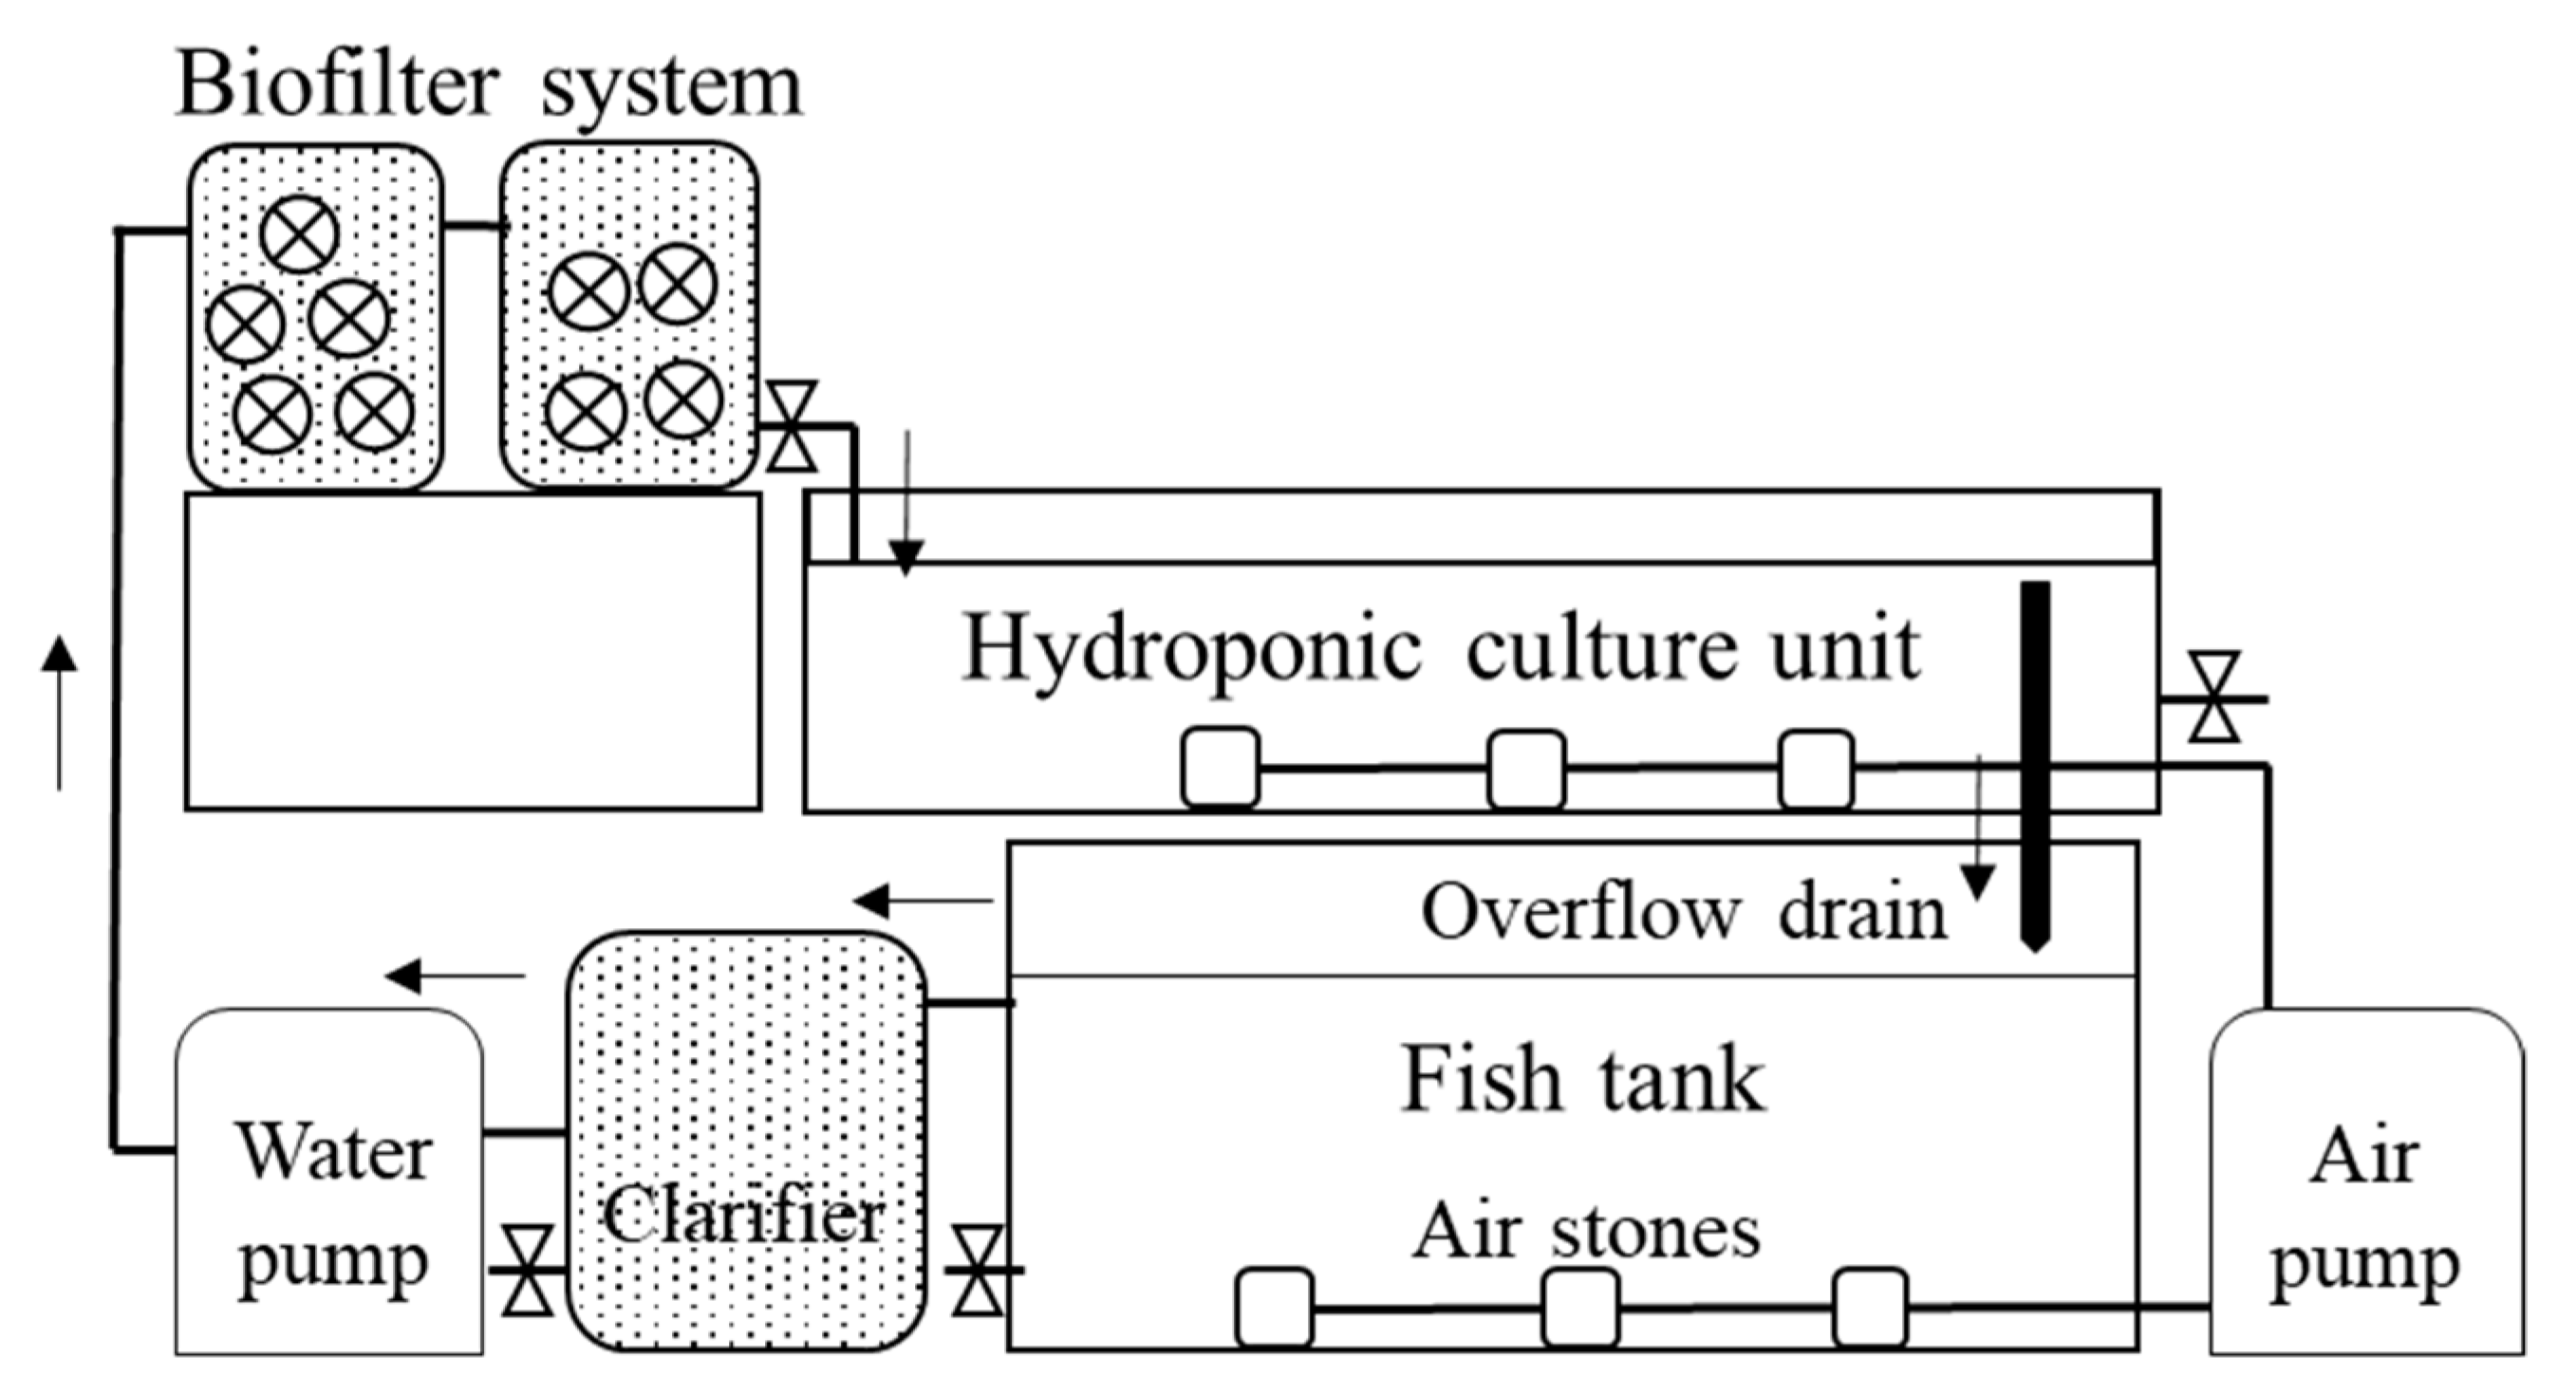
Figure 1.
Schematic diagram of the experimental aquaponic system adapted from Yang and Kim (2019).
Figure 1.
Schematic diagram of the experimental aquaponic system adapted from Yang and Kim (2019).
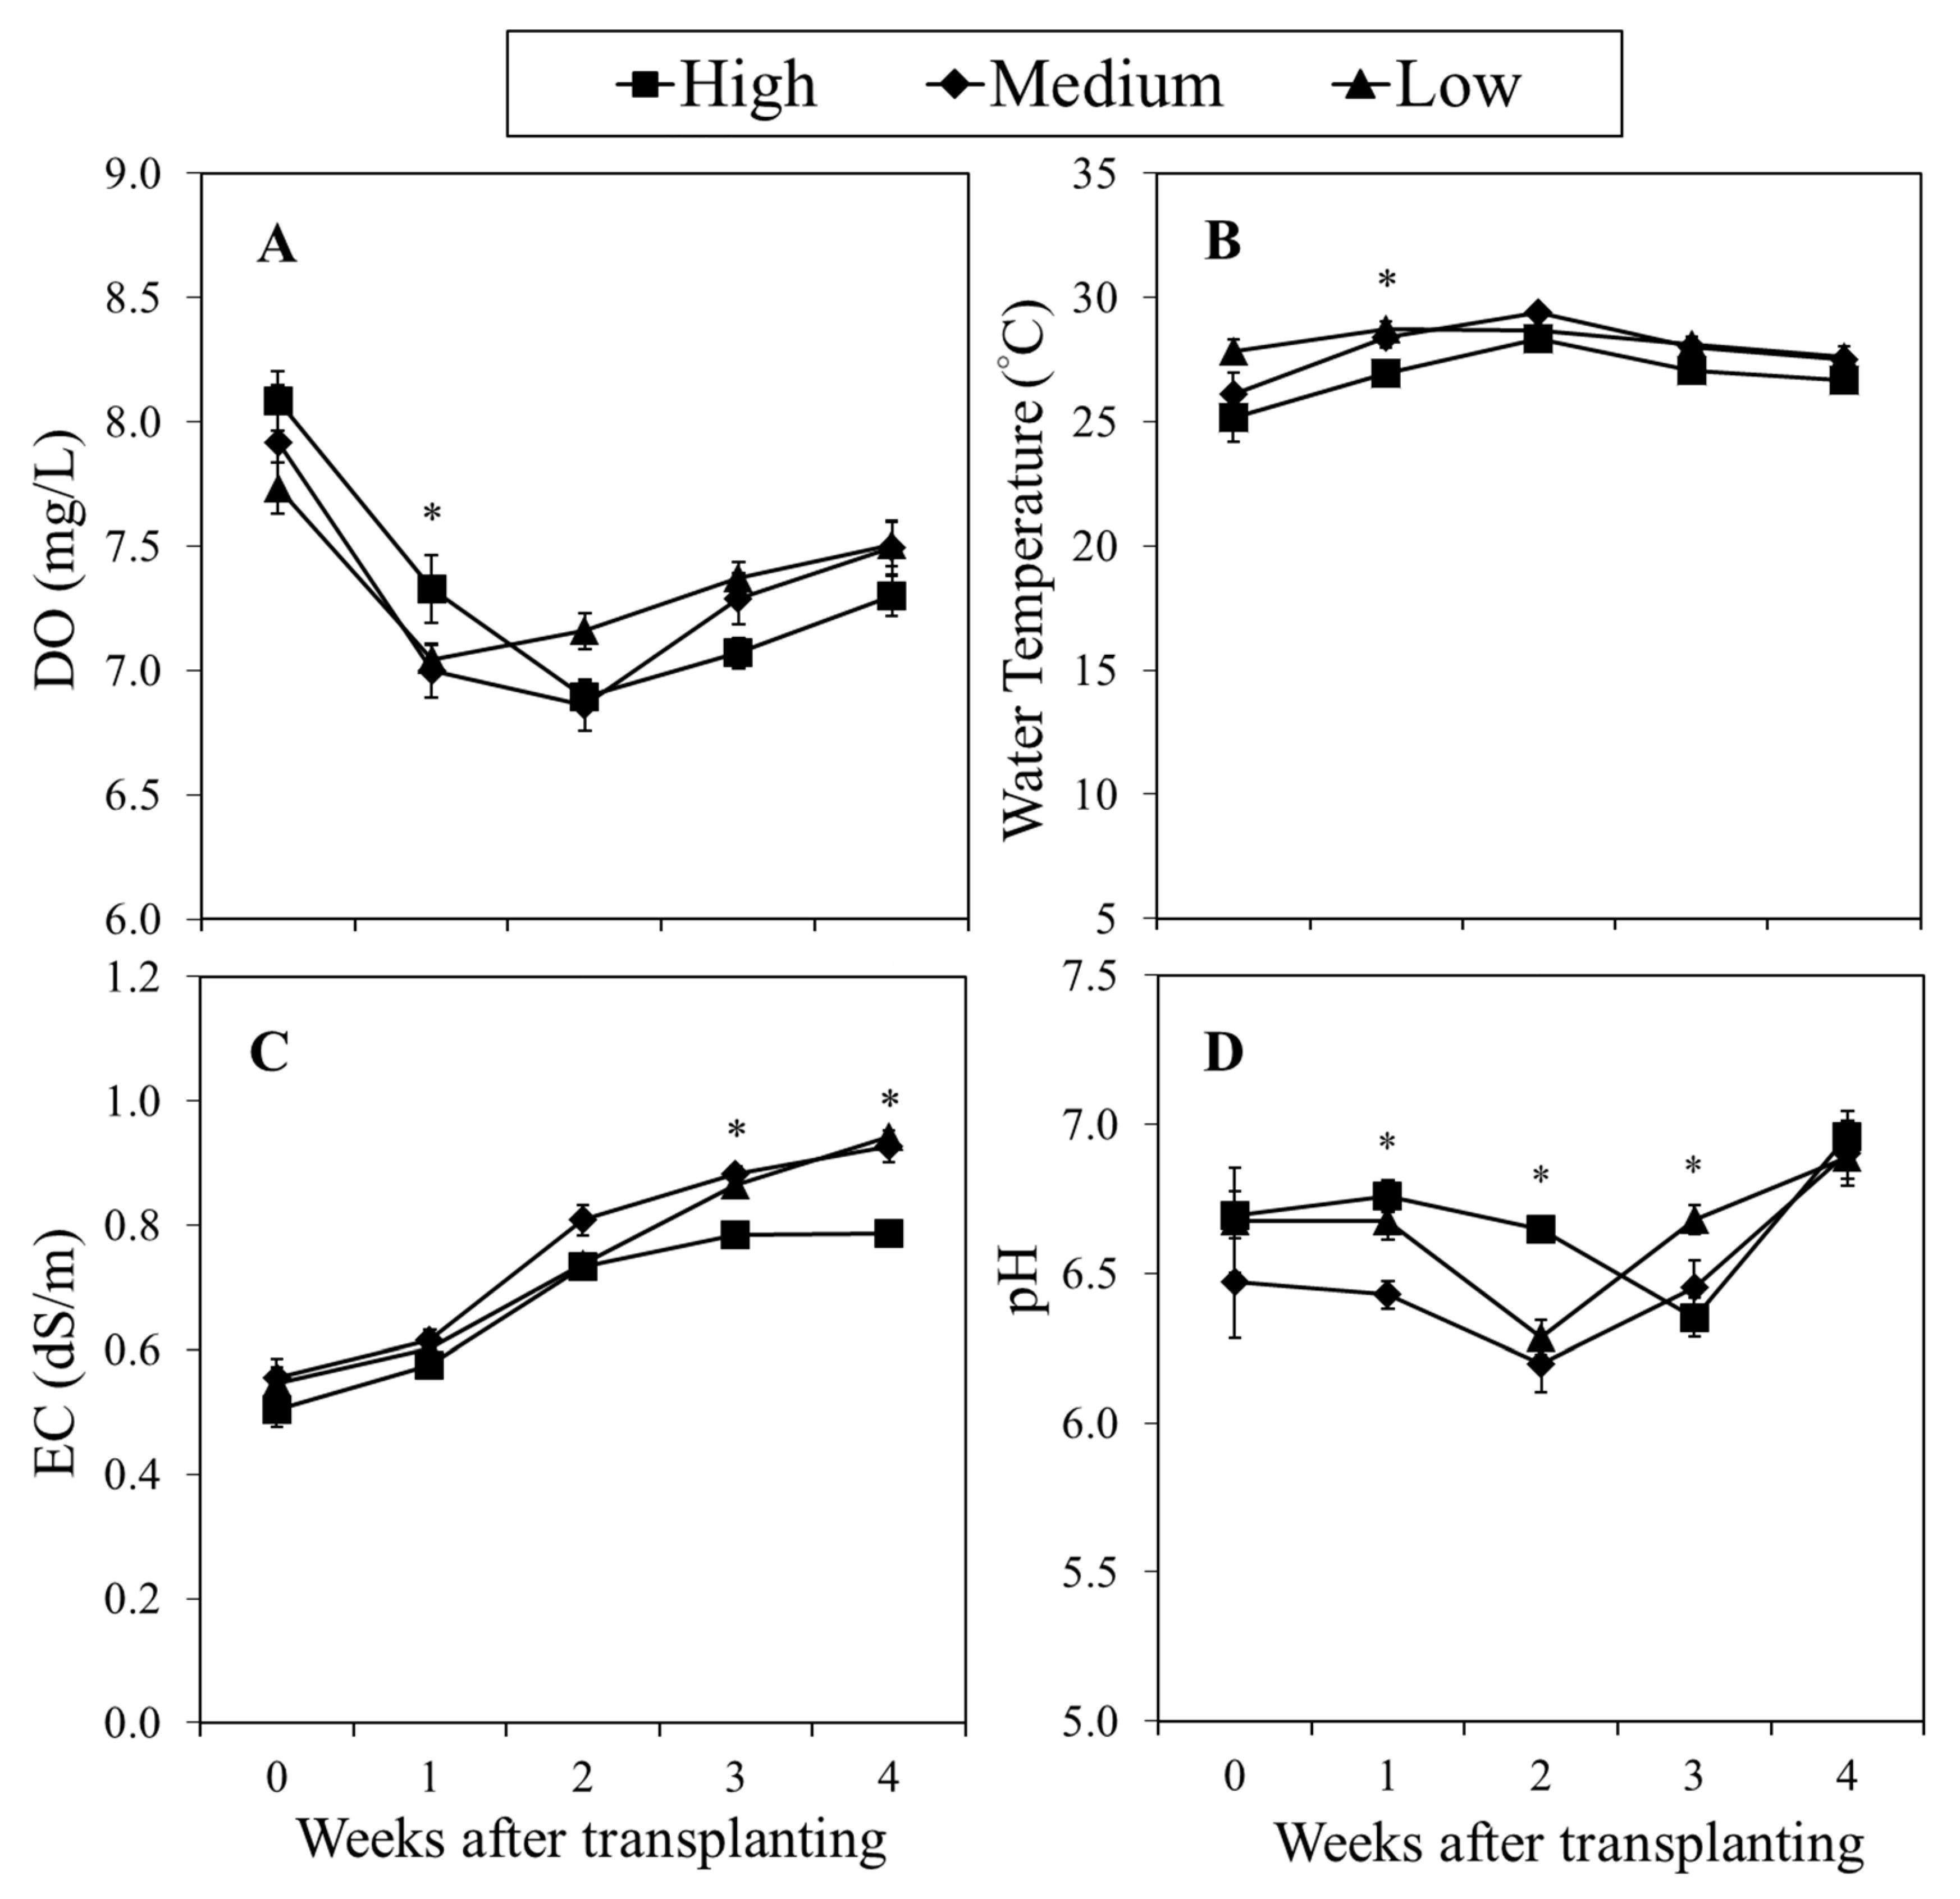
Figure 2.
Weekly changes in (A) dissolved oxygen (DO), (B) water temperature, (C) electrical conductivity (EC), and (D) pH as affected by flow rate treatments: high (HFR, 3.3 m/day), medium (MFR, 2.2 m/day), and low (LFR, 1.1 m/day) flow rate. Water samples were measured daily from fish tank and grow bed in the aquaponic system. Each data point is the weekly mean of 4 replicates ± SE. ns, *, **, *** mean no significant or significant differences at p ≤ 0.05, 0.01, or 0.001, respectively.
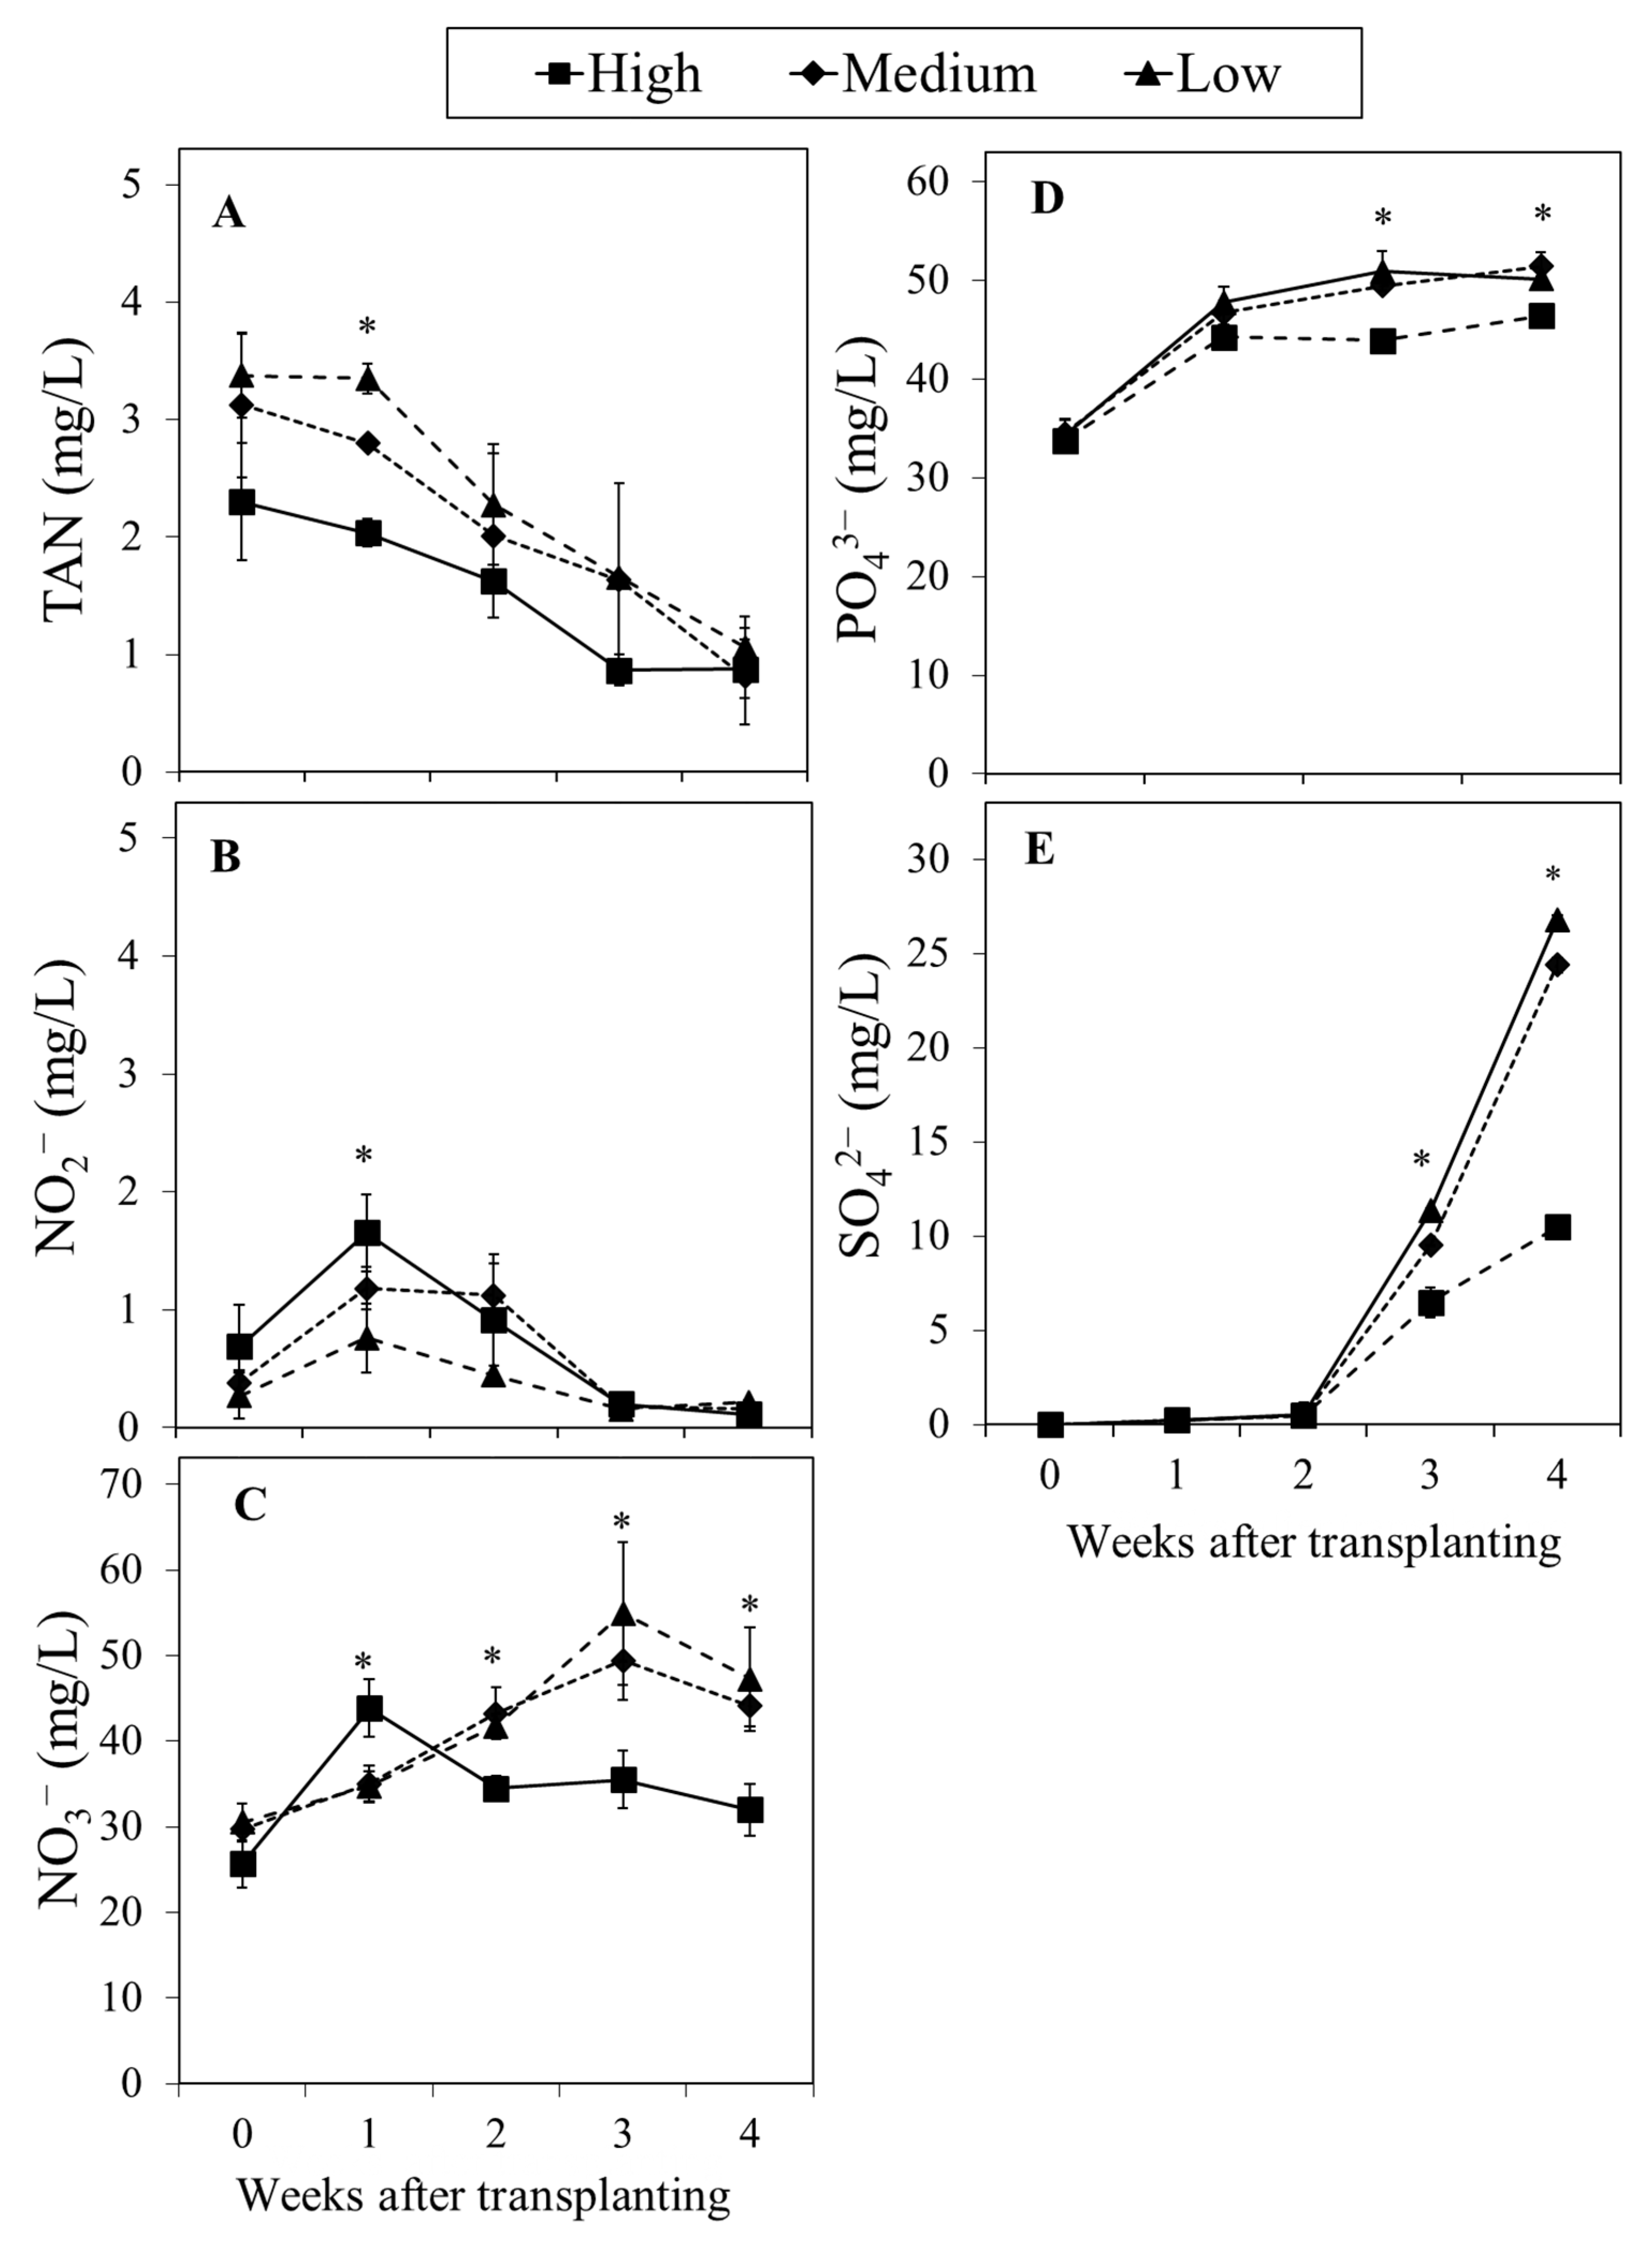
Figure 3.
(A–E) Dynamic changes in (A) total ammonium nitrogen (TAN), (B) phosphate (PO43−), (C) nitrite (NO2−), (D) sulphate (SO42−), and (E) nitrate (NO3−) over 4 weeks as affected by high (3.3 m/day), medium (2.2 m/day), and low (1.1 m/day) flow rate treatments. Data were measured every three days and weekly data were combined to show significant differences. Each data point is the mean of 4 replicates ± SE. ns, *, **, *** mean no significant or significant differences at p ≤ 0.05, 0.01, or 0.001, respectively.
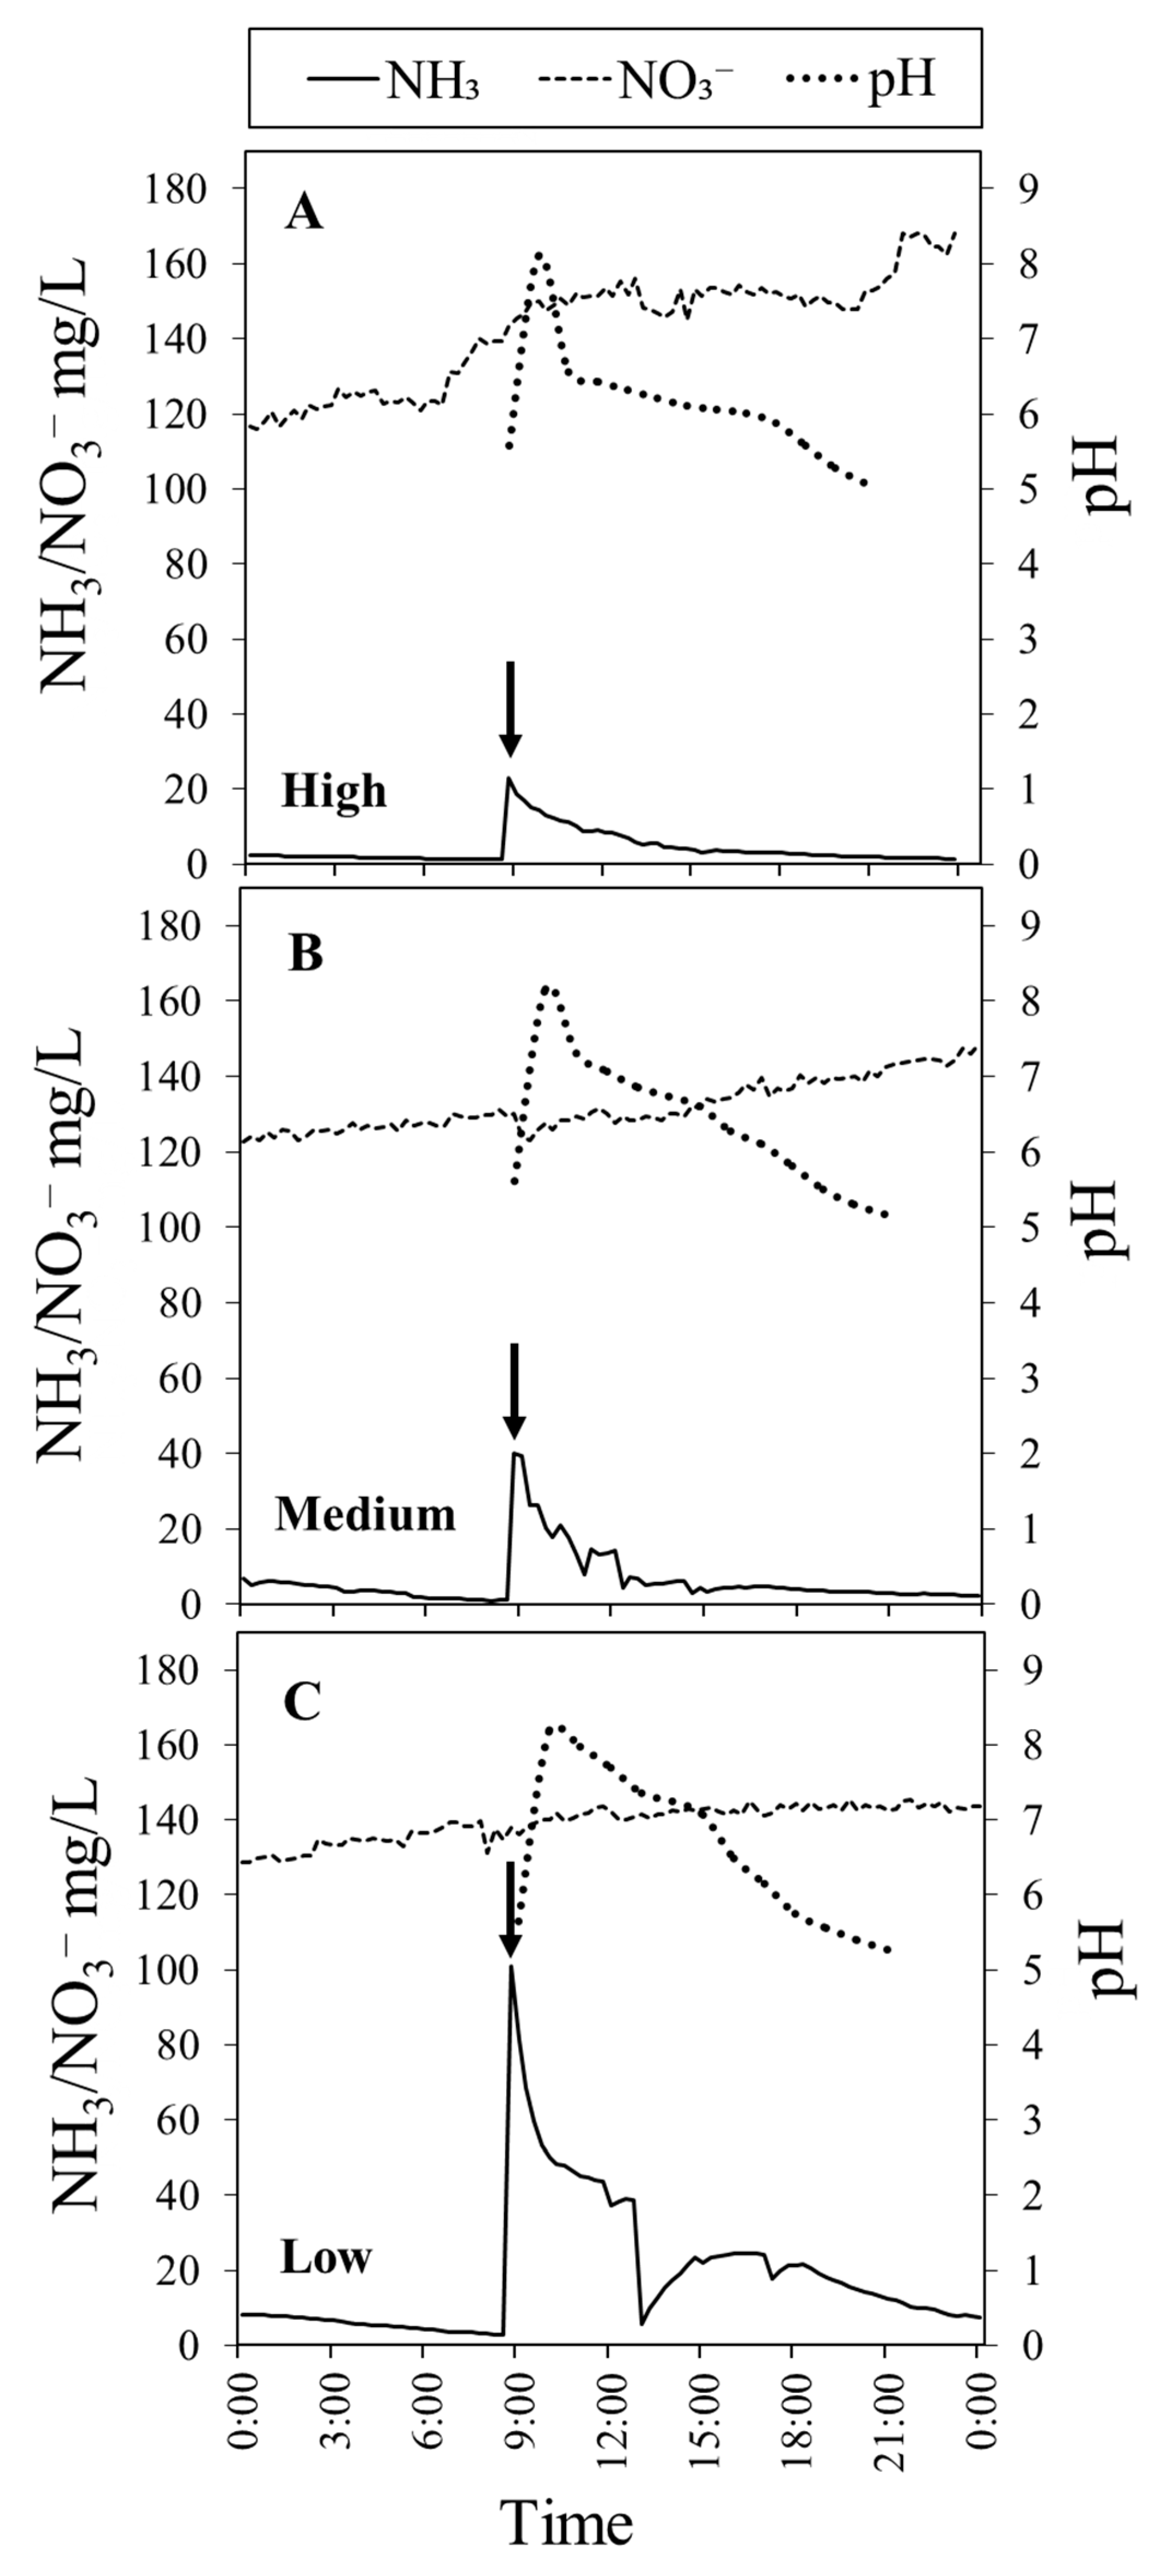
Figure 4.
(A–C) Dynamic changes in ammonia (NH3; solid line), nitrate (NO3−; dashed line), and pH (dotted line) over 24 h as affected by high (3.3 m/day), medium (2.2 m/day), and low (1.1 m/day) flow rate treatments, which were measured in the absence of plants. Arrow indicates the time when fish feed (0.5% fish fresh weight) was applied to the fish tank. Data represent the mean of 3 replicates.
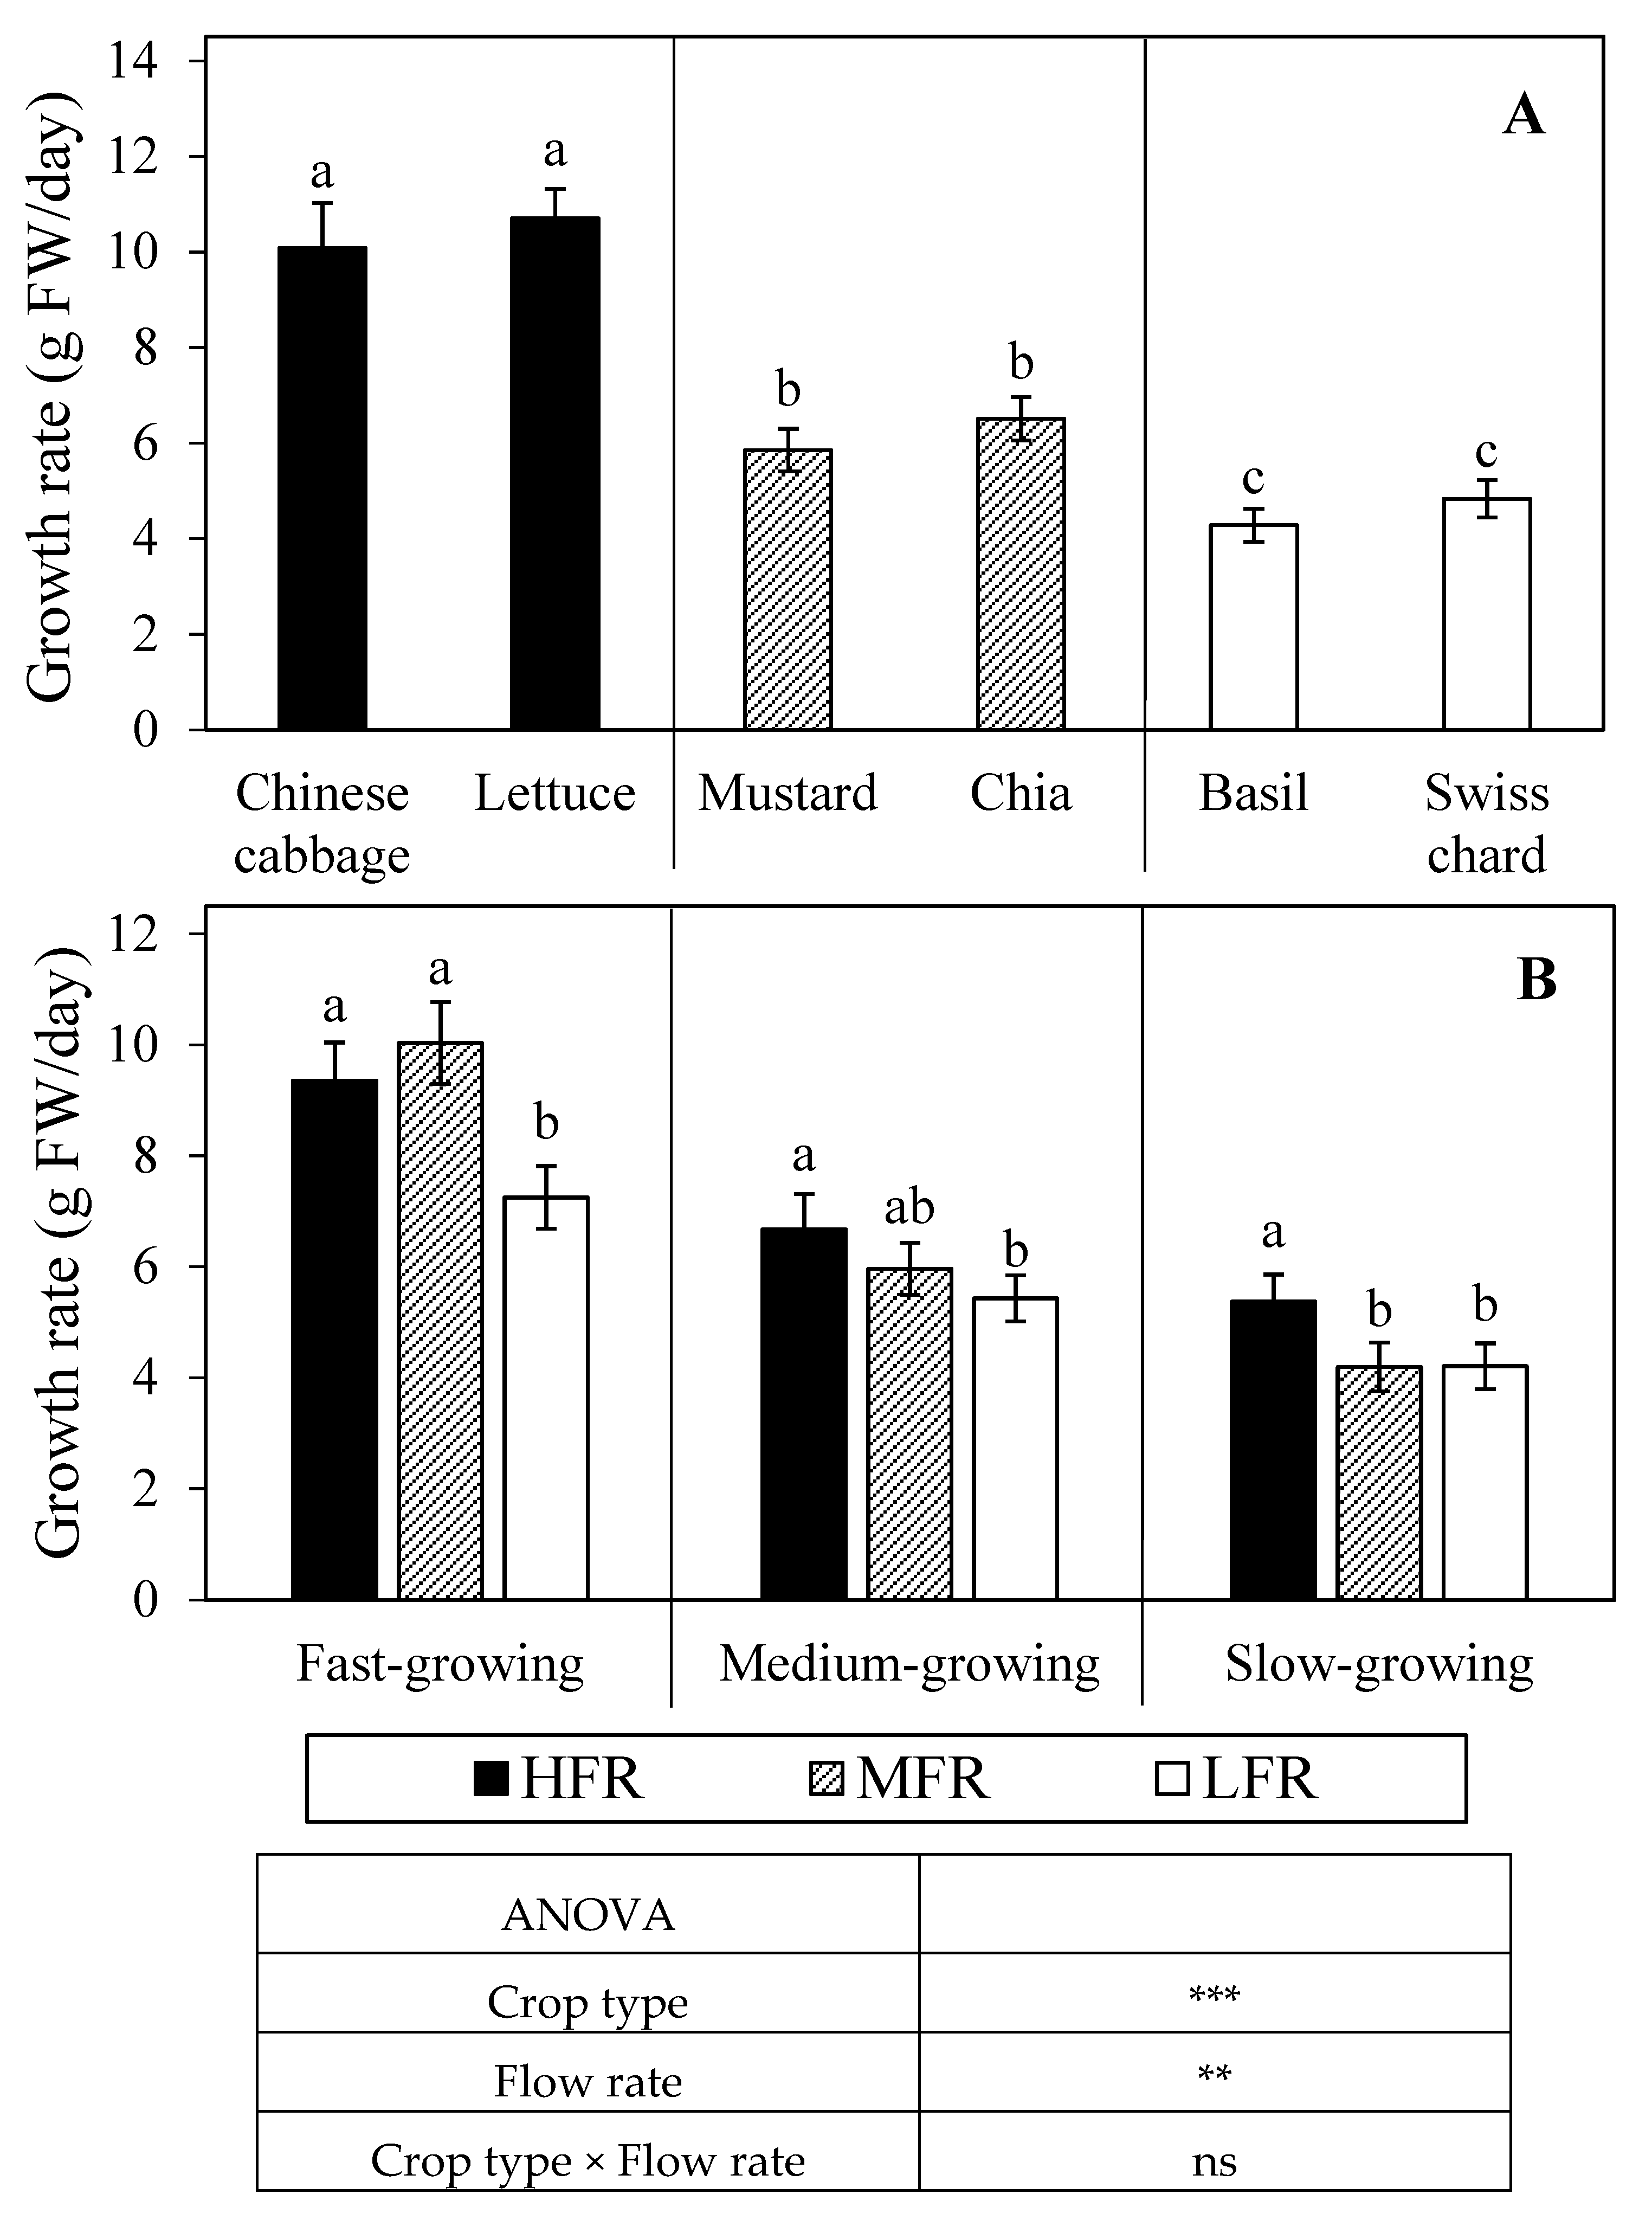
Figure 5.
(A) Daily growth rate of fast-growing (Chinese cabbage, lettuce), medium-growing (mustard, chia), and slow-growing (basil, Swiss chard) crops in aquaponics and (B) their growth rate as affected by high (HFR, 3.3 m/day), medium (MFR, 2.2 m/day), and low (LFR, 1.1 m/day) flow rate. The same letter (A) across all species and (B) within the same crop type is not significantly different based on Tukey’s honestly significant difference test (α = 0.05). Data represent the mean of (A) 16 replicates ± SE and (B) 32 replicates ± SE. ns, *, **, *** mean no significant or significant differences at p ≤ 0.05, 0.01, or 0.001, respectively.
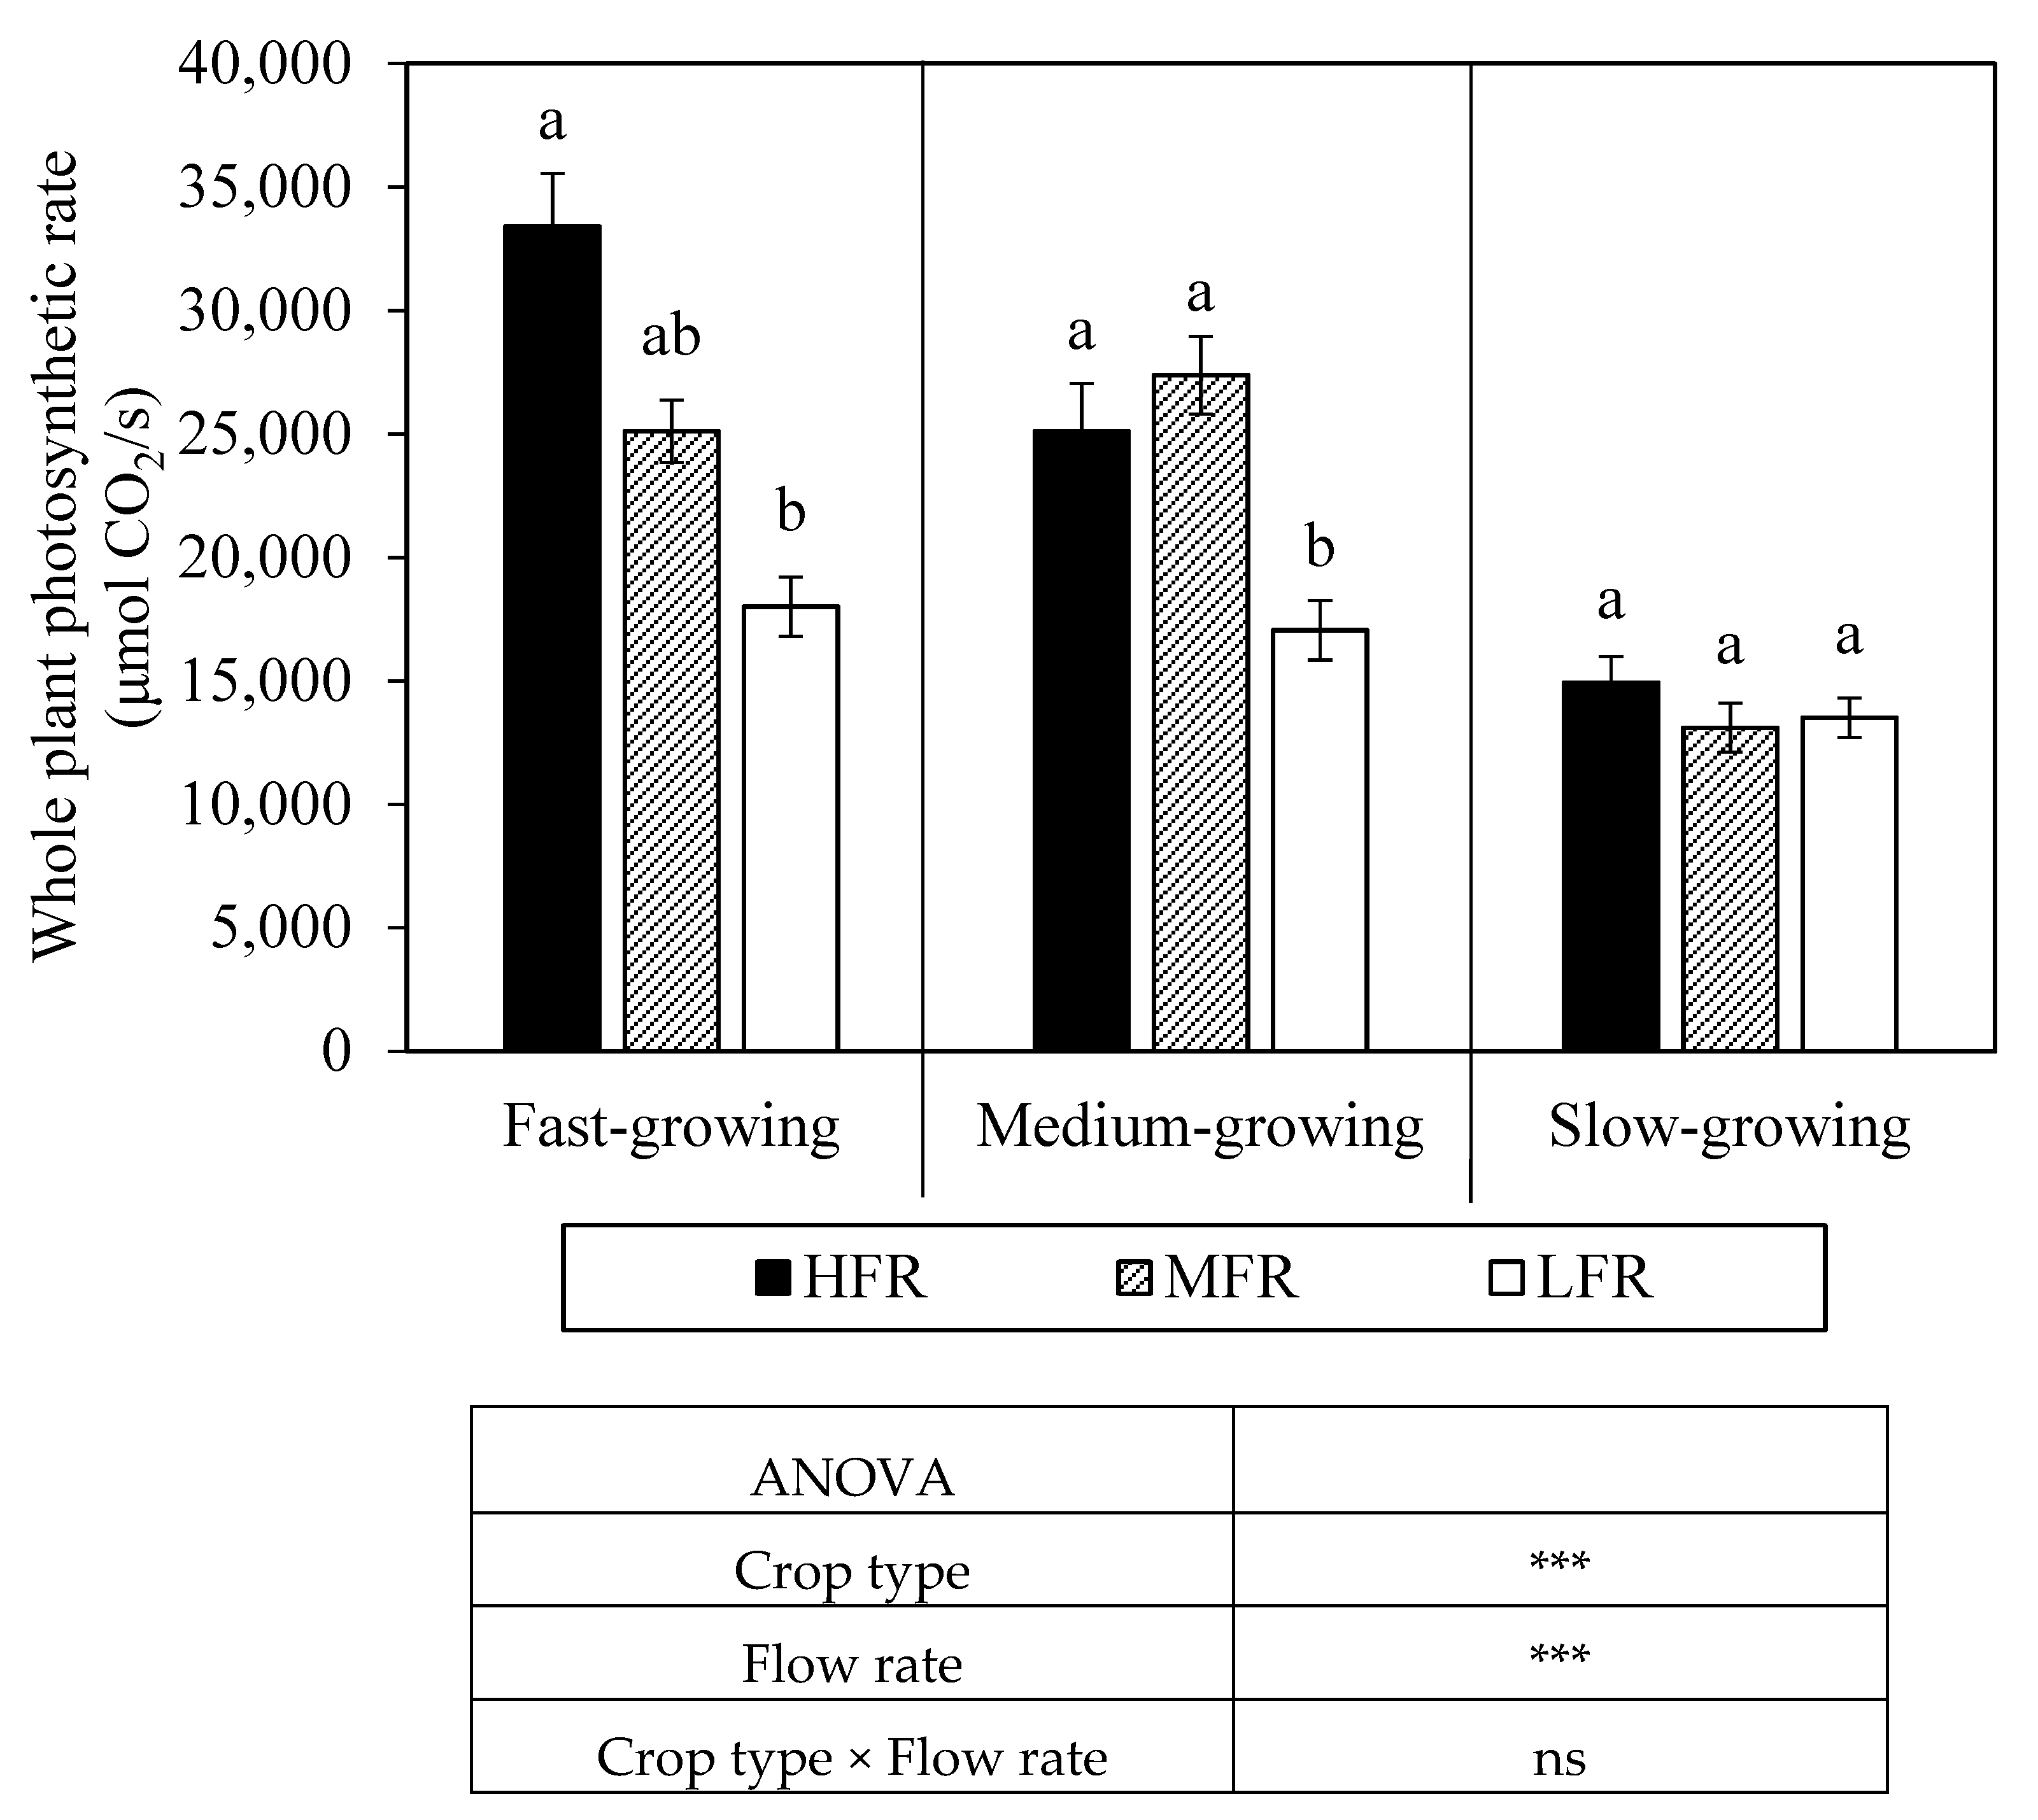
Figure 6.
Whole plant photosynthetic rate of fast-growing (Chinese cabbage, lettuce), medium-growing (mustard, chia), and slow-growing (basil, Swiss chard) crops in aquaponics as affected by high (HFR, 3.3 m/day), medium (MFR, 2.2 m/day), and low (LFR, 1.1 m/day) flow rate. The same letter within the same plant category is not significantly different based on Tukey’s honestly significant difference test (α = 0.05). Data represent the mean of 18 replicates ± SE. ns, *, **, *** mean no significant or significant at p ≤ 0.05, 0.01, or 0.001, respectively.
Table 1.
Flow-rate treatments, high (HFR, 3.3 m/day), medium (MFR, 2.2 m/day), and low (LFR, 1.1 m/day) flow rate, set up for deep water culture (DWC) recirculating aquaponic systems.
Table 1.
Flow-rate treatments, high (HFR, 3.3 m/day), medium (MFR, 2.2 m/day), and low (LFR, 1.1 m/day) flow rate, set up for deep water culture (DWC) recirculating aquaponic systems.
| Treatment | Flow Rate z (L/min) | Flow Rate (L/h) | Flow Rate (L/day) | HLR y (m3/m2/day) | HRT x for DWC System (h) |
|---|
| HFR | 2.30 | 138 | 3312 | 3.3 | 5.8 |
| MFR | 1.53 | 92 | 2203 | 2.2 | 8.7 |
| LFR | 0.77 | 46 | 1109 | 1.1 | 17.3 |
| Recommended flow rate | | | | | |
| Aquaponics w | 26.7 | 1600 | 38400 | 38.4 | 0.5 |
| Hydroponics v | 2–3 | 120–180 | 2880–4320 | 2.9–4.3 | 4.4–6.7 |
Table 2.
Average values of physical and chemical water-quality parameters in fish tank for 4 weeks as affected by high (HFR, 3.3 m/day), medium (MFR, 2.2 m/day), and low (LFR, 1.1 m/day) flow rate.
Table 2.
Average values of physical and chemical water-quality parameters in fish tank for 4 weeks as affected by high (HFR, 3.3 m/day), medium (MFR, 2.2 m/day), and low (LFR, 1.1 m/day) flow rate.
| Flow Rate Treatment | DO z (mg/L) | Water Temperature (°C) | EC (dS/m) | pH | pH Correction Solution Used (mL/day) |
|---|
| HFR | 7.69 ± 0.05 y | 26.37 ± 0.14 b x | 0.70 ± 0.007 b | 6.66 ± 0.03 | 105.6 ± 7.5 b |
| MFR | 7.71 ± 0.05 | 27.14 ± 0.12 a | 0.79 ± 0.012 a | 6.68 ± 0.04 | 117.5 ± 9.3 ab |
| LFR | 7.81 ± 0.04 | 27.02 ± 0.13 a | 0.76 ± 0.011 a | 6.49 ± 0.04 | 134.6 ± 6.3 a |
Table 3.
Average concentrations of total ammonia nitrogen (TAN), nitrite (NO2–N), nitrate (NO3–N), phosphate (PO4–P), and sulfate (SO4–S) in aquaponic solution as affected by high (HFR, 3.3 m/day), medium (MFR, 2.2 m/day), and low (LFR, 1.1 m/day) flow rate. Water samples for analyses were collected from fish tanks.
| Flow Rate Treatment | TAN | NO2–N | NO3–N | PO4–P | SO4–S |
|---|
| (mg/L) |
|---|
| High Flow Rate | 1.19 z | 0.45 | 31.9 b y | 43.5 b | 3.56 b |
| Medium Flow Rate | 1.98 | 0.39 | 38.3 a | 46.4 ab | 5.00 a |
| Low Flow Rate | 1.45 | 0.34 | 39.1 a | 50.6 a | 5.98 a |
| p significance x | ns | ns | *** | ** | * |
| Correlation coefficient with flow rate | −0.13 w | 0.03 | −0.40 | −0.57 v | −0.47 |
| p significance | ns | ns | ** | *** | * |
Table 4.
Plant growth parameters of fast-, medium-, and slow-growing crops grown in aquaponics for 4 weeks at high (HFR, 3.3 m/day), medium (MFR, 2.2 m/day), and low (LFR, 1.1 m/day) flow rate.
Table 4.
Plant growth parameters of fast-, medium-, and slow-growing crops grown in aquaponics for 4 weeks at high (HFR, 3.3 m/day), medium (MFR, 2.2 m/day), and low (LFR, 1.1 m/day) flow rate.
| Crop Type | Flow Rate Treatment | Plant Height (cm) | Leaf Number (n/plant) | Leaf Area (cm2/plant) | Leaf Length (cm) | Specific Leaf Area (cm2/g) | Leaf Temperature (°C) |
|---|
| Fast-growing | HFR | 25.3 ns z | 13.8 ns | 3094 ns | 28.9 ns | 252.2 ns | 23.3 b y |
| MFR | 27.1 | 13.5 | 3078 | 31.1 | 259.9 | 23.7 a |
| LFR | 26.9 | 13.8 | 2911 | 30.0 | 233.0 | 23.6 a |
| Medium-growing | HFR | 40.6 ns | 28.2 ns | 1647 ns | 36.5 ns | 120.5 ns | 23.6 b |
| MFR | 39.0 | 35.3 | 1554 | 33.5 | 119.3 | 24.0 a |
| LFR | 35.1 | 33.1 | 1516 | 30.7 | 112.1 | 24.1 a |
| Slow-growing | HFR | 36.3 ns | 36.9 ns | 1403 ns | 25.1 ns | 117.5 ns | 23.8 b |
| MFR | 34.5 | 34.2 | 1307 | 21.6 | 116.3 | 23.8 b |
| LFR | 34.4 | 34.4 | 1194 | 20.5 | 113.7 | 24.2 a |
| | | | ANOVA | | | |
| Crop type | *** x | *** | *** | *** | *** | *** |
| Flow rate | ns | ns | ns | ns | ns | *** |
| Crop type × Flow rate | ns | ns | ns | ns | ns | * |
Table 5.
Fresh and dry weight of fast-growing, medium-growing, and slow-growing crops grown in aquaponics with high (HFR, 3.3 m/day), medium (MFR, 2.2 m/day), and low (LFR, 1.1 m/day) flow rate.
Table 5.
Fresh and dry weight of fast-growing, medium-growing, and slow-growing crops grown in aquaponics with high (HFR, 3.3 m/day), medium (MFR, 2.2 m/day), and low (LFR, 1.1 m/day) flow rate.
| Crop Type | Flow Rate Treatment | Fresh Weight (g/plant) | Dry Weight (g/plant) |
|---|
| Total | Shoots | Roots | Total | Shoots | Roots |
|---|
| Fast-growing | HFR | 323.0z a y | 287.8 a | 35.2 a | 9.6 a | 8.9 a | 0.67 |
| MFR | 332.3 a | 300.1 a | 32.2 a | 9.9 a | 9.2 a | 0.66 |
| LFR | 278.4 b | 249.6 b | 28.8 b | 7.1 b | 6.4 b | 0.71 |
| Medium-growing | HFR | 198.3 a | 153.0 a | 45.0 | 10.5 a | 9.4 a | 1.09 |
| MFR | 157.6 ab | 126.7 ab | 29.8 | 8.7 ab | 7.6 ab | 1.11 |
| LFR | 144.4 b | 101.6 b | 32.3 | 7.8 b | 6.8 b | 0.96 |
| Slow-growing | HFR | 154.7 a | 115.6 | 39.1 a | 9.3 a | 8.3 a | 0.95 |
| MFR | 147.9 b | 112.4 | 35.5 ab | 7.1 b | 6.0 ab | 1.06 |
| LFR | 123.4 b | 91.5 | 31.9 b | 6.8 b | 5.8 b | 1.01 |
| | | | ANOVA | | | |
| Crop type | *** x | *** | *** | *** | *** | *** |
| Flow rate | *** | ** | *** | ** | ** | ns |
| Crop type × Flow rate | * | * | ns | ns | ns | ns |
Table 6.
Fish production in aquaponics grown for 4 weeks at high (HFR, 3.3 m/day), medium (MFR, 2.2 m/day), and low (LFR, 1.1 m/day) flow rate.
Table 6.
Fish production in aquaponics grown for 4 weeks at high (HFR, 3.3 m/day), medium (MFR, 2.2 m/day), and low (LFR, 1.1 m/day) flow rate.
| Flow Rate Treatment | Fish Feed Applied (g) | Initial Stocking Density (kg/m3) | Final Stocking Density (kg/m3) | Fish Biomass Gain z (kg/tank) | SGR y (%) | FCR x | Water Replenishment (L) |
|---|
| HFR | 1980 | 19.5 ns | 26.5 ns | 2.7 a | 3.3 a | 0.69 | 203 ns |
| MFR | 1980 | 19.3 | 24.4 | 1.9 ab | 2.1 ab | 1.06 | 177 |
| LFR | 1980 | 19.3 | 22.4 | 1.2 b | 0.6 b | 1.55 | 133 |
Table 7.
Total nitrogen content (g/plant) and SPAD value of fast-growing, medium-growing, and slow-growing crops grown in aquaponics at high (HFR, 3.3 m/day), medium (MFR, 2.2 m/day), and low (LFR, 1.1 m/day) flow rate.
Table 7.
Total nitrogen content (g/plant) and SPAD value of fast-growing, medium-growing, and slow-growing crops grown in aquaponics at high (HFR, 3.3 m/day), medium (MFR, 2.2 m/day), and low (LFR, 1.1 m/day) flow rate.
| Crop Type | Flow Rate Treatment | Total Nitrogen (g/plant) | SPAD Value |
|---|
| Total | Shoots | Roots |
|---|
| Fast-growing | HFR | 0.65 z a y | 0.61 a | 0.09 a | 19.4 a |
| MFR | 0.58 b | 0.51 b | 0.08 b | 19.1 a |
| LFR | 0.31 c | 0.27 c | 0.07 c | 14.5 b |
| Medium-growing | HFR | 0.47 a | 0.43 a | 0.05 a | 32.6 a |
| MFR | 0.34 ab | 0.35 ab | 0.02 b | 28.1 b |
| LFR | 0.28 b | 0.27 b | 0.02 b | 22.4 c |
| Slow-growing | HFR | 0.38 a | 0.34 a | 0.04 a | 30.4 a |
| MFR | 0.27 ab | 0.25 ab | 0.02 b | 29.7 ab |
| LFR | 0.20 b | 0.18 b | 0.02 b | 27.7 b |
| | | ANOVA | | |
| Crop type | **x | *** | * | *** |
| Flow rate | * | * | * | *** |
| Crop type × Flow rate | ns | ns | ns | ns |
Table 8.
Plant photosynthetic rate (Pn), stomatal conductance (gs), transpiration rate (Tr), intercellular CO2 concentration (Ci), and intrinsic water use efficiency (WUE) of crops grown in aquaponics with high (HFR, 3.3 m/day), medium (MFR, 2.2 m/day), and low (LFR, 1.1 m/day) flow rate. The values are photosynthetic parameters measured at day 21 after transplanting.
| Crop Type | Flow Rate Treatment | Pn | gs | Tr | Ci | WUE |
|---|
| (μmol CO2/m2/s) | (mol H2O/m2/s) | (mmol H2O/m2/s) | (μmol CO2 /m2/s) | (μmol CO2 mmol/ H2O) |
|---|
| Fast-growing | HFR | 12.87 z a y | 0.37 ns | 8.02 ns | 303.02 b | 1.68 ns |
| MFR | 11.96 ab | 0.39 | 7.17 | 314.65 a | 1.71 |
| LFR | 9.25 b | 0.33 | 6.83 | 317.72 a | 1.41 |
| Medium-growing | HFR | 13.38 a | 0.52 a | 8.74 a | 320.29 ns | 1.55 ns |
| MFR | 11.65 ab | 0.43 ab | 7.05 b | 320.83 | 1.79 |
| LFR | 10.06 b | 0.39 b | 6.60 b | 324.23 | 1.59 |
| Slow-growing | HFR | 14.39 a | 0.40 a | 8.45 a | 298.55 ns | 1.86 ns |
| MFR | 12.54 ab | 0.31 b | 5.94 b | 295.57 | 2.27 |
| LFR | 11.50 b | 0.29 b | 5.84 b | 299.31 | 2.19 |
| ANOVA | | | | | |
| Crop type | ns x | *** | ns | *** | *** |
| Flow rate | *** | ** | *** | ns | ns |
| Crop type × Flow rate | ns | ns | ns | ns | ns |


