Article

Generation of a High-Density Genetic Map of Pepper (Capsicum annuum L.) by SLAF-seq and QTL Analysis of Phytophthora capsici Resistance

1
The Institute of Vegetable and Flower Research, Chongqing Academy of Agricultural Sciences, Chongqing 401329, China
2
Chongqing Key Laboratory of Adversity Agriculture, Biotechnology Research Institute, Chongqing Academy of Agricultural Sciences, Chongqing 401329, China
*
Authors to whom correspondence should be addressed.
Yi-Fei Li and Shi-Cai Zhang contributed equally to this article.
Submission received: 5 March 2021 / Revised: 16 April 2021 / Accepted: 16 April 2021 / Published: 1 May 2021
(This article belongs to the Special Issue Advances in Molecular Breeding of Vegetable Crops)

Abstract

:
Pepper (Capsicum annuum L.) is an economically significant global crop and condiment. Its yield can be severely reduced by the oomycete plant pathogen, Phytophthora capsici (P. capsici). Here, a high-density genetic map was created with a mapping panel of F2 populations obtained from 150 individuals of parental lines PI201234 and 1287 and specific-locus amplified fragment sequencing (SLAF) that was then utilized to identify loci that are related to resistance to P. capsici. The sequencing depth of the genetic map was 108.74-fold for the male parent, 126.25-fold for the female parent, and 22.73-fold for the offspring. A high-resolution genetic map consisting of 5565 markers and 12 linkage groups was generated for pepper, covering 1535.69 cM and an average marker distance of 0.28 cM. One major quantitative trait locus (QTL) for the P. capsici resistance (CQPc5.1) was identified on Chr05 that explained the observed 11.758% phenotypic variance. A total of 23 candidate genes located within the QTL CQPc5.1 interval were identified, which included the candidate gene Capana05g000595 that encodes the RPP8-like protein as well as two candidate genes Capana05g000596 and Capana05g000597 that encodes a RPP13-like protein. Quantitative reverse-transcription PCR (qRT-PCR) revealed higher expression levels of Capana05g000595, Capana05g000596, and Capana05g000597 in P. capsici resistance accessions, suggesting their association with P. capsici resistance in pepper.

1. Introduction

Pepper (Capsicum annuum L.) is a common condiment and an economically significant vegetable crop. It is not only used in many cuisines but also found to have many medicinal properties. In 2019, approximately 212.04 million tons of chilies and peppers were grown on about 49.31 Mha around the world (http://www.fao.org/faostat/zh/#data/QC). However, pepper is susceptible to a variety of pathogens such as CMV, TMV, Colletotrichum spp., and Phytophthora capsici (P. capsici) [1,2,3,4]. Phytophthora blight can significantly decrease pepper yield and quality [5]. The disease is caused by the oomycete plant pathogen P. capsici that initially infects the roots and crown roots, then subsequently spread to every plant part, including the roots, stems, fruits, and leaves [6]. Phytophthora blight is a severe disease that commonly occurs under warm (25–28 °C) and highly humid conditions [7,8,9]. No effective and safe measures to control Phytophthora blight have been established to date, except for chemical control [10,11,12,13]. Therefore, the utilization of resistant varieties has become a simple, effective, and safe way of resolving Phytophthora blight occurrence in pepper. Plant breeders have also focused on selecting varieties with high levels of resistance.
The three physiological races of P. capsici, named “races 1–3,” have been determined by their virulence on four pepper varieties: early calwonder (sensitive), PI201234 (resistant), PBC137 (partially resistant), and PBC602 (partial resistance) [14]. Previous studies have reported several pepper accessions that are resistant to P. capsici, including PI123469, PI201232, PI201234, AC2258, and CM334 (Criollo de Morelos 334) [4,14,15,16,17,18]. Resistance to P. capsici is mainly regulated by a single dominant gene in PI201234 or by one dominant gene in the presence of modifiers [9,19,20,21], and AC2258, which has been derived from PI201234, is resistant to P. capsici [17,18]. Studies have shown that resistance to P. capsici in CM334 is controlled by a minimum of two genes [22,23]. In addition, these reports revealed that the regulatory mechanism underlying P. capsici resistance in pepper is highly complex. Numerous reports have investigated the effect of a pepper QTLs on chromosomes that are associated with resistance against P. capsici [18,23,24,25,26,27,28,29,30,31]. Pc5.1 is a homologous QTL on chromosome 5 of CM334, PI201234, and Perennial that has been associated with resistance to P. capsici [23,29,31]. Mallard et al. (2013) have identified resistance QTLs among three meta-QTLs (MetaPc5.1, MetaPc5.2, and MetaPc5.3) by meta-analysis [31]. Siddique et al. (2019) identified three QTLs on chromosome P5, including QTL5.1, QTL5.2, and QTL5.3, which were associated with resistance to three P. capsici isolates (race 1, race 2, and race 3) by traditional QTL mapping combined with GWAS strategy [30]. In addition, a few minor-effect QTLs has been identified on different chromosomes [23,27,28,32].
Large-scale SNP markers have recently been discovered by next-generation sequencing (NGS) that have expedited the construction of the pepper genetic map. SLAF-seq is a novel high-throughput sequencing technique that is less expensive and complex than high-quality reference genome libraries [33]. In addition, the SLAF-seq strategy has been generally utilized in constructing high-density genetic maps of different species and in QTL mapping [34,35,36,37,38,39,40,41,42]. This strategy had also been successfully used in the creating high-density pepper genetic maps [40,43,44]. For instance, Guo et al. (2017) determined two candidate CMV resistance genes on pepper chromosomes 2 and 11 using SLAF-seq along with BSA technologies [43]. In addition, Zhang et al. (2019) utilized SLAF-seq in detecting two major QTLs that were strongly associated with FFN [40].
In this work, we developed a high-density pepper linkage map with SLAF-seq as well as identified QTLs that are related to P. capsici resistance using F2 populations that were obtained from a cross between parental lines 1287 (P. capsici susceptible, female) and PI201234 (P. capsici resistant, male). Finally, we investigated the main effect of QTLs as well as select candidate genes. Our results could potentially facilitate the elucidation of the genetic mechanism underlying P. capsici resistance in pepper and lay the foundation for breeding highly resistance pepper cultivars.

2. Materials and Methods

2.1. Mapping Population

The P. capsici-susceptible sweet pepper line “1287” was obtained from Zhongjiao808, whereas the P. capsici-resistant “PI201234” was collected from Central America. The present study used an F2 mapping population, comprising 150 individuals that were obtained by crossing female parent 1287 and male parent PI201234, which was then used as mapping population. The parental lines and the F2 population were grown at the Chongqing experimental station of the Chongqing Academy of Agricultural Sciences (Chongqing, China). Sowing of pepper seeds was performed using 50-cell trays containing a mixture of peat and vermiculite that was autoclave sterilized for 30 min in 2018.

2.2. Pathogen Preparation and Plant Inoculation with P. capsici

P. capsici isolate HT1 was used for P. capsici resistance identification in pepper. HT1 has been identified as physiological race 3 and was isolated from infected pepper fruit at the experimental station in Jiulongpo District, Chongqing, China. The isolate was cultured on V8 juice-agar medium at 28 °C in an incubator. To prepare the inoculums for disease screening, the cultures were soaked in 5 mL ddH2O and cultivated at 4 °C for 1 h and then set at room temperature for 1 h to promote sporulation. Spore density was determined using a hemocytometer and adjusted to 1 × 10⁵ spores/mL in distilled water. Before inoculation, pepper plants were soaked in water. Then, 5 mL of suspension was injected into the root of each six- to seven-true-leaf stage pepper plant. The inoculated plants were then grown at 28 °C for 16 h/day and at 80% relative humidity.

2.3. Disease Evaluation

Seven days post inoculation, the plants were assessed for disease symptoms using the 0–5 scale of the Chinese standard NY/T 2060.1-2011 (Ministry of Agriculture of the People’s Republic of China 2011), which consisted of the following: 0 = no disease symptoms; 1 = emergence of brown lesions in the roots and stems with no to slight wilting of leaves; 2 = extension of root and stem lesions by 1–2 cm, the leaves wilted and had fallen off; 3 = root and stem lesions exceed 2 cm and leaves clearly show wilting or defoliation; 4 = large brown lesions on stems are extended and dehydrated, with the exception of the uppermost leaves which have been lost; and 5 = plant death. According to the disease grade of each plant, the disease index (DI) of each identification material was calculated. The DI was calculated using the equation below:
DI   =   Σ ( s × n ) N × S   ×   100 ,
where s is the disease level ranging between 0 and 5; n is the number of plants with corresponding disease level; N is the number of plants investigated in each F2; and S is the representative value of the highest grade.

2.4. Statistical Analysis of Phenotypic Data

The laboratory study was conducted at the experimental station of the Chongqing Academy of Agricultural Sciences. The phenotypic data collected for the disease parameters were considered and analyzed as individual traits. The resistance traits were recorded for the F2 population and parents. The traits means were calculated using DPS 18.10 (DPS, China).

2.5. DNA Extraction, SLAF Library Construction, and High-Throughput Sequencing

An improved CTAB method was utilized to extract genomic DNA from the young leaves of two parental lines and 150 F2 individuals that were at the five- to six-leaf stage [45]. We employed an ND-1000 spectrophotometer (NanoDrop, Wilmington, DE, USA) and performed 1.0% agarose gel electrophoresis to respectively measure DNA concentration and quality. The SLAF-seq library was constructed as detailed previously by Sun et al. [33], with only a few small changes. The restriction enzyme HaeIII (New England Biolabs, NEB, USA) was utilized for digestion of the genomic DNA of the parental lines and individuals of the F2 population. We added polyA tails to the 3′ ends of the digested fragments, which were then connected to duplex-labelled sequencing adapters and PCR amplified. PCR was performed with the diluted restriction-ligation DNA sample, Q5® High-Fidelity DNA polymerase (NEB), dNTPs, and PCR primers (forward, 5′-AATGATACGGCGACCACCGA-3′ and reverse, 5′-CAAGCAGAAGACGGCATACG-3′). The PCR products were purified with Agencourt AMPure XP beads (Beckman Coulter, High Wycombe, UK) and then resolved on a 2% agarose gel. Fragments that were 314 to 364 bp in size were separated and purified with a QIAquick gel extraction kit (Qiagen, Hilden, Germany). SLAF-seq was then conducted on an Illumina High-Seq 2500 sequencing platform (Illumina, San Diego, CA, USA) at Beijing Biomarker Technologies Corp. (Beijing, China, http://www.biomarker.com.cn, accessed on: 8 January 2019). We employed the Oryza sativa L. genome as reference for quality control and conducted library construction and sequencing using similar settings as that for the pepper mapping population.

2.6. SLAF-seq Data Grouping and Genotyping

In this study, reads with a quality score below Q30 (quality score < 30e) were filtered out. After that, high-quality reads were mapped to the pepper reference genome utilizing BWA software, with the paired-end mapped reads at the identical position and >95% identity divided into a single SLAF locus. In each SLAF, a polymorphism locus was observed between the parents, of which most were SNPs. All of the polymorphism SLAF loci were then genotyped with consistency at SNP loci of the offspring and parents. SLAFs that consisted of more than eight SNPs were screened out, and then the parental SLAFs with a sequencing depth of <10-fold were discarded. A high-density linkage map was then created using polymorphic SLAFs showing parental homozygosis (aa × bb).

2.7. High-Density Linkage Map Construction

We quantified the modified logarithm of odds (MLOD) value between two adjacent markers and markers with MLOD values < 5 were filtered out. Then, the SLAF markers were assigned to chromosomes (Chr), and 12 Chr were obtained. Simultaneously, we analyzed the linear array of markers in every Chr using HighMap software [46] and then estimated the genetic distances between a pair of adjacent markers.

2.8. QTL Mapping of P. capsici Resistance and Candidate Gene Prediction

QTL analysis was identified by r/QTL software using CIM methods [47,48]. The LOD score thresholds for evaluating the statistical significance of the QTL effects were established using 1000 permutations (p < 0.05). The predicted genes within the target QTL interval were determined by comparison with the annotated Zunla-1 and CM334 reference genomes (http://peppersequence.genomics.cn, accessed on: 20 January 2019). The function of genes identified in the candidate regions was manually determined by BLASTX (https://blast.ncbi.nlm.nih.gov/, accessed on: 20 January 2019). In addition, the predicted genes were further annotated based on KEGG (https://www.kegg.jp/kegg/, accessed on: 20 January 2019), COG (http://0-www-ncbi-nlm-nih-gov.brum.beds.ac.uk/COG/, accessed on: 20 January 2019), Swiss-Prot (http://www.ebi.ac.uk/uniprot/ accessed on: 20 January 2019), and NR (https://blast.ncbi.nlm.nih.gov/ accessed on: 20 January 2019) databases.

2.9. qRT-PCR Analysis

For expression analysis, we conducted qRT-PCR to investigate the expression pattern of five disease-resistant or defense-related genes for P. capsici resistance in pepper. Leaf samples were gathered from days 0, 1, 2, 3, 4, 5, 6, and 7 post inoculation with P. capsici in the resistant line “PI201234” and the susceptible line “Early calwonder.” “Early calwonder” was defined as susceptible to three physiological races of P. capsici. Total RNAs were extracted utilizing the Plant RNA Kit (Tiangen DP441, China) as per the company’s instructions. Subsequently, cDNAs were reverse-transcribed using TaKaRa Reverse Transcription Kit (Takara Biomedical Technology (Beijing) Co., Ltd., Beijing, China). Quantitative PCR was conducted on a 7500 Real-Time PCR System (Thermo Fisher Scientific, Waltham, MA, USA) using TB Green® Premix Ex TaqTM Kit (TaKaRa). The PCR program was as follows: Holding Stage Step 1: 95 °C 30 s, followed by 40 cycles of Step 1: 95 °C for 5 s, Step 2: 60 °C for 30 s, and 72 °C for 2 min. After the last cycle, the amplification was extended for 7 min at 72 °C. AY572427 was used as internal control for qRT-PCR analysis. We employed the 2−ΔΔT method to determine relative expression levels of candidate genes, which were normalized to that of actin gene (AY572427). Each target sample was analyzed using three biological replicates. All values were reported as the mean ± standard deviation (n = 3), and the statistical significance of any differences was analyzed using a Student’s t-test.

3. Results

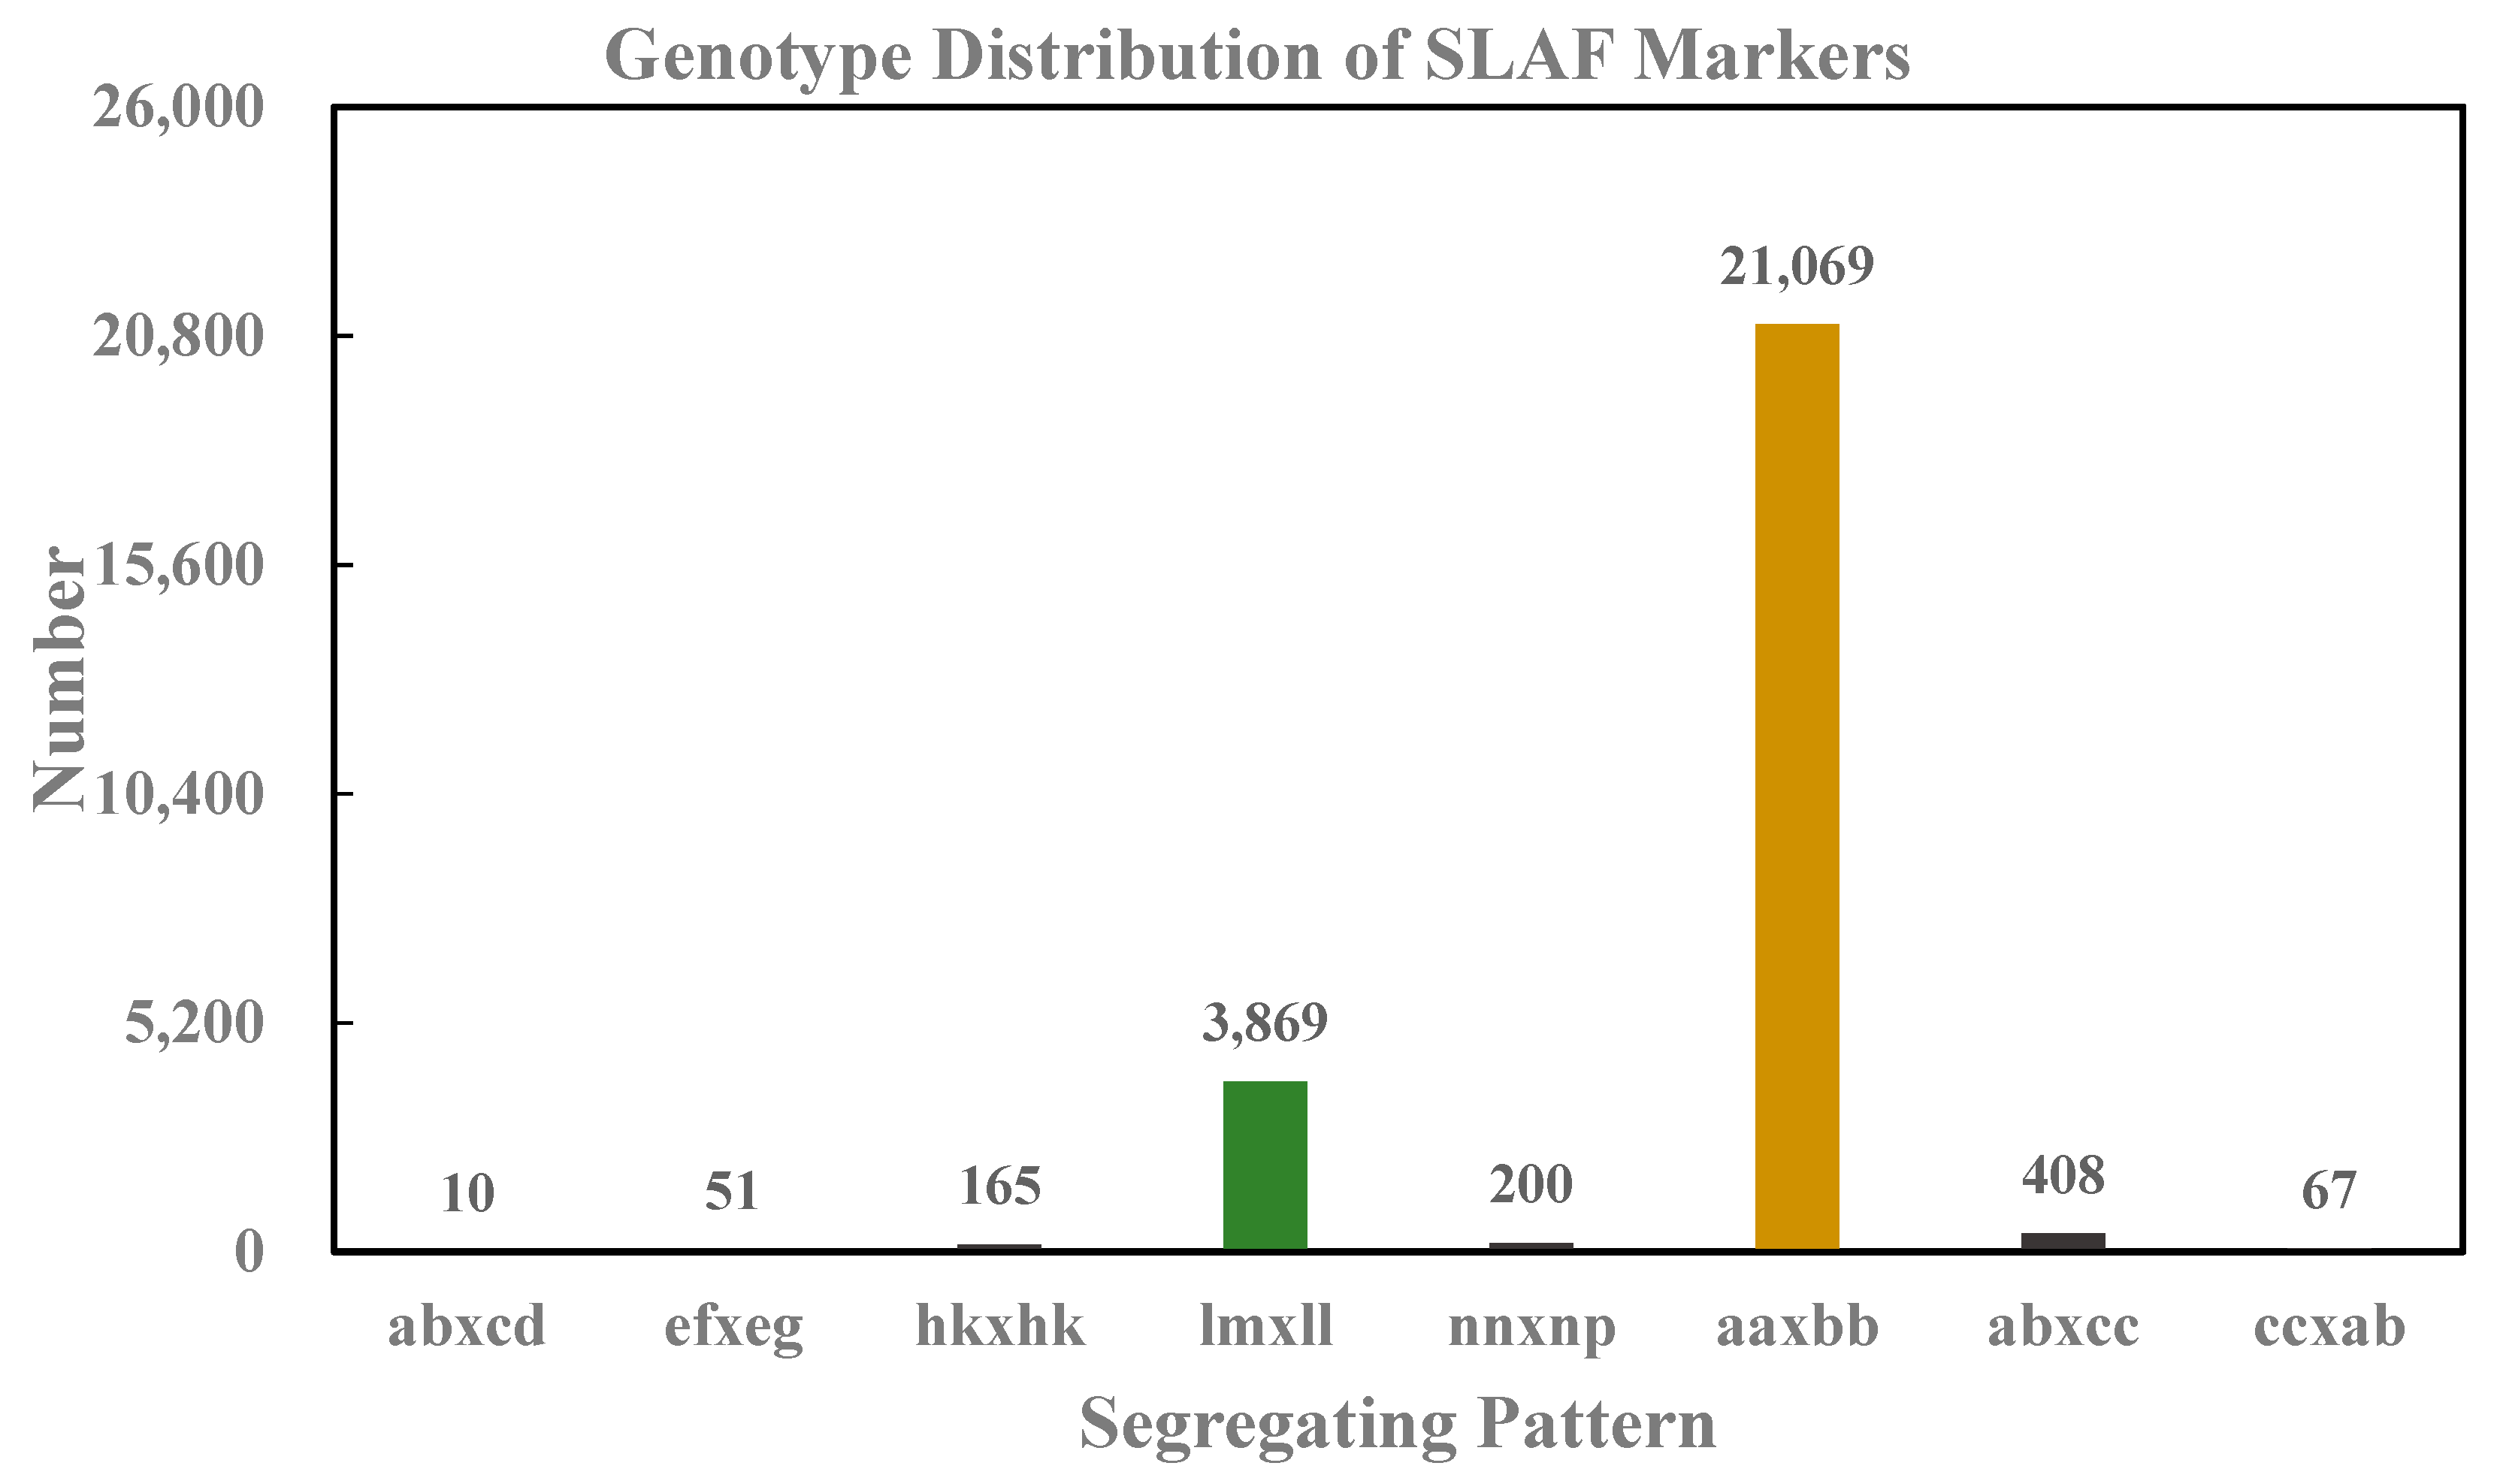
3.1. Sequencing and Genotyping Based on SLAF-seq

In this study, genotyping of 150 F2 individuals and their parents was performed using the SLAF-seq technology. The sequencing data generated in this work were sent to the NCBI SRA database (http://0-www-ncbi-nlm-nih-gov.brum.beds.ac.uk/sra/ accessed on: 20 October 2020) as accession no. PRJNA669602. Approximately 76.22 GB of raw bases and 381.15 Mb of paired-end reads were generated, of which 94.37% achieved or exceeded quality score of 30 (Q30), and GC (guanine-cytosine) content was 38.86% (Table 1). Oryza sativa L. was used as control for evaluating the effectiveness of library construction. In addition, 12,250,440 reads representing 139,046 SLAFs with average depths of 63.83 were obtained from the male parent (PI201234), and 13,232,257 reads representing 141,584 SLAFs with average depths of 72.32 were obtained from the female parent (1287) (Table 1). In the offspring (F2 population), 2,371,153 reads that were representing 124,582 SLAFs with average depths of 14.66 were generated (Table 1).
After filtration of low-depth SLAF tags, approximately 174,193 high-quality SLAF markers were obtained, of which 19.77% (34,432) were polymorphic SLAFs (Table 2). In addition, 25,839 of the 34,432 polymorphic SLAFs were cultured into eight segregation patterns (aa×bb, ab×cc, ab×cd, cc×ab, ef×eg, hk×hk, lm×ll, and nn×np) (Figure 1). As the parents were homozygous (i.e., with genotype aa or bb), 21,069 SLAFs exhibited the aa×bb segregation pattern and were successfully selected for map construction.

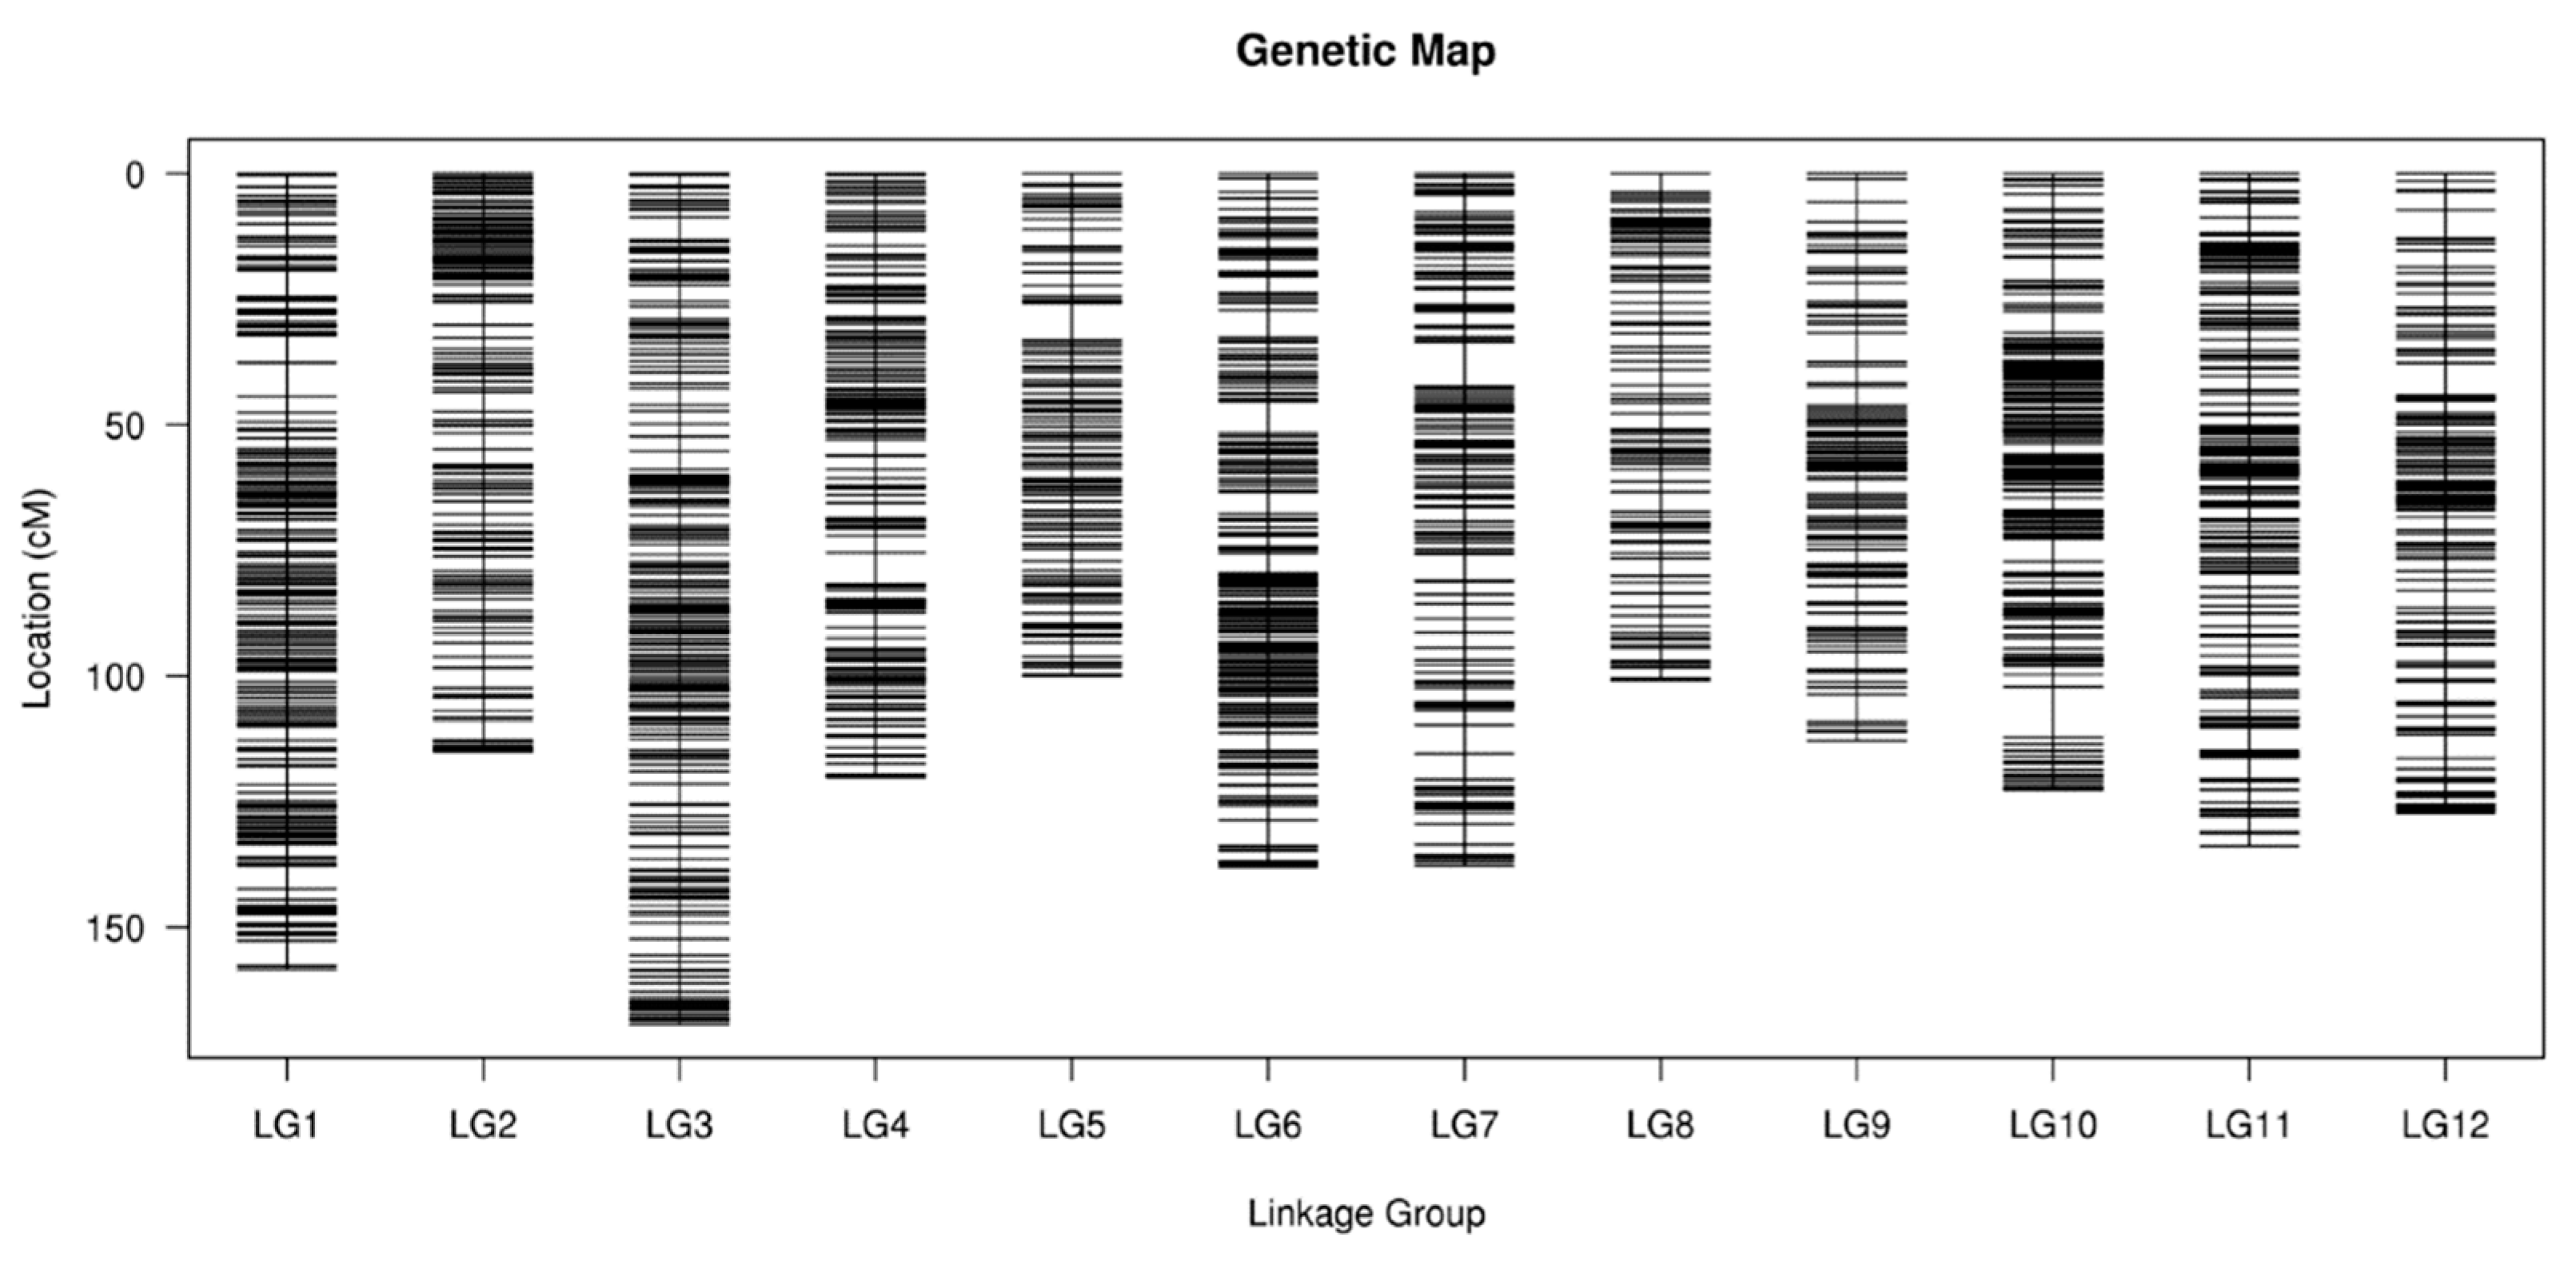
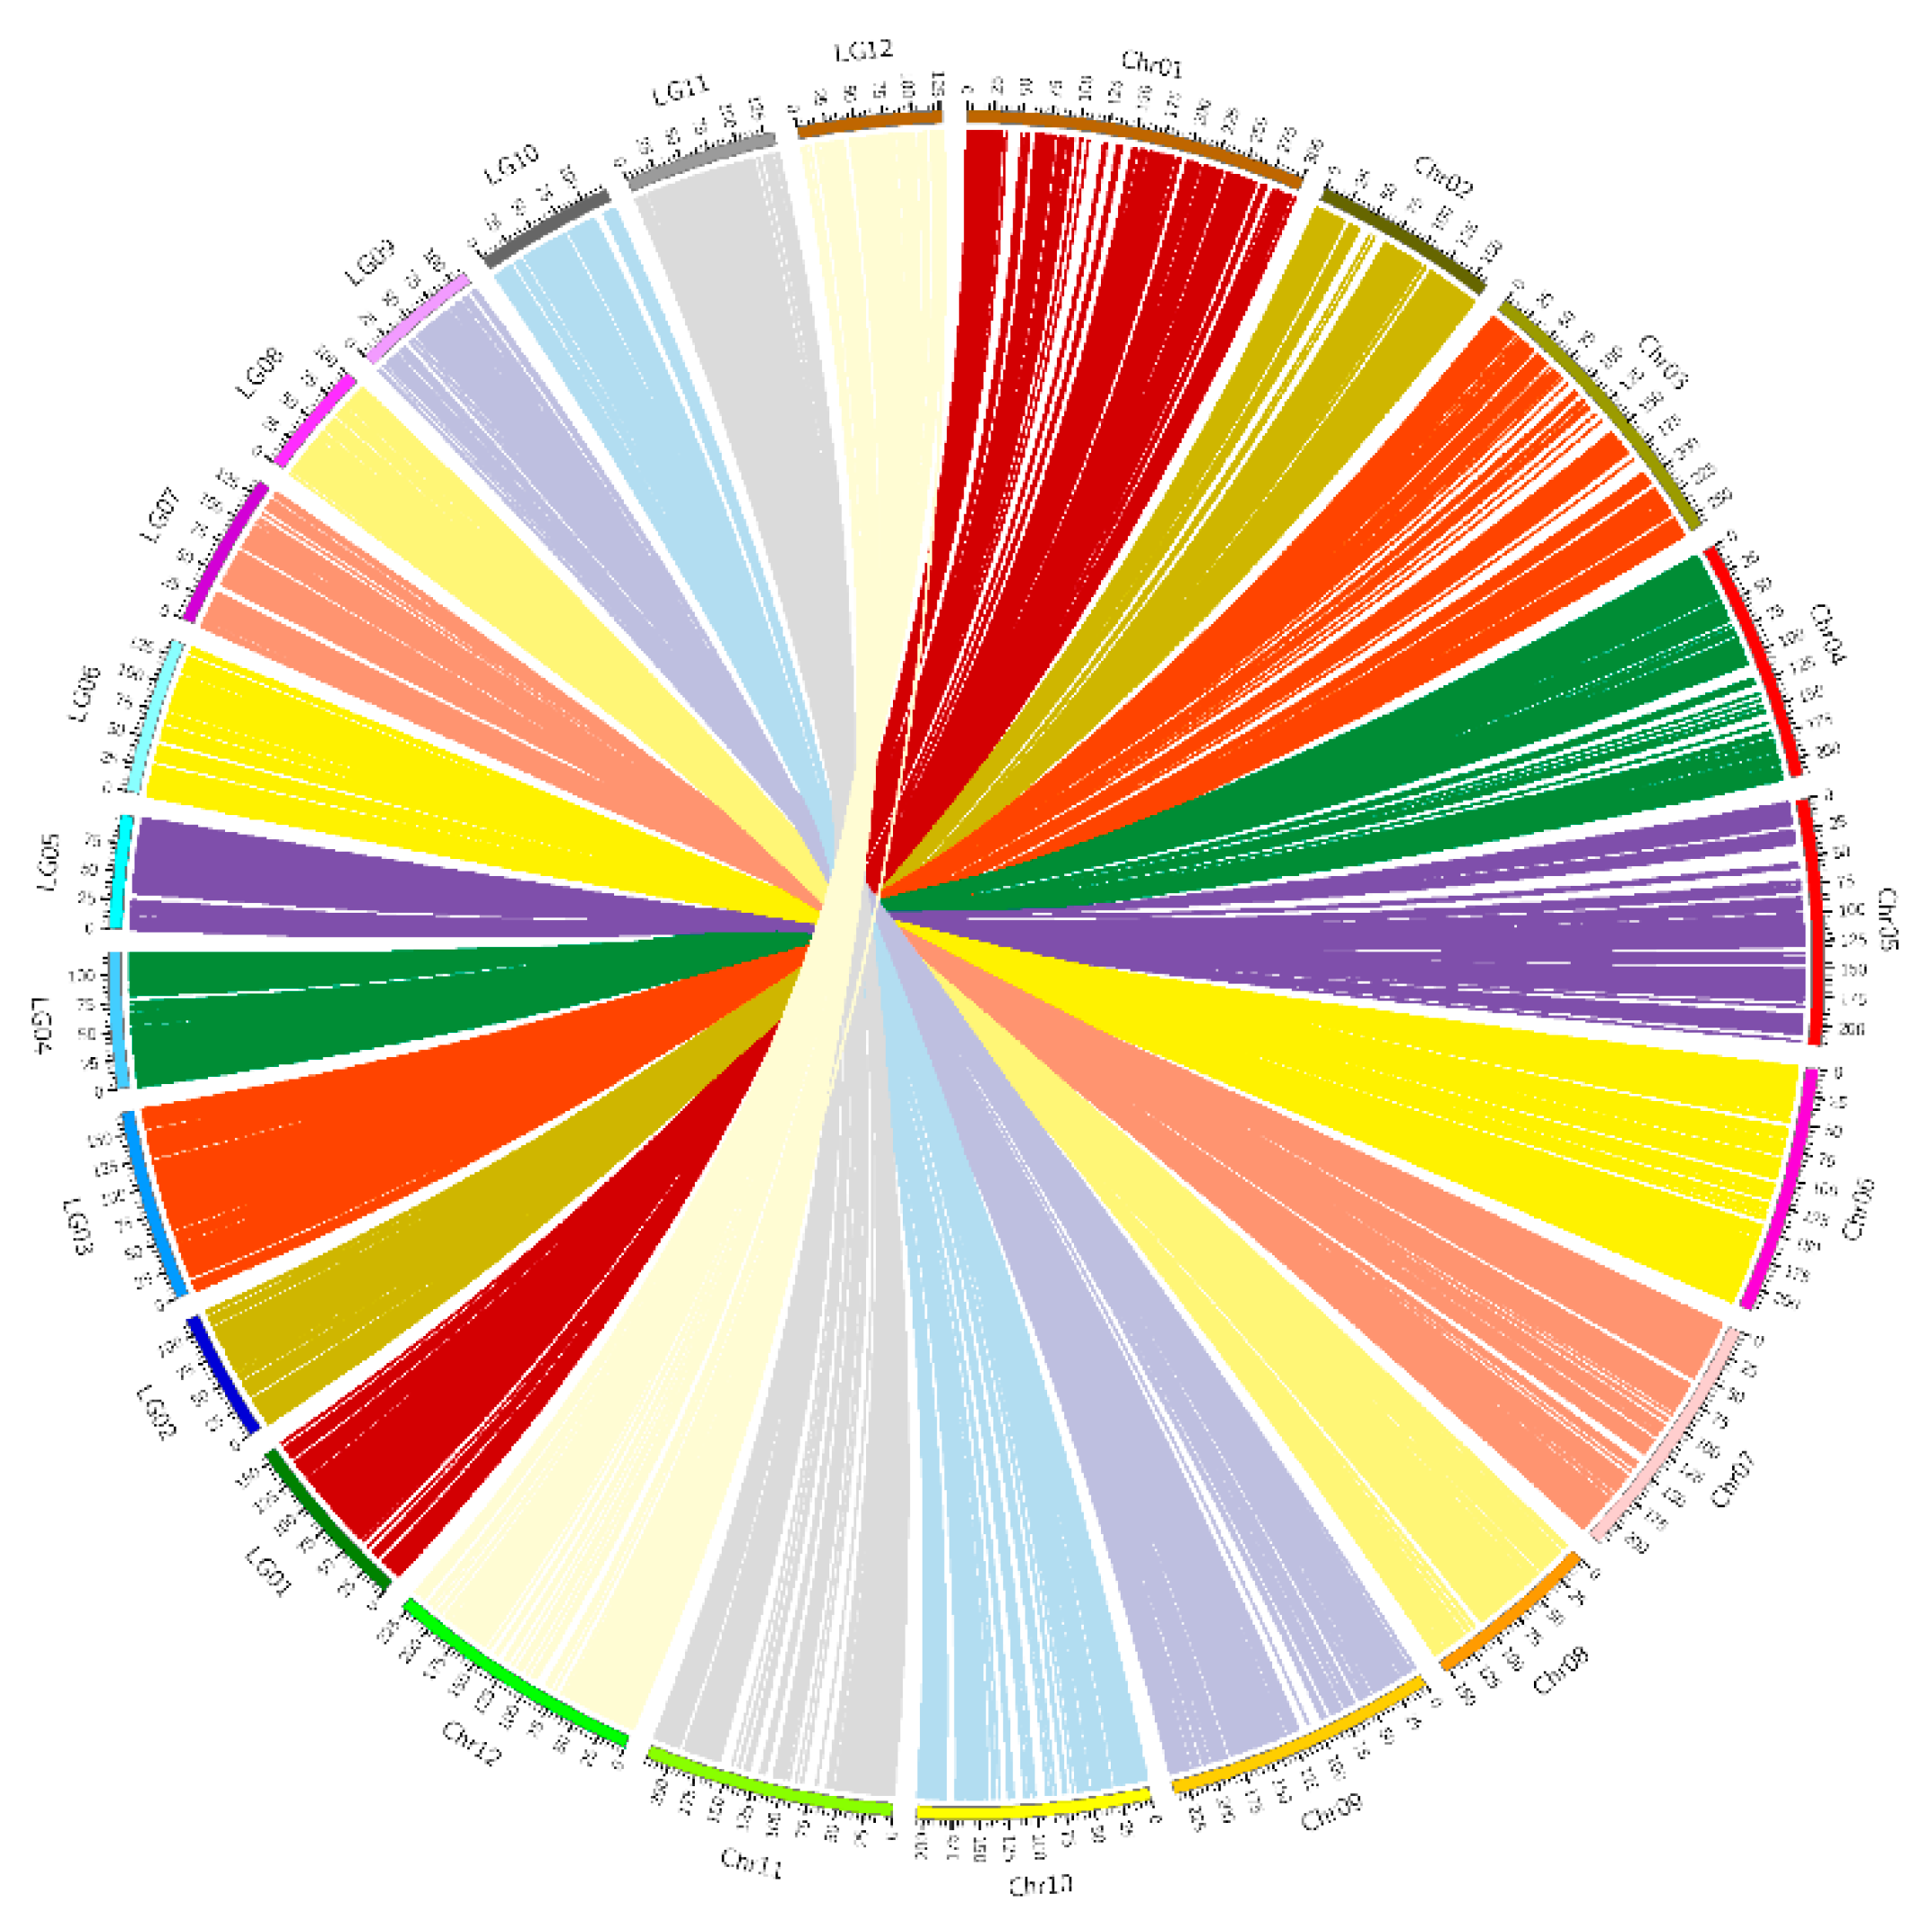
3.2. Genetic Map Construction

After four-step filtering, our final map contained 5565 markers on 12 Chrs, which were designated Chr01-Chr12 using HighMap software and presented in Table 2 and Figure 2. The linkage map encompassed a total of 1535.69 cM and exhibited an average marker distance of 0.28 cM (Figure 2). The largest Chr was Chr03, which consisted of 444 markers, showed a length of 169.18 cM, and an average marker-to-marker distance of 0.38 cM, while the smallest Chr was Chr05 that consisted of 460 markers, showed a length of 99.98 cM, and an average marker-to-marker distance of 0.22 cM (Table 3). The extent of linkage between markers was represented by the percentage of “Gaps ≤ 5 cM,” which ranged from 99.08% to 100%, and an average of 99.70% (Table 3). The largest gap on this linkage map was situated on Chr10 at 9.99 cM, whereas the smallest gap was 3.94 cM at Chr08 (Table 3).

3.3. Quality and Accuracy of the Genetic Map

The quality and accuracy of the genetic map were assessed based on collinearity between the genetic and physical maps. The average integrity of each marker was 99.91% (Figure 3). Furthermore, among the 12 linkage groups, Chr03 showed the highest collinearity, with a correlation coefficient of 0.9979, and the average Spearman’s rank correlation coefficient was 0.9758 (Table 3). On average, the coverage of these markers was 108.74-fold in PI201234 (male parent), 126.25-fold in 1287 (female parent), and 22.73-fold in every F2 individual (Table 4), thereby indicating genotyping accuracy. Furthermore, collinearity with the physical map was utilized to examine the quality of the genetic map. Figure 4 shows that most of the genetically mapped loci were collinear with their physical positions on the reference genome sequence of C. annuum cv. Zunla-1 v2.0 [45]. Every correlation coefficient of 12 linkage groups was also assessed. The correlation coefficients of the 12 linkage groups were all close to 1, which indicated relatively high collinearity between linkage groups and the pepper reference genome (Figure 3).

3.4. Phenotypic Analysis of P. capsici Resistance

In 2008, the disease indices (DIs) of 150 F2 populations were determined (Table 5). The highest DI value was recorded in the susceptible 1287 (84.3), while the lowest ID value was recorded in the resistance parent PI201234 (7.9). The DI values of the F2 population varied between 0.00 and 100. The average DI value of the F2 population was 47.2. The variation was 0.75, and skewness and kurtosis value of the DI in the F2 population was small, indicating that the population was suitable for QTL identification.

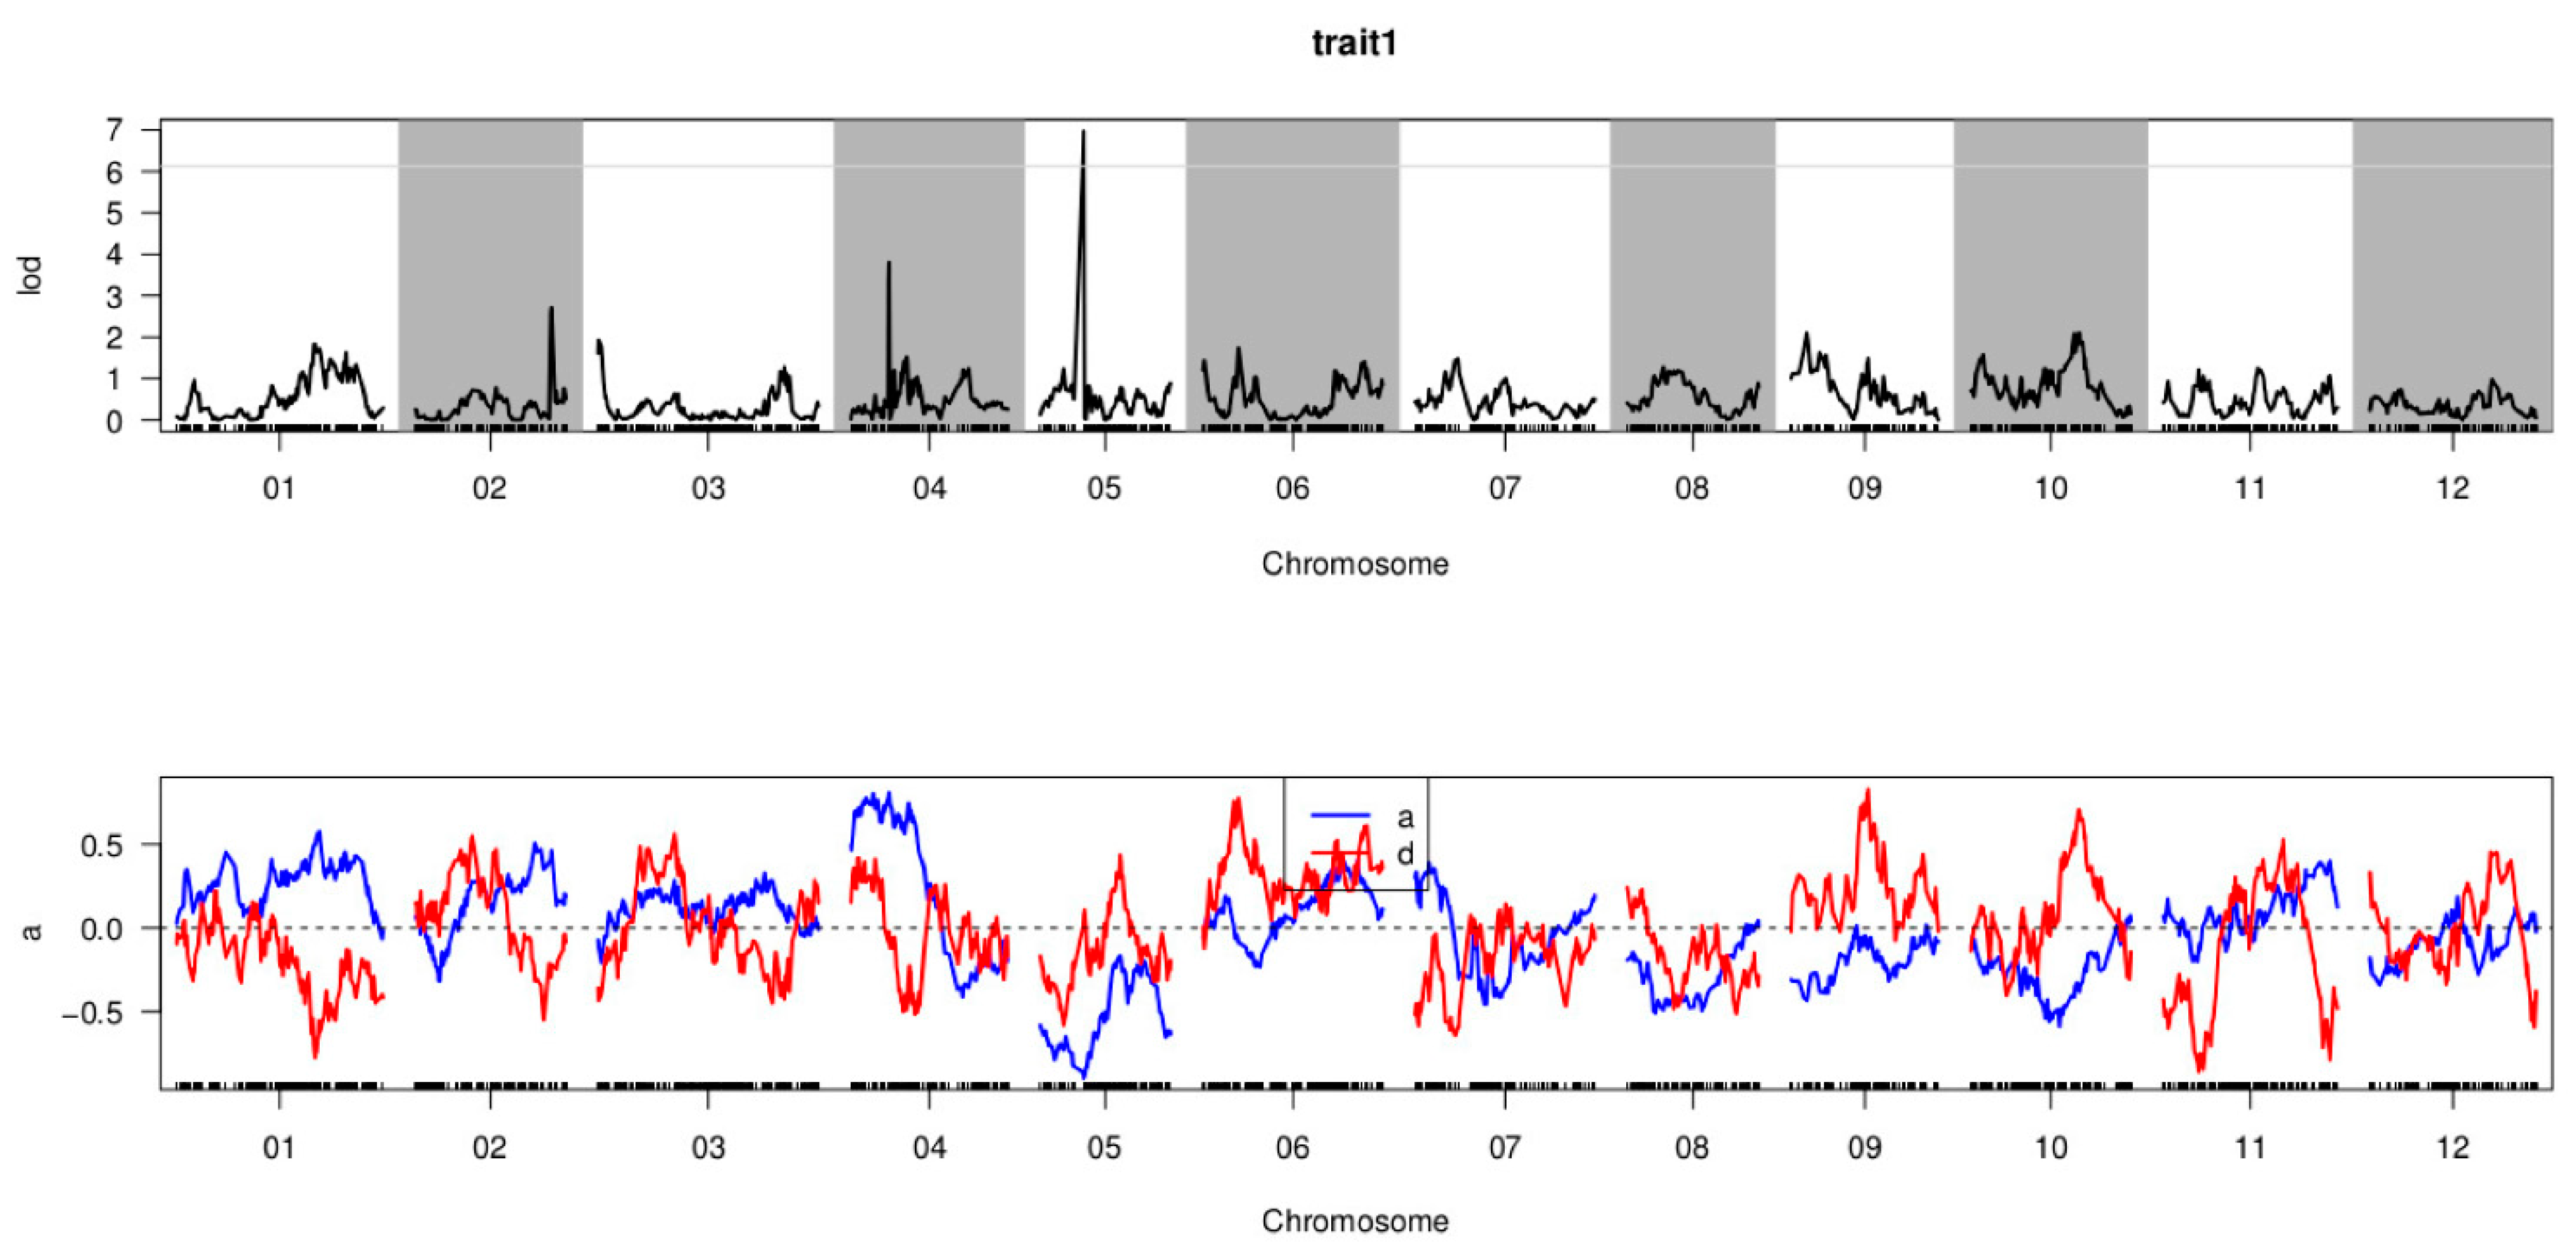
3.5. QTL Mapping of P. capsici Resistance

In present study, the maximum LOD value of 6.972 was used as the threshold to determine the existence of QTL. Based on the high-density genetic map, a single major QTL for the P. capsici resistance trait was identified in the F2 population and designated as CQPc5.1 (Table 6, Figure 4), which explained 11.76% of the observed phenotypic variance. CQPc5.1 was localized in 17.9–19.4 Mb on Chr05, which encompassed a genetic distance of about 0.35 cM, as well as a physical distance of about 1.47 Mb on Chr05 (Table 6).

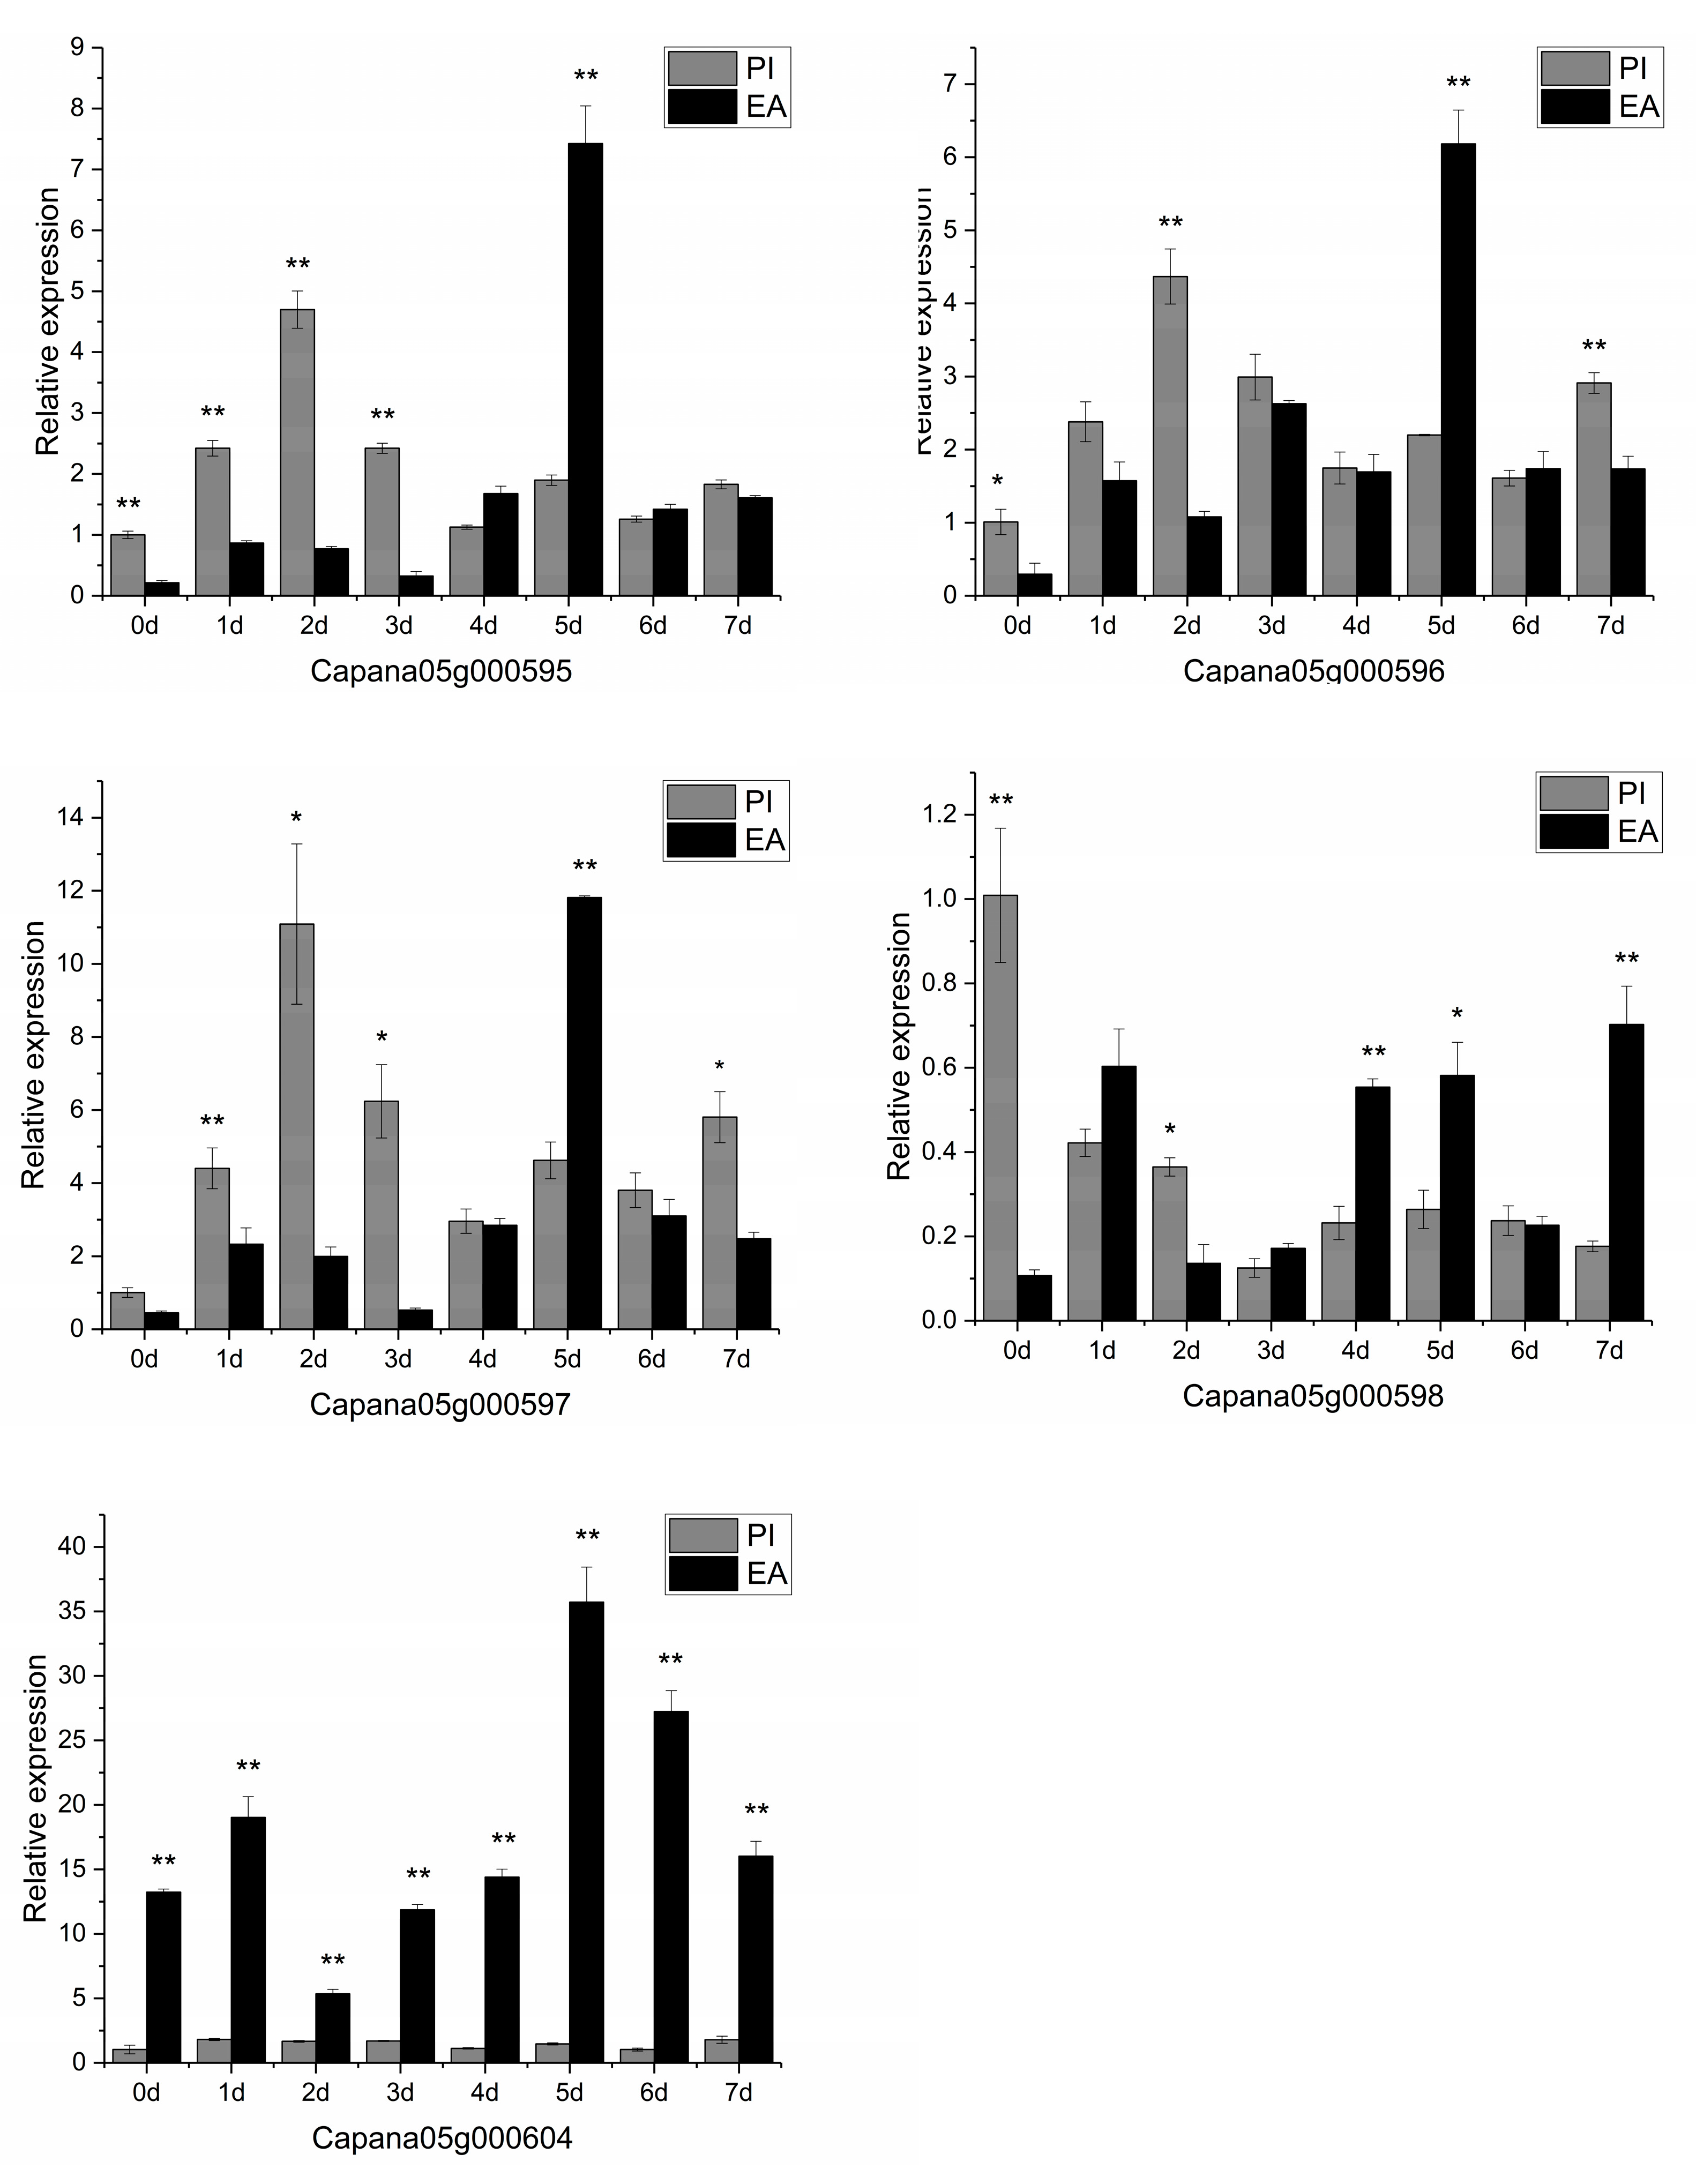
3.6. Candidate Gene Prediction and qRT-PCR Analysis

According to the annotations of the C. annuum cv. Zunla-1 v2.0 genome, 23 predicted candidate genes were determined in the physical interval of CQPc5.1 on Chr05 (Table 7). Among these, nine candidate genes were identified in the COG database, including 11 genes with KEGG annotations and 12 genes with Swiss-Prot annotations. Furthermore, 5 of the 23 genes were related to disease resistance or defense, and thus might be involved in P. capsici resistance in pepper; the Capana05g000595 gene was annotated as disease resistance protein, RPP8-like; two genes (Capana05g000596 and Capana05g000597) were annotated as disease resistance protein, RPP13-like; Capana05g000598 was annotated as likely LRR receptor-like serine/threonine-protein kinase; and Capana05g000604 was annotated as an F-box/LRR-repeat protein. These five genes were then analyzed by qRT-PCR. The primer sequences are listed in Table 8. The results showed that three genes (i.e., Capana05g000595, Capana05g000596, and Capana05g000597) were up-regulated in “PI201234,” and expression levels peaked 2–3 days after pathogen inoculation (Figure 5). Five genes were up-regulated in “Early calwonder” after pathogen inoculation, and expression levels peaked at 5 days. In “Early calwonder,” the expression of Capana05g000604 gradually increased over time; however, it was expressed at a markedly lower level in “PI201234.”

4. Discussion

4.1. Genetic Map Constructed of Pepper

Phytophthora blight caused by P. capsici is one of the most serious diseases in pepper, inducing a significant reduction in yield and quality [49]. Despite decades of genetic research on the resistance of pepper to P. capsici, no resistant cultivars have been established to date. At present, as a key tool, genetic linkage maps are not only used in plant genetics, but also to identify genomic regions that are related to agronomic and qualitative traits through QTL mapping. Recently, SLAF-seq has been utilized in the creation of genetic linkage maps of pepper, and a number of high-density genetic maps have been successfully created. For instance, Zhu et al. (2019) identified six QTLs using a molecular genetic linkage map via SLAF-seq in relation to flowering time and number of flowers per node in pepper, which consisted of a total of 9038 markers at an average spacing of 0.18 cm that were distributed across 12 linkage groups, and the total distance was 1586.78 cM [44]. In the same year, Zhang et al. (2019) identified two major pepper QTLs (Ffn2.1 and Ffn2.2) that were strongly correlated with FFN using a high-density genetic map, which included 9328 SLAF markers from 12 linkage groups, showing a total genetic distance of 2009.69 cM, as well as an average distance of 0.22 cM [40]. Sun et al. (2020) reported two QTLs that were related to aphid survival (Rmpas-1) and reproduction (Rmprp-1) using a genetic linkage map that included 167 SNP markers [50]. In this work, we constructed a genetic map using the SLAF-seq technology and according to a F2 population. The map consisted of 5565 markers that assigned 12 linkage groups, spanning a total length of 1535.69 cM, and showed a mean genetic distance of 0.28 cM. This genetic map exhibited adequate coverage of the polymorphic markers in regions of interest, and the mapped QTLs showed positional accuracy.

4.2. Identification QTL with the Resistance to P. capsici Traits

Previous studies have showed that the major QTLs related to resistance to P. capsici are situated on Chr05, despite the use of various resistant lines, pepper populations, or P. capsici isolates [23,26,27,32,51]. Mallard et al. (2013) utilized published pepper genome information and identified three major QTLs, namely, Pc5.1, Pc5.2, and Pc5.3, which were localized to the 22.4–24.6, 53.0–162.6, and 9.7–13.3 Mb regions on Chr05, respectively [31]. Siddique et al. (2019) reported three major QTLs on Chr05, namely, QTL5.1 (18.7–19.5 Mb), QTL5.2 (27.3–29.2 Mb), and QTL5.3 (34.6–37 Mb) that were related to resistance to three P. capsici isolates on using combined traditional QTL mapping with GWAS [30]. Here, we performed P. capsici resistance QTL analysis of pepper. We detected a major QTL CQPc5.1 based on a high-density linkage map of F2 plants. CQPc5.1 was localized to the 17.9–19.4 Mb region on Chr05, with a genetic distance of 33.103–33.448 cM. In an earlier study, Collard et al. (2005) documented that a QTL is only described as “major” when it accounts for >10% of the PVE [52]. In the present study, the phenotypic variance of CQPc5.1 was 11.58%. In addition, the position of CQPc5.1 on Chr05 differs from Pc5.1, Pc5.2, and Pc5.3, yet the location of CQPc5.1 that was identified in this work coincides with that of the earlier determined locus QTL5.1 [30]. However, the physical location of CQPc5.1 on the chromosome is closer than that of QTL5.1, so we infer that CQPc5.1 represents a more accurate mapping of resistance to P. capsici in pepper.

4.3. Candidate Gene Prediction

Here, we identified five genes that are related to disease resistance in the CQPc5.1 QTL region. We identified three genes annotated as disease-resistance protein RPP13-like; RPP13 was a singleton NBS-LRR gene located in CQPc5.1 on Chr05. Capana05g000595 gene was identified as disease resistance protein RPP-8. Two genes (Capana05g000596 and Capana05g000597) were annotated to be disease resistance protein RPP13-like. RPP13 is a CC (coiled-coil)-NBS-LRR domain-containing R gene that controls resistance to Peronospora parasitica oomycete pathogen in Arabidopsis thaliana [53,54]. These two candidate genes encode RPP13-like NBS-LRR proteins and serve as potential candidates for P. capsici resistance in pepper. Capana05g000598 was annotated as a probable LRR receptor-like serine/threonine-protein kinase. Capana05g000604 was annotated to be an F-box/LRR-repeat protein. Several LRR domain proteins have been determined to participate in defense responses to infiltrating pathogens [12,55,56,57].

4.4. Candidate Gene qRT-PCR Analysis

Our qRT-PCR outcomes indicate that the expression patterns of three genes (Capana05g000595, Capana05g000596, and Capana05g000597) are up-regulated in both the resistant “PI201234” and susceptible “Early calwonder” lines after pathogen inoculation. Capana05g000598 was down-regulated in “PI201234” with pathogen inoculation and up-regulated in “Early calwonder.” We infer that Capana05g000598 may have the part of the negative regulator of resistance to P. capsici in PI201234. Capana05g000604 was up-regulated in “Early calwonder” at post-infection, while its expression level was significantly lower throughout in “PI201234”. Interestingly, the expression of five genes in “PI201234” peaked 2–3 days after pathogen infection, in contrast, expression in “Early calwonder peaked at 5 day after pathogen infection.” Therefore, we deduced that Capana05g000595, Capana05g000596, and Capana05g000597 might be related to resistance to P. capsici. These three genes are highly associated with CQPc5.1, but functional validation has not been reported. Therefore, it is essential to conduct functional analysis of these genes to verify their molecular functions in P. capsici resistance in pepper. The result of this study would provide information for the next stage of research such as gene functional analysis, pyramiding breeding, and marker-assisted selection (MAS) as well.

Author Contributions

Conceptualization, Y.-F.L.; methodology, Y.-F.L., S.-C.Z., and C.-P.W.; investigation, Y.-F.L., S.-C.Z., and X.-M.Y.; writing—original draft preparation, Y.-F.L.; writing—review and editing, S.-C.Z., Q.-Z.H., and R.-Z.H.; funding acquisition, R.-Z.H. All authors have read and agreed to the published version of the manuscript.

Funding

This research was financially supported by the National Key R&D Program of China (2017YFD0101903).

Institutional Review Board Statement

Not applicable for studies not involving humans or animals.

Informed Consent Statement

Not applicable.

Data Availability Statement

The sequencing data accession number (PRJNA669602).

Acknowledgments

We acknowledge Yu Pan for her efforts in revising the manuscript.

Conflicts of Interest

The authors declare no conflict of interest.

References

  1. Chaim, A.B.; Grube, R.C.; Lapidot, M.; Jahn, M.; Paran, I. Identification of quantitative trait loci associated with resistance to cucumber mosaic virus in Capsicum annuum. Theor. Appl. Genet. 2001, 102, 1213–1220. [Google Scholar] [CrossRef]
  2. Cai, W.-Q.; Fang, R.-X.; Shang, H.-S.; Wang, X.; Zhang, F.-L.; Li, Y.-R.; Zhang, J.-C.; Cheng, X.-Y.; Wang, G.-L.; Mang, K.-Q. Development of CMV-and TMV-resistant chili pepper: Field perfermance and biosafety assessment. Mol. Breed. 2003, 11, 25–35. [Google Scholar] [CrossRef]
  3. Hong, J.K.; Yang, H.J.; Jung, H.; Yoon, D.J.; Sang, M.K.; Jeun, Y.-C. Application of Volatile Antifungal Plant Essential Oils for Controlling Pepper Fruit Anthracnose by Colletotrichum gloeosporioides. Plant Pathol. J. 2015, 31, 269–277. [Google Scholar] [CrossRef] [PubMed] [Green Version]
  4. Bosland, P.W. A Seedling Screen for Phytophthora Root Rot of Pepper, Capsicum annuum. Plant Dis. 1991, 75, 1048. [Google Scholar] [CrossRef]
  5. Parra, G.; Ristaino, J.B. Resistance to Mefenoxam and Metalaxyl Among Field Isolates of Phytophthora capsici Causing Phytophthora Blight of Bell Pepper. Plant Dis. 2001, 85, 1069–1075. [Google Scholar] [CrossRef] [Green Version]
  6. Oelke, L.M.; Bosland, P.W.; Steiner, R. Differentiation of Race Specific Resistance to Phytophthora Root Rot and Foliar Blight in Capsicum annuum. J. Am. Soc. Hortic. Sci. 2003, 128, 213–218. [Google Scholar] [CrossRef] [Green Version]
  7. Lefebvre, V.; Palloix, A. Both epistatic and additive effects of QTLs are involved in polygenic induced resistance to disease: A case study, the interaction pepper-Phytophthora capsici Leonian. Theor. Appl. Genet. 1996, 93, 503–511. [Google Scholar] [CrossRef]
  8. Foster, J.M.; Hausbeck, M.K. Resistance of Pepper to Phytophthora Crown, Root, and Fruit Rot Is Affected by Isolate Virulence. Plant Dis. 2010, 94, 24–30. [Google Scholar] [CrossRef] [PubMed] [Green Version]
  9. Barksdale, T.H.; Papavizas, G.C.; Johnston, S.A. Resistance to foliar blight and crown rot of pepper caused by Phytophthora capsici. Plant Dis. 1984, 68, 506–509. [Google Scholar] [CrossRef]
  10. Flett, S.; Ashcroft, W.; Jerie, P.; Taylor, P. Control of Phytophthora root rot in processing tomatoes by metalaxyl and fosetyl-Al. Aust. J. Exp. Agric. 1991, 31, 279–283. [Google Scholar] [CrossRef]
  11. Polizzi, G.; Agosteo, G.E.; Cartia, G. Soil solarization for the control of Phytophthora capsici on pepper. Acta Hortic. 1994, 366, 331–338. [Google Scholar] [CrossRef]
  12. Lehmann, P. Structure and evolution of plant disease resistance genes. J. Appl. Genet. 2002, 43, 403–414. [Google Scholar]
  13. Stieg, J.R.; Walters, S.A.; Bond, J.P.; Babadoost, M. Effects of fungicides and cultivar resistance for Phytophthora capsici control in bell pepper production. HortScience 2006, 41, 1076. [Google Scholar] [CrossRef] [Green Version]
  14. Black, L. Studies on Phytophthora blight in pepper. In Talekar NS (ed) AVRDC Report 1998; Asian Vegetable Research and Development Center: Shanhua, Taiwan, 1999; pp. 25–27. [Google Scholar]
  15. Ortega, R.G.; Espanol, C.P.; Zueco, J.C. Genetics of Resistance to Phytophthora capsici in the Pepper Line ‘SCM-334’. Plant Breed. 1991, 107, 50–55. [Google Scholar] [CrossRef]
  16. Kim, B.S. Characteristics of bacterial spot resistant lines and Phytophthora Blight resistant lines of Capsicum pepper. Hortic. Environ. Biotechnol. 1988, 29, 247–252. [Google Scholar]
  17. Smith, P.G.; Kimble, K.A.; Grogan, R.G.; Millett, A.H. Inheritance of resistance in peppers to Phytophthora root rot. Phytopathology 1967, 57, 377–379. [Google Scholar]
  18. Sugita, T.; Yamaguchi, K.; Kinoshita, T.; Yuji, K.; Sugimura, Y.; Nagata, R.; Kawasaki, S.; Todoroki, A. QTL analysis for resistance to Phytophthora Blight (Phytophthora capsici Leon.) using an intraspecific Doubled-Haploid population of Capsicum annuum. Breed. Sci. 2006, 56, 137–145. [Google Scholar] [CrossRef] [Green Version]
  19. Kim, B.S.; Kwon, Y.S. Inheritance of resistance to Phytophthora Blight and to bacterial spot in pepper. J. Korean Soc. Hortic. Sci. 1990, 7, 17–24. [Google Scholar]
  20. Saini, S.S.; Sharma, P.P. Inheritance of resistance to fruit rot (Phytophthora capsici Leon.) and induction of resistance in bell pepper (Capsicum annuum L.). Euphytica 1978, 27, 721–723. [Google Scholar] [CrossRef]
  21. Wang, P.; Wang, L.; Guo, J.; Yang, W.; Shen, H. Molecular mapping of a gene conferring resistance to Phytophthora capsici Leonian race 2 in pepper line PI201234 (Capsicum annuum L.). Mol. Breed. 2016, 36, 1–11. [Google Scholar] [CrossRef]
  22. Reifschneider, F.J.B.; Boiteux, L.S.; Vecchia, P.T.D.; Poulos, J.M.; Kuroda, N. Inheritance of adult-plant resistance to Phytophthora capsici in pepper. Euphytica 1992, 62, 45–49. [Google Scholar] [CrossRef]
  23. Thabuis, A.; Palloix, A.; Pflieger, S.; Daubèze, A.-M.; Caranta, C.; Lefebvre, V. Comparative mapping of Phytophthora resistance loci in pepper germplasm: Evidence for conserved resistance loci across Solanaceae and for a large genetic diversity. Theor. Appl. Genet. 2003, 106, 1473–1485. [Google Scholar] [CrossRef] [PubMed]
  24. Pflieger, S.; Palloix, A.; Caranta, C.; Blattes, A.; Lefebvre, V. Defense response genes co-localize with quantitative disease resistance loci in pepper. Theor. Appl. Genet. 2001, 103, 920–929. [Google Scholar] [CrossRef]
  25. Minamiyama, Y.; Tsuro, M.; Kubo, T.; Hirai, M. QTL Analysis for Resistance to Phytophthora capsici in Pepper Using a High Density SSR-based Map. Breed. Sci. 2007, 57, 129–134. [Google Scholar] [CrossRef] [Green Version]
  26. Kim, H.-J.; Nahm, S.-H.; Lee, H.-R.; Yoon, G.-B.; Kim, K.-T.; Kang, B.-C.; Choi, D.; Kweon, O.Y.; Cho, M.-C.; Kwon, J.-K.; et al. BAC-derived markers converted from RFLP linked to Phytophthora capsici resistance in pepper (Capsicum annuum L.). Theor. Appl. Genet. 2008, 118, 15–27. [Google Scholar] [CrossRef] [PubMed]
  27. Truong, H.T.H.; Kim, K.T.; Kim, D.W.; Kim, S.; Chae, Y.; Park, J.H.; Oh, D.G.; Cho, M.C. Identification of isolate-specific resistance QTLs to phytophthora root rot using an intraspecific recombinant inbred line population of pepper (Capsicum annuum). Plant Pathol. 2011, 61, 48–56. [Google Scholar] [CrossRef]
  28. Rehrig, W.Z.; Ashrafi, H.; Hill, T.; Prince, J.; Deynze, A.V. CaDMR1 Co-segregates with QTL Pc5.1 for resistance to Phytophthora capsici in pepper (Capsicum annuum). Plant Genome 2014, 7, 1–12. [Google Scholar] [CrossRef] [Green Version]
  29. Kim, N.; Kang, W.H.; Lee, J.; Yeom, S.I. Development of clustered resistance gene analogs-based markers of resistance to Phytophthora capsici in chili pepper. BioMed Res. Int. 2019, 2019, 1–12. [Google Scholar]
  30. Siddique, M.I.; Lee, H.Y.; Ro, N.Y.; Han, K.; Venkatesh, J.; Solomon, A.A.-O.; Patil, A.A.-O.; Changkwian, A.; Kwon, J.K.; Kang, B.C. Identifying candidate genes for Phytophthora capsici resistance in pepper (Capsicum annuum) via genotyping-by-sequencing-based QTL mapping and genome-wide association study. Sci. Rep. 2019, 9, 9962. [Google Scholar] [CrossRef]
  31. Mallard, S.; Cantet, M.; Massire, A.; Bachellez, A.; Ewert, S.; Lefebvre, V. A key QTL cluster is conserved among accessions and exhibits broad-spectrum resistance to Phytophthora capsici: A valuable locus for pepper breeding. Mol. Breed. 2013, 32, 349–364. [Google Scholar] [CrossRef]
  32. Bonnet, J.; Danan, S.; Boudet, C.; Barchi, L.; Sage-Palloix, A.-M.; Caromel, B.; Palloix, A.; Lefebvre, V. Are the polygenic architectures of resistance to Phytophthora capsici and P. parasitica independent in pepper? Theor. Appl. Genet. 2007, 115, 253–264. [Google Scholar] [CrossRef]
  33. Sun, X.; Liu, D.; Zhang, X.; Li, W.; Liu, H.; Hong, W.; Jiang, C.; Guan, N.; Ma, C.; Zeng, H.; et al. SLAF-seq: An Efficient Method of Large-Scale De Novo SNP Discovery and Genotyping Using High-Throughput Sequencing. PLoS ONE 2013, 8, e58700. [Google Scholar] [CrossRef] [PubMed]
  34. Li, B.; Tian, L.; Zhang, J.; Huang, L.; Han, F.; Yan, S.; Wang, L.; Zheng, H.; Sun, J. Construction of a high-density genetic map based on large-scale markers developed by specific length amplified fragment sequencing (SLAF-seq) and its application to QTL analysis for isoflavone content in Glycine max. BMC Genom. 2014, 15, 1086. [Google Scholar] [CrossRef] [Green Version]
  35. Zhang, Z.; Shang, H.; Shi, Y.; Huang, L.; Li, J.; Ge, Q.; Gong, J.; Liu, A.; Chen, T.; Wang, D. Construction of a high-density genetic map by specific locus amplified fragment sequencing (SLAF-seq) and its application to Quantitative Trait Loci (QTL) analysis for boll weight in upland cotton (Gossypium hirsutum). BMC Plant Biol. 2016, 16, 79. [Google Scholar] [CrossRef] [PubMed] [Green Version]
  36. Qi, Z.; Huang, L.; Zhu, R.; Xin, D.; Liu, C.; Han, X.; Jiang, H.; Hong, W.; Hu, G.; Zheng, H.; et al. A High-Density Genetic Map for Soybean Based on Specific Length Amplified Fragment Sequencing. PLoS ONE 2014, 9, e104871. [Google Scholar] [CrossRef] [PubMed] [Green Version]
  37. Zhang, Y.; Wang, L.; Xin, H.; Li, D.; Ma, C.; Ding, X.; Hong, W.; Zhang, X. Construction of a high-density genetic map for sesame based on large scale marker development by specific length amplified fragment (SLAF) sequencing. BMC Plant Biol. 2013, 13, 141. [Google Scholar] [CrossRef] [PubMed] [Green Version]
  38. Xu, X.; Lu, L.; Zhu, B.; Xu, Q.; Qi, X.; Chen, X. QTL mapping of cucumber fruit flesh thickness by SLAF-seq. Sci. Rep. 2015, 5, 15829. [Google Scholar] [CrossRef] [PubMed]
  39. Zhu, Y.; Yin, Y.; Yang, K.; Li, J.; Sang, Y.; Huang, L.; Fan, S. Construction of a high-density genetic map using specific length amplified fragment markers and identification of a quantitative trait locus for anthracnose resistance in walnut (Juglans regia L.). BMC Genom. 2015, 16, 1–13. [Google Scholar] [CrossRef] [PubMed] [Green Version]
  40. Zhang, X.-F.; Wang, G.-Y.; Dong, T.-T.; Chen, B.; Du, H.-S.; Li, C.-B.; Zhang, F.-L.; Zhang, H.-Y.; Xu, Y.; Wang, Q.; et al. High-density genetic map construction and QTL mapping of first flower node in pepper (Capsicum annuum L.). BMC Plant Biol. 2019, 19, 167. [Google Scholar] [CrossRef] [PubMed]
  41. Hu, X.H.; Zhang, S.Z.; Miao, H.R.; Cui, F.G.; Shen, Y.; Yang, W.Q.; Xu, T.T.; Chen, N.; Chi, X.Y.; Zhang, Z.M.; et al. High-Density Genetic Map Construction and Identification of QTLs Controlling Oleic and Linoleic Acid in Peanut using SLAF-seq and SSRs. Sci. Rep. 2018, 8, 5479. [Google Scholar] [CrossRef]
  42. Wang, L.; Yang, X.; Cui, S.; Zhao, N.; Li, L.; Hou, M.; Mu, G.; Liu, L.; Li, Z. High-density genetic map development and QTL mapping for concentration degree of floret flowering date in cultivated peanut (Arachis hypogaea L.). Mol. Breed. 2020, 40, 1–14. [Google Scholar] [CrossRef]
  43. Guo, G.; Wang, S.; Liu, J.; Pan, B.; Diao, W.; Ge, W.; Gao, C.; Snyder, J.C. Rapid identification of QTLs underlying resistance to Cucumber mosaic virus in pepper (Capsicum frutescens). Theor. Appl. Genet. 2016, 130, 41–52. [Google Scholar] [CrossRef]
  44. Zhu, Z.; Sun, B.; Wei, J.; Cai, W.; Huang, Z.; Chen, C.; Cao, B.; Chen, G.; Lei, J. Construction of a high density genetic map of an interspecific cross of Capsicum chinense and Capsicum annuum and QTL analysis of floral traits. Sci. Rep. 2019, 9, 1–14. [Google Scholar] [CrossRef] [Green Version]
  45. Murray, M.G.; Thompson, C.L.; Wendel, J.F. Rapid isolation of high molecular weight plant DNA. Nucleic Acids Res. 1980, 8, 4321–4325. [Google Scholar] [CrossRef] [PubMed] [Green Version]
  46. Li, R.; Li, Y.; Kristiansen, K.; Wang, J. SOAP: Short oligonucleotide alignment program. Bioinformatics 2008, 24, 713–714. [Google Scholar] [CrossRef] [PubMed] [Green Version]
  47. Peichel, C.L.; Nereng, K.S.; Ohgi, K.A.; Cole, B.L.E.; Colosimo, P.F.; Buerkle, C.A.; Schluter, D.; Kingsley, D.M. The genetic architecture of divergence between threespine stickleback species. Nat. Cell Biol. 2001, 414, 901–905. [Google Scholar] [CrossRef] [PubMed] [Green Version]
  48. Wang, W.; Huang, S.; Liu, Y.; Fang, Z.; Yang, L.; Hua, W.; Yuan, S.; Liu, S.; Sun, J.; Zhuang, M.; et al. Construction and analysis of a high-density genetic linkage map in cabbage (Brassica oleracea L. var. capitata). BMC Genom. 2012, 13, 523. [Google Scholar] [CrossRef] [Green Version]
  49. Burdon, J.J.; Thrall, P.H. Coevolution of Plants and Their Pathogens in Natural Habitats. Science 2009, 324, 755–756. [Google Scholar] [CrossRef] [PubMed] [Green Version]
  50. Sun, M.; Voorrips, R.E.; Westende, W.V.; van Kaauwen, M.; Visser, R.G.F.; Vosman, B. Aphid resistance in Capsicum maps to a locus containing LRR-RLK gene analogues. Theor. Appl. Genet. 2020, 133, 227–237. [Google Scholar] [CrossRef] [Green Version]
  51. Ogundiwin, E.A.; Berke, T.F.; Massoudi, M.; Black, L.L.; Huestis, G.; Choi, D.; Lee, S.; Prince, J.P. Construction of 2 intra-specific linkage maps and identification of resistance QTLs for Phytophthora capsici root-rot and foliar-blight diseases of pepper (Capsicum annuum L.). Genome 2005, 48, 698–711. [Google Scholar] [CrossRef]
  52. Collard, B.C.Y.; Jahufer, M.Z.Z.; Brouwer, J.B.; Pang, E.C.K. An introduction to markers, quantitative trait loci (QTL) mapping and marker-assisted selection for crop improvement: The basic concepts. Euphytica 2005, 142, 169–196. [Google Scholar] [CrossRef]
  53. Rose, L.E.; Bittner-Eddy, P.D.; Langley, C.H.; Holub, E.B.; Michelmore, R.W.; Beynon, J.L. The Maintenance of Extreme Amino Acid Diversity at the Disease Resistance Gene, RPP13, in Arabidopsis thaliana. Genetics 2004, 166, 1517–1527. [Google Scholar] [CrossRef] [PubMed] [Green Version]
  54. Serra, H.; Choi, K.; Zhao, X.; Blackwell, A.R.; Kim, J.; Henderson, I.R. Interhomolog polymorphism shapes meiotic crossover within the Arabidopsis RAC1 and RPP13 disease resistance genes. PLoS Genet. 2018, 14, e1007843. [Google Scholar] [CrossRef] [Green Version]
  55. Alder, M.N.; Rogozin, I.B.; Iyer, L.M.; Glazko, G.V.; Cooper, M.D.; Pancer, Z. Diversity and Function of Adaptive Immune Receptors in a Jawless Vertebrate. Science 2005, 310, 1970–1973. [Google Scholar] [CrossRef] [PubMed] [Green Version]
  56. Shanmugam, V. Role of extracytoplasmic leucine rich repeat proteins in plant defence mechanisms. Microbiol. Res. 2005, 160, 83–94. [Google Scholar] [CrossRef]
  57. Zhang, X.S.; Choi, J.H.; Heinz, J.; Chetty, C.S. Domain-Specific Positive Selection Contributes to the Evolution of Arabidopsis Leucine-Rich Repeat Receptor-Like Kinase (LRR RLK) Genes. J. Mol. Evol. 2006, 63, 612–621. [Google Scholar] [CrossRef]
Figure 1. Specific-locus amplified fragment sequencing (SLAF) polymorphism analysis. Marker count in eight segregation patterns. The x-axis represents eight segregation patterns for the polymorphic SLAF markers, and the y-axis shows the number of markers.
Horticulturae 07 00092 g001
Figure 2. Distribution of SLAF markers across 12 pepper linkage groups. The black bar indicates a SLAF marker. The x-axis shows the linkage group number, whereas the y-axis represents genetic distance.
Horticulturae 07 00092 g002
Figure 3. Collinearity between genetic and physical maps. The correlation between the pepper chromosomes (Chr) and the linkage group (LG) of the genetic map is illustrated.
Horticulturae 07 00092 g003
Figure 4. Quantitative trait locus (QTL) analysis of the P. capsici resistance trait of pepper. The x-axis indicates linkage group in pepper, and the y-axis presents LOD values. The blue line indicates the additive effect, and the red line represents the dominant effect.
Horticulturae 07 00092 g004
Figure 5. qPCR analysis of five genes in PI201234 and Early calwonder that are related to disease resistance or defense. PI: PI201234 inoculated using P. capsici zoospore suspension; EA: Early calwonder inoculated using P. capsici zoospore suspension. The x-axis shows the time points of sample collection, d: days post-inoculation. The y-axis shows the relative expression quantity of genes. Gene expression was normalized to that of actin, and the data were expressed as the mean ± standard deviation of two biological replicates and three technical replicates. A Student’s t-test was used to analyze statistical significance of differences. * 0.05 level of significance; ** 0.01 level of significance.
Horticulturae 07 00092 g005
Table 1. Specific-locus amplified fragment sequencing (SLAF)-seq data statistics of the Capsicum F2 population.
SamplesTotal ReadTotal BasesQ30 Percentage (%)GC Content (%)SLAF NumberTotal DepthAverage Depth(X)
PI20123412,250,4402,449,757,55293.9838.42139,0468,875,57863.83
128713,232,2572,646,335,36494.7138.15141,58410,239,20872.32
Offspring2,371,153474,202,39694.3738.36124,5821,825,92814.66
Total381,155,58776,226,452,30894.3738.86405,212//
Table 2. Description on basic characteristics of the 12 linkage groups.
Linkage GroupSLAF NumberPolymorphic
Chr0116,1093221
Chr0292591626
Chr0315,2313159
Chr0412,6961569
Chr0513,0242986
Chr0612,8872640
Chr0711,6671907
Chr0894261263
Chr0914,5073250
Chr1011,3561687
Chr1111,8903937
Chr1213,0892343
Other23,0524844
Total174,19334,432
Table 3. Basic information of the 12 linkage groups. The closer the Spearman’s rank correlation coefficient is to 1, the better the collinearity.
Linkage GroupMarker NumberAverage Distance between Markers (cM)Size (cM)Gaps ≤ 5Max Gap (cM)Correlation Coefficient
Chr014370.36158.3299.08%6.770.9968
Chr024150.28114.98100.00%4.570.9273
Chr034440.38169.18100.00%4.630.9979
Chr043360.36120.2099.70%6.380.9948
Chr054600.2299.9899.78%7.290.9054
Chr067220.19137.9299.58%6.310.9977
Chr075170.27137.6699.22%8.710.9712
Chr083730.27100.81100.00%3.940.9568
Chr094140.27112.8899.52%5.820.9875
Chr105320.23122.6399.81%9.990.9963
Chr114580.29133.80100.00%4.700.9974
Chr124570.28127.3399.56%6.380.9803
Maximum7220.38169.18100.00%9.990.9979
Minimum3360.1999.9899.08%3.940.9054
Total55650.281535.69///
Average463.75/127.9799.70%/0.9758
Table 4. Details on the depth of mapped markers.
SamplesMarker NumbersTotal Depth(X)Average Depth(X)
PI2012345565605,153108.74
12875565702,568126.25
Offspring5513125,29322.73
Table 5. Descriptive statistics of disease index and the whole population of the parents.
TraitsF2 PopulationParent
MinMaxRangeAverageStandard ErrorVarSkewKurtPI2012341287Midparent
Disease index (100%)010–10.47720.0290.75−0.17−1.437.984.346.1
Table 6. Quantitative trait locus (QTL) analysis of the P. capsici resistance trait in F2 populations.
QTLLOD Threshold Chr IDPhysical Distance Interval (bp)Genetic Distance Interval (cM)Max LODADDDOMPVE (%)
CQPc5.16.1250517,967,630–19,446,34933.103–33.4486.972−0.8970.07911.758
Note: LOD, logarithm of odds. Maximum LOD score (QTL peak). ADD, additive effects. DOM, dominance effects. PVE, phenotypic variance explained.
Table 7. Details of the annotated candidate genes.
GeneStartStopCOGKEGGSwiss-ProtNr
Capana05g00059218,024,84018,035,001K17550 (protein phosphatase 1 regulatory subunit 7)Protein phosphatase 1 regulatory inhibitor subunit PPP1R7 homologPREDICTED: protein phosphatase 1 regulatory subunit pprA-like
Capana05g00059418,317,19818,327,621K13099 (CD2 antigen cytoplasmic tail-binding protein 2)PREDICTED: CD2 antigen cytoplasmic tail-binding protein 2
Capana05g00059518,357,31518,357,857Disease resistance RPP8-like protein Hypothetical protein T459_14155
Capana05g00059618,358,56818,359,167General function prediction only Putative disease resistance RPP13-like proteinHypothetical protein T459_14156
Capana05g00059718,359,45718,359,987Disease resistance protein RPP13 Hypothetical protein BC332_12877
Capana05g00059818,387,07518,390,244Transcription Probable LRR receptor-like serine/threonine-protein kinase At3g47570 PREDICTED: probable LRR receptor-like serine/threonine-protein kinase At3g47570
Capana05g00059918,390,81718,396,058Carbohydrate transport and metabolism K05298 (glyceraldehyde-3-phosphate dehydrogenase (NADP+))Glyceraldehyde-3-phosphate dehydrogenase A, chloroplastic (Fragment) PREDICTED: glyceraldehyde-3-phosphate dehydrogenase A, chloroplastic
Capana05g00060018,401,53718,405,948General function prediction only Protein high chlorophyll fluorescent 107 PREDICTED: protein high chlorophyll fluorescent 107
Capana05g00060118,410,07818,412,165Post-translational modification, protein turnover, chaperones K00587 (protein-S-isoprenylcysteine O-methyltransferase)Protein-S-isoprenylcysteine O-methyltransferase B PREDICTED: protein-S-isoprenylcysteine O-methyltransferase A-like isoform X1
Capana05g00060218,413,94618,415,745Pentatricopeptide repeat-containing protein At2g13600 OS = Arabidopsis thaliana PREDICTED: pentatricopeptide repeat-containing protein At2g13600
Capana05g00060318,424,43918,427,748Coenzyme transport and metabolism FAD synthetase 1, chloroplastic PREDICTED: FAD synthetase 1, chloroplastic-like
Capana05g00060418,449,80518,454,056Transcription K10268 (F-box and leucine-rich repeat protein)F-box/LRR-repeat protein 4PREDICTED: F-box/LRR-repeat protein 20
Capana05g00060518,709,35318,710,879UPF0481 protein At3g47200 PREDICTED: putative UPF0481 protein At3g02645 isoform X1
Capana05g00060718,749,83018,750,435PREDICTED: uncharacterized protein LOC107870380 isoform X1
Capana05g00060818,775,19818,776,266Cell wall/membrane/envelope biogenesisK18819 (inositol 3-alpha-galactosyltransferase)Galactinol synthase 2Galactinol synthase 2
Capana05g00060918,823,99618,827,956Hypothetical protein CQW23_12126
Capana05g00061118,835,57018,835,953K13495 (cis-zeatin O-glucosyltransferase)Zeatin O-xylosyltransferase PREDICTED: zeatin O-glucosyltransferase
Capana05g00061218,851,47818,852,197K13495 (cis-zeatin O-glucosyltransferase)Zeatin O-glucosyltransferase PREDICTED: zeatin O-xylosyltransferase-like
Capana05g00061318,857,04618,857,423K13495 (cis-zeatin O-glucosyltransferase)Zeatin O-glucosyltransferase Hypothetical protein T459_14175
Capana05g00061418,879,06418,879,435Putative cis-zeatin O-glucosyltransferase PREDICTED: zeatin O-xylosyltransferase-like
Capana05g00061518,879,69418,880,182K13495 (cis-zeatin O-glucosyltransferase)Zeatin O-xylosyltransferase Hypothetical protein T459_14174
Capana05g00061719,193,43919,194,854K13495 (cis-zeatin O-glucosyltransferase)Zeatin O-glucosyltransferase PREDICTED: zeatin O-glucosyltransferase-like
Capana05g00061819,354,15719,355,500Transcription Receptor-like protein Cf-9Hypothetical protein T459_14173
Total 9112023
Note: COG, Clusters of Orthologous Groups. KEGG, Kyoto Encyclopedia of Genes and Genom.
Table 8. Information on genes employed in qRT-PCR analysis.
Gene NamePrimer Sequence (5′-3′)PCR Product Size (bp)TM (°C)
Capana05g000595F:AAGGAGGCATTTAGCCGCAA11559.0
R:TGTCTCAAGGCGAGCAACAT
Capana05g000596F:CTGCAAGAAAGCGTGTCAGG9859.0
R:AGCCTCCACATCTTTCCACC
Capana05g000597F:CAATCCCTCAAGCGACGAGT12155.0
R:CCAGGTCGGACCGATTGTTA
Capana05g000598F:ACCTTCCGTGGTGAAATCCC19055.0
R:CGATCCGCGTAACAGGTTTG
Capana05g000604F:TTAGCTGTTGCTGAGGGGTG16359.0
R:GCTTGCGTCCAGAGAGACAAA
Actin (AY572427)F:AGCAACTGGGACGATATGGAGAAG19850.0
R:AAGAGACAACACCGCCTGAATAGC
Publisher’s Note: MDPI stays neutral with regard to jurisdictional claims in published maps and institutional affiliations.

