
Detecting Maturity in Fresh Lycium barbarum L. Fruit Using Color Information


College of Mechanical and Electronic Engineering, Northwest A&F University, Xianyang 712100, China
*
Author to whom correspondence should be addressed.
Horticulturae 2021, 7(5), 108; https://0-doi-org.brum.beds.ac.uk/10.3390/horticulturae7050108
Submission received: 16 April 2021
/
Revised: 4 May 2021
/
Accepted: 7 May 2021
/
Published: 11 May 2021
(This article belongs to the Section Fruit Production Systems)
Abstract
:The accurate quantitative maturity detection of fresh Lycium barbarum L. (L. barbarum) fruit is the key to determine whether fruit are suitable for harvesting or not and can also be helpful to improve the quality of post-harvest processing. To achieve this goal, abnormal samples were eliminated by the Mahalanobis Distance (MD), and nine components (i.e., R, G, B, H, S, V, L, a, and b) of the ripe fruit, half-ripe fruit, and unripe fruit were extracted, firstly. Then, significant component combinations of the three fruits beneficial to the extraction of their areas were determined. Through binary processing, morphology processing, and other image processing methods, a quantitative maturity detection model of fruit was established based on the support vector machine (SVM) model. On this basis, field experiments were conducted to verify and compare the relationship between the prediction results of the model and the picking forces of fruit. Field experiments showed that the accuracies of both the training set and prediction set were 100% and the prediction results of the model were consistent with the picking forces of fruit. Findings provided a theoretical basis for the accurate quantitative maturity detection of fresh L. barbarum fruit.
1. Introduction
Lycium barbarum L. (L. barbarum) is a solanaceae Lycium indefinite inflorescence deciduous shrub and its ripe fruit [1,2,3], commonly known as Goji, has been reported to contain health-promoting bioactive components, such as the polysaccharides, zeaxanthin, and antioxidant compounds [4]. Both in vitro and in vivo studies of L. barbarum have demonstrated its anti-inflammation, anti-aging, anti-hypertensive, anti-hyperglycemic, anti-tumoral, and anti-Alzheimer effects, as well as alleviating mood disturbances during the rehabilitation of cough syrup abusers [5,6]. For centuries, the mechanized harvesting of L. barbarum has been a difficult problem [7]. Therefore, the fruit are normally harvested manually, which results in the low efficiency and high cost. With the continuous expansion of L. barbarum acreage, labor for harvesting fruit is increasingly scarce. The harvesting becomes the bottleneck limiting the development of the L. barbarum industry [3]. At present, scholars in China and abroad are producing prototypes of L. barbarum harvesting machines [3,8,9,10,11,12,13,14,15]. With the popularization of the standardized planting mode of L. barbarum, the large-scale manor planting mode of L. barbarum has become the development trend and the machine harvesting of fruit over plants has become suitable for the mechanized harvesting of this planting mode. For this method however, it is important to accurately predict the optimal harvest maturity of fruits (as is the case for, e.g., nectarines) [16]. Therefore, determining whether fruit are suitable for harvesting or not is an urgent problem. Furthermore, the accurate quantitative maturity detection of fruit will also be helpful to improve the quality of post-harvest processing, such as sorting and grading.
The pericarp color is an important factor for the evaluation of fruit quality and also indirectly represents sugar content, acidity, and taste [17]. With the development of machine vision technology, non-destructive testing methods of fruits and vegetables are becoming increasingly mature [18,19,20,21]. Meanwhile, with the development of the economy and society, public demand for high-quality fruits is increasing. In response, sorting and grading systems for fruits have become increasingly developed and good results have been achieved for, e.g., apple [19,20] and mango [22]. Therefore, it is feasible to achieve the accurate quantitative maturity detection of fruit using color information.
Samples were easily affected by environment factors when taking photos, such as illumination and shadow, which affects the accuracy of establishing the maturity detection model. Eliminating abnormal samples was the fundamental process before establishing the model. The Mahalanobis Distance (MD) was introduced by the Indian statistician Mahalanobis and is a representation of the covariance distance of data. This is an effective method to calculate the similarity degree of two unknown sample sets. In contrast to the Euclidean distance, the (MD) considers the relationship of various characteristics [23,24]. Therefore, it offers the advantages of being independent of measurement scale and not affected by dimension, and is widely used to eliminate abnormal samples.
A suitable classification model is also critical for establishing the maturity detection model. Support vector machine (SVM) is used for the hyperplane separation of binary classification problems and to adjust a discriminating function based on supervised learning [25,26]. It makes optimal use of the separation information of boundary cases. Therefore, it is widely used to sort and grade fruits [19].
Scholars established the maturity detection models of some fruits using different methods, such as the time-resolved reflectance spectroscopy and computer vision [16,17,18,22,27,28,29,30,31]. Tijskens et al. assessed harvest maturity in nectarines using the time-resolved reflectance spectroscopy. It was a novel technique but too expensive for the current L. barbarum fruit production. Lien et al. assessed tomato maturity using the non-destructive impact test. However, doing the impact test of L. barbarum fruit took too much time. Poel et al. detected tomato maturity based on physiological properties. However, it has been difficult to realize real-time detection of L. barbarum using this method, recently. Aranda-Sanchez et al. determined tomato fruit ripening stages by establishing the Bayesian classifier. Nonetheless, it was difficult to establish the maturity detection model of L. barbarum fruit by establishing the Bayesian classifier. It was widely used to establish maturity detection models based on color information using computer vision in tomato [17,27,28], mango [22], and apple [31]. Based on the above analysis, color information of pericarp was easy to distinguish and had a stable difference compared to other characteristics. In addition, the image processing technology was also mature and convenient. Therefore, we established the quantitative maturity detection of L. barbarum fruit using color information.
In this paper, abnormal samples were eliminated by the (MD) and nine components (i.e., R, G, B, H, S, V, L, a, and b) of the ripe fruit, half-ripe fruit, and unripe fruit were extracted, firstly. Then, significant component combinations of the three fruits beneficial to the extraction of their areas were determined. Through binary processing, morphology processing, and other image-processing methods, a quantitative maturity detection model of fruit was established based on the SVM model. On this basis, field experiments were conducted to verify and compare the relationship between the prediction results of the model and the picking forces of fruit. This study was expected to provide a theoretical basis for the accurate quantitative maturity detection of fresh L. barbarum fruit.
2. Materials and Methods
2.1. Sampling of Fresh L. barbarum Fruit
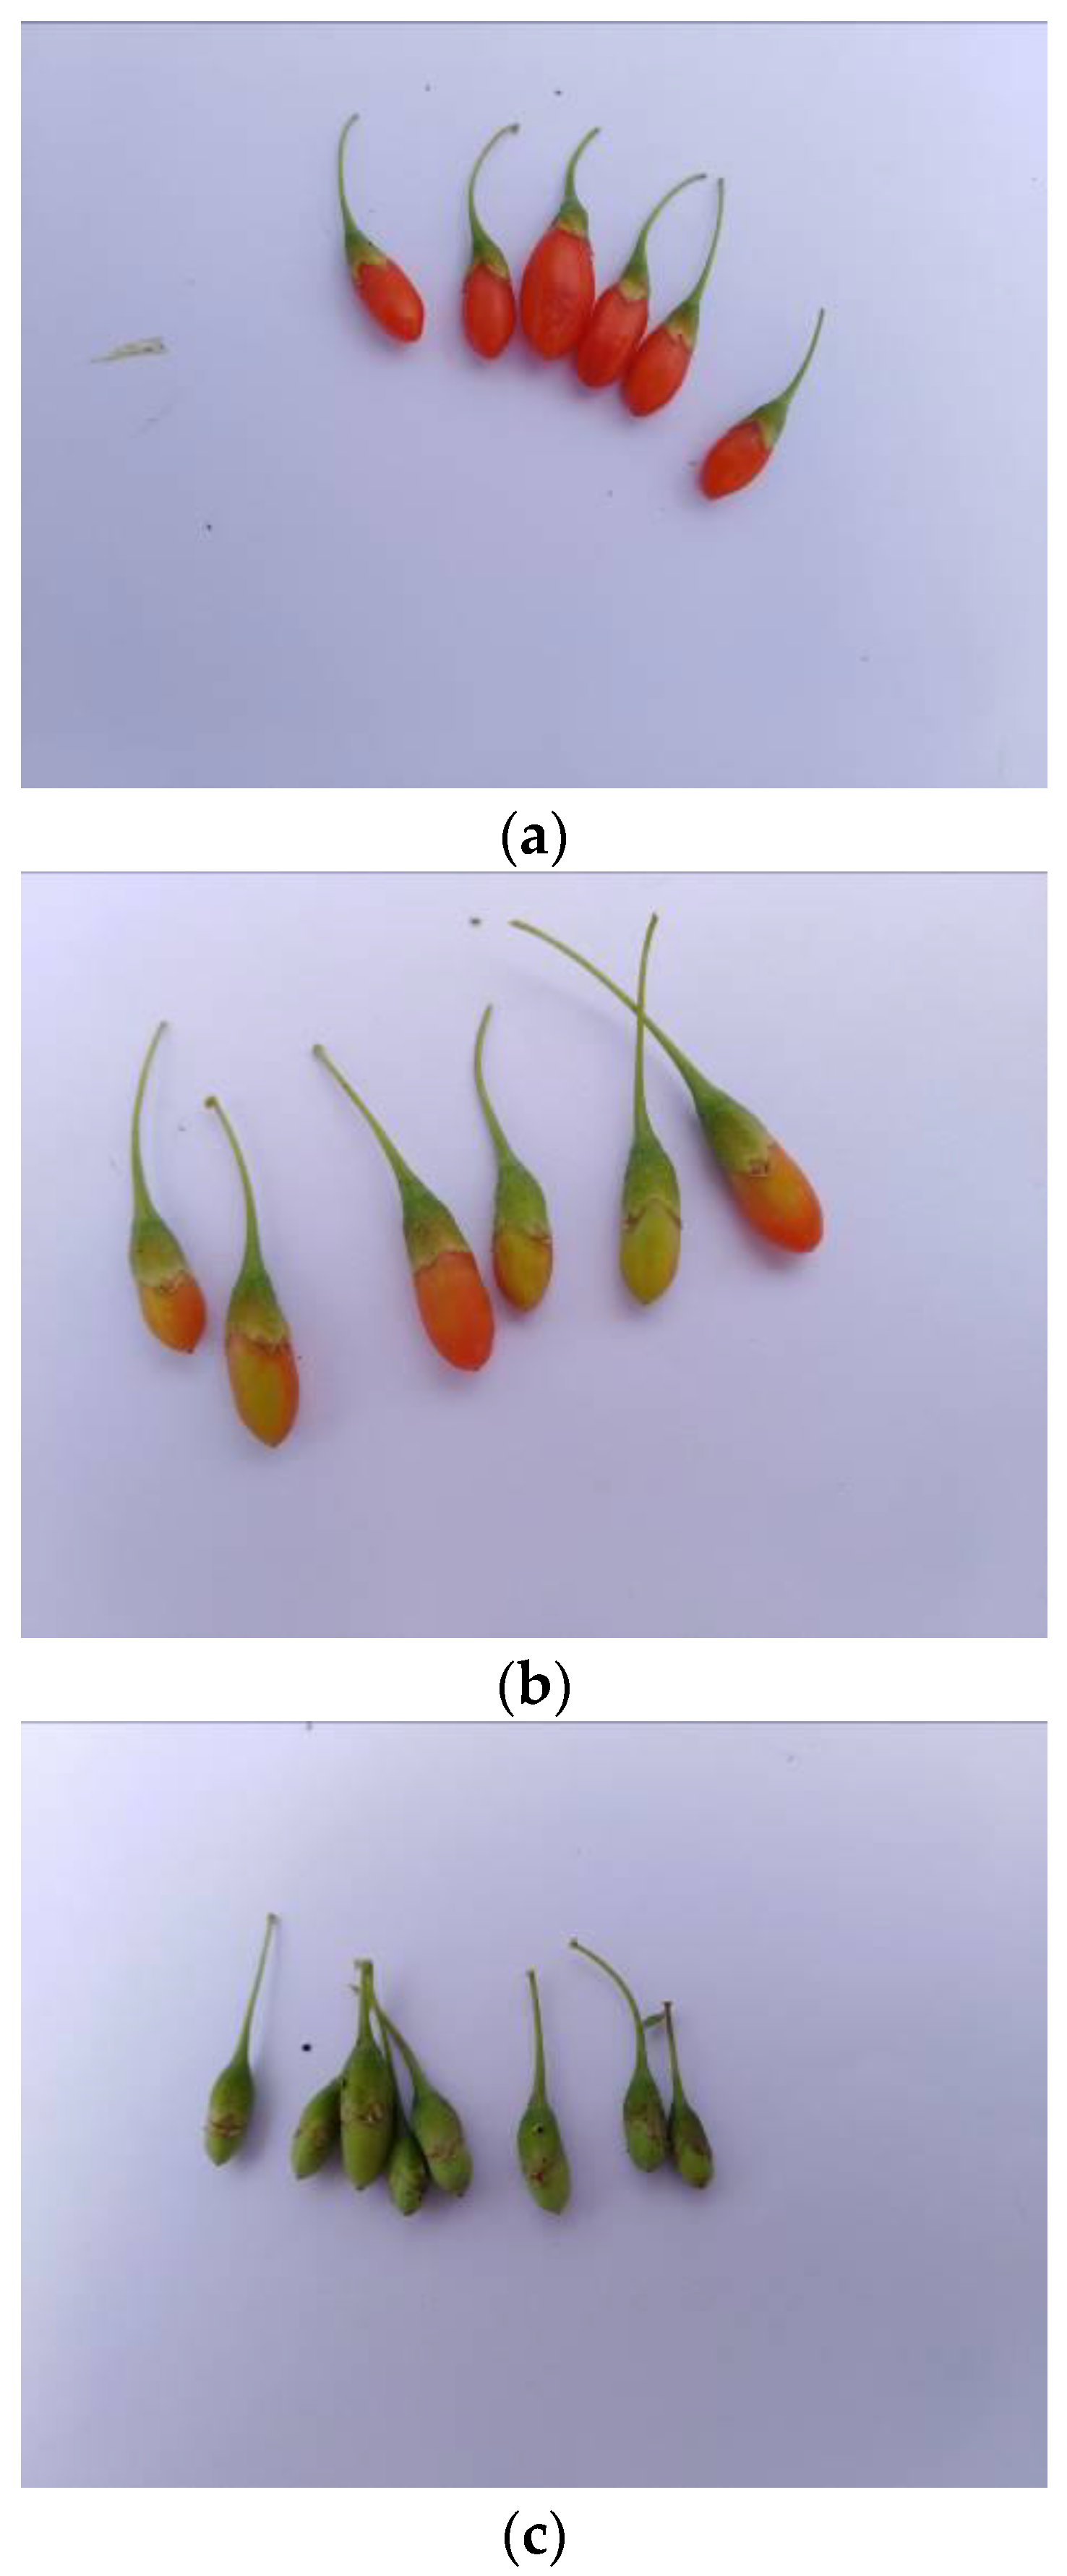
The experiment was conducted in Zhongning in the Ningxia Hui Autonomous Region (37°22′56″ N, 105°37′21″ E) on 28 September 2018. The temperature was 17.6 °C, the humidity was 20.9%, and the illuminance was 357.6 Lx. Ningqi 7 was selected as the experiment variety. Shrubs with good growth and no apparent defects were used; the plants were 4–5 years old with a height of 0.6–1.4 m after pruning. The row spacing of plants was 3 m, and the plant spacing per row was 1 m. Reference reviews indicated that there were significant differences in the pericarp color of different fruits at different maturity levels [16,17,18,22,27,28,29,30,31]. According to the differences of the pericarp color, the fruit can be divided into the ripe fruit, half-ripe fruit, and unripe fruit. Meanwhile, to make the model more universal, different amounts of the three fruits were used to establish the model. This ensured that different amounts of the three fruits were mixed for establishing the model. On this basis, 1828 ripe fruit, 556 half-ripe fruit, and 1164 unripe fruit were selected. The samples were photographed with an industrial camera (type: JHSM1000F-E), as shown in Figure 1.
2.2. Abnormal Sample Elimination Using the (MD)
To exclude the influences of the environment factors, the (MD) was used to eliminate abnormal samples. Cheng et al. put forward the threshold calculation equation and verified that it was appropriate to set the threshold adjustment coefficient to 3. In this study, the threshold calculation equation is as follows:
where T is the threshold of the sample set, μ is the mean value of the sample set, and σ is the standard deviation of the sample set.
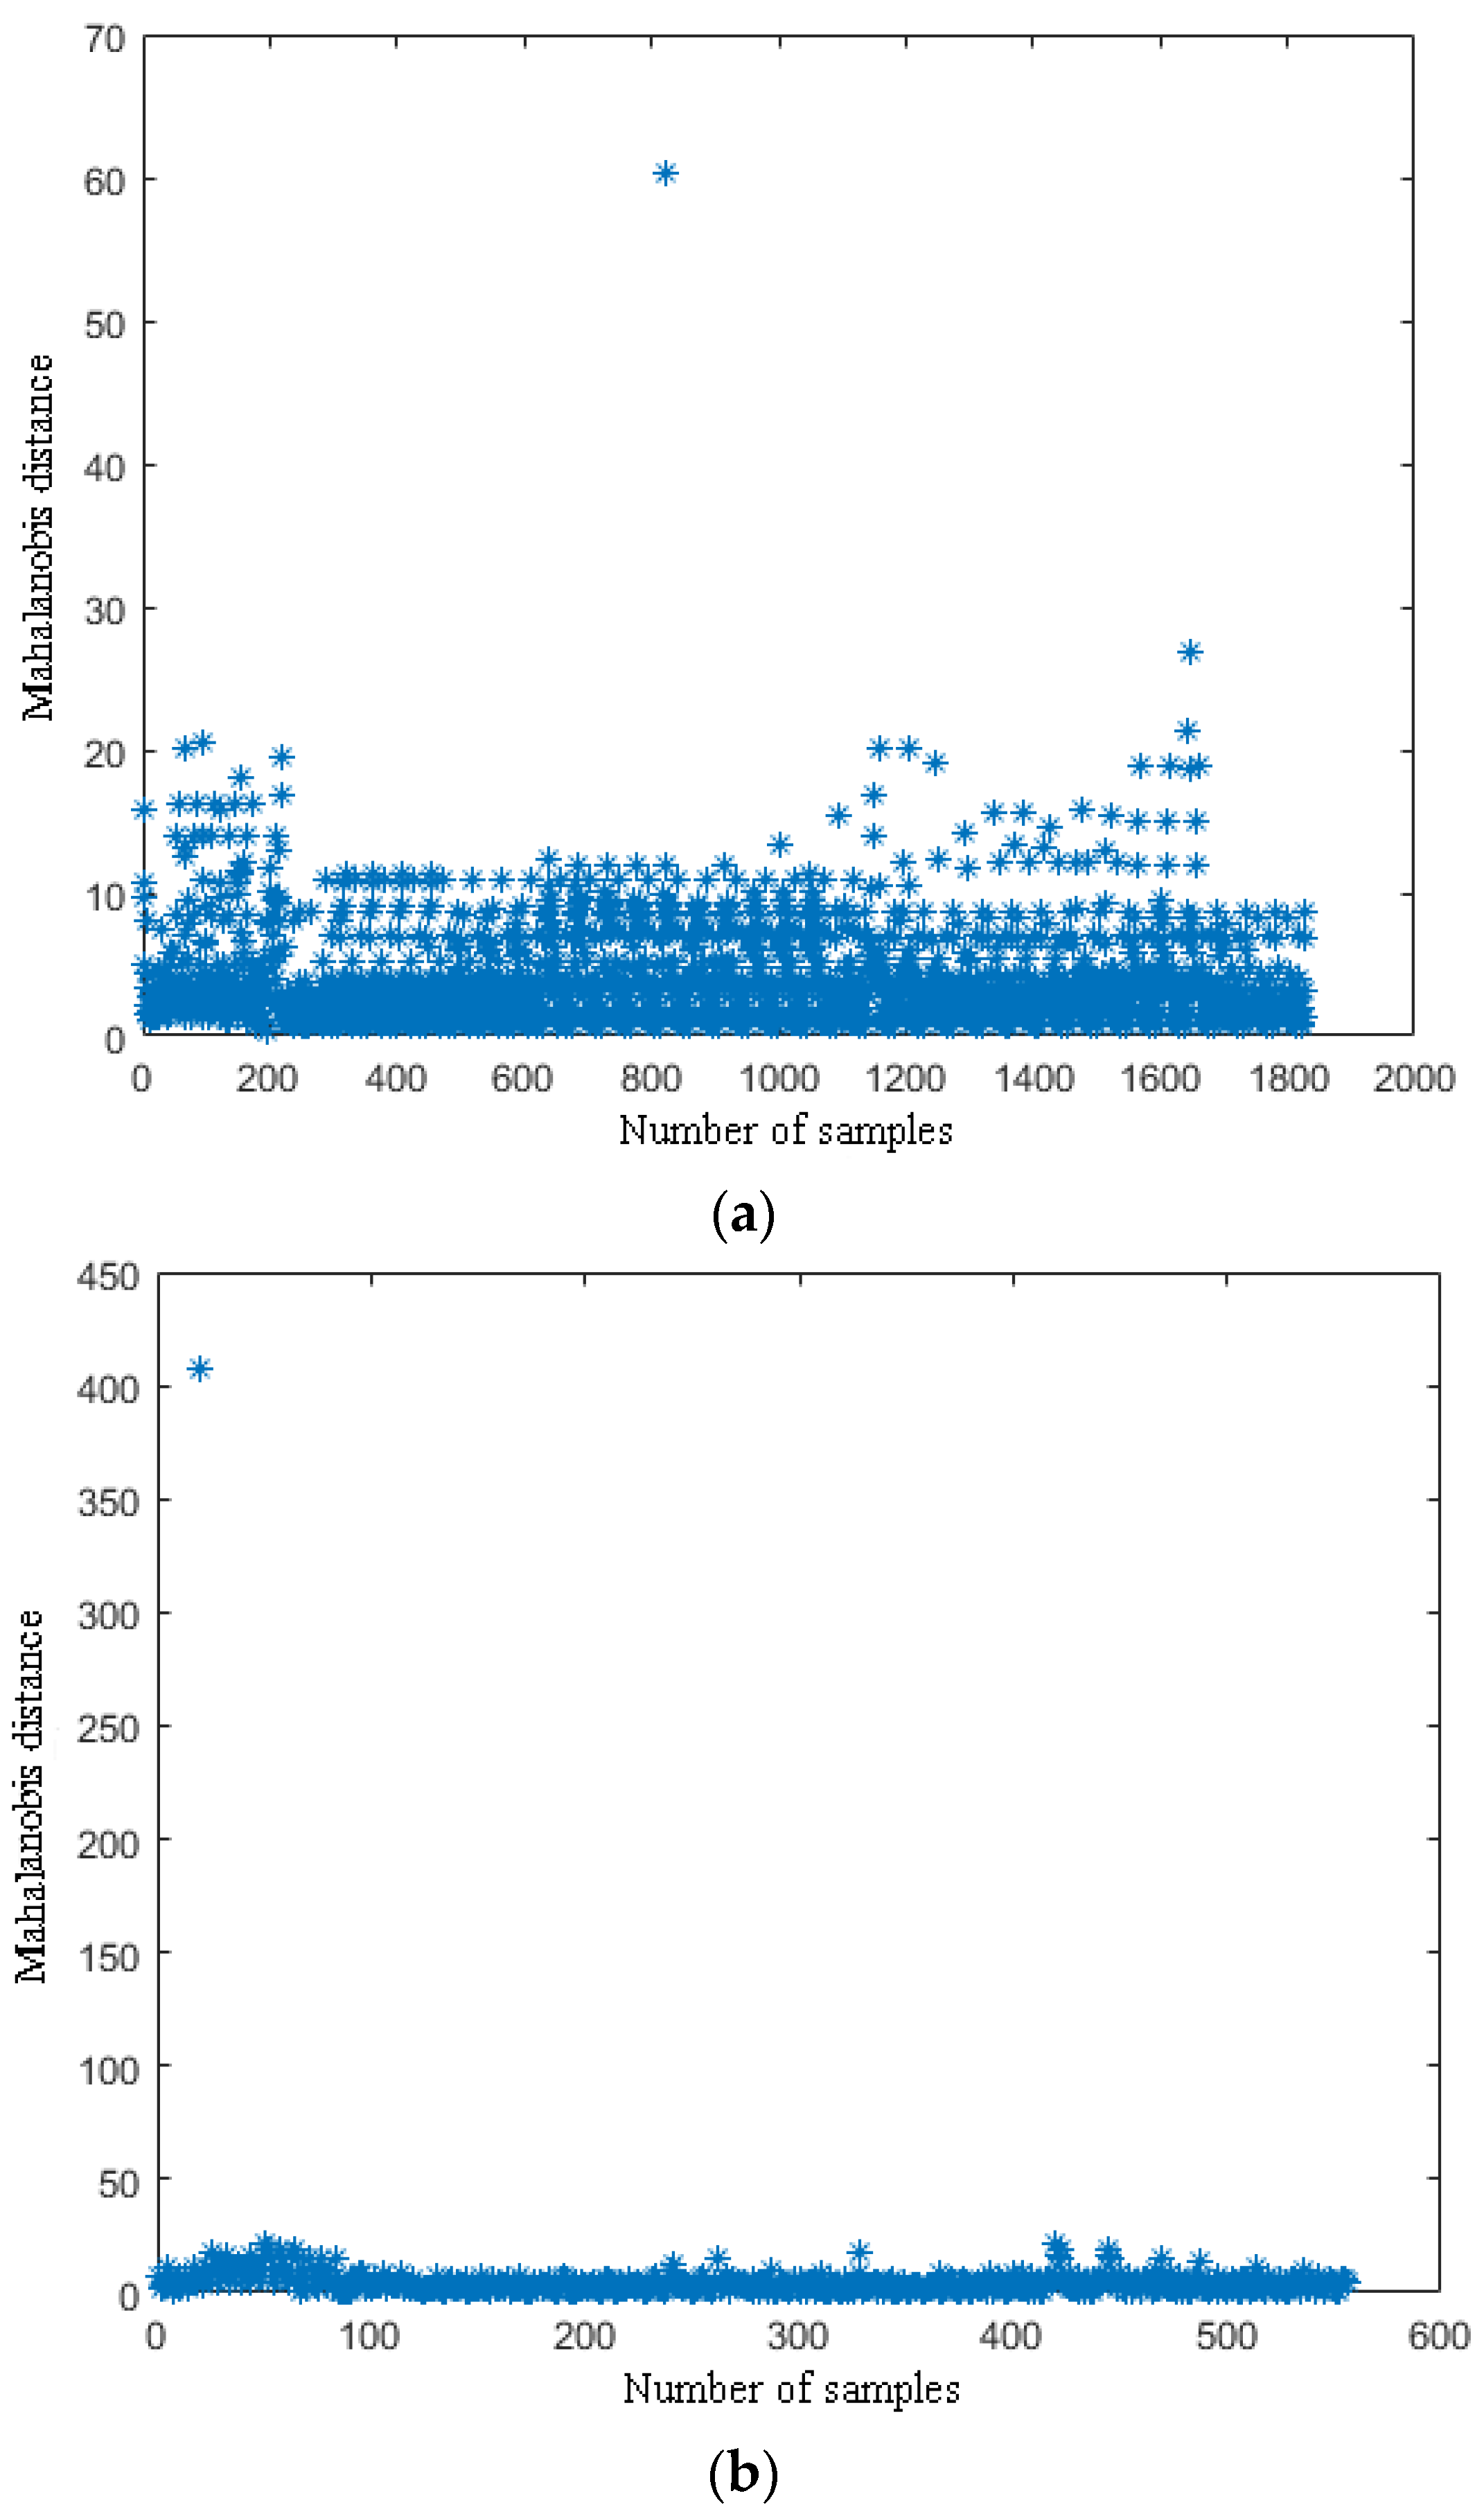
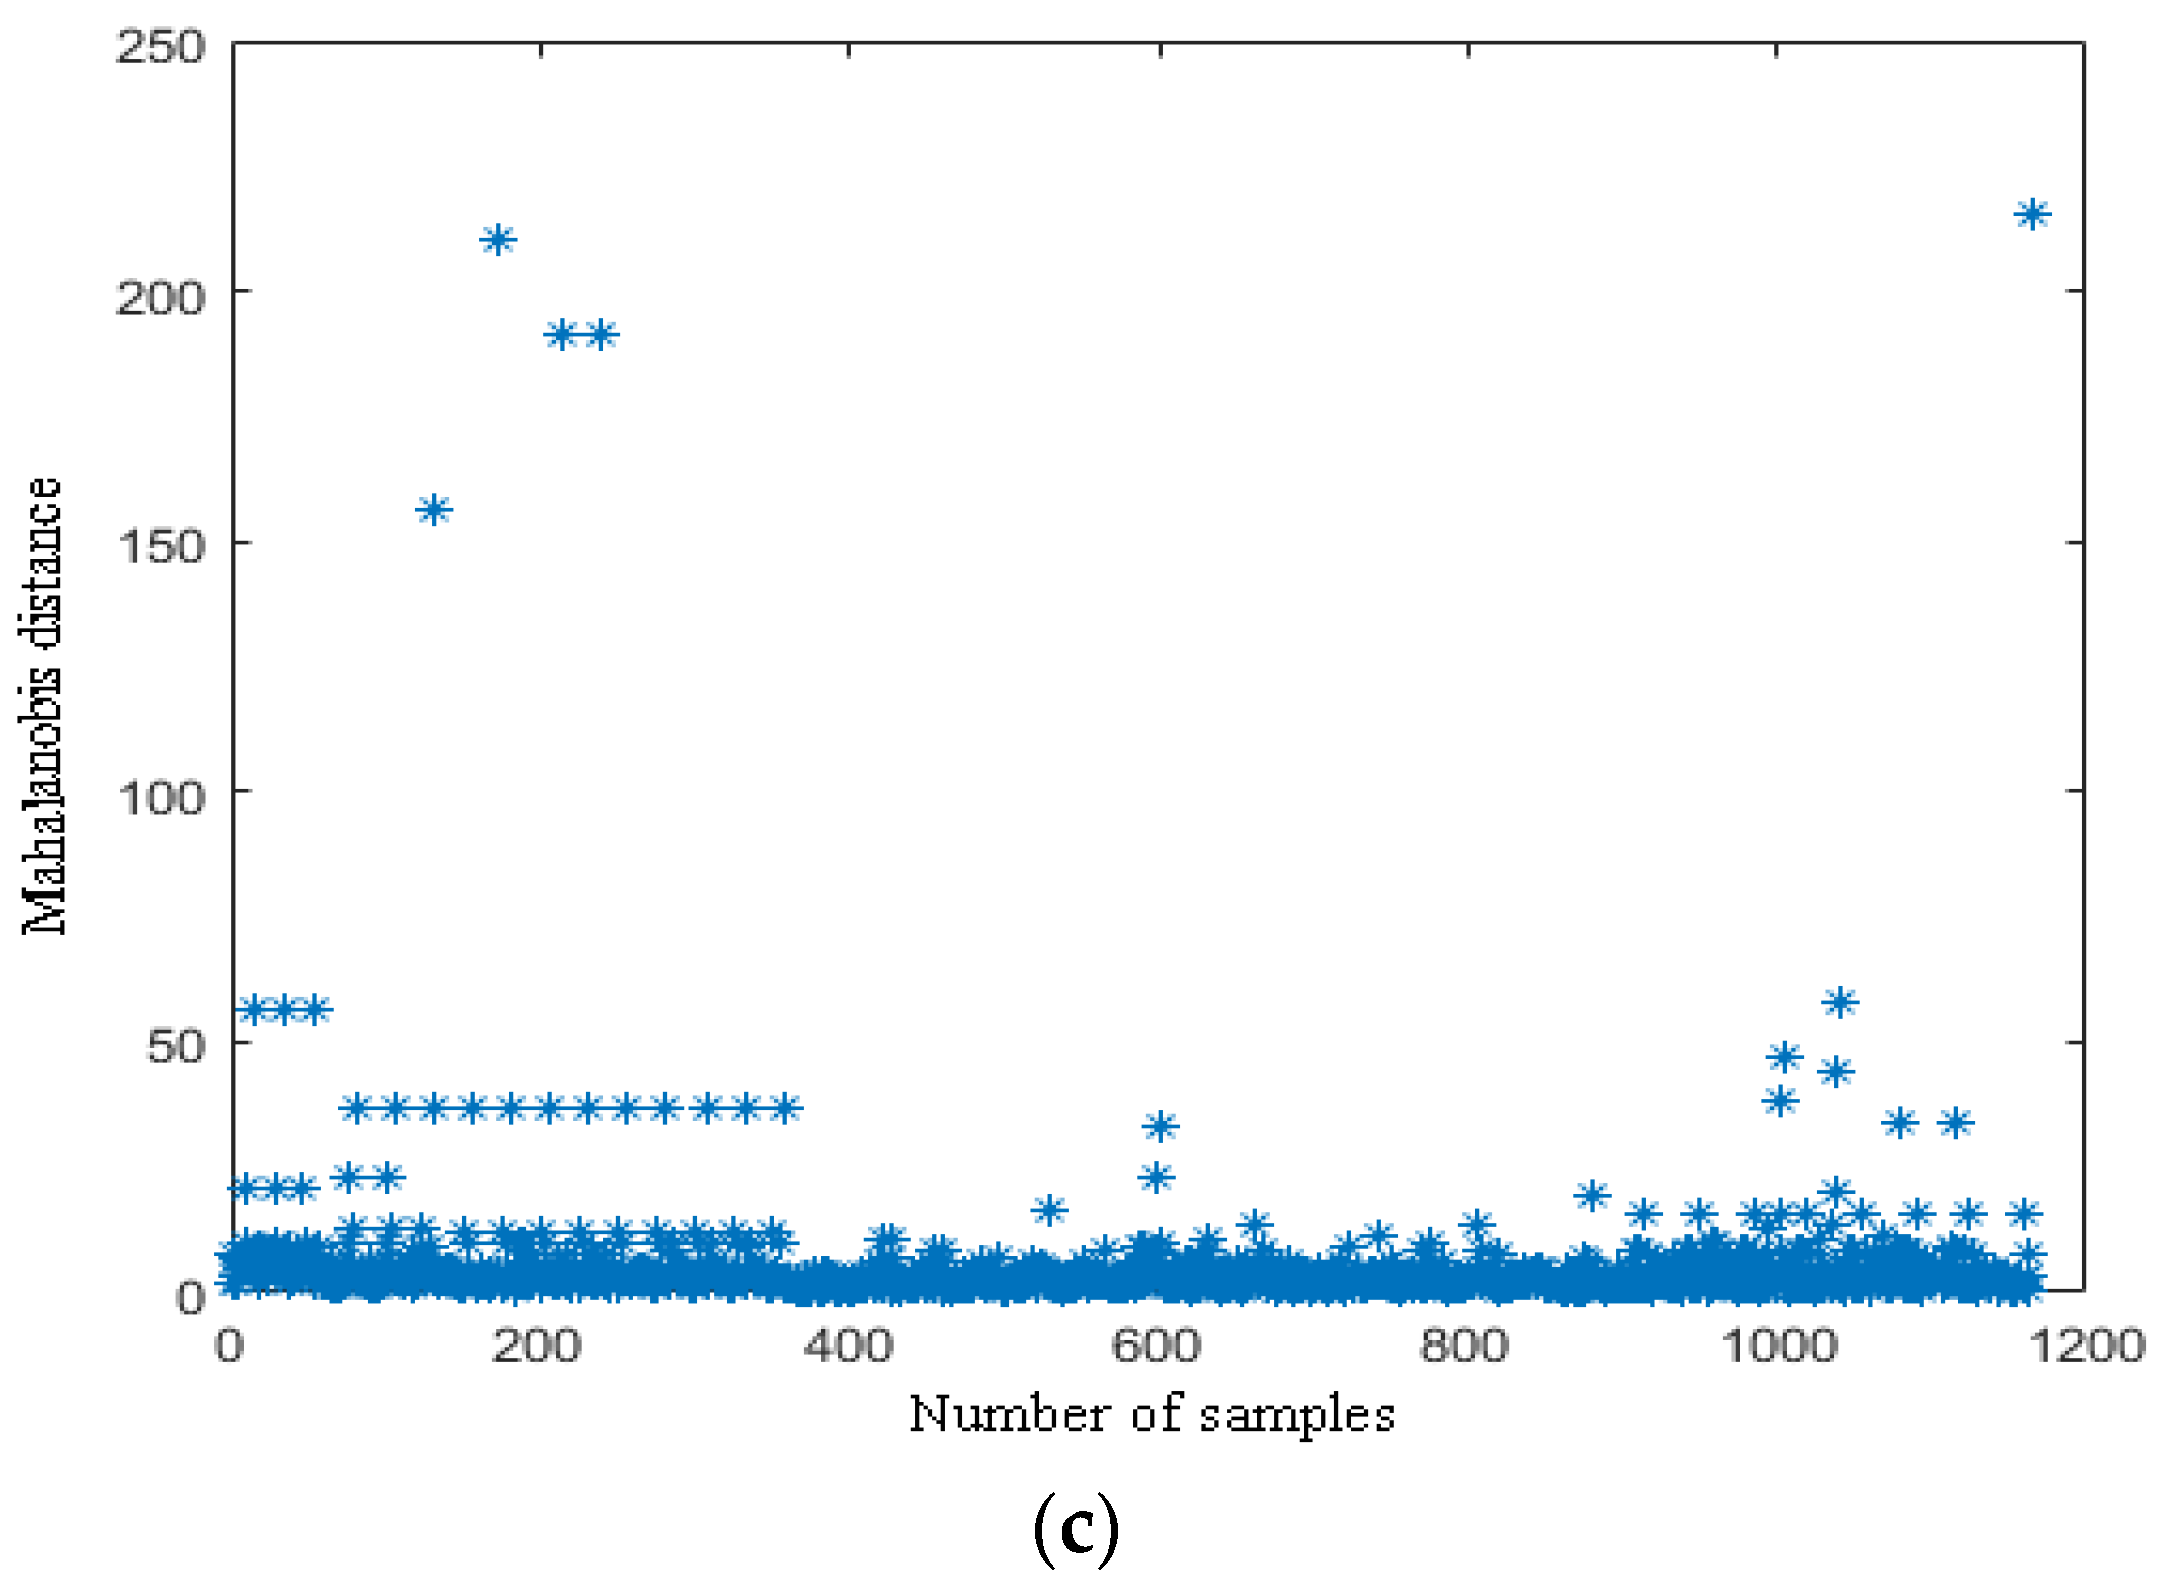
According to the definition of the (MD), there are some good applications for each sample that has several characteristics of different dimensions [23,24,32]. For example, Cheng et al. processed the samples; each sample had different wavelengths, and they eliminated the abnormal samples using the (MD). In this study, each sample has nine components (i.e., R, G, B, H, S, V, L, a, and b). Therefore, the standard deviations of nine components of the three fruits could be comprehensively analyzed and abnormal samples could be eliminated by the (MD). Abnormal samples of the ripe fruit, half-ripe fruit, and unripe fruit were eliminated in Matlab R2010a (MathWorks, Natick, MA, USA). The (MD) distribution points of each sample of the ripe fruit, half-ripe fruit, and unripe fruit are shown in Figure 2.
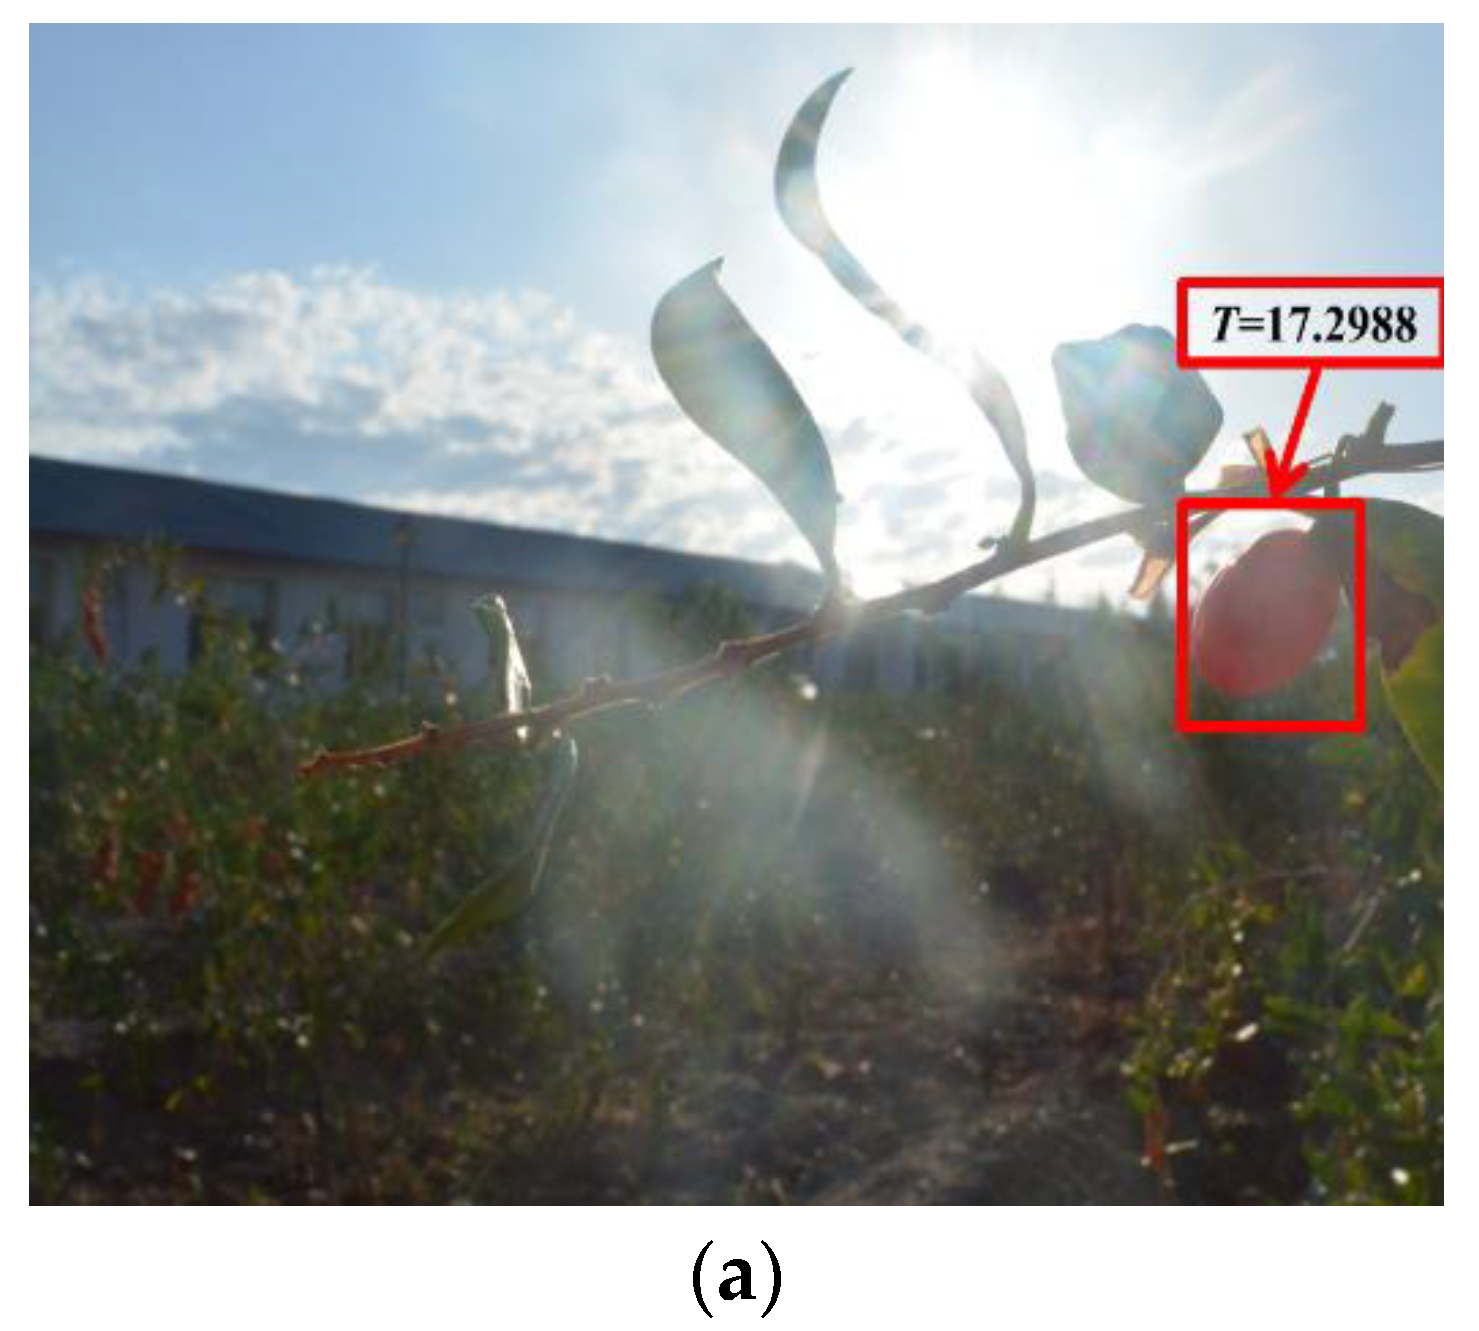
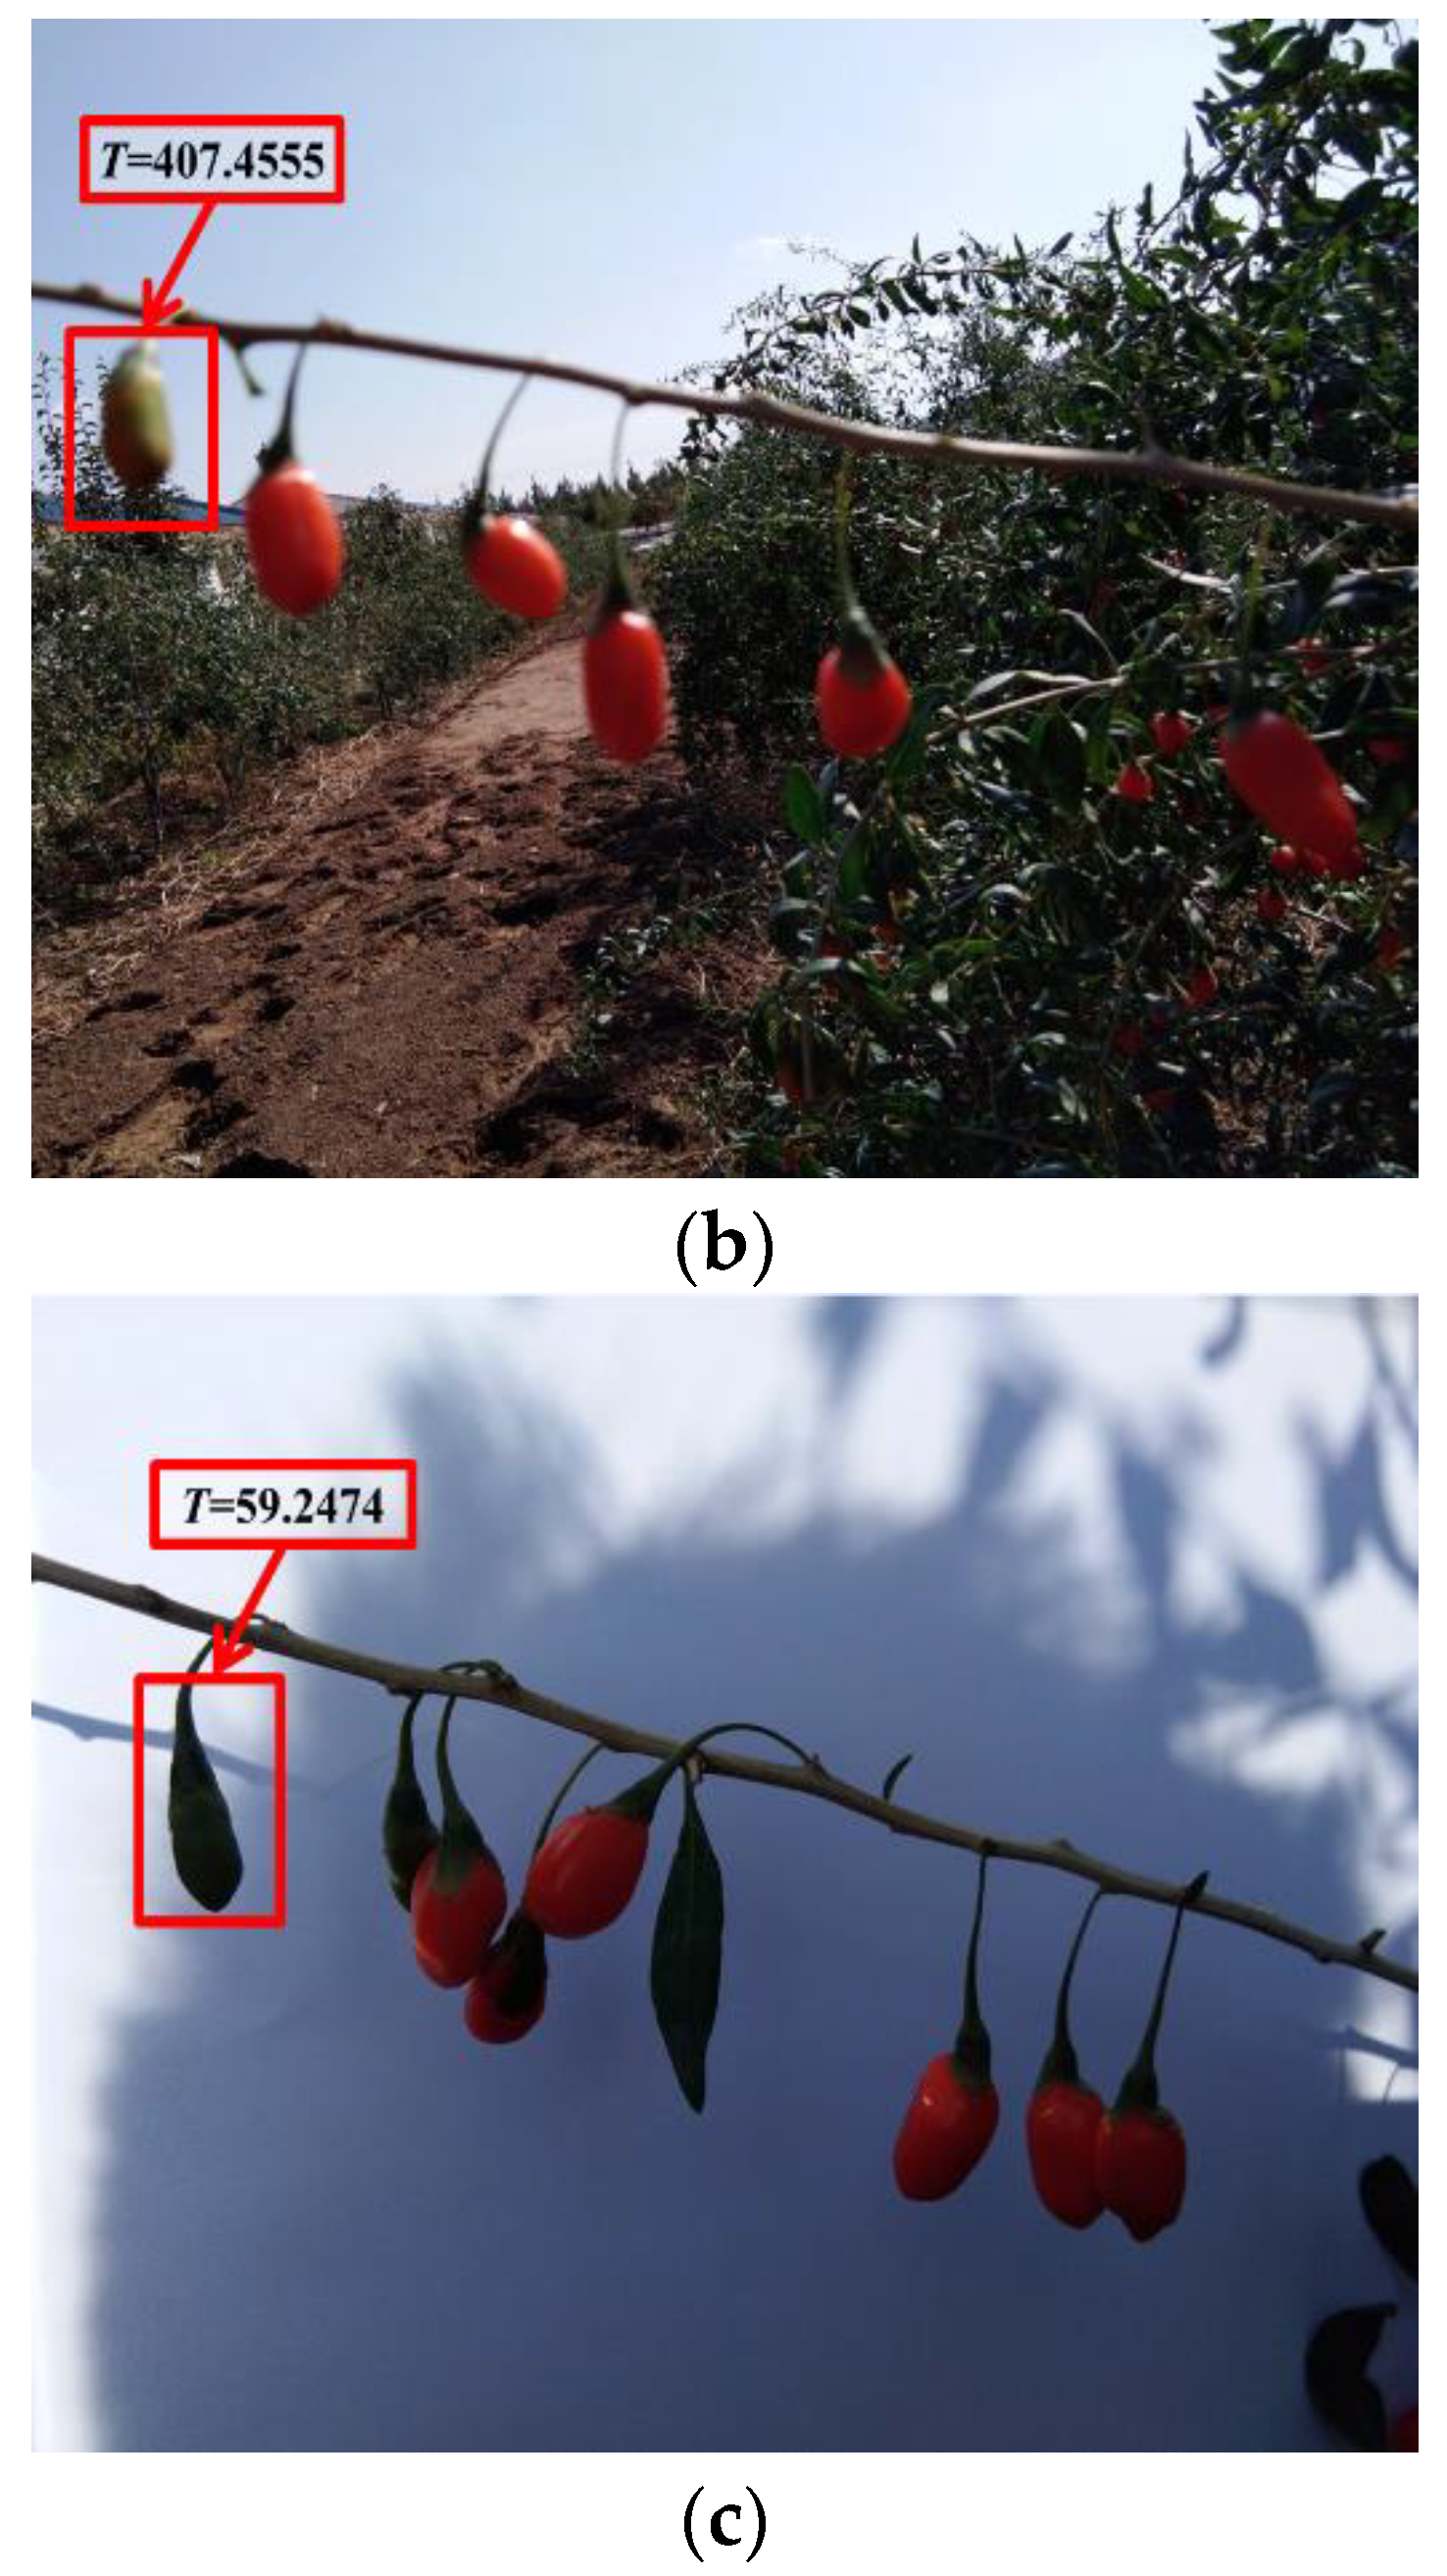
The thresholds of the ripe fruit, half-ripe fruit, and unripe fruit were 14.9441, 57.5544, and 46.4618, respectively. The samples of the ripe fruit, half-ripe fruit, and unripe fruit were eliminated when the T values were more than 14.9441, 57.5544, and 46.4618, respectively. The amounts of eliminated abnormal samples of the ripe fruit, half-ripe fruit, and unripe fruit were 28, 1, and 10, respectively. For example, the eliminated abnormal samples of the three fruit are shown in Figure 3. As shown in Figure 3a, there was one ripe fruit in this figure and the T value of this ripe fruit was 17.2988. The T value of this ripe fruit was more than 14.9441, so that this ripe fruit was an abnormal sample. It was clearly observed that this ripe fruit was not conducive to the subsequent establishment of the model due to the effect of illumination. As shown in Figure 3b, the fruit on the far left was the half-ripe fruit in this figure and the T value of this half-ripe fruit was 407.4555. The T value of this half-ripe fruit was more than 57.5544, so that this half-ripe fruit was an abnormal sample. It was clearly observed that this half-ripe fruit was not conducive to the subsequent establishment of the model due to the fuzziness. As shown in Figure 3c, the fruit on the far left was the unripe fruit in this figure and the T value of this unripe fruit was 59.2474. The T value of this unripe fruit was more than 46.4618, so that this unripe fruit was an abnormal sample. It was clearly observed that this unripe fruit was not conducive to the subsequent establishment of the model due to the effect of shadow. Therefore, the amounts of the ripe fruit, half-ripe fruit, and unripe fruit used to establish the model were 1800, 555, and 1154, respectively.
2.3. Extraction of Nine Components
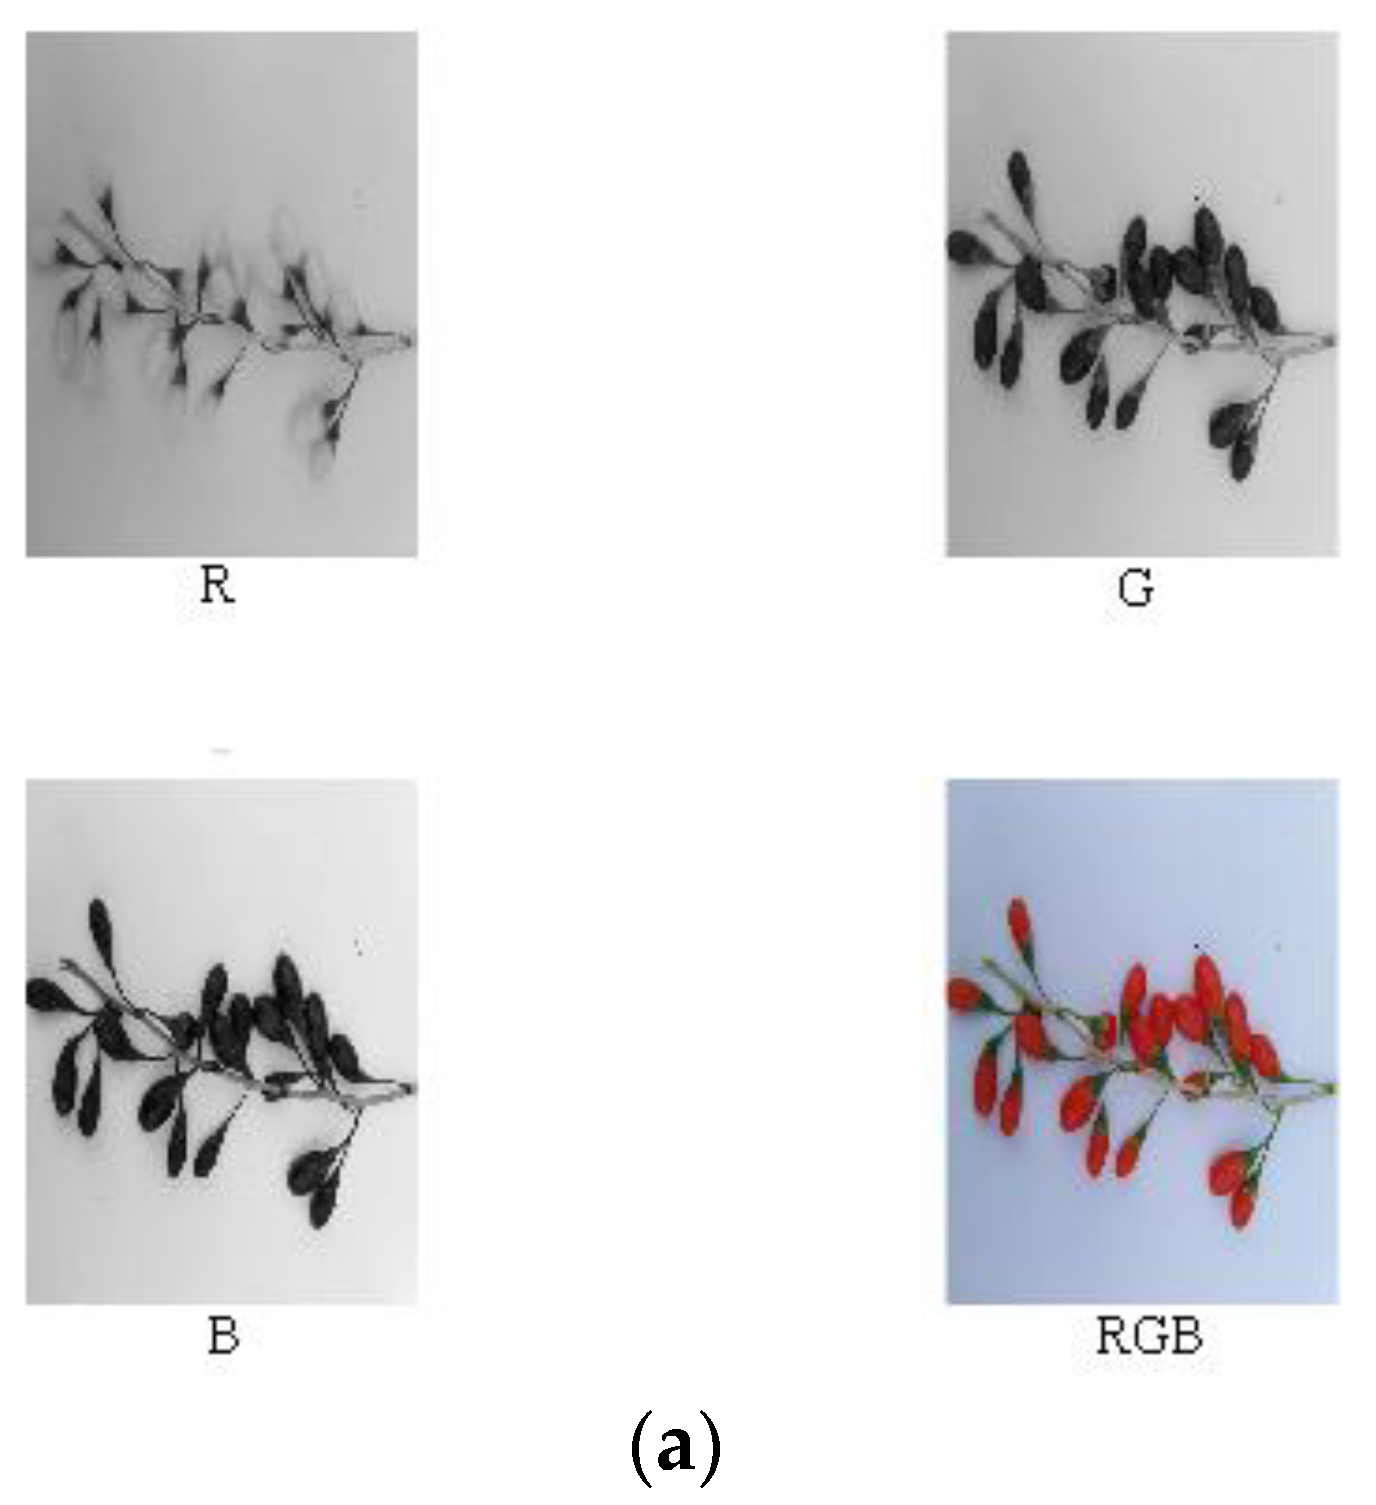
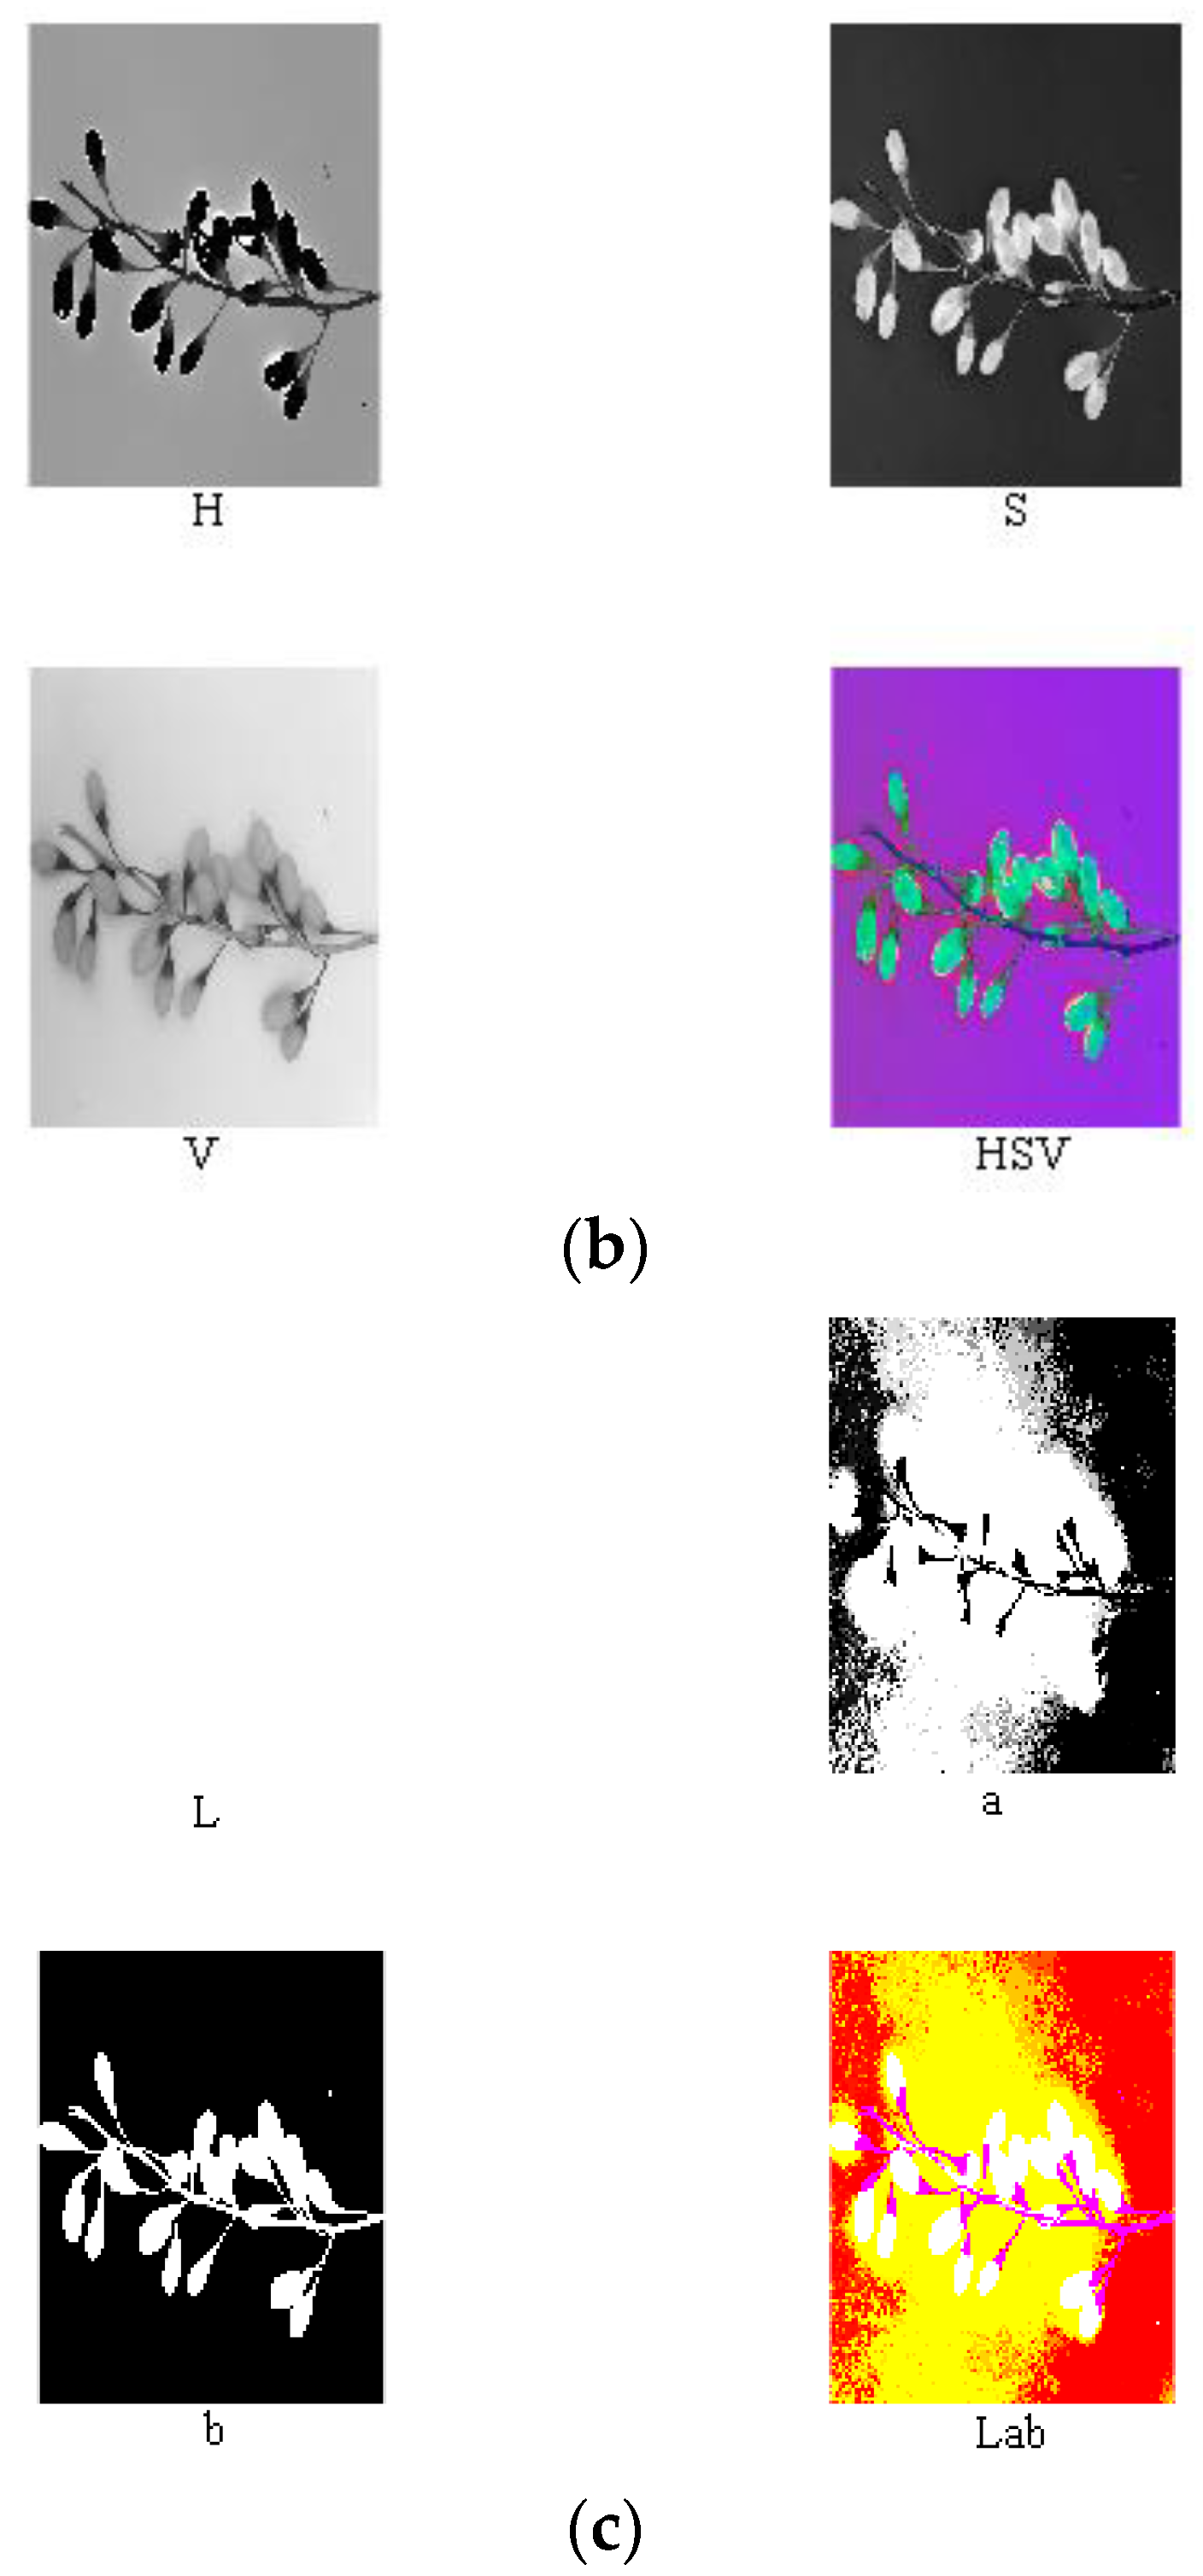
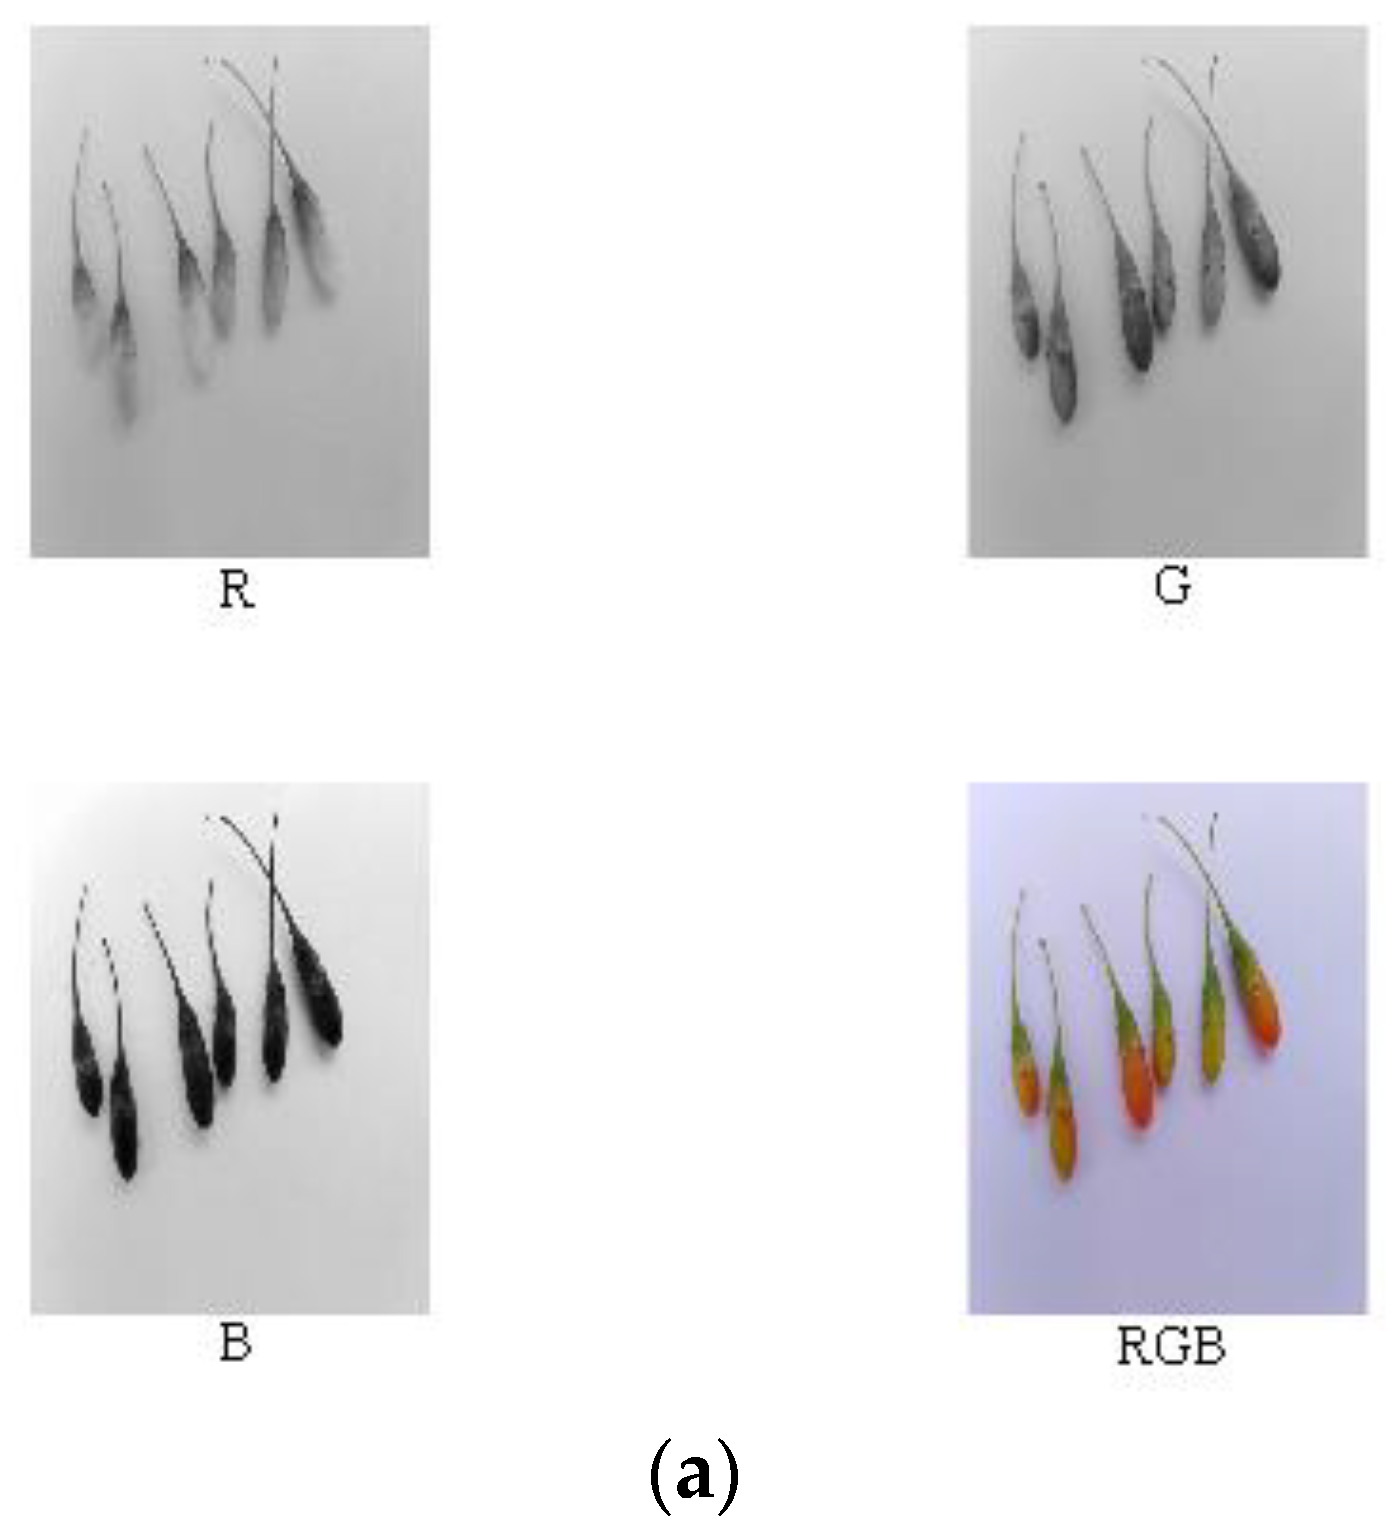
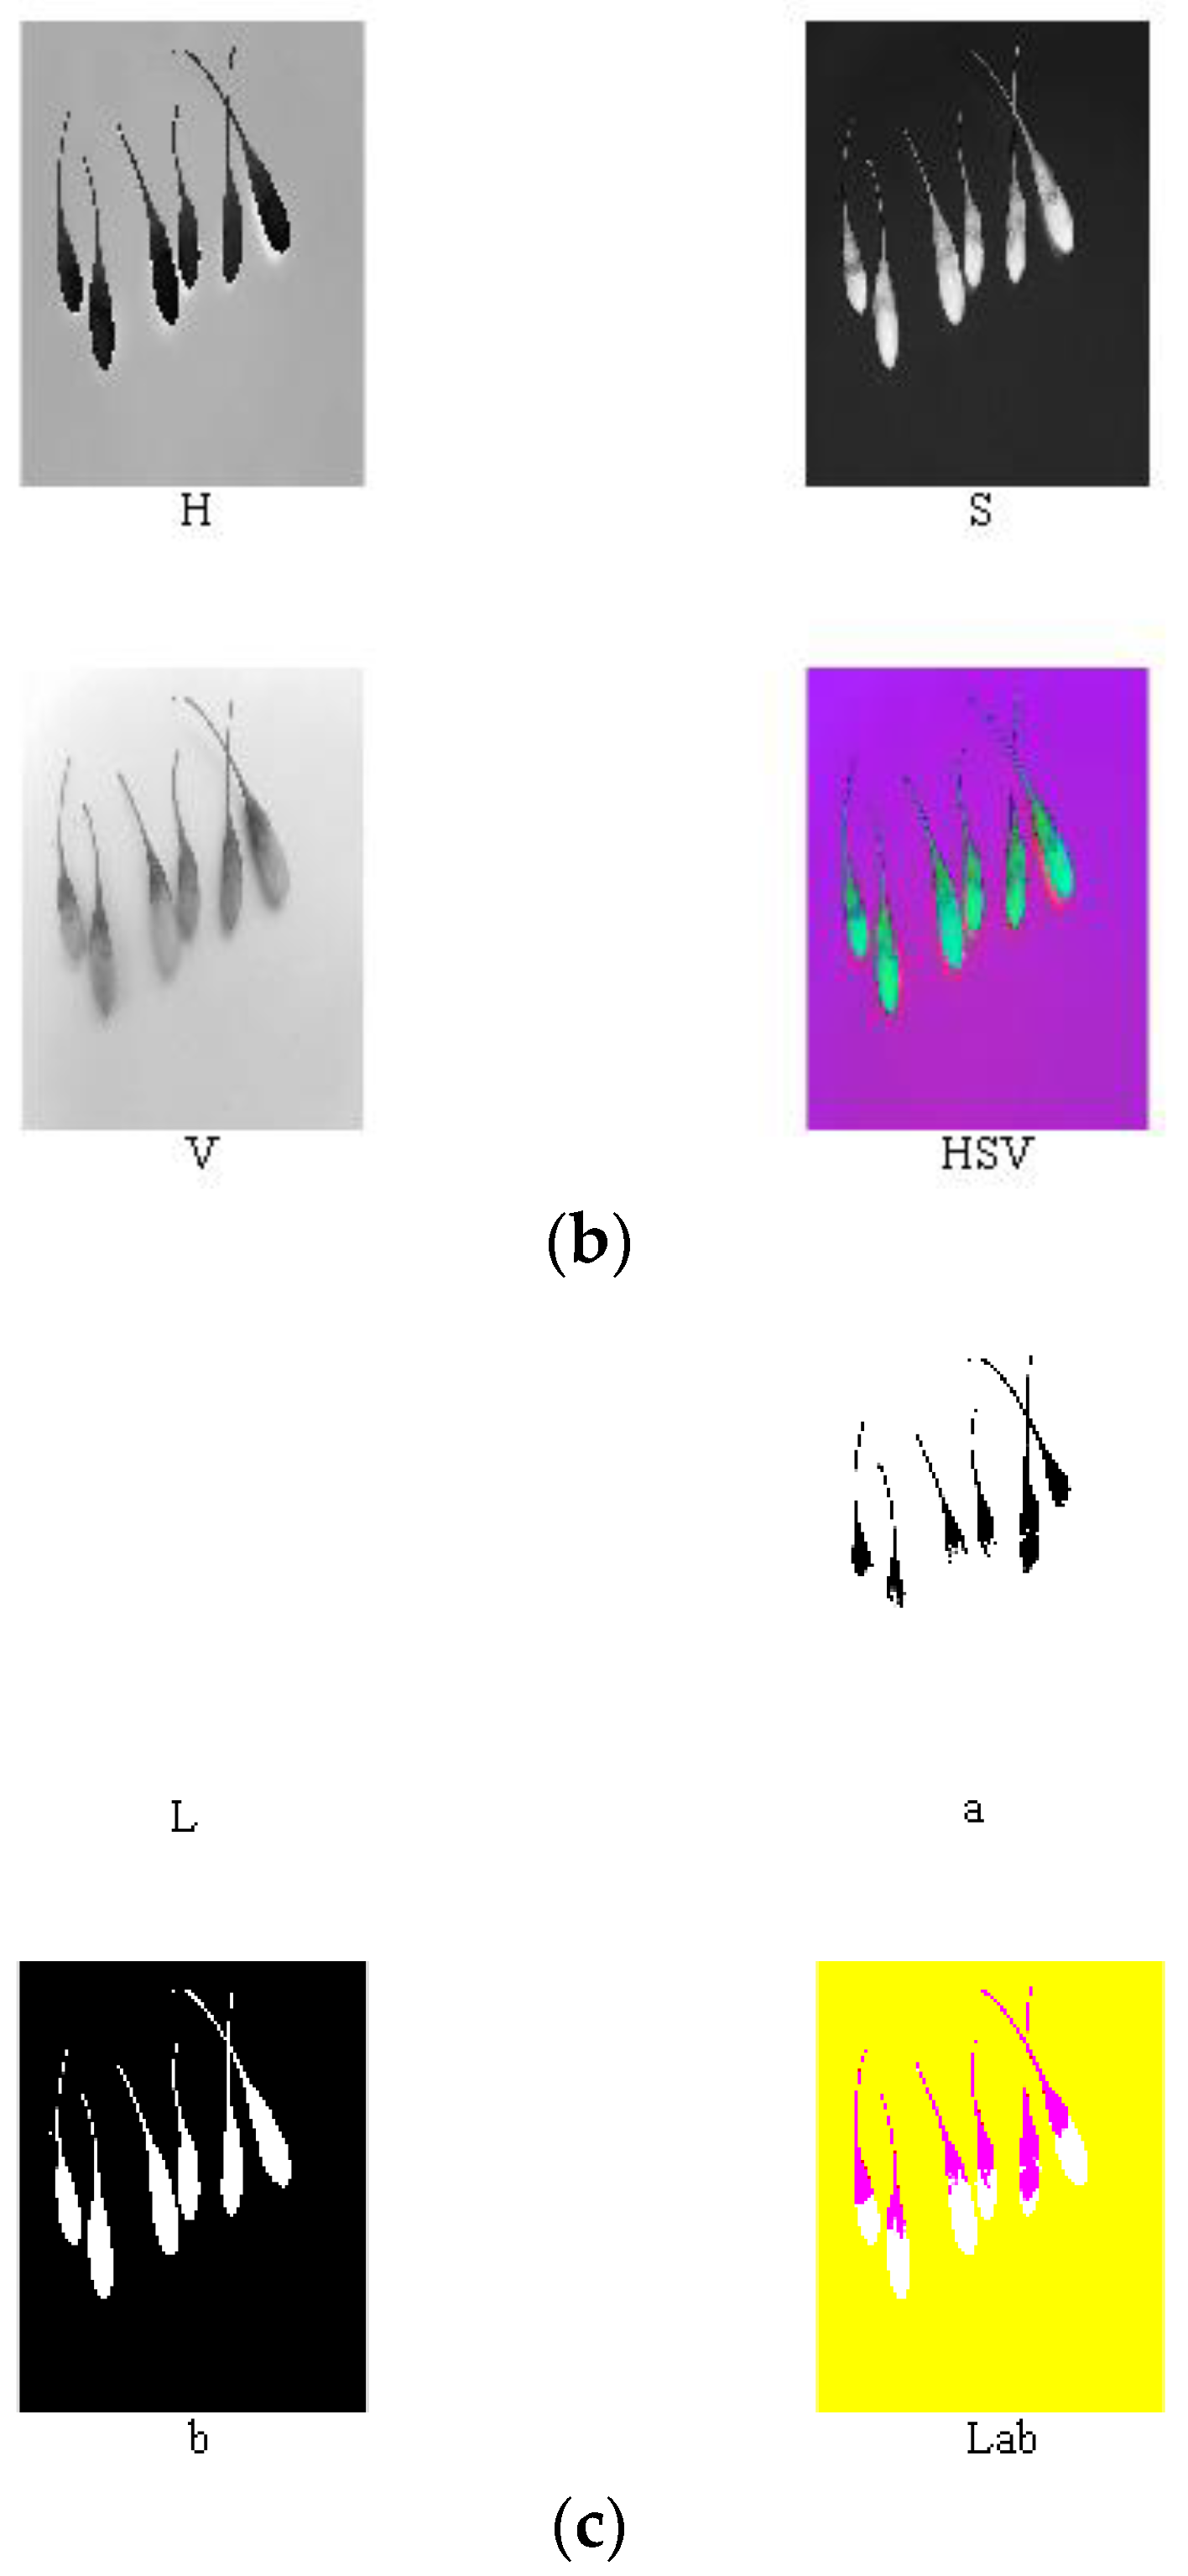
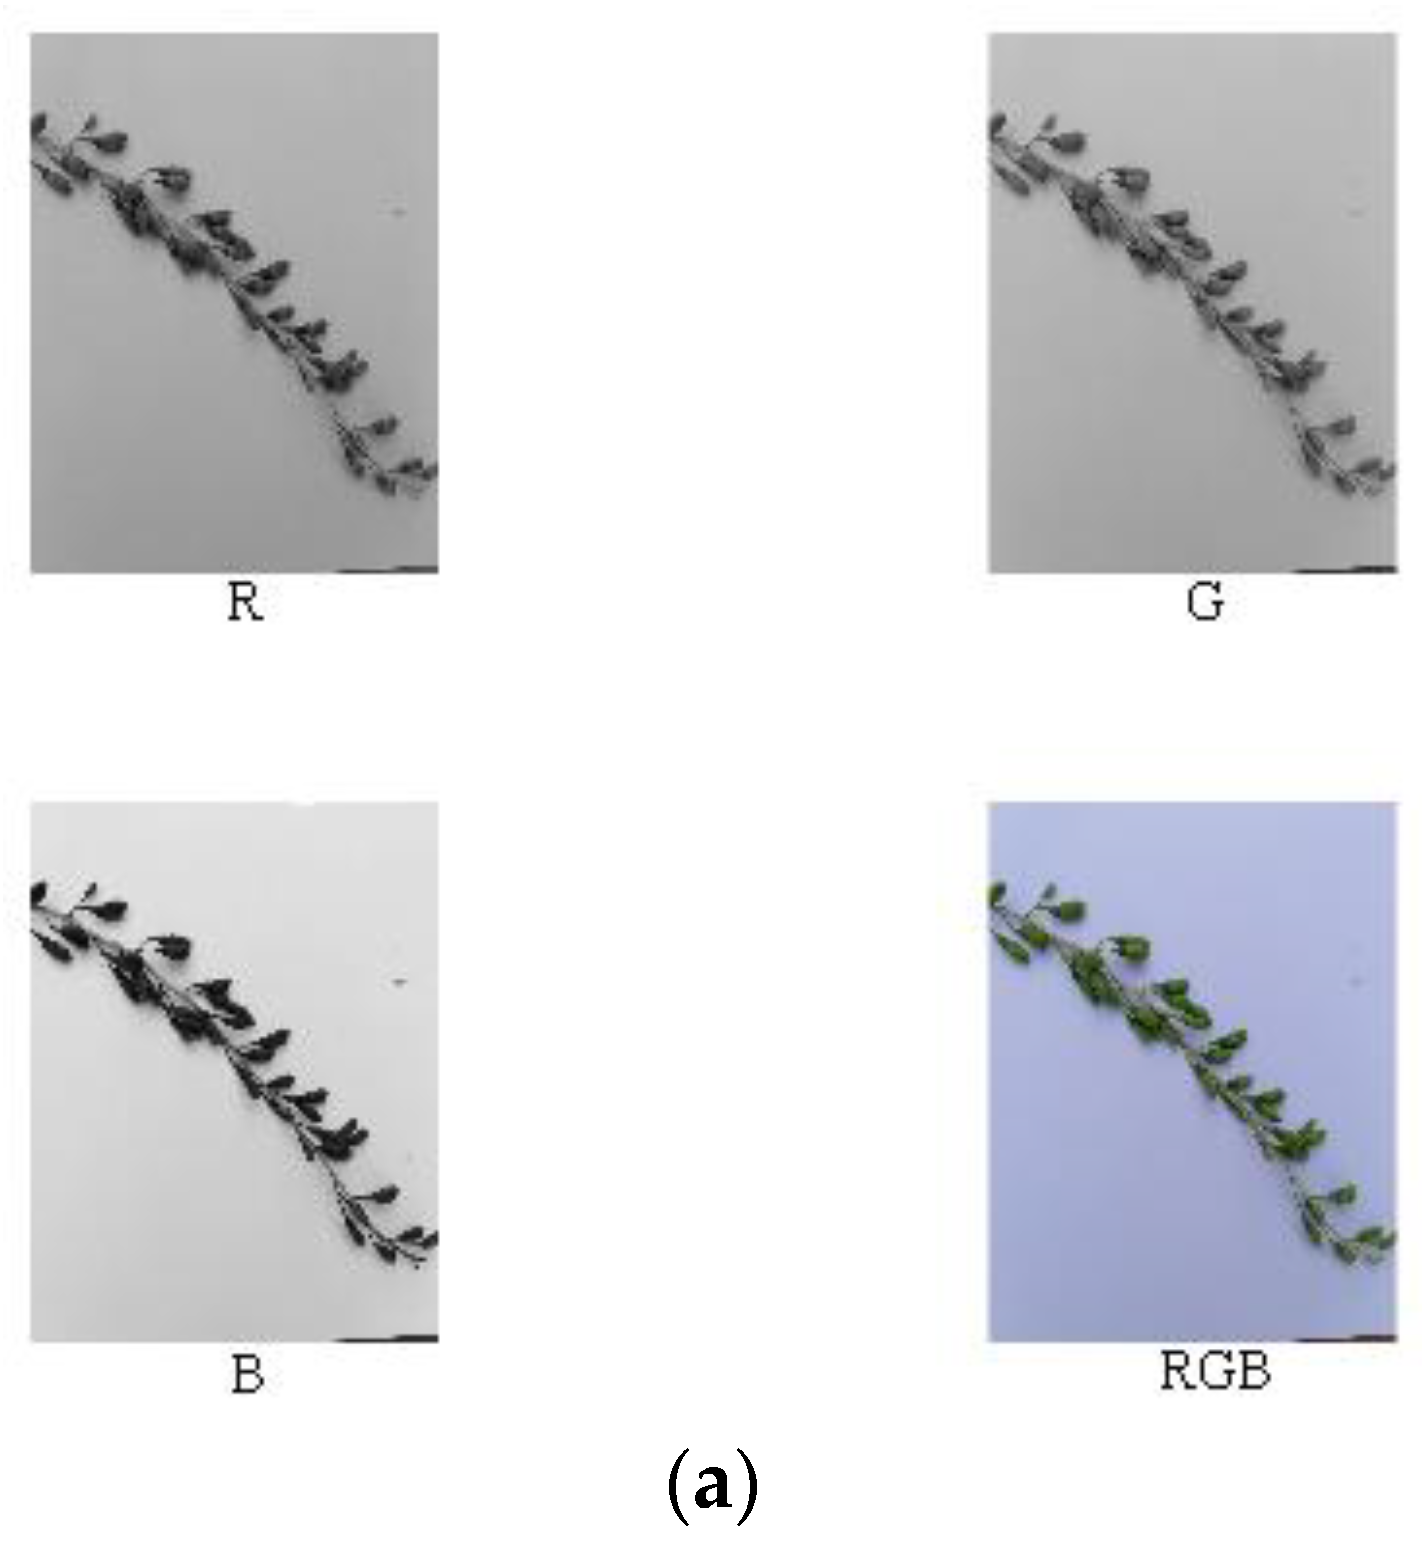
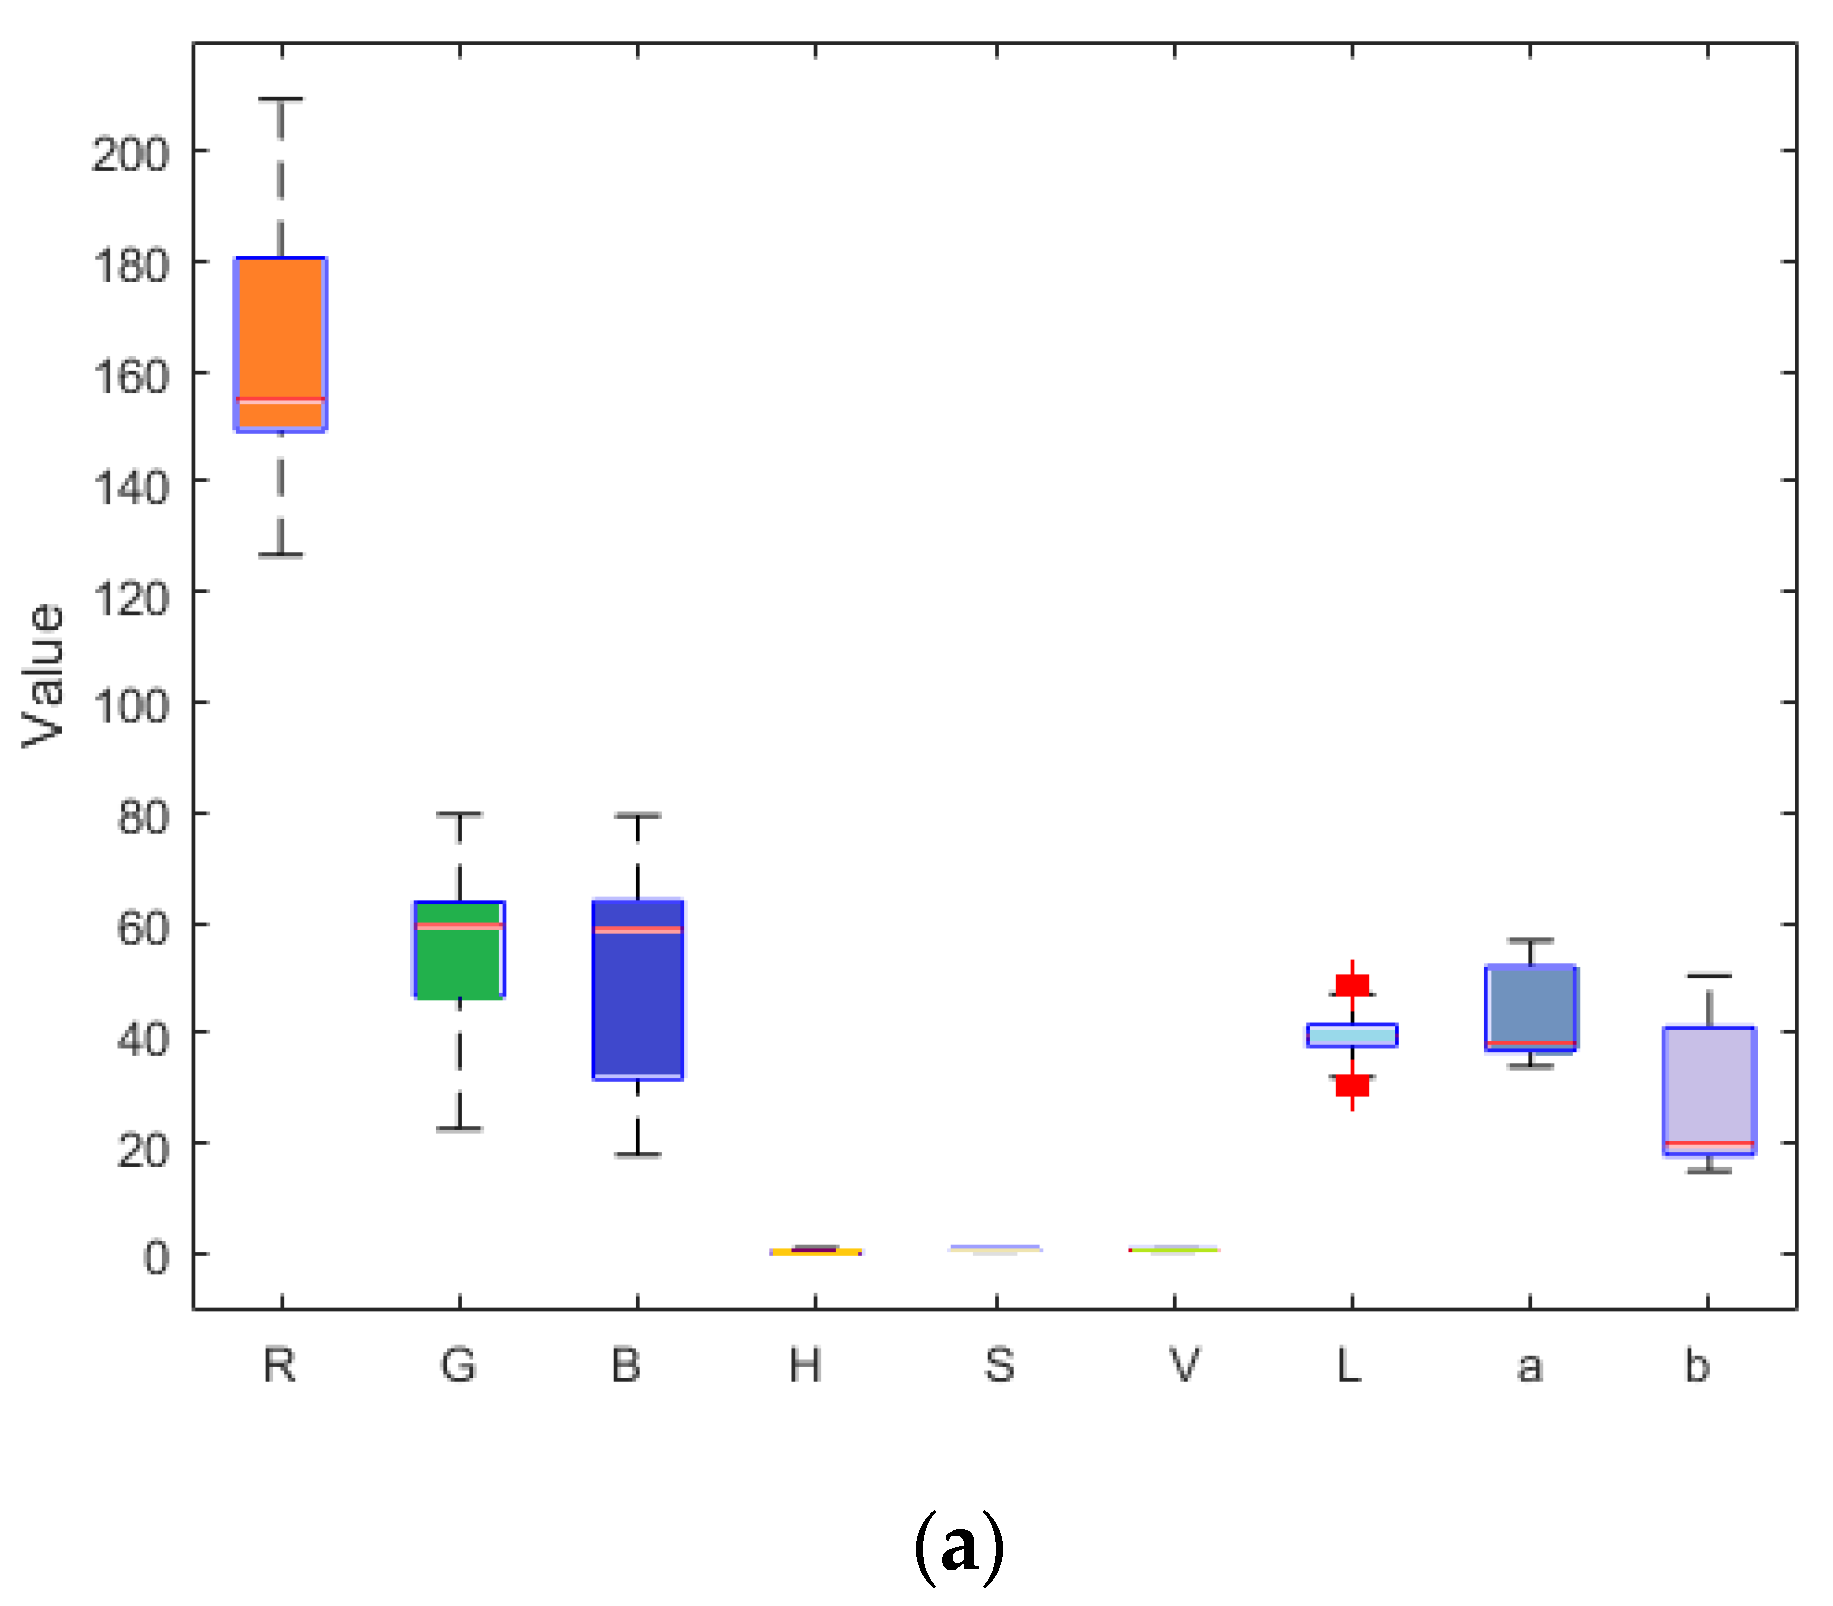
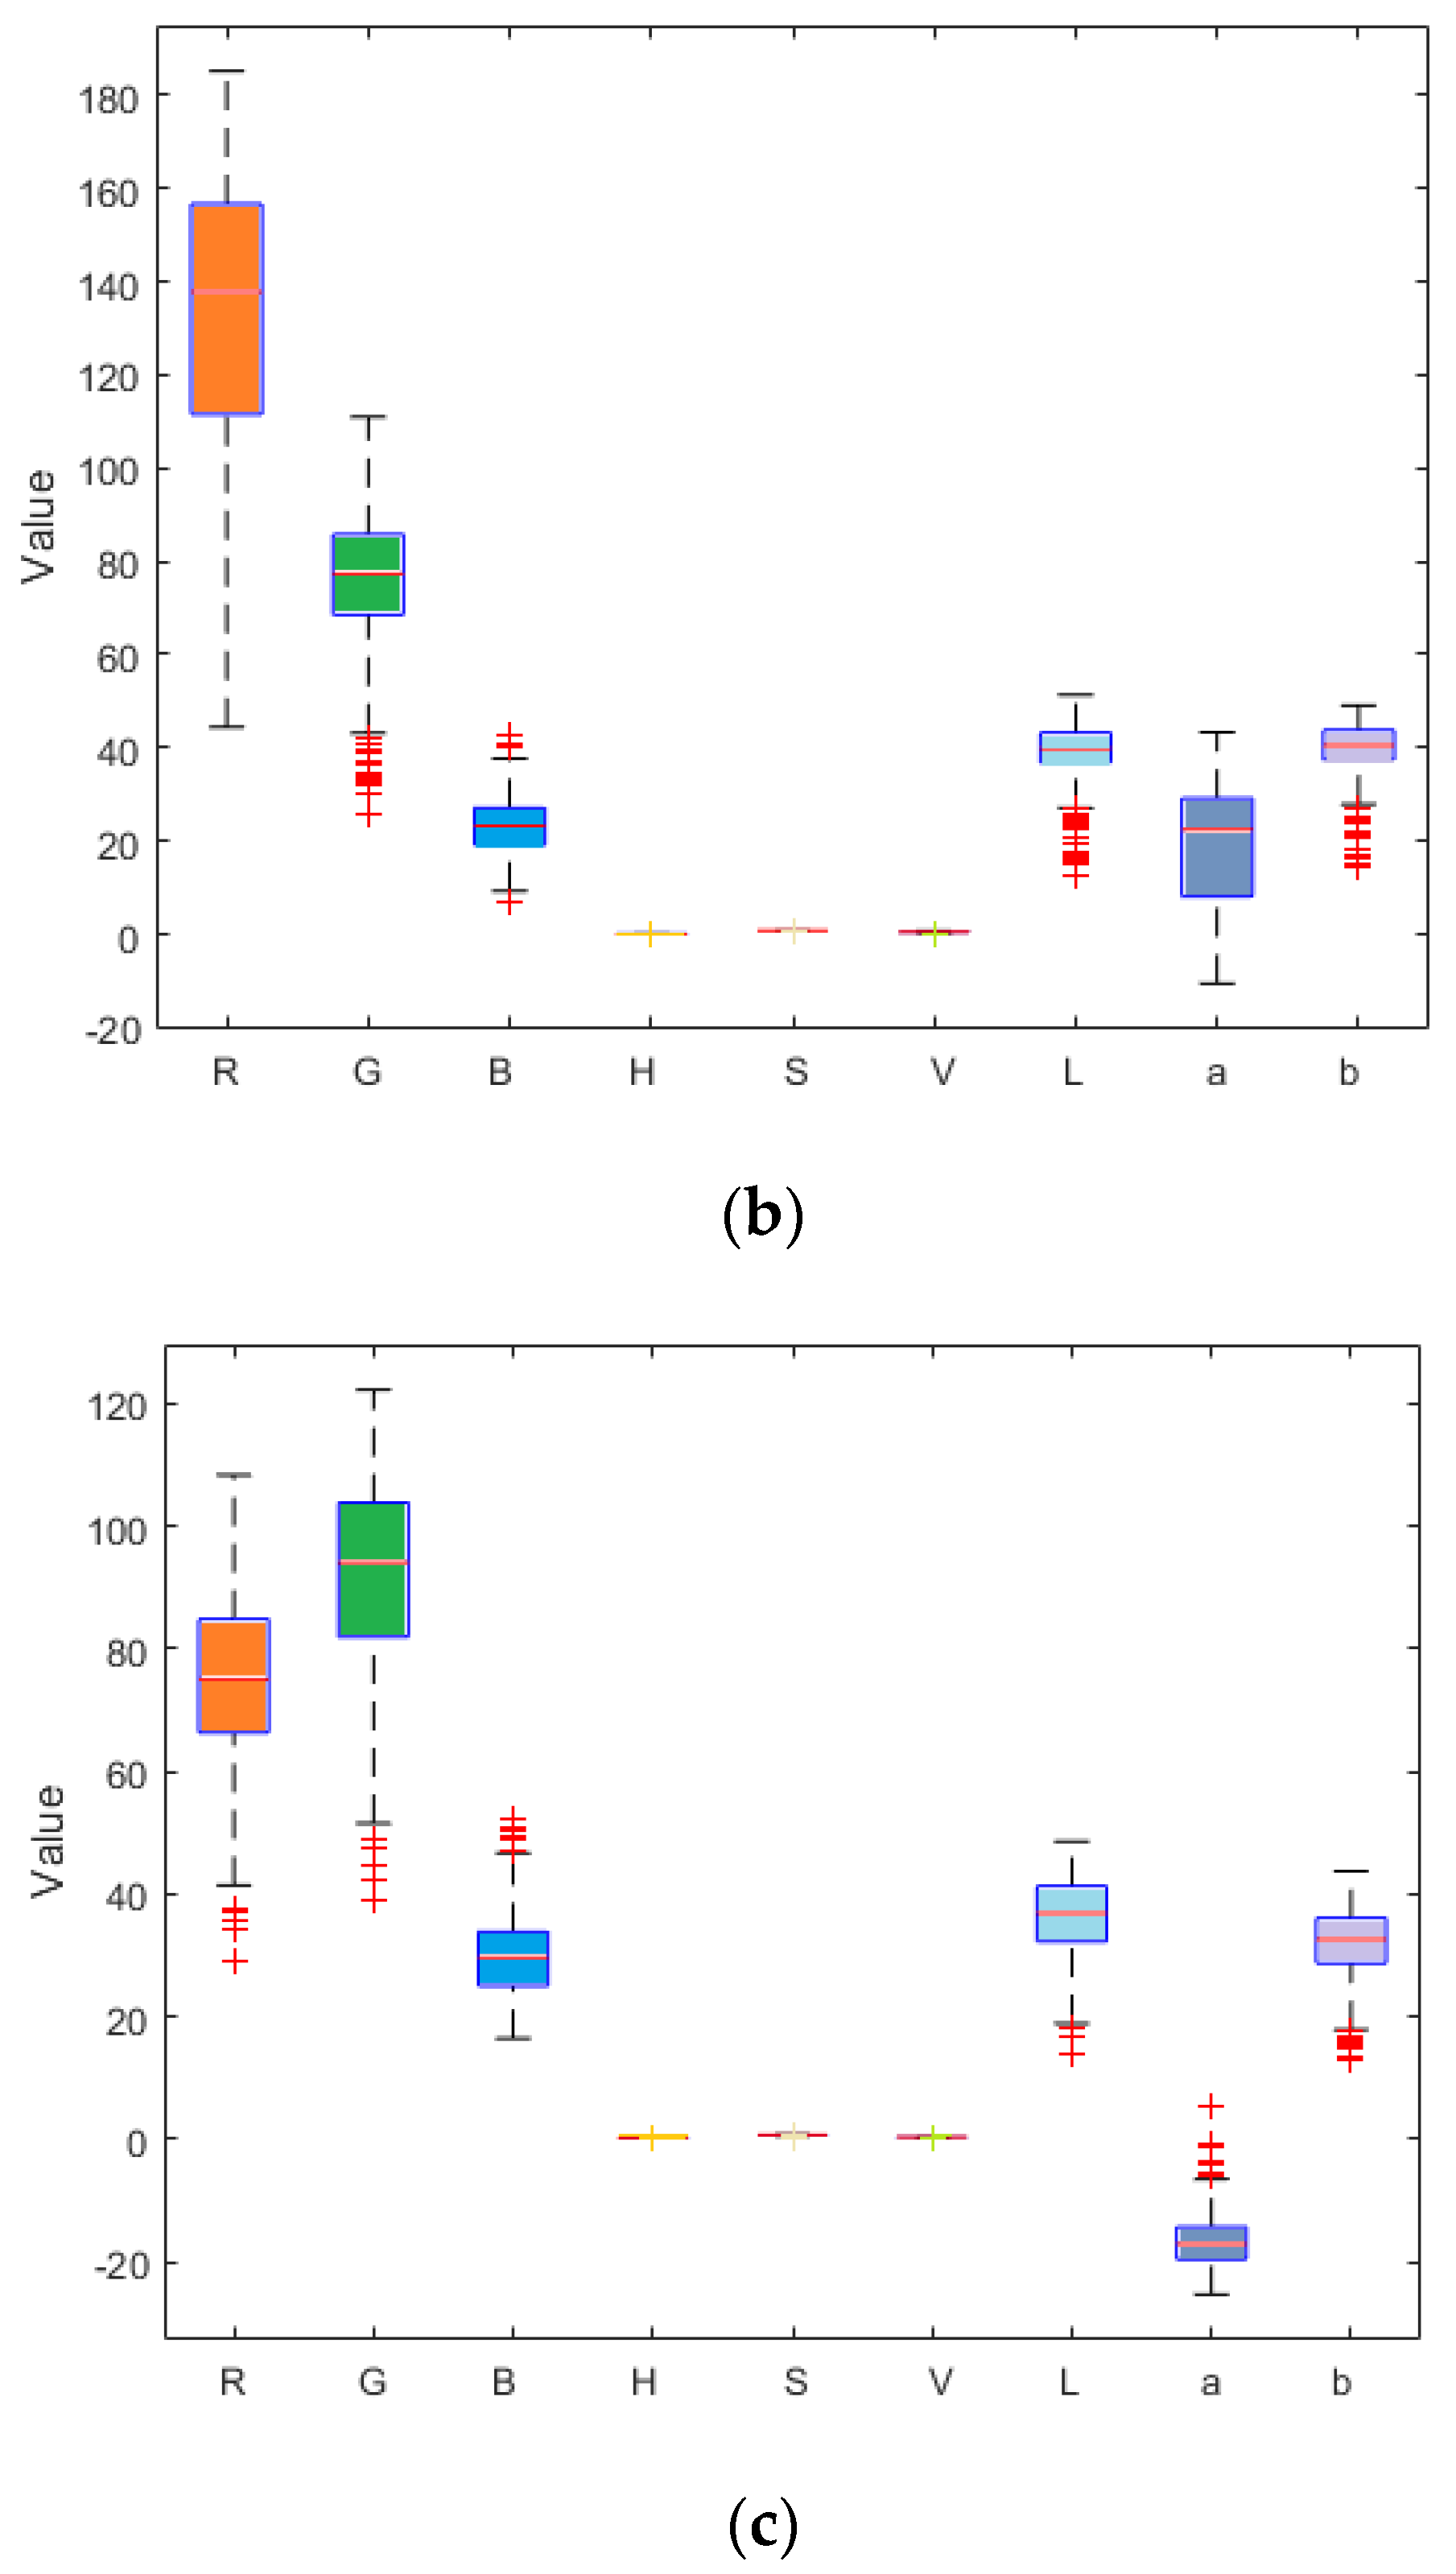
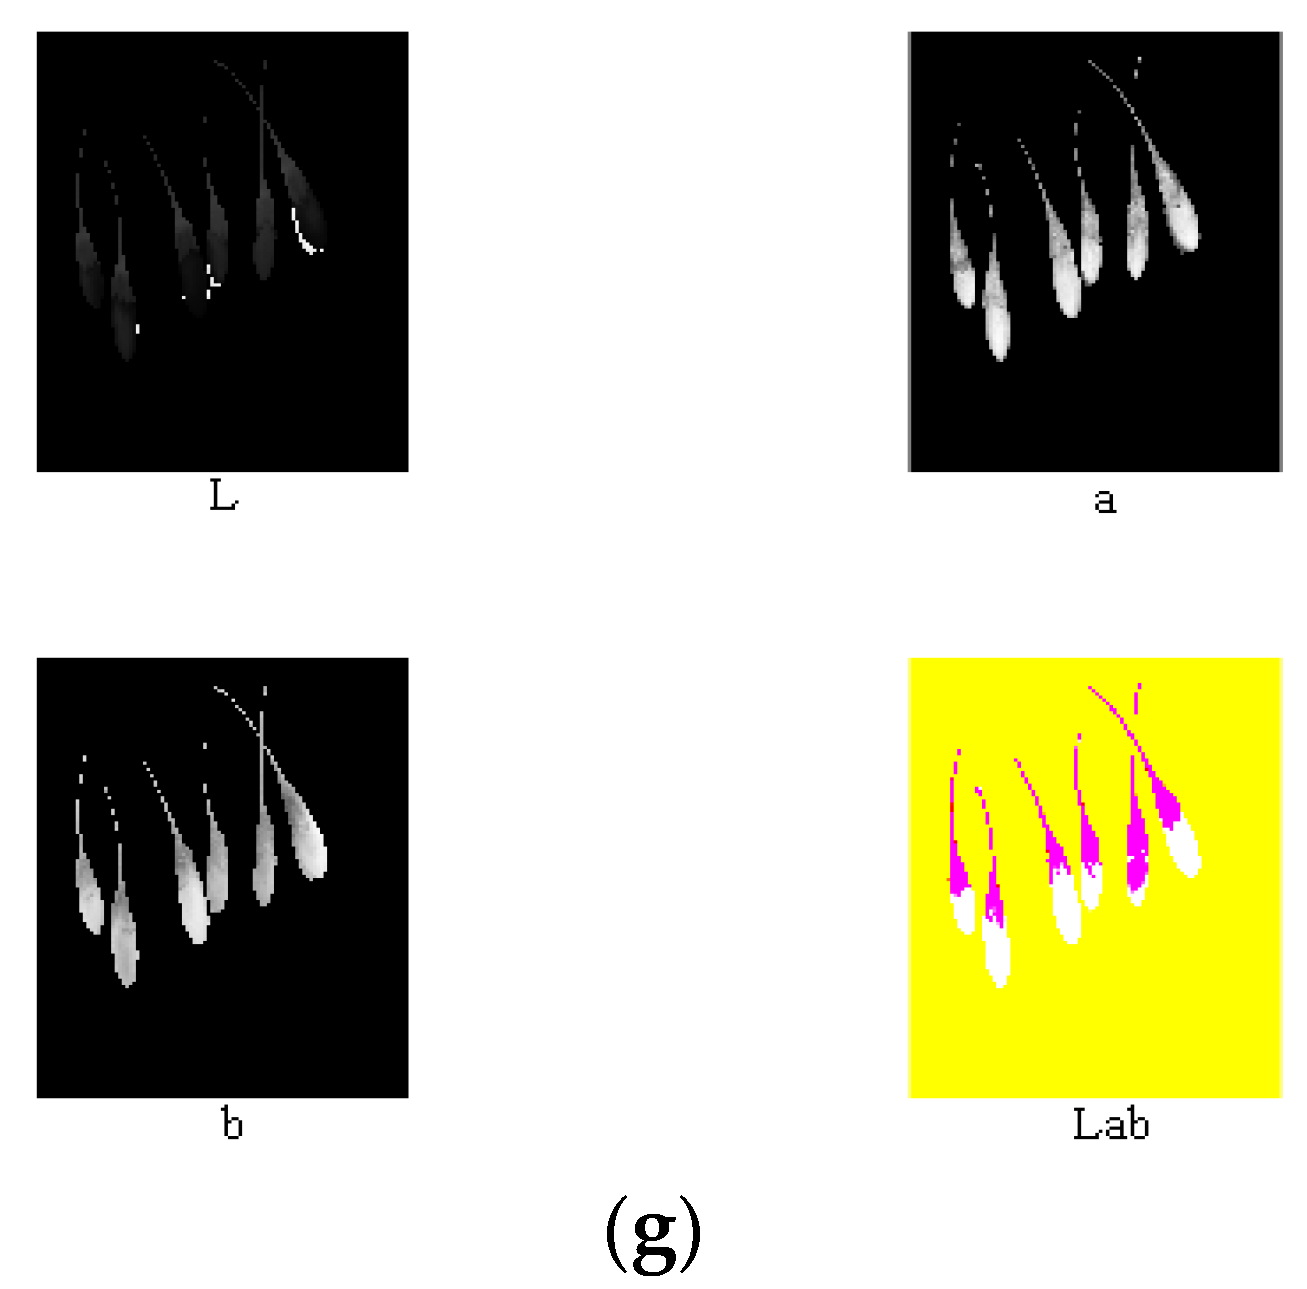
Reference review indicated that RGB, HSV, Lab, and other color models are currently widely used in color systems [17,22,27,28,31]. Nine components (i.e., R, G, B, H, S, V, L, a, and b) of the ripe fruit, half-ripe fruit, and unripe fruit were extracted in Matlab R2010a, as shown in Figure 4, Figure 5 and Figure 6. The mean values of R, G, B, H, S, V, L, a, and b of the ripe fruit, half-ripe fruit, and unripe fruit were 162.8945, 55.0421, 49.1244, 0.3415, 0.7009, 0.6488, 39.5295, 43.5344, and 28.1019; 132.8254, 75.5312, 23.4402, 0.0959, 0.8195, 0.5235, 38.6451, 19.3835, and 38.9981; and 75.5590, 92.7886, 30.0260, 0.2127, 0.6850, 0.3674, 36.6010, 16.7032, and 32.2754. Figure 7 shows the box plots of numerical values of nine components of fruit.
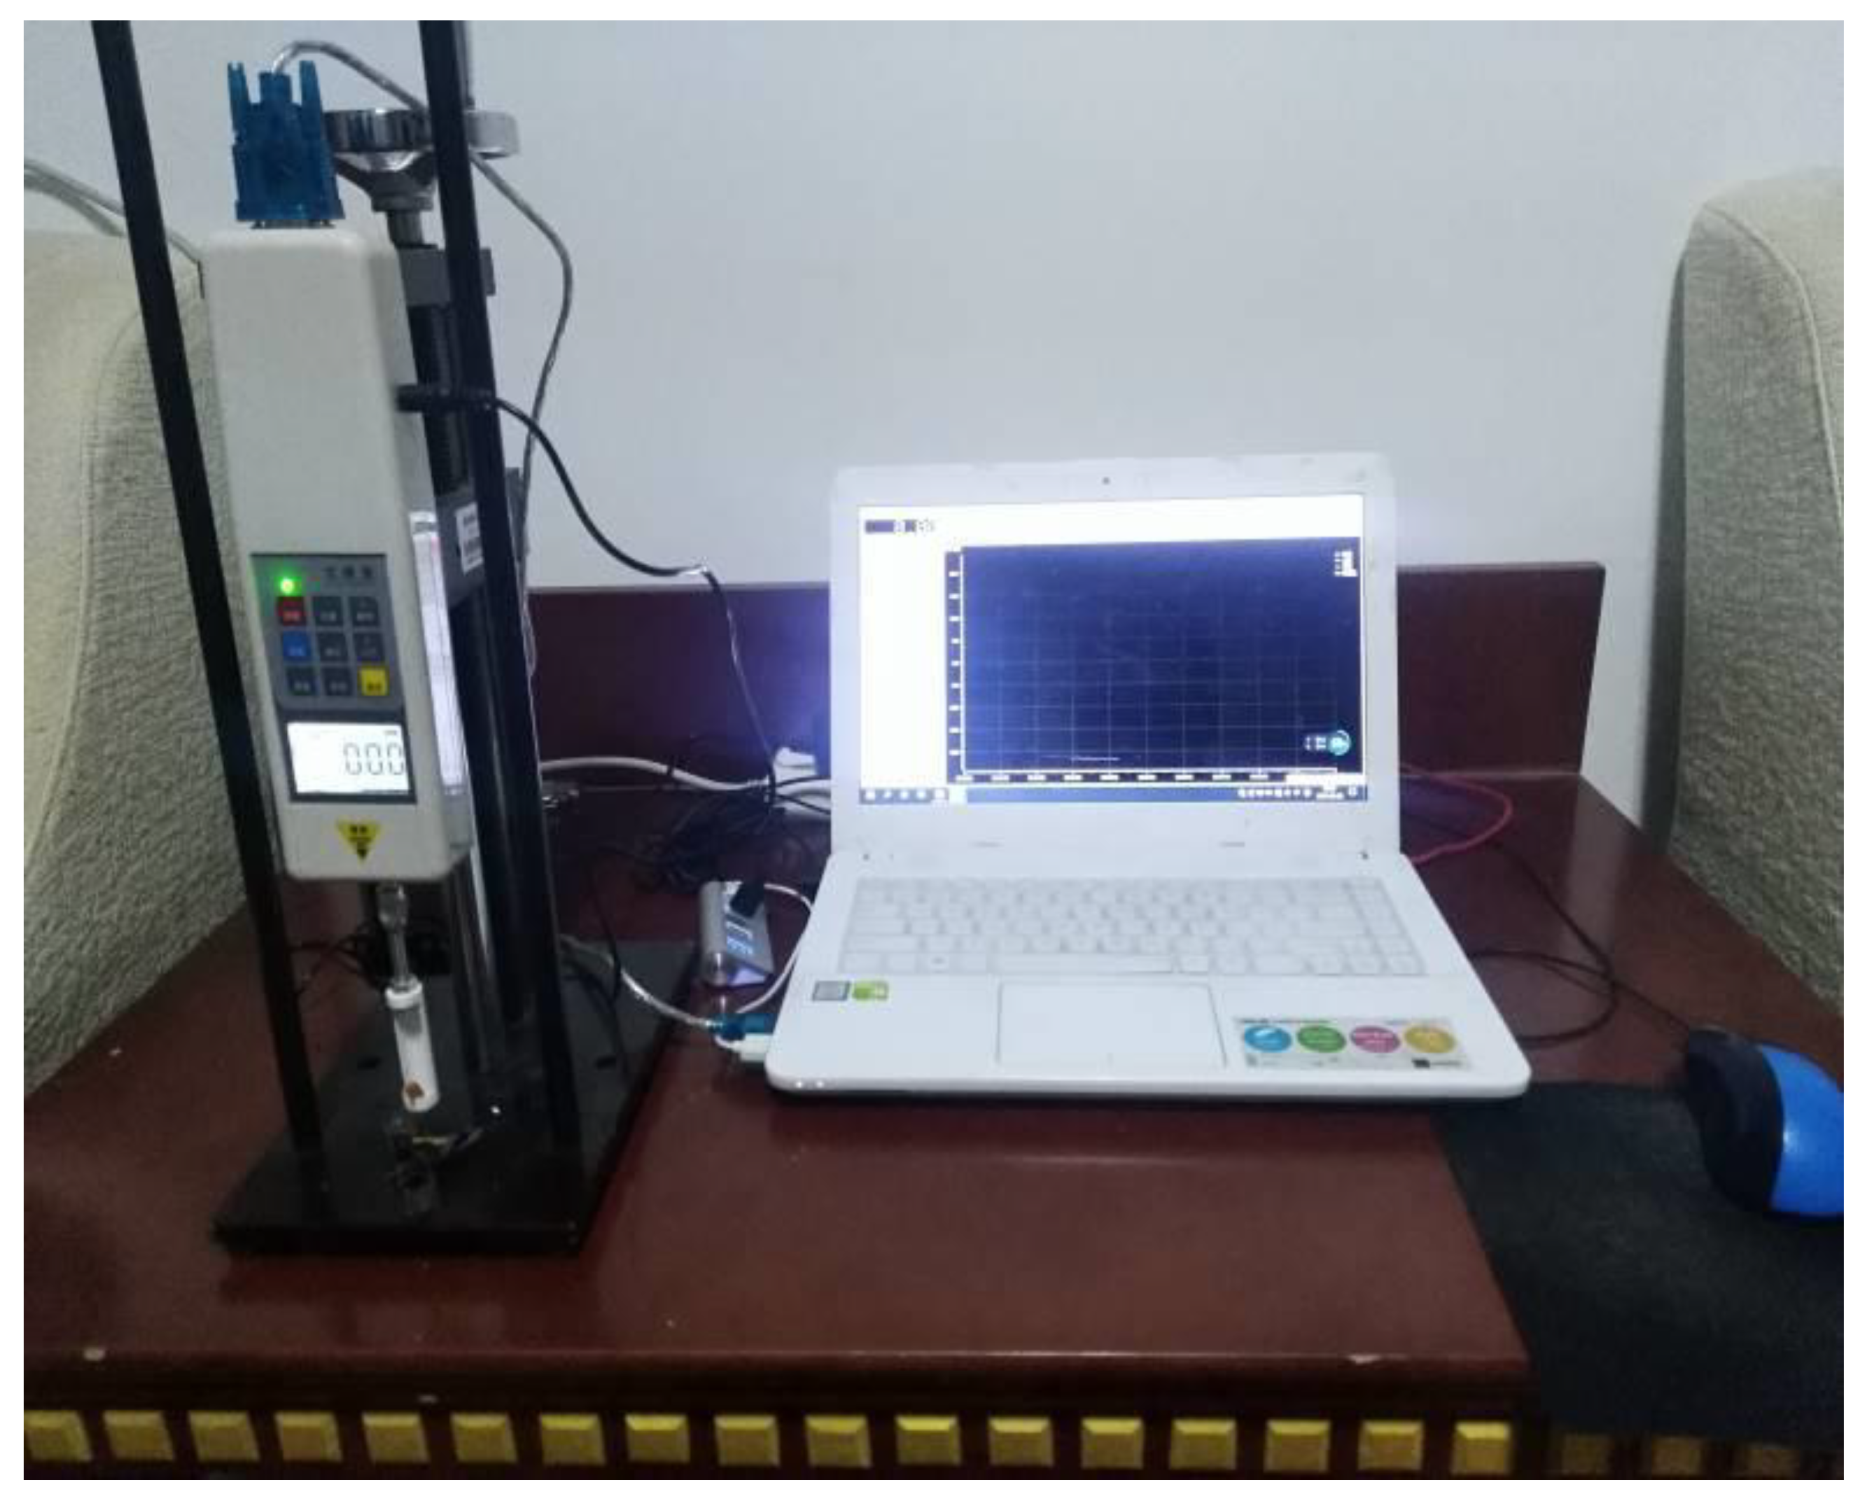
Based on the above results, the accurate quantitative maturity detection model of fruit could be established. To verify and compare the relationship between the prediction results of the model and the picking forces of fruit, the picking forces should be measured. The picking forces were measured by a digital display tensile force meter (range: 30 N, accuracy: 0.01 N), and the measuring device of picking forces is shown in Figure 8.
3. Results and Discussion
3.1. Image Processing
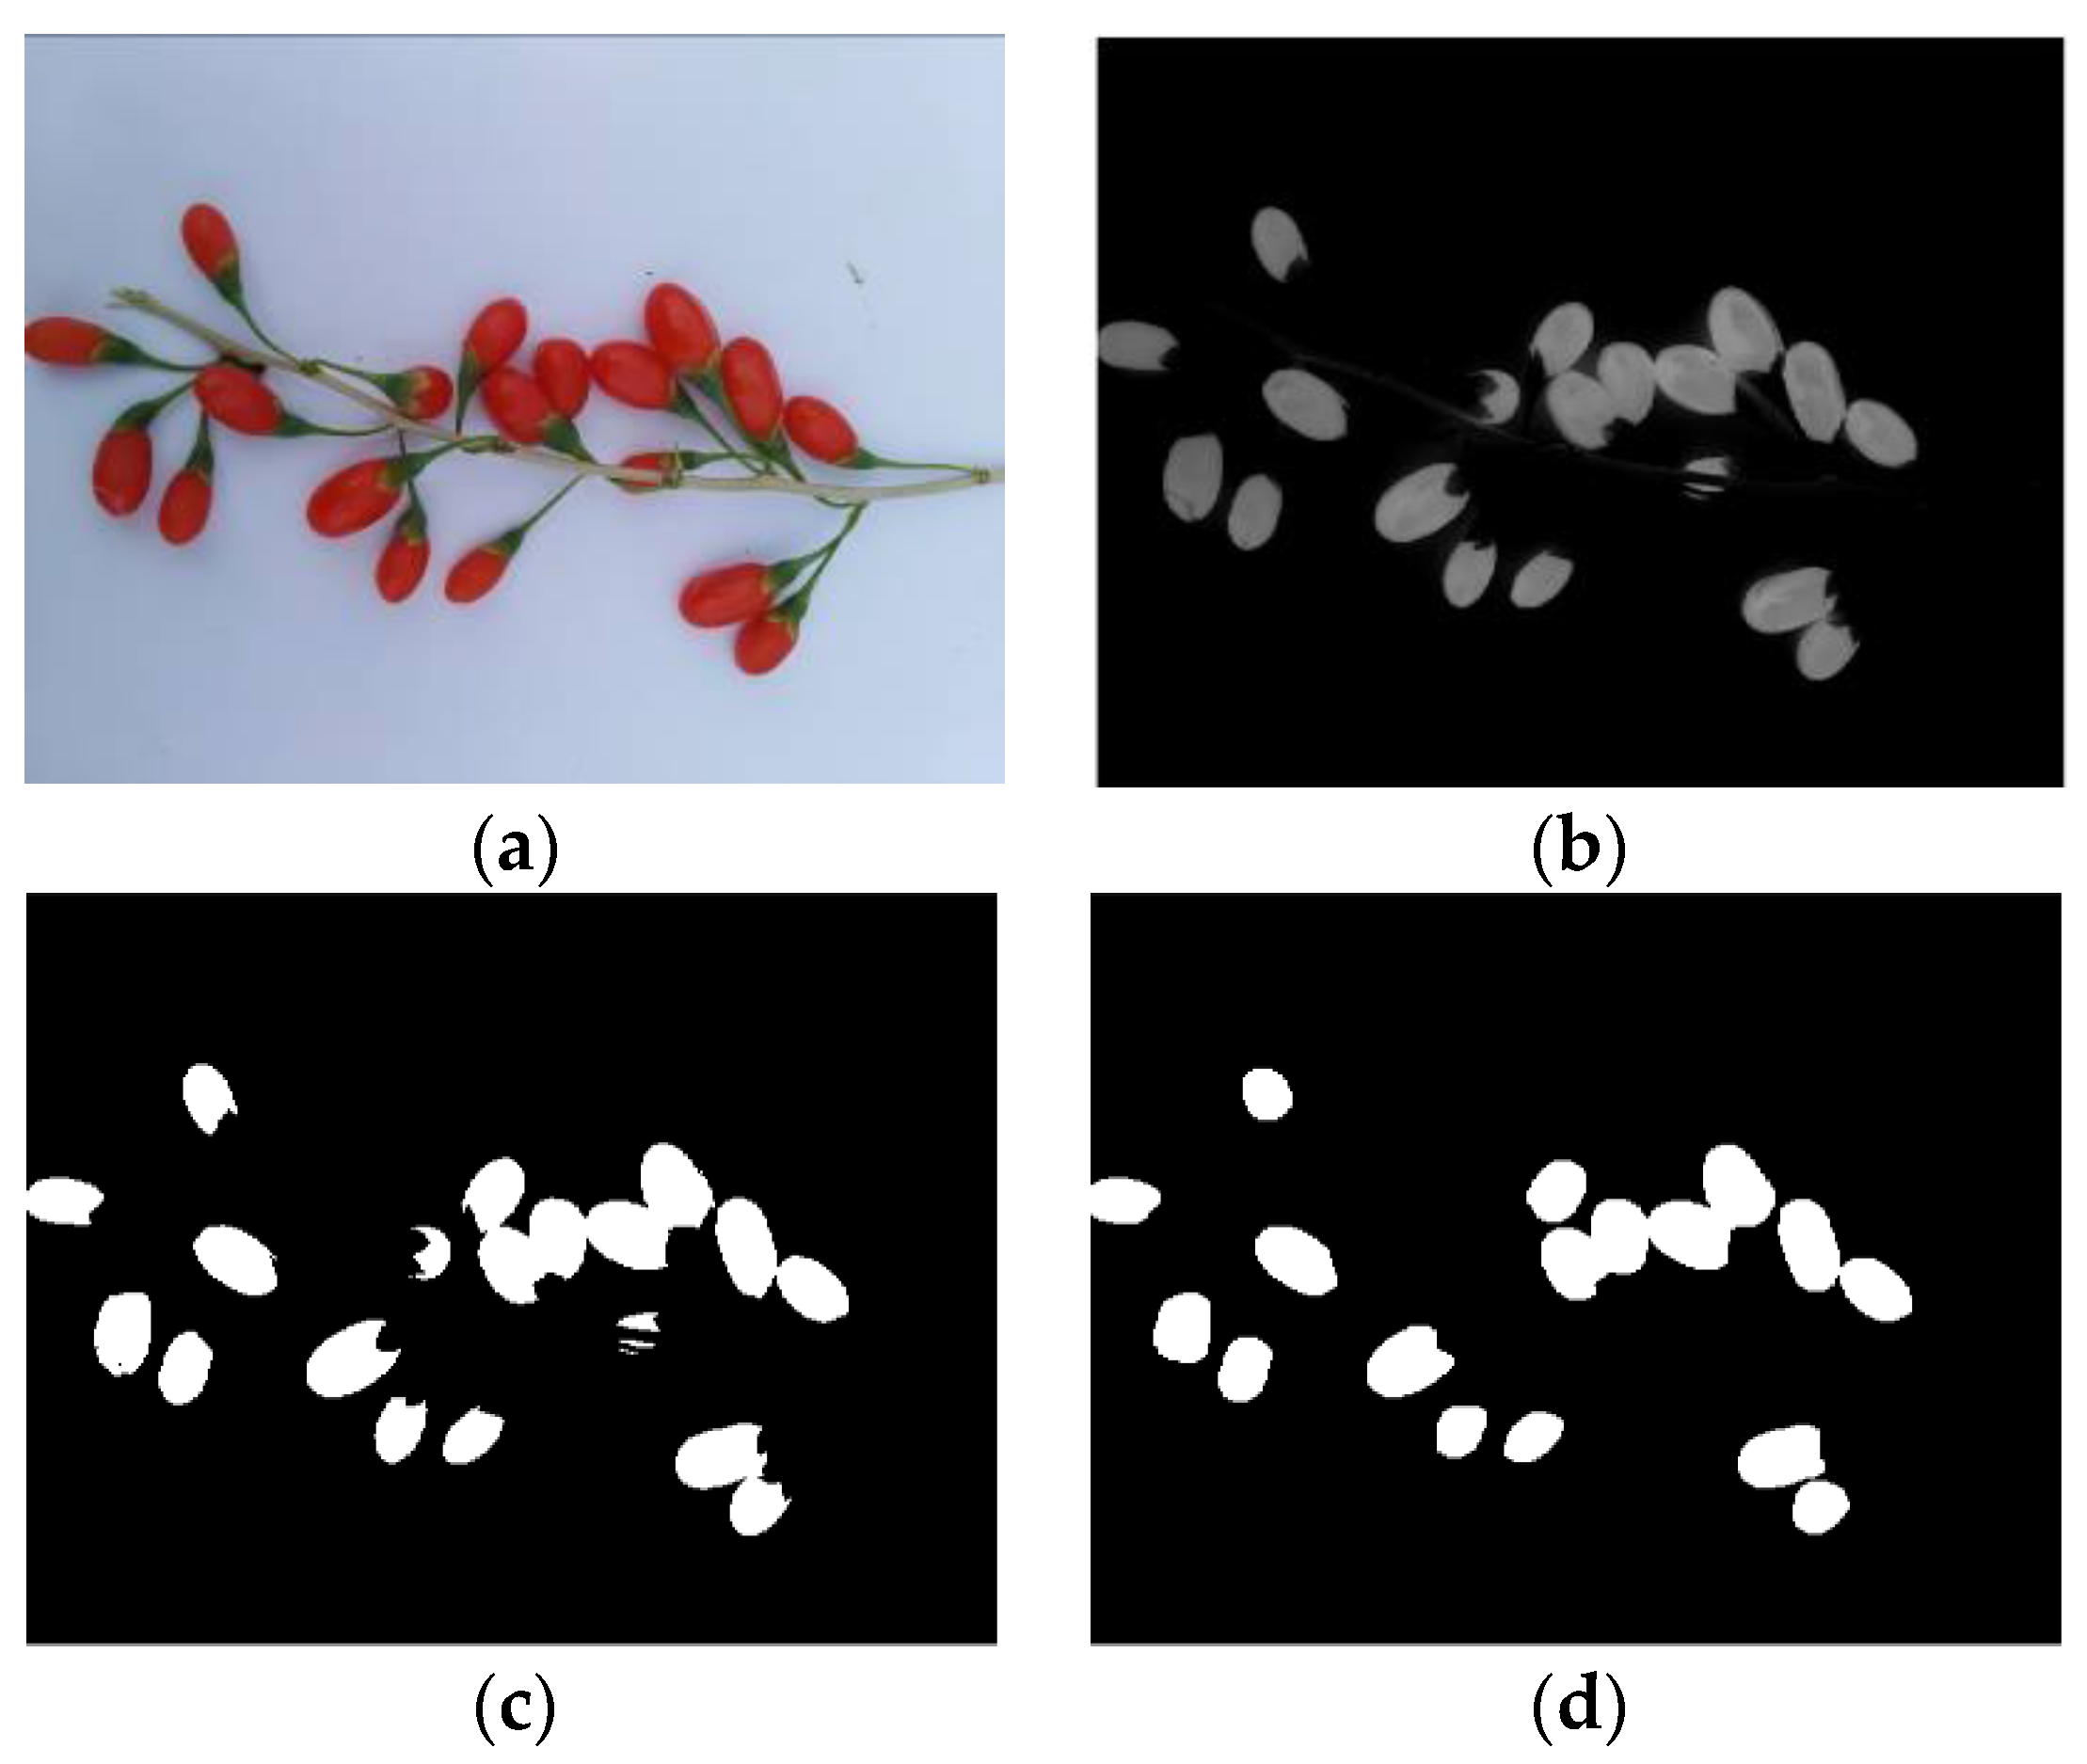
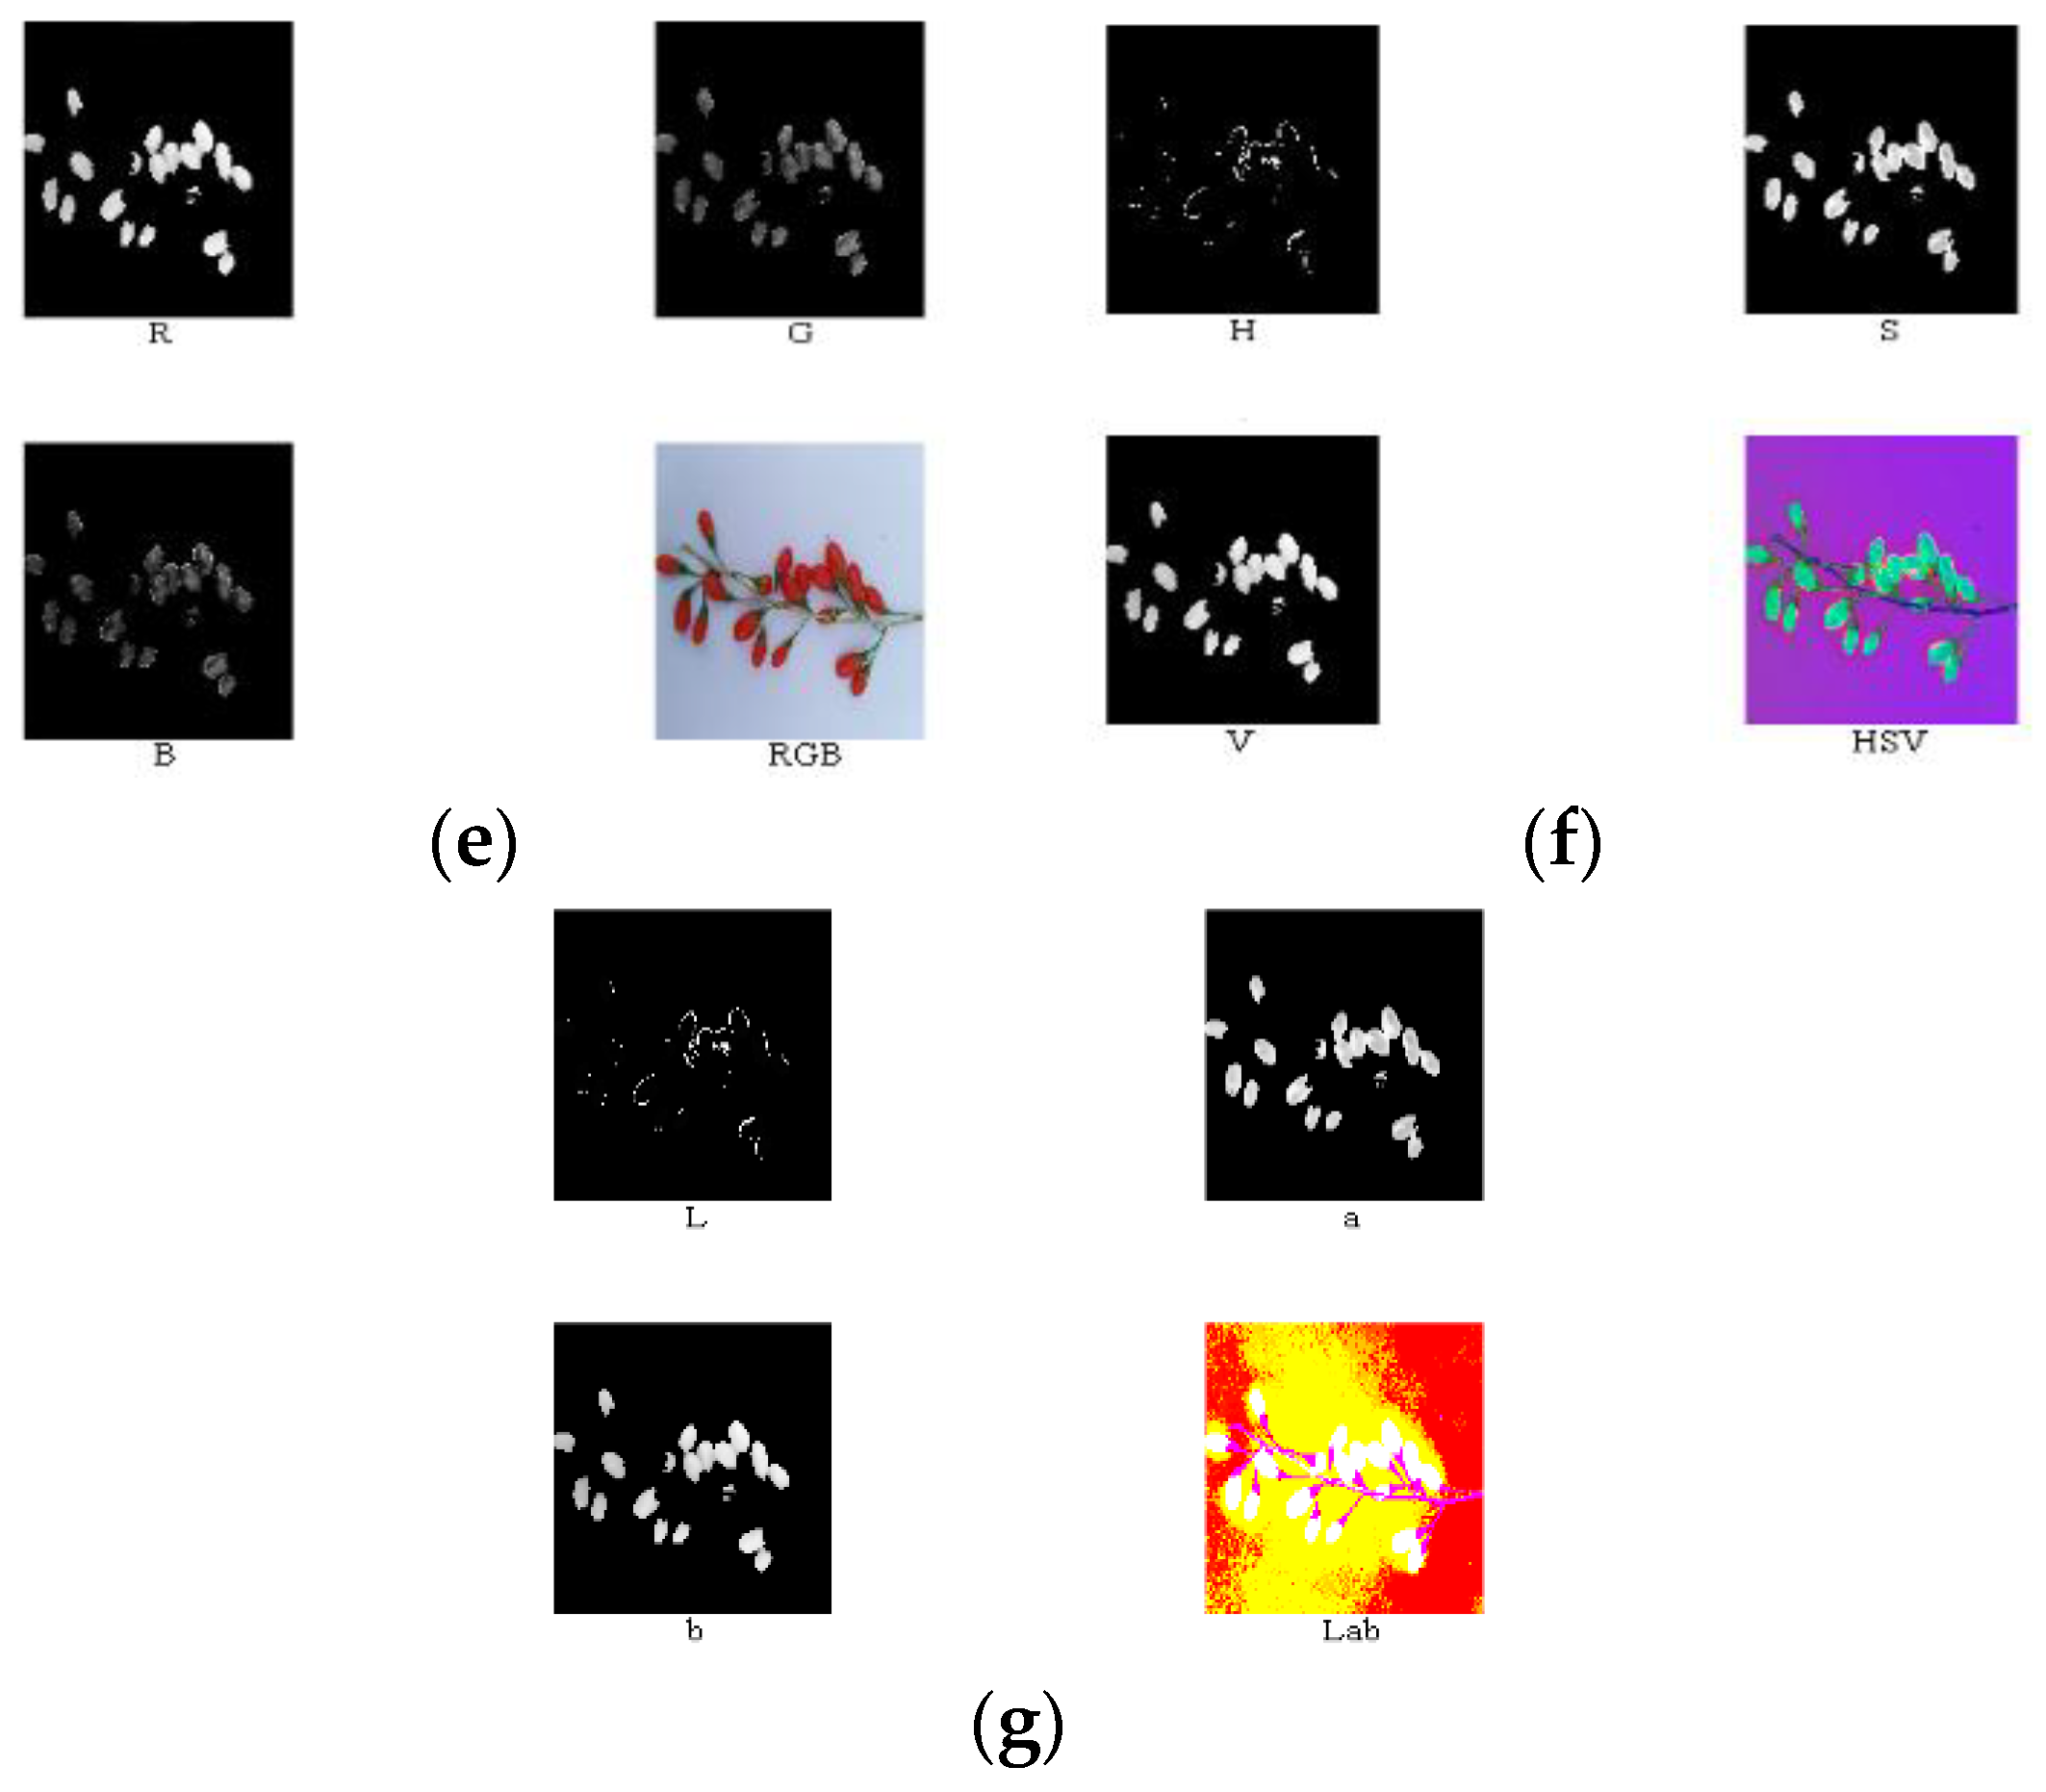
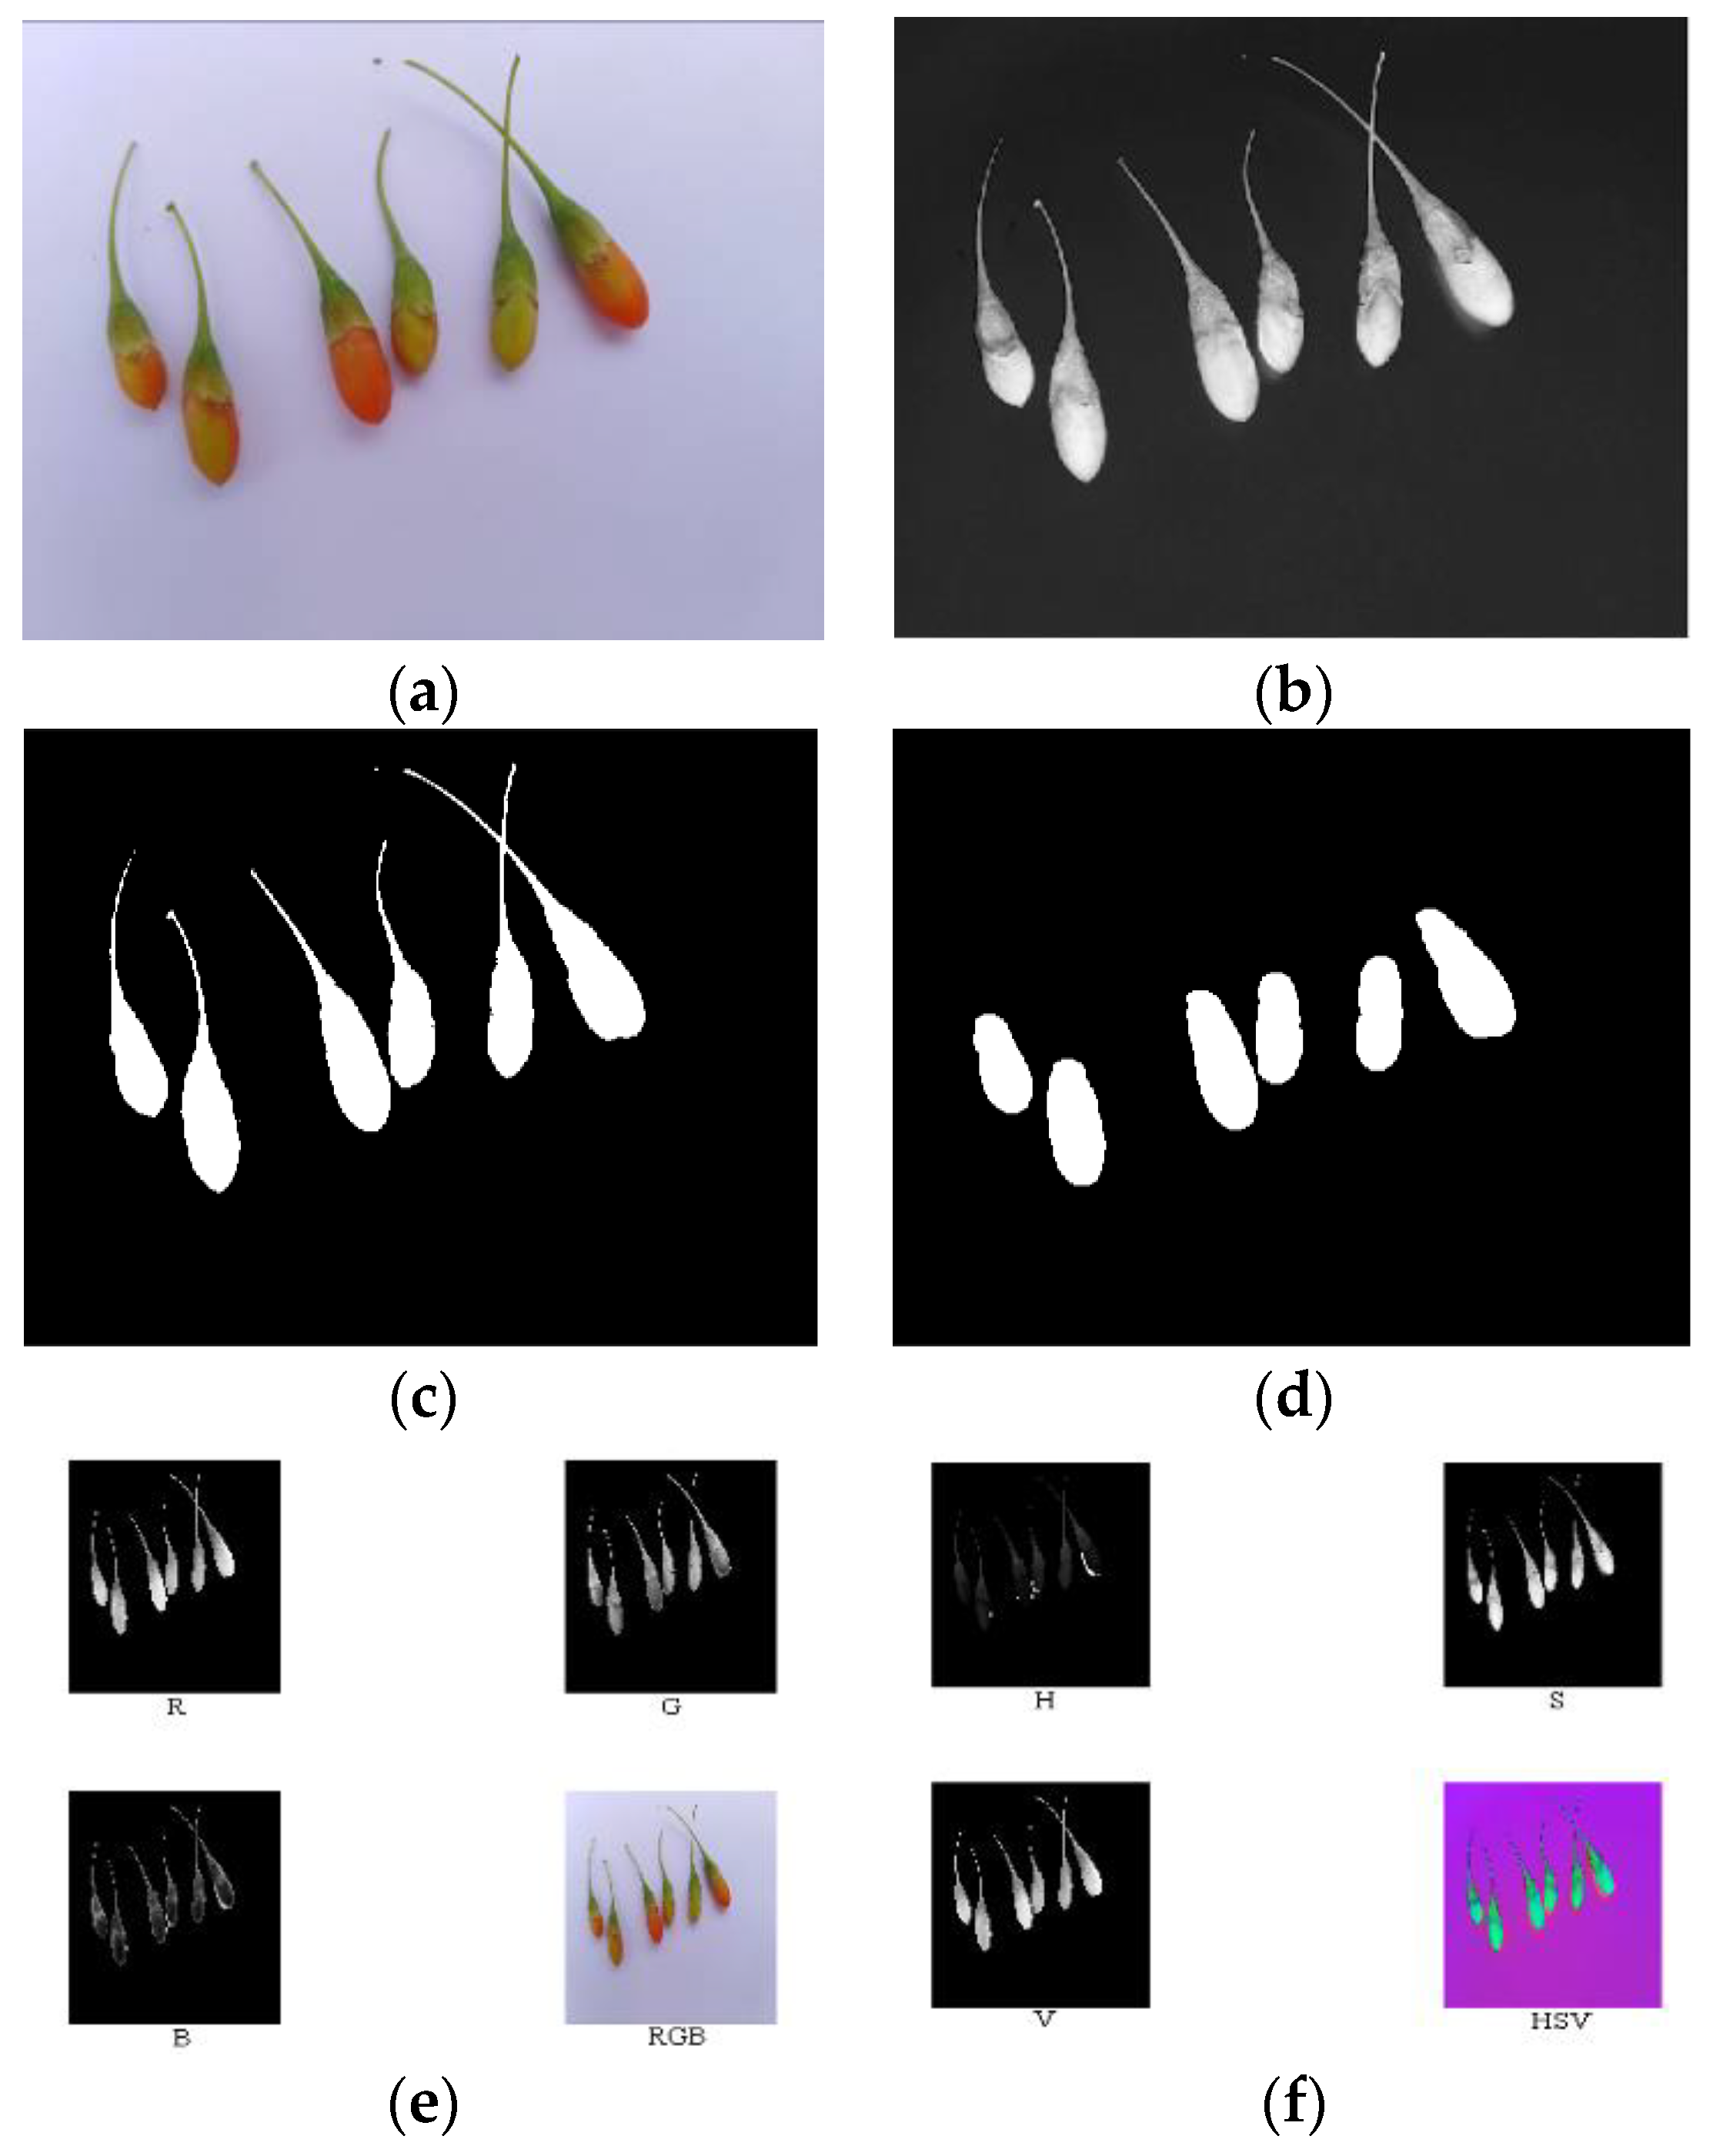
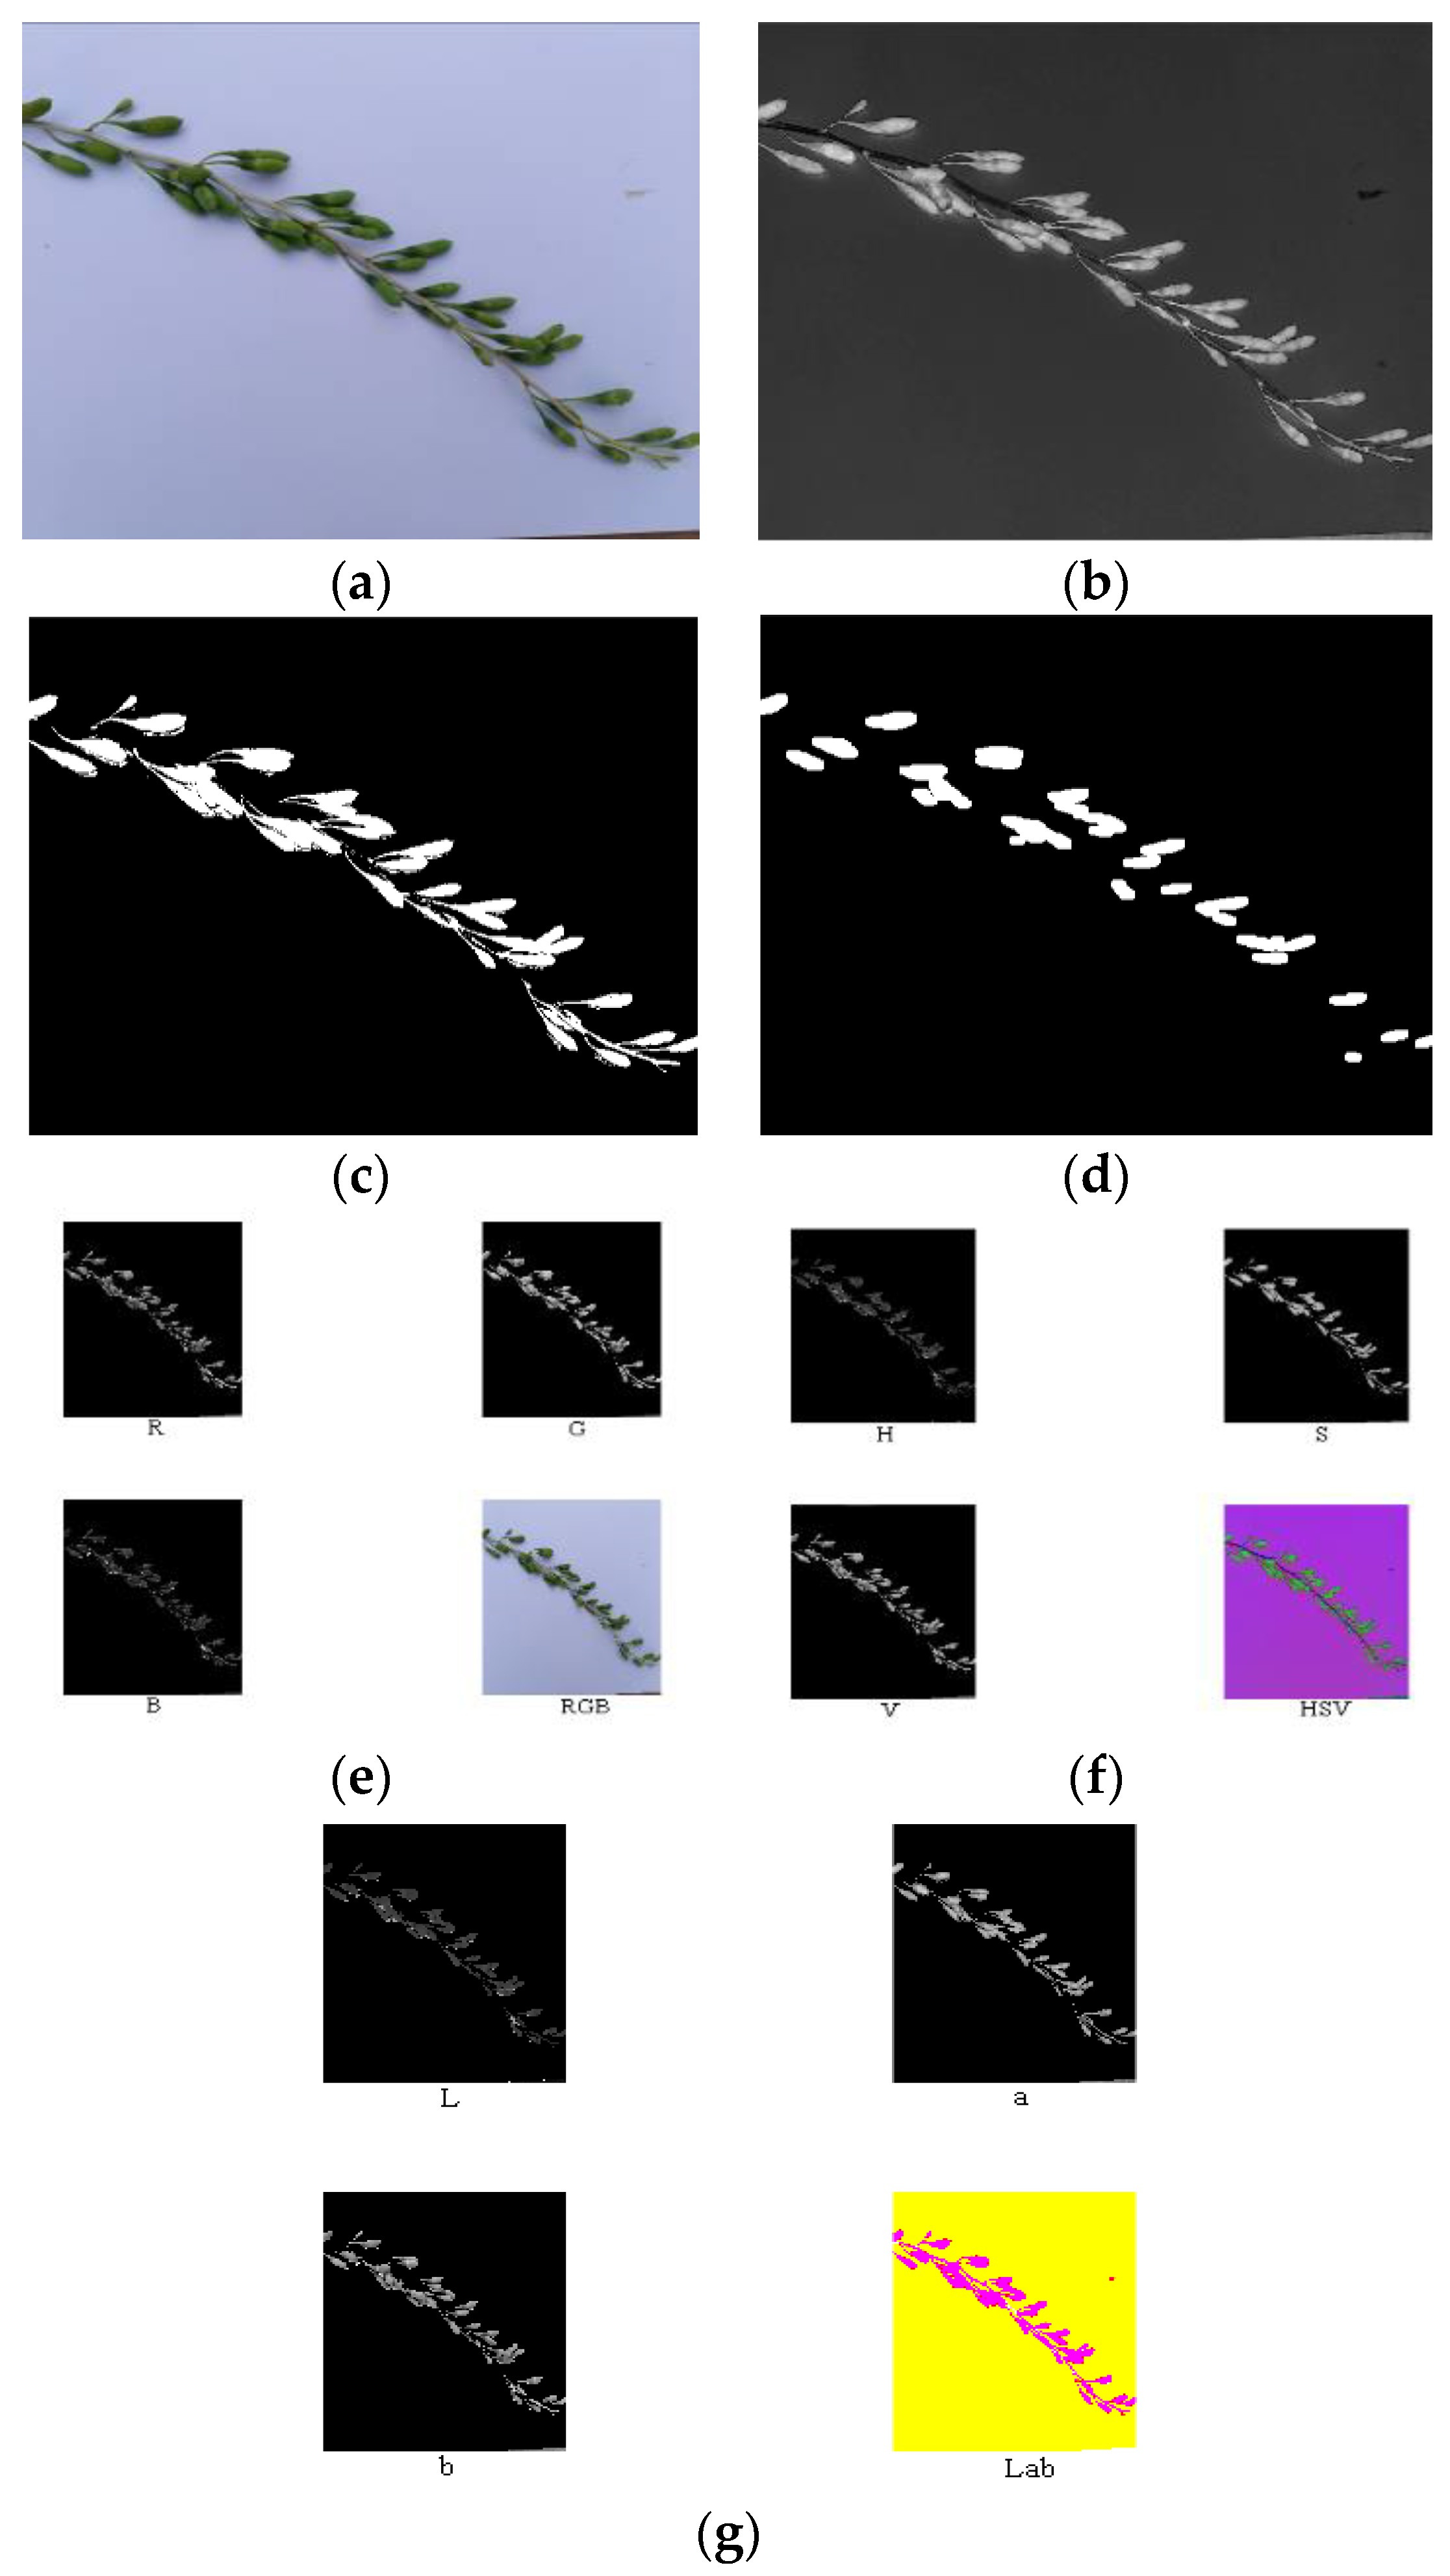
According to the above analysis, component R—G was conducive for the extraction of the area of the ripe fruit; component S was conducive for the extraction of the area of both the half-ripe fruit and unripe fruit. The above component images were processed using the binary processing, firstly. The areas of fruit were set as 1, and the other areas were set as 0. Then, the morphology processing was conducted to denoise images and smooth the boundary. Finally, masks of nine components of the ripe fruit, half-ripe fruit, and unripe fruit were made, i.e., the numerical values of each component were multiplied by the areas of fruit. The image processing of the ripe fruit, half-ripe fruit, and unripe fruit is shown in Figure 9, Figure 10 and Figure 11, respectively.
3.2. Establishing the Maturity Detection Model
The SVM model was proposed by Vapnik to solve the problem of pattern classification and nonlinear mapping [25,26]. It established a hyperplane to maximize the distance between two sample sets, thus enabling the good generalization ability for classification problems. In this study, the SVM model was adopted as the maturity detection model, and both c and g of kernel function were used as the training parameters for the optimization. After training with large samples, the model was optimized when c and g were 1 and 1, respectively.
3.3. Field Experiment Verification
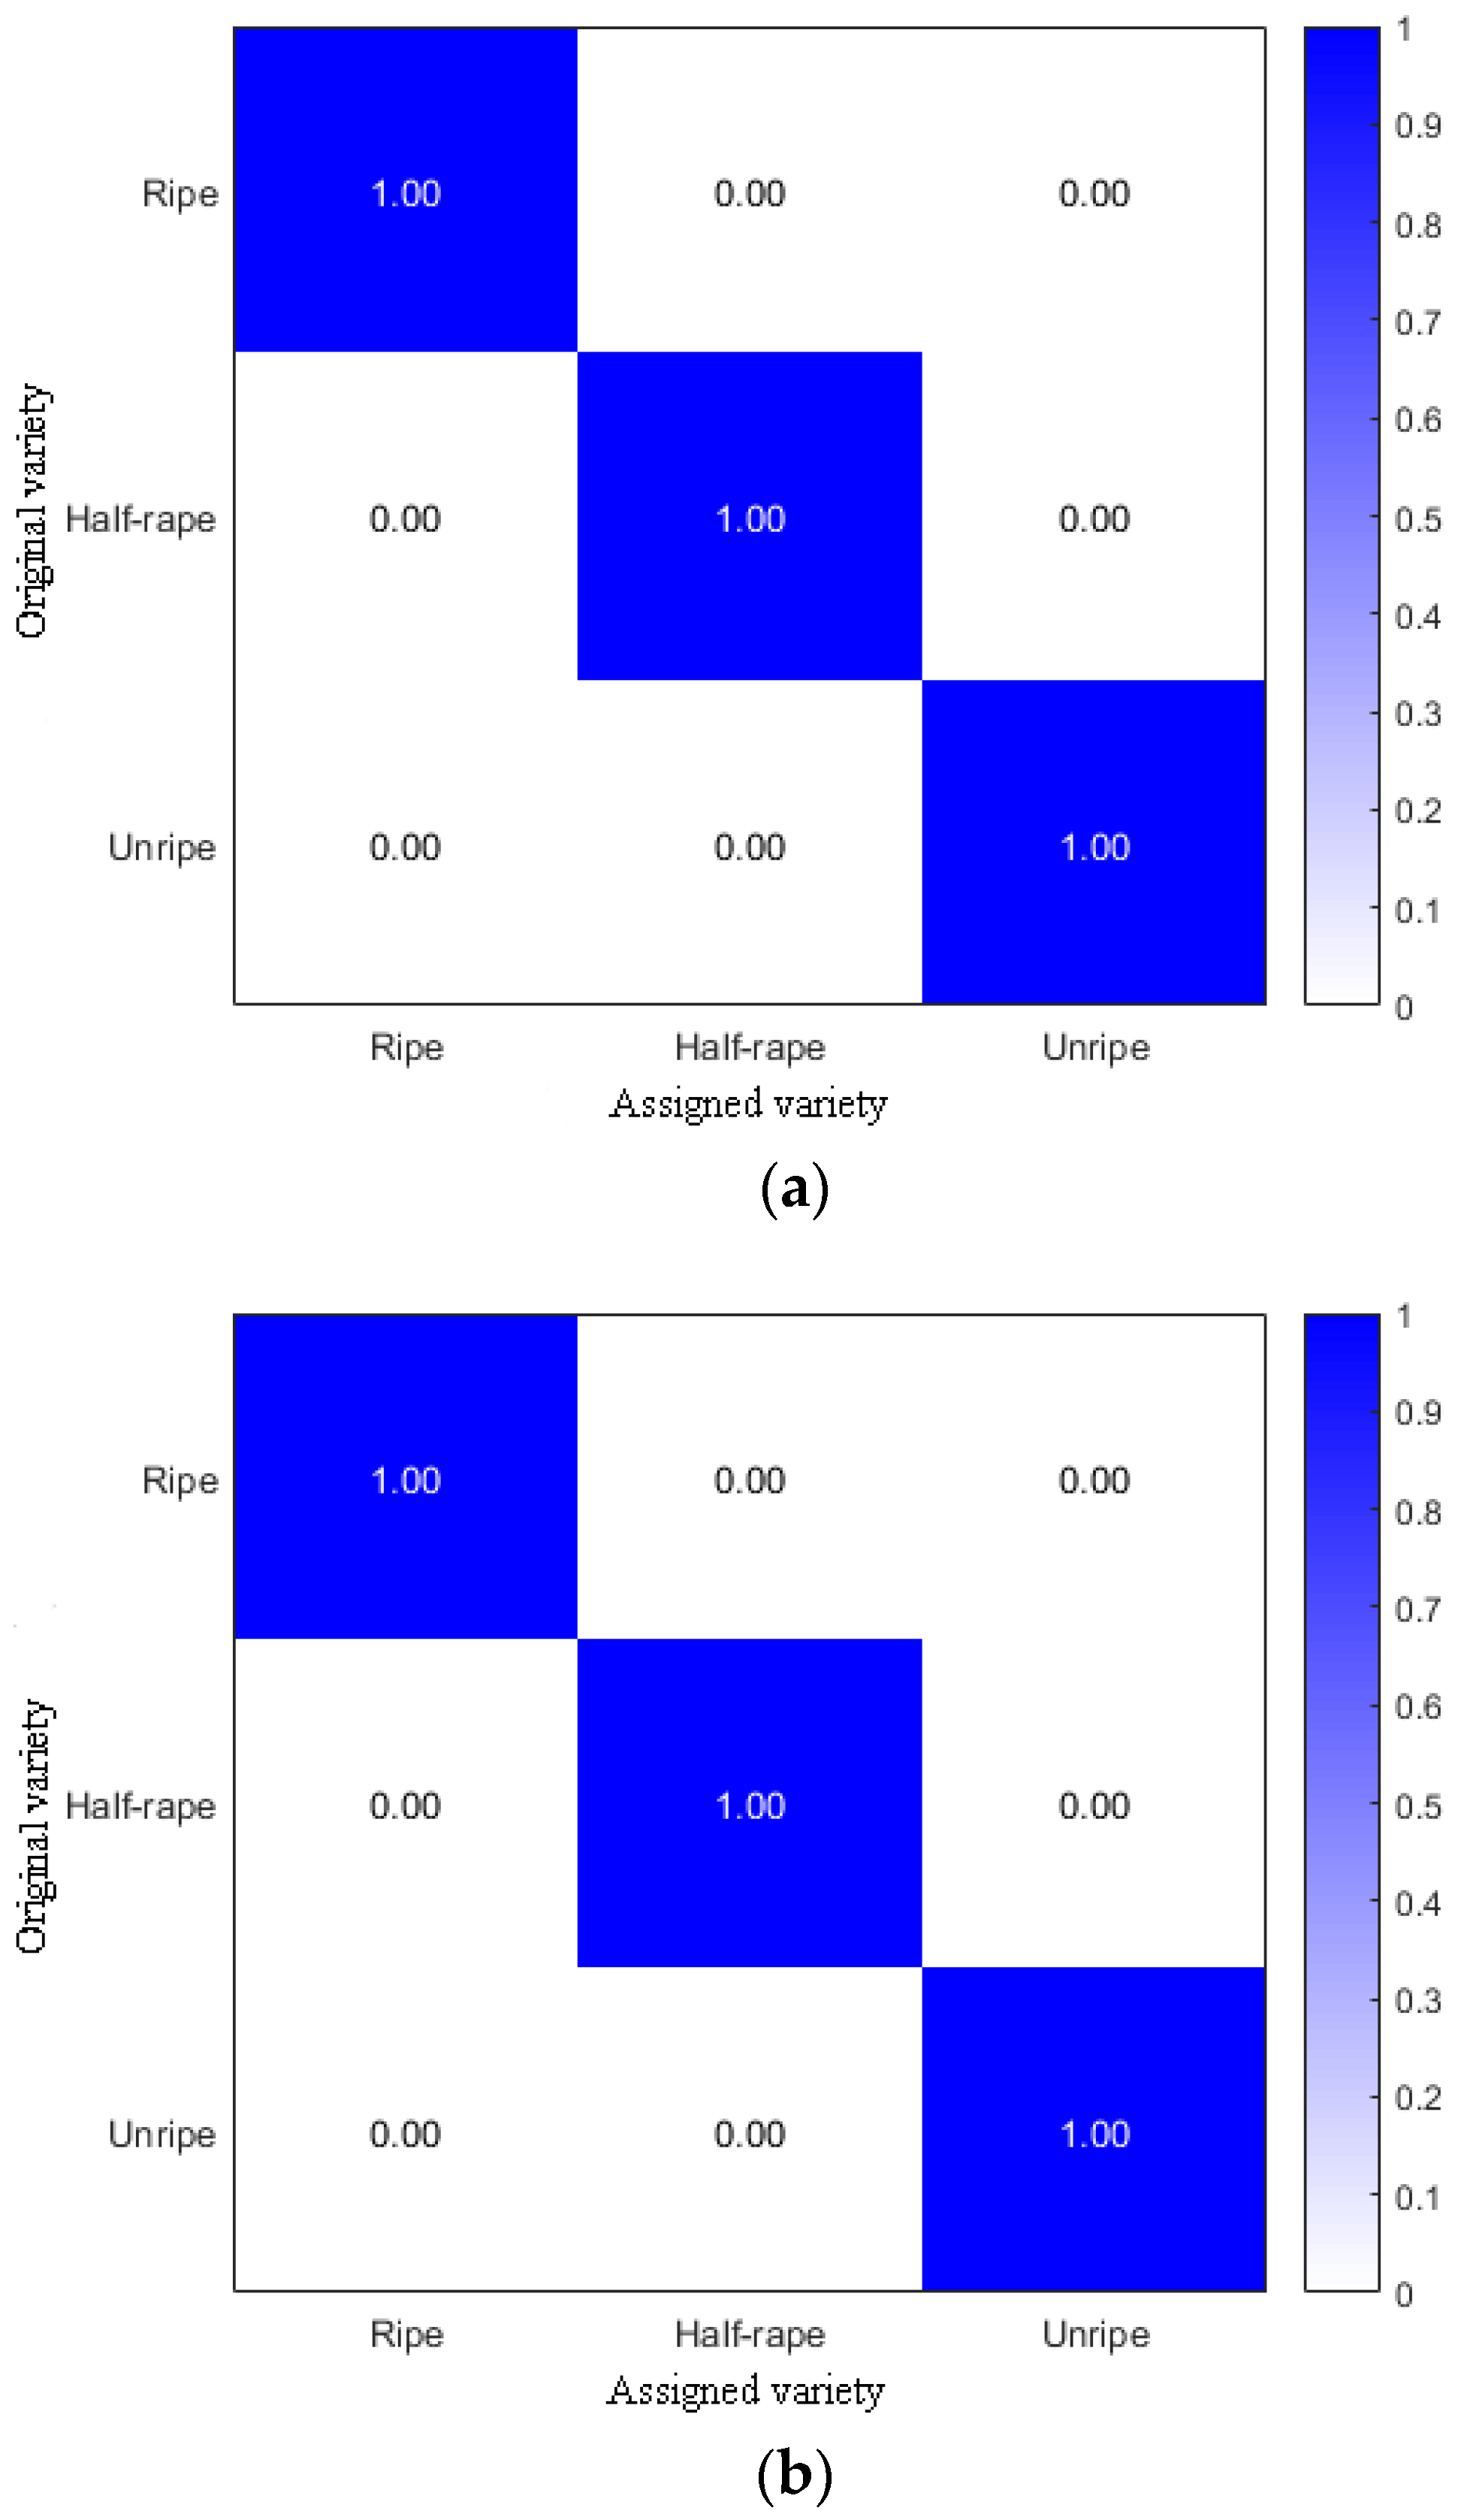
The above samples were used for the field experiment verification. The amounts of the ripe fruit, half-ripe fruit, and unripe fruit were 1828, 556, and 1164, respectively. The ratio of the amounts of samples in the training set to the prediction set was 3:1. The amounts of samples in the training set and the prediction set were 2661 and 887, respectively. After the calculation, the accuracies of both the training set and prediction set were 100%, and the confusion matrixes are shown in Figure 12.
The picking forces of the three fruits were obtained using the measuring device and are shown in Table 1. It can be seen from Table 1 that the differences of picking forces of the three fruits were obvious. However, the ranges of picking forces of each of the three fruits were relatively stable. By comparing the relationship between the prediction results of the model and the picking forces of fruit, the prediction results of the model were consistent with the picking forces of fruit.
4. Conclusions
This study was conducted to determine whether fruit are suitable for harvesting or not by establishing a quantitative maturity detection model of L. barbarum. Abnormal samples were eliminated by the (MD) and nine components (i.e., R, G, B, H, S, V, L, a, and b) of the ripe fruit, half-ripe fruit, and unripe fruit were extracted, firstly. Then, significant component combinations of the three fruits beneficial to the extraction of their areas were determined. Component R—G was conducive to the extraction of the area of the ripe fruit; component S was conducive to the extraction of the area of both the half-ripe fruit and unripe fruit. Through the binary processing, morphology processing, and other image processing methods, a quantitative maturity detection model of fruit was established based on the SVM model. On this basis, field experiments were conducted to verify and compare the relationship between the prediction results of the model and the picking forces of fruit. Field experiments showed that the accuracies of both the training set and prediction set were 100%, and the prediction results of the model were consistent with the picking forces of fruit. Findings provided a theoretical basis for the accurate quantitative maturity detection of fresh L. barbarum fruit.
Author Contributions
Conceptualization, J.Z. and J.C.; methodology, J.Z. and J.C.; software, J.Z.; validation, J.Z. and J.C.; investigation, J.Z. and J.C.; writing—original draft preparation, J.Z.; writing—review and editing, J.C.; visualization, J.Z.; funding acquisition, J.C. All authors have read and agreed to the published version of the manuscript.
Funding
This research and APC were funded by the National Key Research and Development Program of China, grant number 2018YFD0701102. The authors also appreciate the financial support provided by the China Scholarship Council.
Institutional Review Board Statement
Not applicable.
Informed Consent Statement
Not applicable.
Conflicts of Interest
The authors declare no conflict of interest.
References
- Chen, Q.; Chen, Z. Progress of studies on the pharmacology effect of Lycium Barbarum polysaccharides. Strait Pharm. J. 2005, 17, 4–7. [Google Scholar] [CrossRef]
- Dong, J.; Yang, J.; Wang, Y. Resources of Lycium species and related research progress. China J. Chin. Mater. Med. 2008, 33, 2020–2027. [Google Scholar] [CrossRef]
- Xu, L.; Chen, J.; Wu, G.; Yuan, Q.; Ma, S.; Yu, C.; Duan, Z.; Xing, J.; Liu, X. Design and operating parameter optimization of comb brush vibratory harvesting device for wolfberry. Trans. CSAE 2018, 34, 75–82. [Google Scholar] [CrossRef]
- Forino, M.; Tartaglione, L.; Dell’Aversano, C.; Ciminiello, P. NMR-based identification of the phenolic profile of fruits of Lycium barbarum (goji berries). Isolation and structural determination of a novel N-feruloyl tyramine dimer as the most abundant antioxidant polyphenol of goji berries. Food Chem. 2016, 194, 1254–1259. [Google Scholar] [CrossRef]
- Ceccarini, M.R.; Vannini, S.; Cataldi, S.; Moretti, M.; Villarini, M.; Fioretti, B.; Albi, E.; Beccari, T.; Codini, M. Effect of Lycium barbarum berries cultivated in Umbria (Italy) on human hepatocellular carcinoma cells. J. Biotechnol. 2016, 231S, S26–S27. [Google Scholar] [CrossRef]
- Po, K.K.; Leung, J.W.; Chan, J.N.; Fung, T.K.; Sánchez-Vidaña, D.I.; Sin, E.L.; So, K.; Lau, B.W.; Siu, A.M. Protective effect of Lycium Barbarum polysaccharides on dextromethorphan-induced mood impairment and neurogenesis suppression. Brain Res. Bull. 2017, 134, 10–17. [Google Scholar] [CrossRef]
- Ma, J. Research status and prospect of the machanized technology of picking wolfberry in China. Mech. Res. Appl. 2017, 30, 151–153, 155. [Google Scholar] [CrossRef]
- So, J.D. Vibration characteristics of boxthorn (Lycium chinense Mill) branches. Appl. Eng. Agric. 2001, 17, 755–760. [Google Scholar] [CrossRef]
- So, J.D. Vibratory harvesting machine for boxthorn (Lycium chinense Mill) berries. Trans. ASAE 2003, 46, 211–221. [Google Scholar] [CrossRef]
- Zhang, Z.; Xiao, H.; Ding, W.; Mei, S. Machanism simulation analysis and prototype experiment of Lycium barbarum harvest by vibration mode. Trans. CSAE 2015, 31, 20–28. [Google Scholar] [CrossRef]
- Wang, Y.; Chen, Y.; Han, B.; Chen, J. Research on laws of wolfberry dropping based on high-speed camera. J. Agric. Mech. Res. 2018, 40, 166–170. [Google Scholar] [CrossRef]
- Zhang, W.; Zhang, M.; Zhang, J.; Li, W. Design and experiment of vibrating wolfberry harvester. Trans. CSAM 2018, 49, 97–102. [Google Scholar] [CrossRef]
- Zhang, W.; Li, Z.; Tan, Y.; Li, W. Optimal design and experiment on variable pacing combing brush picking device for Lycium barbarum. Trans. CSAM 2018, 49, 83–90. [Google Scholar] [CrossRef]
- Chen, J.; Zhao, J.; Chen, Y.; Bu, L.; Hu, G.; Zhang, E. Design and experiment on vibrating and comb brushing harvester for Lycium barbarum. Trans. CSAM 2019, 50, 152–161. [Google Scholar] [CrossRef]
- Zhao, J.; Sugirbay, A.; Chen, Y.; Zhang, S.; Liu, F.; Bu, L.; Chen, Y.; Wang, Z.; Chen, J. FEM explicit dynamics simulation and NIR hyperspectral reflectance imaging for determination of impact bruises of Lycium barbarum L. Postharvest Biol. Technol. 2019, 155, 102–110. [Google Scholar] [CrossRef]
- Tijskens, L.M.M.; Zerbini, P.E.; Schouten, R.E.; Vanoli, M.; Jacob, S.; Grassi, M.; Cubeddu, R.; Spinelli, L.; Torricelli, A. Assessing harvest maturity in nectarines. Postharvest Biol. Technol. 2007, 45, 204–213. [Google Scholar] [CrossRef]
- Wan, P.; Toudeshki, A.; Tan, H.; Ehsani, R. A methodology for fresh tomato maturity detection using computer vision. Comput. Electron. Agric. 2018, 146, 43–50. [Google Scholar] [CrossRef]
- Lien, C.; Ay, C.; Ting, C. Non-destructive impact test for assessment of tomato maturity. J. Food Eng. 2009, 91, 402–407. [Google Scholar] [CrossRef]
- Mizushima, A.; Lu, R. An image segmentation method for apple sorting and grading using support vector machine and Otsu’s method. Comput. Electron. Agric. 2013, 94, 29–37. [Google Scholar] [CrossRef]
- Bhatt, A.K.; Pant, D. Automatic apple grading model development based on back propagation neural network and machine vision, and its performance evaluation. AI Soc. 2015, 30, 45–56. [Google Scholar] [CrossRef]
- Sun, S.; Wu, Q.; Jiao, L.; Long, Y.; He, D.; Song, H. Recognition of green apples based on fuzzy set theory and manifold ranking algorithm. Optik 2018, 165, 395–407. [Google Scholar] [CrossRef]
- Nagle, M.; Intani, K.; Romano, G.; Mahayothee, B.; Sardsud, V.; Müller, J. Determination of surface color of ‘all yellow’ mango cultivars using computer vision. Int. J. Agric. Biol. Eng. 2016, 9, 42–50. [Google Scholar] [CrossRef]
- Lin, H.; Zhang, H.; Gao, Y.; Li, X.; Yang, F.; Zhou, Y. Mahalanobis distance based hyperspectral charateristic discrimination of leaves of different desert tree specie. Spectrosc. Spectr. Anal. 2014, 34, 3358–3362. [Google Scholar] [CrossRef]
- Ke, T.; Lv, H.; Sun, M.; Zhang, L. A biased least squares support vector machine based on Mahalanobis distance for PU learning. Physica A 2018, 509, 422–438. [Google Scholar] [CrossRef]
- Cusano, C.; Ciocca, G.; Schettini, R. Image annotation using SVM. Proc. SPIE 2003, 5304. [Google Scholar] [CrossRef]
- Zhang, D.; Zhang, J.; Yao, K.; Cheng, M.; Wu, Y. Infrared ship-target recognition based on SVM classification. Infrared Laser Eng. 2016, 45, 0104004-1–0104004-6. [Google Scholar] [CrossRef]
- Batu, A. Determination of acceptable firmness and colour values of tomatoes. J. Food Eng. 2004, 61, 471–475. [Google Scholar] [CrossRef]
- Schouten, R.E.; Huijben, T.P.M.; Tijskens, L.M.M.; Van Kooten, O. Modelling quality attributes of truss tomatoes: Linking colour and firmness maturity. Postharvest Biol. Technol. 2007, 45, 298–306. [Google Scholar] [CrossRef]
- Aranda-Sanchez, J.I.; Baltazar, A.; González-Aguilar, G. Implementation of a Bayesian classifier using repeated measurements for discrimination of tomato fruit ripening stages. Biosyst. Eng. 2009, 102, 274–284. [Google Scholar] [CrossRef]
- Poel, B.V.D.; Bulens, I.; Hertog, M.L.A.T.M.; Van Gastel, L.; De Proft, M.P.; Nicolai, B.M.; Geeraer, A.H. Model-based classification of tomato fruit development and ripening related to physiological maturity. Postharvest Biol. Technol. 2012, 67, 59–67. [Google Scholar] [CrossRef]
- Ishii, M.; Kusada, I.; Yamane, H. Quantitative decision method of appropriate apple harvest time using color information. Electr. Commun. Jpn. 2018, 101, 61–73. [Google Scholar] [CrossRef]
- Cheng, Y.; Yang, S.; Liu, X.; Zhang, E.; Song, Z. Identification of wine grape varieties based on near-infrared hyperspectral imaging. Appl. Eng. Agric. 2019, 35, 959–967. [Google Scholar] [CrossRef]
Figure 1.
Fresh L. barbarum fruit at different maturity levels. (a) Ripe fruit, (b) half-ripe fruit, and (c) unripe fruit.
Figure 1.
Fresh L. barbarum fruit at different maturity levels. (a) Ripe fruit, (b) half-ripe fruit, and (c) unripe fruit.

Figure 2.
The (MD) distribution points of the ripe fruit (a), half-ripe fruit (b), and unripe fruit (c).
Figure 2.
The (MD) distribution points of the ripe fruit (a), half-ripe fruit (b), and unripe fruit (c).


Figure 3.
The eliminated abnormal samples of the ripe fruit (a), half-ripe fruit (b), and unripe fruit (c).
Figure 3.
The eliminated abnormal samples of the ripe fruit (a), half-ripe fruit (b), and unripe fruit (c).


Figure 4.
Extraction process of RGB (a), HSV (b), and lab (c) of the ripe fruit.


Figure 5.
Extraction process of RGB (a), HSV (b), and lab (c) of the half-ripe fruit.


Figure 6.
Extraction process of RGB (a), HSV (b), and lab (c) of the unripe fruit.


Figure 7.
Box plots of numerical values of nine components of the ripe fruit (a), half-ripe fruit (b), and unripe fruit (c).
Figure 7.
Box plots of numerical values of nine components of the ripe fruit (a), half-ripe fruit (b), and unripe fruit (c).


Figure 8.
The measuring device of picking forces.

Figure 9.
Original image (a), component R—G (b), binary processing (c), morphology processing (d), masks of RGB model (e), masks of HSV model (f), and masks of lab model (g) of the ripe fruit.
Figure 9.
Original image (a), component R—G (b), binary processing (c), morphology processing (d), masks of RGB model (e), masks of HSV model (f), and masks of lab model (g) of the ripe fruit.


Figure 10.
Original image (a), component S (b), binary processing (c), morphology processing (d), masks of RGB model (e), masks of HSV model (f), and masks of lab model (g) of the half-ripe fruit.
Figure 10.
Original image (a), component S (b), binary processing (c), morphology processing (d), masks of RGB model (e), masks of HSV model (f), and masks of lab model (g) of the half-ripe fruit.


Figure 11.
Original image (a), component S (b), binary processing (c), morphology processing (d), masks of RGB model (e), masks of HSV model (f), and masks of lab model (g) of the unripe fruit.
Figure 11.
Original image (a), component S (b), binary processing (c), morphology processing (d), masks of RGB model (e), masks of HSV model (f), and masks of lab model (g) of the unripe fruit.

Figure 12.
Confusion matrixes of the training set (a) and prediction set (b).


Table 1.
The picking forces of fruit.
| Item | Mean Value (N) | Standard Deviation (N) |
|---|---|---|
| Ripe fruit | 0.72 | 0.31 |
| Half-ripe fruit | 1.66 | 0.49 |
| Unripe fruit | 2.54 | 0.61 |
Publisher’s Note: MDPI stays neutral with regard to jurisdictional claims in published maps and institutional affiliations. |
© 2021 by the authors. Licensee MDPI, Basel, Switzerland. This article is an open access article distributed under the terms and conditions of the Creative Commons Attribution (CC BY) license (https://creativecommons.org/licenses/by/4.0/).
Share and Cite
MDPI and ACS Style
Zhao, J.; Chen, J. Detecting Maturity in Fresh Lycium barbarum L. Fruit Using Color Information. Horticulturae 2021, 7, 108. https://0-doi-org.brum.beds.ac.uk/10.3390/horticulturae7050108
AMA Style
Zhao J, Chen J. Detecting Maturity in Fresh Lycium barbarum L. Fruit Using Color Information. Horticulturae. 2021; 7(5):108. https://0-doi-org.brum.beds.ac.uk/10.3390/horticulturae7050108
Chicago/Turabian StyleZhao, Jian, and Jun Chen. 2021. "Detecting Maturity in Fresh Lycium barbarum L. Fruit Using Color Information" Horticulturae 7, no. 5: 108. https://0-doi-org.brum.beds.ac.uk/10.3390/horticulturae7050108
Note that from the first issue of 2016, this journal uses article numbers instead of page numbers. See further details here.