Article

Development of Frozen Pulps and Powders from Carrot and Tomato by-Products: Impact of Processing and Storage Time on Bioactive and Biological Properties

by
Helena Araújo-Rodrigues
1,
Diva Santos
1,
Débora A. Campos
1,
Modesta Ratinho
2,
Ivo M. Rodrigues
3 and
Manuela E. Pintado
2,*
1
Centro de Biotecnologia e Química Fina—Laboratório Associado, Escola Superior de Biotecnologia, Universidade Católica Portuguesa/Porto, Rua Diogo Botelho, 1327, 4169-005 Porto, Portugal
2
Vitacress S.A., Quinta dos Cativos, 7630-033 Odemira, Portugal
3
Departamento de Ciências Agrárias e Tecnologias, Escola Superior Agrária, Instituto Politécnico de Coimbra, 3045-601 Coimbra, Portugal
*
Author to whom correspondence should be addressed.
Submission received: 24 May 2021 / Revised: 27 June 2021 / Accepted: 29 June 2021 / Published: 5 July 2021

Abstract

:
Vegetables and fruits have an interesting nutritional profile, rich in bioactive metabolites, holding a high antioxidant potential and health associated benefits. However, their functional properties, the shorter shelf-life due to their high-water content, and their seasonality nature lead to extensive food losses and waste. The valorization of vegetables and fruits by-products through the development of value-added products and the application of preservation methods is of utmost importance to prevent food losses and waste. In this study, based on a circular economy approach, pulps and powders of baby carrot and cherry tomato by-products were prepared. Freezing, hot air drying and storage time impact on antioxidant activity and bioactive compounds were studied. Microbiological quality and pulps viscosity were also monitored for 6 months. During the freezing storage, TPC and antioxidant capacity by ABTS and ORAC assays decreased. The antioxidant capacity by DPPH method and carotenoid content increased during the first months of freezing, but then decreased. The drying process negatively affected the antioxidant capacity as well as carotenoid and polyphenolic content compared with the fresh vegetables. Both processing methodologies positively impacted the vitamin E content. During drying storage, there were no key variations in antioxidant capacity and bioactive content.

1. Introduction

According to the 2019 report of the Food and Agriculture Organization of the United Nations, approximately 21.6% of the worldwide fruits and vegetables were lost in 2016 [1]. The seasonal nature of vegetables and fruits and their short shelf-life contribute to these massive losses and waste [2,3,4]. However, a significant fraction of food losses also results from vegetables and fruits that do not comply with commercial standards but maintain relevant nutritional and organoleptic profiles [5]. In this context, the valorisation of non-standard vegetables and fruits and other by-products from these industries through the development of new value-added products is of utmost importance to combat food losses and waste.
Clinical and epidemiological studies have described many health-related benefits associated with a diet rich in vegetables and fruits on chronic, cardiovascular, neurological, inflammatory and some cancer diseases [3,6,7,8]. Their interesting nutritional profile results from the presence of some bioactive metabolites such as, carotenoids, flavonoids, phenolic acids, tocopherols, alkaloids and chlorophyll derivatives, which contribute to the strong vegetables and fruits antioxidant capacity [6,7,8] and are also partially responsible for their organoleptic attributes. Tomato and carrot are some of the most popular and consumed fresh and cooked vegetables worldwide [2,7]. High levels of antioxidant capacity are reported in tomato and carrot derived from, for instance, carotenoids such as lycopene or beta-carotene, polyphenols such as anthocyanins or flavonoids and vitamin E [2,3,4,7]. Thus, the transformation of these by-products into ingredients with extended shelf-life is an opportunity to reduce food losses and acquire added-value ingredients for the food industry.
Several parameters such as plant genetics, growing environment, ripening stage and post-harvest conditions influence the physical and chemical profile of plant foods [9,10]. Moreover, food-processing approaches may include several modifications in their nutritional composition, being recognized as one of the most critical parameters in the food bioactive composition and concentration. Processing may promote the destruction or chemical modification of the natural phytochemicals, and consequent reduction in the antioxidant capacity [8,10,11]. However, the perishability of tomato and carrot, resultant from their high-water content (>80%), coupled to their seasonality nature, requires the application of processing methods to maximize the resources and ensure the availability of raw materials in the off-seasons [2,3,6,10].
Several processing techniques are available to guarantee the shelf-life extension as well as the quality and safety of plant food products [6,8,11]. The freezing is typically applied to preserve the fresh organoleptic characteristics and most of the nutrients [6,9,10,12]. Nevertheless, the freezing process promotes cell membrane and physical integrity damages that can release antioxidant compounds [10]. Although freezing slows the kinetics of some cellular events such as chemical and enzymatic reactions, these are not completely stopped. Accordingly, these reactions during freezing can induce bioactive compounds degradation and consequent decrease in total antioxidant activity [6,10]. Some authors have also suggested that beyond this negative effect, the frozen storage may favor the release of bound phenolic acids and anthocyanins, promoting a positive impact on functional properties [10].
In contrast, the dried fruits and vegetables have gained extensive popularity due to their transversal use in the food industry and long shelf-life resultant from their low water content [2,3,4,7]. Additionally, the dried fruits and vegetables can be easily produced, stored and transported with reduced packing costs [3,7]. Different drying methods can be employed to preserve vegetables, for instance, freeze, hot air, microwave, vacuum and infrared drying [2,3]. Freeze-drying is one of the most effective drying techniques in the preservation of nutritional and typical sensorial attributes, but it is an expensive and time-demand approach [2,3,4], rarely feasible for industry companies. Even if the temperature can lead to losses in bioactive compounds, the hot-air drying approach is extensively used as a cost-friendly and rapid approach to generate highly stable products with a long shelf-life [3].
In this study, pulps and powders of baby carrot and cherry tomato by-products were prepared and the impact of freezing, hot air drying and storage time on antioxidant capacity and bioactive compounds (polyphenols, carotenoids and Vitamin E profile) were investigated. In addition, other important parameters, such as pulps viscosity and microbiological quality, were also explored.

2. Materials and Methods

2.1. Chemicals

Sodium hypochlorite was supplied by Honeywell Riedel-de Haën AG, Seelze, Germany (11–15% available chlorine). The microbiological media used were plate count agar (PCA; Biokar), violet red bile glucose agar (VRBGA; VWR), rose bengal chloramphenicol agar (RBCA; Biokar), trypticase soy Agar (TSA; VWR) and Bacillus Cereus selective agar (BCSA; Biokar).
ABTS diammonium salt (2,2′-azino-bis(3-ethylbenzothiazoline-6-sulphonic acid)), 2,2-diphenyl-1-picrylhydrazyl, sodium carbonate, 2,2′-azo-bis-(2-methylpropionamidine)-dihydrochloride (≥97%; AAPH), fluorescein, 6-hydroxy-2,5,7,8-tetramethylbroman-2-carboxylic acid (≥97%; Trolox) and butylated hydroxytoluene (≥99%, BHT) were purchased from Sigma-Aldrich (Sintra, Portugal), while Folin-Ciocalteu from Merck (Algés, Portugal). Additionally, maltodextrin, absolute ethanol and ascorbic acid were also purchased from Sigma-Aldrich.
HPLC-grade methanol (≥99.9%) was also supplied by Honeywell Riedel-de Haën AG, while the other solvents used for HPLC analysis (acetonitrile, dichloromethane, formic acid, hexane and 2-propanol) were also purchased from Sigma-Aldrich.
Standards of β- and α-carotene (≥95%), α-tocopherol (≥95%), β-tocopherol (≥95%), γ-tocopherol (≥95%), δ-tocopherol (≥95%), gallic acid (≥99%), rutin (≥95%), ferulic acid (≥98%), isoferulic acid (≥98%), trans-ferulic acid (≥99%), chlorogenic acid (≥99%), p-coumaric acid (≥98%) quercetin-7-O-glucoside (≥98%), sinapic acid (≥98%), myricitin (≥99%) and caffeic acid (≥98%) were supplied from Sigma-Aldrich, while protocatechuic acid (≥99%), lutein (≥95%), lycopene (≥98%), ferulic (≥98%), isoferulic (≥98%), naringenin-7-glycoside (≥99%), naringenin (≥99%), lutein (≥99%) and zeaxanthin (≥98%) from Extrasynthese (Genay Cedex, France).

2.2. Processing

Cherry tomato (Solanum lycopersicum var. cerasiforme) and baby carrot (Daucus carota subsp. sativus), which did not comply with size and shape commercial standards, were kindly provided by Vitacress Portugal SA (Odemira, Portugal). The vegetables were washed and disinfected with sodium hypochlorite (150 ppm) for 15 min, in a proportion of water: vegetable of 5 L kg−1. After disinfection, the by-products were rewashed with abundant water and centrifuged to remove washing water. The by-products were submitted to two different processing methods (freezing and drying) and, in both cases, they were stored for 6 months.

2.2.1. Freezing

Based on a circular economy approach, tomato pulps were prepared by grinding whole tomatoes (including seeds and peels) for 2 min, using a vertical slicer blender (Hällde VCB-61). Due to the lower water content, carrots (also including peels but excluding stem) were ground in the same conditions using a carrot: water ratio of 4:1. After processing, the tomato and carrot pulps were frozen at −20 °C, and the sampling times were fresh, M0, M1, M2, M3, M4, M5 and M6. The timepoint M0 corresponded to 24 h after the freezing storage, and M1, M2, M3, M4, M5 and M6 corresponded to month one, two, three, four, five and six of the freezing storage, respectively.

2.2.2. Drying

The carrot and tomato drying process was carried out using a hot air cabinet dryer, with a temperature of 50 °C and an air velocity of 1 m s−1. By-products were cut into slices before drying. Tomatoes were manually cut in halves while carrots were laminated in a vegetable cutting machine (Hallde RG-100, Sweden), with a 5 mm thick disc. The dry by-products were also stored for 6 months under vacuum conditions. Due to the greater stability of dried vegetables, the sampling times were every two months. The sampling points were DM0, DM2, DM4 and DM6, where DM0 corresponded to day 0 of storage and DM2, DM4 and DM6 corresponded to months two, four and six of the storage period, respectively. Regarding microbiological analyses, only DM0 and DM6 sampling points were evaluated.

2.3. Microbiological Evaluation

2.3.1. Fresh and Frozen Pulps

For microbiological analysis, 1 g of carrots or tomatoes non-washed, washed, or in pulp form was added to 9 mL of sterile 0.1% peptone solution. The mixture was homogenized in a stomacher (Seward, Worthing, UK) for 1 min and then, the dilutions prepared were spread in the different microbiological media. Total aerobic bacteria (TAB) were enumerated after incubation for 72 h at 30 °C in PCA media according to the method of ISO 4833-1, while Enterobacteriaceae were grown in VRBGA at 37 °C for 24 h. Yeasts and molds were incubated on supplemented media RBCAat 30 °C for 3 to 5 days. The Bacillus cereus group was grown and counted on mannitol egg polymyxin agar at 30 °C for 24 h. All analyses were performed in duplicate and the average values were expressed in log (CFU g−1).

2.3.2. Dried Powders

Regarding microbiological analyses of dry by-products, for the enumeration of TAB, the test sample was prepared by adding 10 g of dry by-product sample to 90 mL of buffered peptone water in a stomacher bag. A tenfold dilution series was done in duplicate, 1 mL of the dilutions was spread-plated onto PCA and incubated as described previously. The enumeration of aerobic and anaerobic spore-formers was performed according to Ijabadeniyi et al. [13]. Firstly, the test sample was also prepared in the same way. Then, the stomacher bag was held at 75 °C for 20 min. A dilution series was done and after that 0.1 mL of the sample was pipetted into Petri dishes and pour-plated into TSA. Both aerobic and anaerobic plates were incubated at 35 °C for 48 h. The anaerobic plates were placed into anaerobic jars and incubated under anaerobic conditions. All analyses were performed in duplicate and the average values were expressed in log (CFU g−1).

2.4. Monitorization of Pulps Viscosity

The pulps viscosity was measured in mPa s−1 using a rotational springless viscometer B-one plus (Lamy Rheology Instruments, Champagne au Mont d’Or, France), using an R-2 rotor disc (with a viscosity range between 200 and 240 M mPa s−1) at a speed of 250 rpm for 30 s. All measurements were carried out five times for each sample at room temperature.

2.5. Preparation of Tomato and Carrot Extracts

Extracts for the evaluation of total phenolic compounds, polyphenolic profile and antioxidant activity were prepared by adding 5 g of each homogenized fraction (fresh, frozen pulp or dry by-product) to 50 mL of 80% methanol (methanol: water). Homogenization was carried out in an Ultra-turrax® (T18 IKA, Wilmington, USA) at 12,000 rpm for 30 s. The mixture was left under continuous stirring (300 rpm) at room temperature for 2 h. Afterward, each resulting sample was centrifuged at 5000 rpm at 4 °C for 10 min, and the supernatant was filtered. The methanol was then removed from the extracts using a rotary evaporator (R-210, Buchi, Switzerland) at 40 °C and 175 bar. The resultant fraction was resuspended in deionized water with 2% of maltodextrin and lyophilized for further analysis. All extracts were performed in duplicate.

2.6. Antioxidant Activity

2.6.1. 2,2′-azino-bis(3-ethylbenzothiazoline-6-sulphonic acid (ABTS) Assay

2,2′-azino-bis(3-ethylbenzothiazoline-6-sulphonic acid (ABTS) scavenging assay was carried out accordingly to the Gonçalves et al. established method [14], with slight modifications. The stock solution was prepared by the reaction between ABTS•+ (7 mM) with potassium persulfate (2.45 mM) in ultra-pure (UP) water, stirring for 16 h in the dark at room temperature. Daily, the ABTS•+ working solution was prepared by the filtration of stock solution with a 0.45 µm syringe filter, and the absorbance at 734 nm was adjusted to 0.70 ± 0.02 with UP water for the control sample (20 µL UP water + 180 µL ABTS•+ working solution). The reaction was performed in a 96-well microplate, in a final volume of 200 µL, where 20 and 180 µL of extract sample and ABTS•+ working solution were mixed, respectively. Moreover, a blank with UP water as well as a standard curve with Trolox were performed with the same solvent and working solution proportion, where standard concentrations ranged between 25 and 175 µM. After that, the mixture was allowed to react for 5 min in the dark, and the absorbance was immediately recorded at 734 nm, using a multidetection plate reader (Synergy H1, Vermont, USA) operated using the Gen5 Biotek software version 3.04. The scavenging activity was expressed as a % of reduction in absorbance for the control. All extracts were analyzed in triplicate, and after the calculation of regression equations, the Trolox concentration was expressed in mg Trolox equivalent (TE) 100 g−1 of dry matter (DM).

2.6.2. Oxygen Radical Absorbance Capacity (ORAC) Assay

Oxygen radical absorbance capacity (ORAC) assay was carried out as described by Coscueta et al. [15], with few modifications. The reaction was performed in black polystyrene 96-well microplates (Nunc, Denmark), with 75 mM of phosphate buffer (pH 7.4) in a final volume of 200 µL. Fluorescein (with a final concentration in the well of 70 nM; 120 µL) and antioxidant extract (20 µL) were placed in the well and pre-incubated for 10 min at 37 °C. After this period, APPH solution was added (with a final concentration in the well of 12 mM; 60 µL). Then, the incubation occurred immediately during 80 min, also in a multidetection plate reader. The excitation and emission wavelengths were set to 485 and 538 nm, respectively. The fluorescence was read in intervals of 1 min, and after each time point, the microplate was shaken. A calibration standard curve (with concentrations ranging between 1 and 8 µM of Trolox) and a blank (fluorescein + AAPH), where phosphate buffer was added instead of the antioxidant, were also added. The curves of antioxidants were normalized to the curves of blank of the same assay, and the area under the fluorescence decay curve (AUC) was calculated, with the trapezoidal method. The final values of AUC were obtained by subtracting the AUC of the blank to all results, and regression equations of antioxidant concentration in the function of AUC were calculated. All extracts were analyzed in duplicate, and ORAC values were expressed in mg TE 100 g−1 DM.

2.6.3. 2-diphenyl-1-picrylhydrazyl (DPPH) Assay

The 2-diphenyl-1-picrylhydrazyl (DPPH) assay was performed using the method described by Schaich et al. [16], with some alterations. The stock solution (600 μM) was prepared by dissolving 24 mg of DPPH in 100 mL of methanol. The stock solution was stored in the dark at −20 °C until the day of use. Daily, the working solution (60 μM) was prepared by adjusting the absorbance with methanol to 0.600 ± 0.100 at 515 nm. The assay was also carried out in a 96-well microplate, in a final volume of 200 µL. The reaction mixture corresponds to 175 μL of DPPH working solution and 25 μL of each extract or trolox (standard curve ranging between 25 and 175 μM) or UP water (negative control). The mixture was incubated for 30 min at 25 °C in the dark. Then, the absorbance at 515 nm was also measured with a multidetection plate reader. The scavenging activity was expressed as % of reduction in absorbance concerning the control and the regression equations between net DPPH scavenging and Trolox concentration were calculated. The Trolox concentration was expressed in mg TE 100 g−1 of DM. All extracts were analyzed in triplicate.

2.7. Total Phenolic Content (TPC)

To quantify total phenolic content (TPC), the Folin–Ciocalteau colorimetric method was used as described by Ainsworth et al. [17], with slight variations. The reaction was performed in a 96-well microplate, with a final volume of 230 µL. Firstly, 30 µL of extract and 100 µL of Folin-Ciocalteu reagent (20% v/v) were mixed and then, 100 µL of sodium carbonate (7.4% m/v) were added and shaken. The mixture was incubated at room temperature in the dark and the absorbance was measured after 1 h at 750 nm, also in a multidetection plate reader. Gallic acid was used as a standard calibration curve (0.015–0.225 mg/mL), and the TPC was expressed as milligrams of gallic acid equivalent per 100 g of dry matter (mg GAE 100 g−1 DM).

2.8. Identification and Quantification of Phenolics by High-Performance Liquid Chromatography (HPLC)

The phenolic profile in the extracts from different sampling points under study was evaluated using a chromatographic system with Waters separation module (e2695), with UV–VIS detector (PDA 190–600 nm), as described by Campos et al. [18], with some modifications. The high-performance liquid chromatography (HPLC) separation was performed with a C18 reverse-phase column coupled to a pre-column (Symmetry® C18, Waters, Milford, MA, USA; 100 Å, 5 µm, 4.6 mm × 150 mm). Two mobile phases were used: phase A containing water (92.5%), methanol (5%) and formic acid (2.5%), while phase B consisting of methanol (92.5%), water (5%) and formic acid (2.5%). The injection volume was 50 µL, and HPLC run was carried out for 59 min in a continuous flow of 0.5 mL min−1, under the following conditions: gradient elution started in 100% of mobile phase A and ended in 55% of mobile phase B, after 55 min; between 50 and 55 min, the mobile phase A returns to 100% and remains in that percentage for 4 min (up to 59 min). Detection was performed using a diode array detector (Waters, Milford, MA, USA) at wavelengths between 200 and 600 nm, measured at 2 nm intervals. The peaks were identified at wavelengths of 280 nm (catechins or procyanidins), 320 nm (phenolic acids) and 350 nm (flavonoids). The various compounds identified were analyzed by comparing the retention time and spectra with pure standards. All the samples replicates were injected in duplicate.

2.9. Monitorization of Carotenoid and Vitamin E Content

2.9.1. Carotenoids and Vitamin E Extraction

Total carotenoids and vitamin E isomers (α-tocopherol, β-tocopherol, γ-tocopherol and δ-tocopherol) were extracted according to the method described by Prates et al. and Oliveira et al. [19,20], with some modifications. Briefly, 0.1 g of each homogenized sample (fresh, frozen pulp or dry by-product), 3 mL of 100% cold ethanol and 0.026 g of ascorbic acid (9 g L−1) were added to the screw teflon-lined cap tube and mixed. For saponification, 380 µL of KOH (5 mol L−1 prepared in a solution of 55% absolute ethanol and 45% UP water), freshly prepared each week, were added to the mixture. The mixture was immediately vortexed to avoid agglomeration and remained in a shaking water bath at 85 °C and 200 rpm for 10 min. The mixture was then cooled and maintained on ice during the extraction procedure. Firstly, 3 mL of NaCl (1 mol L−1) were added, and the samples were gently mixed. Secondly, 3 mL of 25 μg mL−1 BHT solution in n-hexane was added. The mixture was vigorously vortexed and centrifuged at 5000 rpm for 15 min (at 4 °C),the resultant upper n-hexane layer was transferred to a new screw teflon-lined cap tube. Finally, the residue was re-extracted under the same conditions, and the second n-hexane layer was also recovered and merged with the first one. For each time point, three independent extractions were carried out.

2.9.2. Identification and Quantification of Carotenoids by HPLC

Carotenoid profile was identified and quantified by determination of the absorbance at 454 nm with a UV mini 1240 spectrophotometer (Shimadzu, Tokyo, Japan), according to the method described by Oliveira et al. [19], with slight alterations. The mobile phase used was acetonitrile, methanol, dichloromethane, hexane and ammonium acetate (55:22:11.5:11.5:0.02 v/v/v/v/w). HPLC run was carried out under isocratic conditions at 1 mL min−1 flow rate for 20 min at 30 °C. The injection volume was 50 μL. The different carotenoids identified at 454 nm, namely, lutein, lycopene, β-carotene and α-carotene, were identified by comparing the retention time with pure standards and quantified using a pure standard calibration curve and were expressed as mg 100 g−1 DM of by-product. All the samples’ replicates were injected in duplicate.

2.9.3. Identification and Quantification of Vitamin E by HPLC

The α-tocopherol, β-tocopherol, γ-tocopherol and δ-tocopherol were monitored following the HPLC method described by Savlin et al. [21], with some modifications. A Beckman System Gold® coupled to a Waters™ 474 Scanning Fluorescence Detector (with an excitation and emission wavelengths of 290 and 320 nm, respectively) and a Diode Array Detector (DAD) 168 Detector (210 nm) with a Varian ProStar Model 410 AutoSampler were used, recurring to a normal-phase silica column (Kromasil 60-5-SIL, 250 mm, 4.6 mm ID, 5 µm particle size). The mobile phase used corresponded to 1% v/v isopropanol in n-hexane. The running time was 20 min at 1 mL min−1 flow rate, and the injection volume was 20 µl. Calibration curves of pure standards were prepared and used to identify and quantify α-tocopherol, β-tocopherol, γ-tocopherol and δ-tocopherol in samples, and their concentration was expressed as mg 100 g−1 DM of carrot and tomato by-product. All the samples’ replicates were injected in duplicate.

2.10. Statistical Analysis

Statistical analysis was carried out using the SPSS statistical package 27.0 via a one-way analysis of variance (ANOVA), at a degree of significance of p < 0.05, to the viscosity, antioxidant capacity, TPC, phenolics, carotenoids and vitamin E content, except for microbiological counts, where only two independent analyses were performed. Firstly, data were compared statistically using ANOVA to understand the significance and confirm a normal distribution of the data. Finally, post hoc multiple comparisons were performed using Turkey’s test (p < 0.05).

3. Results and Discussion

Based on a circular economy approach, cherry tomato and baby carrot that do not comply with commercial standards were used as by-products to prepare value-added pulps and powders. The impact of two processing methods on several bioactive properties was evaluated. Regarding pulps, their storage was for 6 months in freezing form, and all analyses were performed monthly. By-products from the same batch were also subjected to hot air drying and stored under vacuum conditions, being analyzed every two months. The microbial counts of dried by-products were only monitored in the initial and final phases of storage.

3.1. Monitorization of Microbial Counts

The microbiological analysis of fresh by-products suggested a high microbial load in baby carrot and cherry tomato as present in Table 1. The initial microbial load was considerably high in both vegetables for all microbial groups studied, especially in carrots due to the greater soil microbial contamination [22]. Microbiological control plays an important role in the prevention of foodborne diseases. Therefore, some decontamination agents, for instance, sodium hypochlorite and peroxyacetic acid, are often applied during the washing process to guarantee the safety of fresh vegetables [22]. The initial microbial load of fresh tomato and carrot was greatly reduced after washing with water and disinfection with sodium hypochlorite solution (Table 1).
According to the Portuguese national microbiological guidelines for ready-to-eat foods, samples are classified as satisfactory, for example, when the microbial counts of TAB, Enterobacteriaceae, yeasts and Bacillus cereus spp. are lower than 6, 5, 5 and 3 log (CFU g−1) [23]. Although the study did not focus on ready-to-eat products (in the future, after demonstrating their potential, these by-products can be used in food formulations or for cooking), before washing and disinfection, these products were above these limits and classified as unsatisfactory, and after this process, tomato and carrot were within satisfactory limits. This fact corroborates the importance and effectiveness of the wash and disinfection process adopted.
During the 6 months of frozen storage, the microbial load stabilized, and there were no substantial variations on microbial counts during the entire period as represented in Table 1. Generally, after 6 months of storage at room temperature of the dry by-products, the microbial counts in the tomato and carrot powders decreased slightly for the microbial groups studied, except for the aerobic and anaerobic spore-formers group where a slight increase of microbial counts was observed in the carrots powders. These results are in agreement with those observed for dried spices described by Ijabadeniyi et al. [13].

3.2. Monitorization of Pulps Viscosity

The viscosity was measured during the freezing period in pulps and, in both cases, a significant decrease in viscosity after freezing was visible as suggested in Table 2. The viscosity decreases from 486.98 ± 1.40 mPa s−1 in the fresh pulps to 349.28 ± 2.92 mPa s−1 in M6 of storage in baby carrot pulp. Although the decline in viscosity was more evident in the first months of freezing, a significant decrease in carrot pulp viscosity was registered throughout the storage period, except from M5 to M6 where there were no significant changes in viscosity values. Relating to cherry tomato, the variation in viscosity was also more evident in the first months of frozen storage, but the results suggest significant variations in viscosity values in all months analyzed. The viscosity values ranged between 195.88 ± 3.73 mPa s−1 in the fresh pulp to 100.34 ± 1.39 mPa s−1 in the final month of storage. The ice crystals produced during the frozen process may promote damage to the integrity of the cellular membranes. Consequently, the resultant loss of water from the intracellular compartments affects physio-chemical and physical properties such as viscosity [10,12]. Generally, lower textural properties are reported in frozen plant foods compared to the corresponding fresh vegetables and fruits [10], aligned with the decline in tomato and carrot viscosity during the storage period verified (Table 2). As suggested by the work of Lisiewska et al. [24], the freezing storage at −20 °C of tomato cubes resulted in a significant reduction of texture.

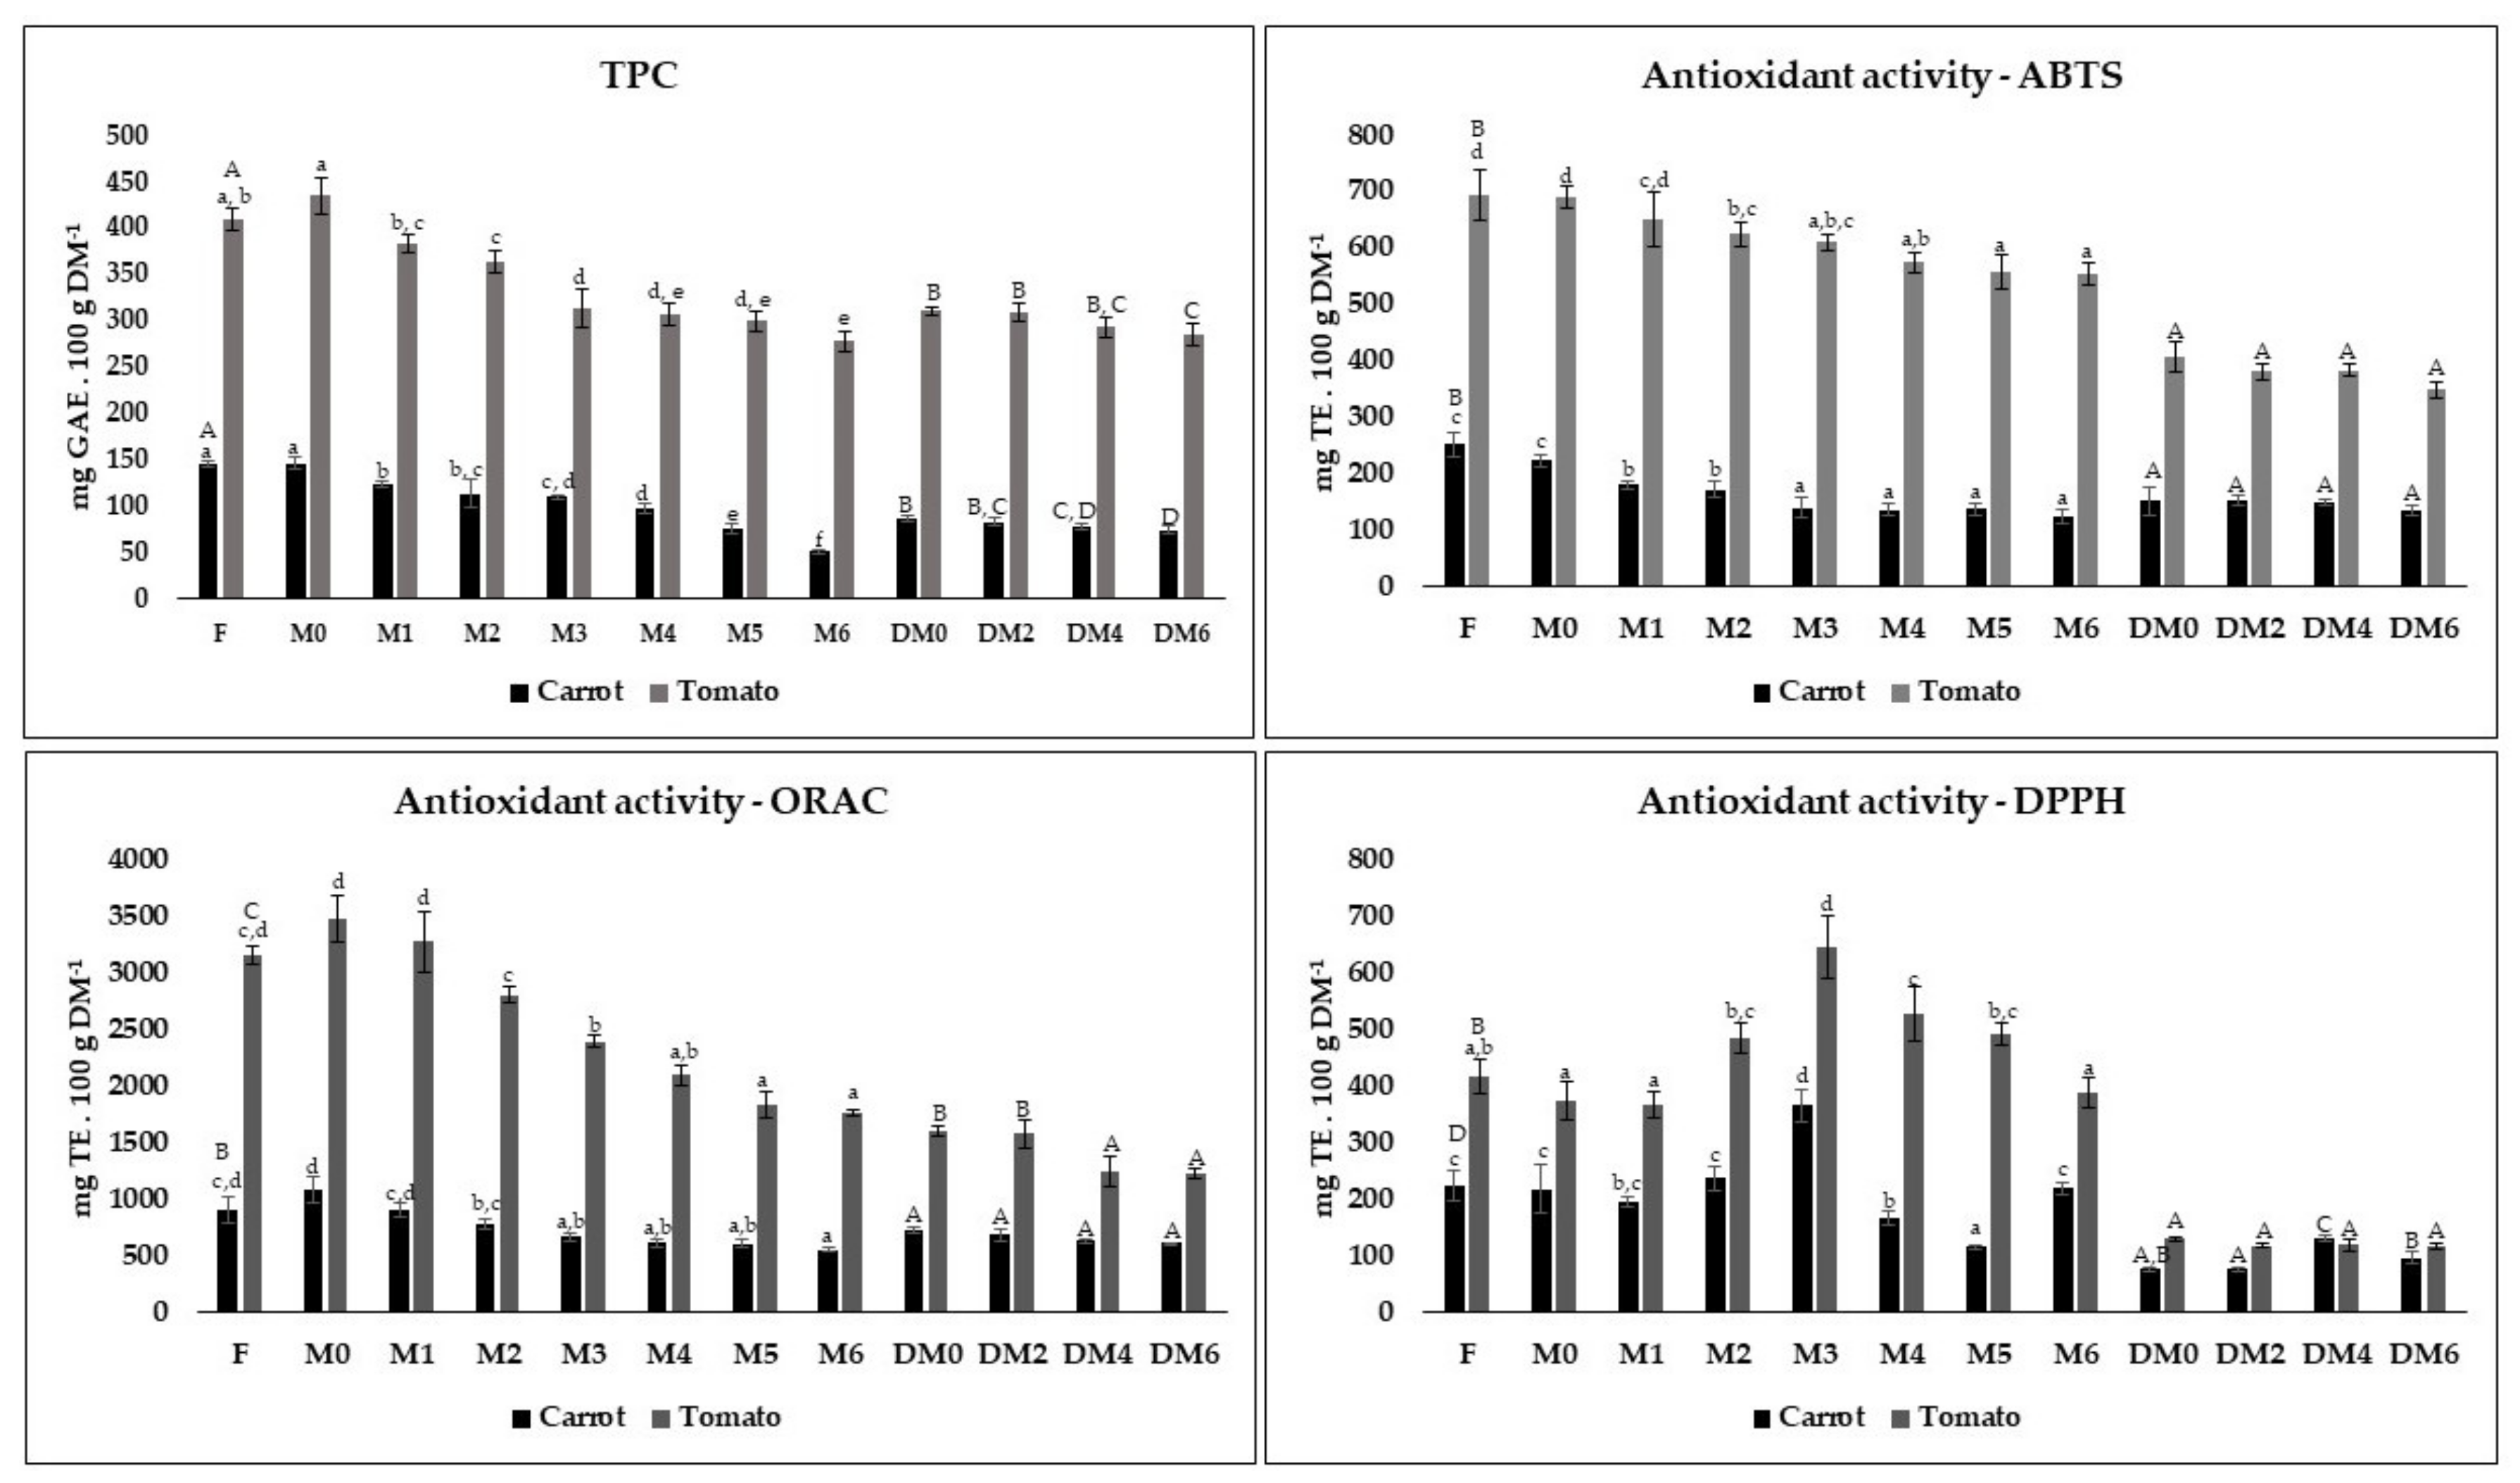
3.3. Variation of TPC and Antioxidant Activity

TPC was evaluated during 6 months for both storage types (frozen and dried) as represented in Figure 1. The compounds extraction was performed through methanolic extractions. The TPC results of fresh baby carrot and cherry tomato pulps and after 24 h of freezing did not suggest significant variations in TPC. However, in both cases, a decrease was verified after one month of frozen storage, and a sequential reduction in TPC values was registered during the 6 months of storage. The TPC values in fresh carrot pulp ranged between 145.21 ± 2.74 and 50.09 ± 2.99 mg GAE 100 g−1 on a dry basis after 6 months of freezing, while in tomato fresh pulp the TPC were 408.89 ± 12.11 and 277.24 ± 11.29 mg GAE 100 g−1 DM after all period of frozen storage. In the case of tomato, after 4 months of freezing, the TPC values indicated a tendency to stabilize.
Bouzari et al. [25] also studied the TPC in fresh carrots and during 3 months of storage. The results suggested a TPC concentration of 108 mg GAE 100 g−1 DM in fresh carrots and a slight improvement in TPC after 24 h of freezing with values around 133 mg GAE 100 g−1 DM. During 3 months of freezing storage, the TPC concentration decreased to approximately 112 mg GAE 100 g−1 DM. These values are in the same concentration order and aligned with the results of the present study. Leja et al., work [26] also reported similar TPC values for fresh carrots, namely 29.3 mg 100 g−1 of fresh weight (based on the dry weight of carrot in the present study: 7.96%). TPC of red tomato through the preparation of acetone: water extracts was described by Georgé et al. [27], being around 268 mg GAE 100 g−1 DM in fresh tomato. Phenolic composition and antioxidant activity of some tomato varieties and by-products (composed only by peel and seeds) were studied by Perea-Domínguez et al. [28], through ethanolic extracts. The TPC results of grape, saladette and tomato by-product were 904, 1108 and 1340 mg GAE 100 g−1 DM, respectively. The reported TPC results of Georgé et al., are slightly lower, while the TPC results of Perea-Domínguez were higher than the TPC values of the present study. These differences may be due to the different tomato species studied, or even due to the different extraction methodologies (different solvents, different times of residency and different proportions of sample and solvent) employed, leading to different extraction profiles of phenolic compounds and consequent antioxidant activity [18]. In the present study, the whole vegetable by-product was used for processing, including seeds and peels in tomatoes and including peels but excluding stem in carrots. This fact may also contribute to the variations found in the literature, but especially the conditions where they were produced. There are some conflicting results in the literature regarding the effect of the freezing process and frozen storage upon TPC and antioxidant activity [10,12]. As previously appointed, the cell breakages promoted during freezing can lead to the decompartmentalization of antioxidants. Their posterior interaction with oxidative enzymes can lead to a reduction in antioxidant concentrations compared with fresh forms. However, some authors’ results have also indicated an improvement in functional properties during the frozen storage due to the possible release of bound phenolic acids and anthocyanins [10]. The conflicting reported results may result from the several pre-treatments used after the freezing and frozen storage, the frozen systems and conditions used as well as other intrinsic characteristics of vegetables and fruits [10,12].
Concerning drying, the TPC values varied between 85.49 ± 3.48 and 73.47 ± 4.28 mg GAE 100 g−1 in carrot and 310.33 ± 10.38 and 283.64 ± 11.84 mg GAE 100 g−1 DM in tomato, during the dried by-products storage. The results showed a significant variation in TPC after the drying process comparatively with fresh pulps, but there were no key variations during the several months of storage analyzed. Previous studies corroborate that drying decreases phenolic content in tomato [29] and carrot [7]. The grounding process promotes cell membrane damage, similar to what happens during the freezing process, making these compounds more unstable. This higher instability coupled with the use of temperature in the drying process can explain this reduction [30]. Hung et al. also evaluated the TPC present in carrot and tomato after drying processing [7]. In this study, carrot and tomato (without seeds) were dried in an oven at 55 °C and the results were compared with the freeze-drying method. Ethanolic extracts were prepared, and the results suggested a significant decrease in TPC of vegetables resultant from heat-drying. The TPC of carrot was approximate, 2.16 mg GAE 100 g−1, while TPC of tomato was around 3.31 mg GAE 100 g−1 of samples. The results also suggested that, as expected, the TPC values of freeze-drying vegetables were higher than the vegetable resultant from heat-drying vegetables. However, the TPC values were lower than those of the present study but reported as fresh weight. In the case of our study, cherry tomatoes possess a dry weight of around 10.71%. Other justifications for TPC variations are the type of extraction used, the vegetable variety used and still, Hung et al., did not use air circulation during heat-drying, which may lead to losses of bioactive compounds [7]. Kamiloglu et al. [31] work reported the effects of tomato home drying at 70 °C for 36 h by preparing 75% methanolic extracts. The TPC values of fresh tomato and after the drying process were approximately 274 and 157 mg GAE 100 g−1 DM, respectively. In this study, a significant decrease was also suggested after the drying process, aligned with the present study results. Despite the results being in the same order of magnitude, they were slightly inferior to our study. Tomato variety and the use of a conventional oven could be conditioning factors.
The antioxidant capacity of methanolic extracts was evaluated by ABTS, ORAC and DPPH assays, being the results in fresh, during freezing and drying storage also present in Figure 1. ABTS and ORAC assays were used to monitor antioxidant capacity variations due to hydrophilic and amphipathic compounds, while the DPPH assay was used to evaluate the contribution of lipophilic compounds to the total antioxidant activity [16].
The ABTS results suggested a significant decrease in total antioxidant activity after the first month of freezing in both pulps, but no significant variations were verified in the case of carrot after M3 of freezing and M4 and M5 in the case of tomato. In tomato pulps the ABTS capacity values ranging between 694.07 ± 45.00 and 558.73 ± 29.06 mg TE 100 g−1 on a dry basis in fresh and M5 of freezing storage, respectively. Regarding carrot, the results of fresh pulps suggested an antioxidant capacity of 252.74 ± 21.83 mg TE 100 g−1 DM, decreasing until around 140.82 ± 16.76 mg TE 100 g−1 DM in M3 of storage. Danesi et al. [32] also studied the impact of freezing (−18 °C) and storage during 6 months of different vegetables, including tomato and carrot. In tomato, no significant variations were registered, while in carrot, a decrease in antioxidant capacity was verified. In this study, the results also suggested that tomato possess a higher antioxidant capacity than carrot and that the impact of freezing in antioxidant activity largely depends on the type of vegetable.
The ABTS antioxidant capacity of dry by-products significantly diminished compared with fresh vegetables. However, no significant differences in the antioxidant capacity were registered during the storage time, varying between 350.15 ± 14.37 and 407.56 ± 25.93 mg TE 100 g−1 DM in tomato and 134.69 ± 8.68 and 153.13 ± 25.89 mg TE 100 g−1 DM in carrot. As previously indicated, Kamiloglu et al. [31] work reported the effects of home drying at 70 °C for 36 h. The antioxidant capacity of fresh was 432 mg TE 100 g−1 DM, decreasing significantly until 46 mg TE 100 g−1 DM. The results of the antioxidant capacity of fresh tomatoes were similar to those of this study. However, the reduction in antioxidant activity was more pronounced in the reported study, possibly for the reasons previously mentioned. Previous studies also suggested a significant decrease in antioxidant capacity using hot air drying using temperatures of 50 °C and 100 °C [33].
The results of the ORAC assay indicated an increase in antioxidant capacity in the first period of storage. In the case of tomato, a significant increase until M1 of storage was visible. On the other hand, in carrot a significant rise was registered after 24 h of freezing and in M1 no significant differences were registered compared with the antioxidant capacity of fresh carrot. The antioxidant capacity of fresh tomato and after one month of freezing was 3165.18 ± 77.48 and 3285.77 ± 271.25 mg TE 100 g−1 DM, respectively. Regarding carrot, the antioxidant capacity increase from 907.98 ± 121.69 in fresh pulp to 1091.90 ± 113.28 mg TE 100 g−1 DM after 24 h of freezing, being 914.06 ± 59.88 mg TE 100 g−1 DM in M1 of storage. After these periods, the ORAC results also indicated a decrease in antioxidant capacity during freezing storage, with a tendency to stabilize from M4 of storage in the case of tomato and M3 in the case of carrot. The antioxidant capacity of tomato and carrot after 6 months of frozen storage was 1771.66 ± 31.25 and 557.71 ± 11.19 mg TE 100 g−1 DM, respectively. During ORAC results analysis, a significant decline in the antioxidant capacity was shown compared with fresh forms in both vegetables. However, in the case of carrot no significant variations were verified during all storage period, ranging the antioxidant capacity between 613.53 ± 5.81 to 722.93 ± 28.29 mg TE 100 g−1 DM. Concerning tomato results, key modifications were not detected during the first 2 months (1581.76 ± 124.90 and 1610.74 ± 46.51 mg TE 100 g−1 DM), but after this period, a significant decrease was registered after 4 months but then stabilized until M6 of storage (1229.74 ± 38.52 mg TE 100 g−1 DM).
In the evaluation of antioxidant capacity through the DPPH method, the antioxidant capacity of tomato and carrot improved during the first months of freezing, but then it reduced, being registered significant variations during the 6 months (Figure 1). The antioxidant capacity of fresh tomato was 418.79 ± 30.92 mg TE 100 g−1 DM, increasing until 648.06 ± 55.38 mg TE 100 g−1 DM in M3 and decreasing until the last month of freezing (388.53 ± 27.18 mg TE 100 g−1 DM). In carrot, the antioxidant capacity increased from fresh until M3 of freezing (from 223.21 ± 26.76 to 367.26 ± 28.92 mg TE 100 g−1 DM). Subsequently, the antioxidant capacity was reduced until 115.69 ± 4.49 mg TE 100 g−1 DM in M5 and improved until 219.43 ± 11.49 mg TE 100 g−1 DM in M6 of freezing, with significant variations. This could be explained by the loss of cellular membrane integrity promoted by freezing, which promotes bioactive compounds release (especially lipophilic) and increases antioxidant activity. However, after this phase, chemical and enzymatic reactions induce bioactive compounds degradation and antioxidant activity decrease [10].
As in the ABTS and ORAC methods, a significant decrease in antioxidant capacity was verified in dry tomato and carrot compared with fresh from the DPPH analysis. Although the results did not suggest variations during tomato storage (varying antioxidant capacity between 117.78 ± 4.99 to 130.44 ± 3.51 mg TE 100 g−1 DM), some alterations were registered in carrot storage from M4. The antioxidant capacity of dry carrot was 76.28 mg TE 100 g−1 DM in the first two months of storage, improving until 131.41 ± 5.22 mg TE 100 g−1 DM in M4 and decreasing until 96.87 ± 9.83 mg TE 100 g−1 DM in M6.
Generally, the reported studies suggested a decrease in TPC and antioxidant capacity by ABTS and ORAC assays during freezing and a significant negative impact in these properties and in the DPPH antioxidant capacity, aligned with the present study results. The variation between the different antioxidant assays tested results from the different reaction mechanisms underlying. In ABTS and ORAC assay differences, the radical possesses a higher molecular weight than the molecule of transfer mechanisms of hydrogen atom used in ORAC assay. Consequently, a steric block of the active centers of ABTS can occur, decreasing their reaction rate. The small molecules of atom transfer of ORAC assay, make this method considered more accurate as suggested by Campos et al. [18]. In contrast, some researchers also reported that ORAC assay is as a more relevant technique due to the use of a biological radical source. However, ORAC assay is a more time-demanding and expensive approach [34]. In the case of DPPH, organic solvents are required, being used mainly to evaluate the contribution of lipophilic compounds to the total antioxidant activity [16].

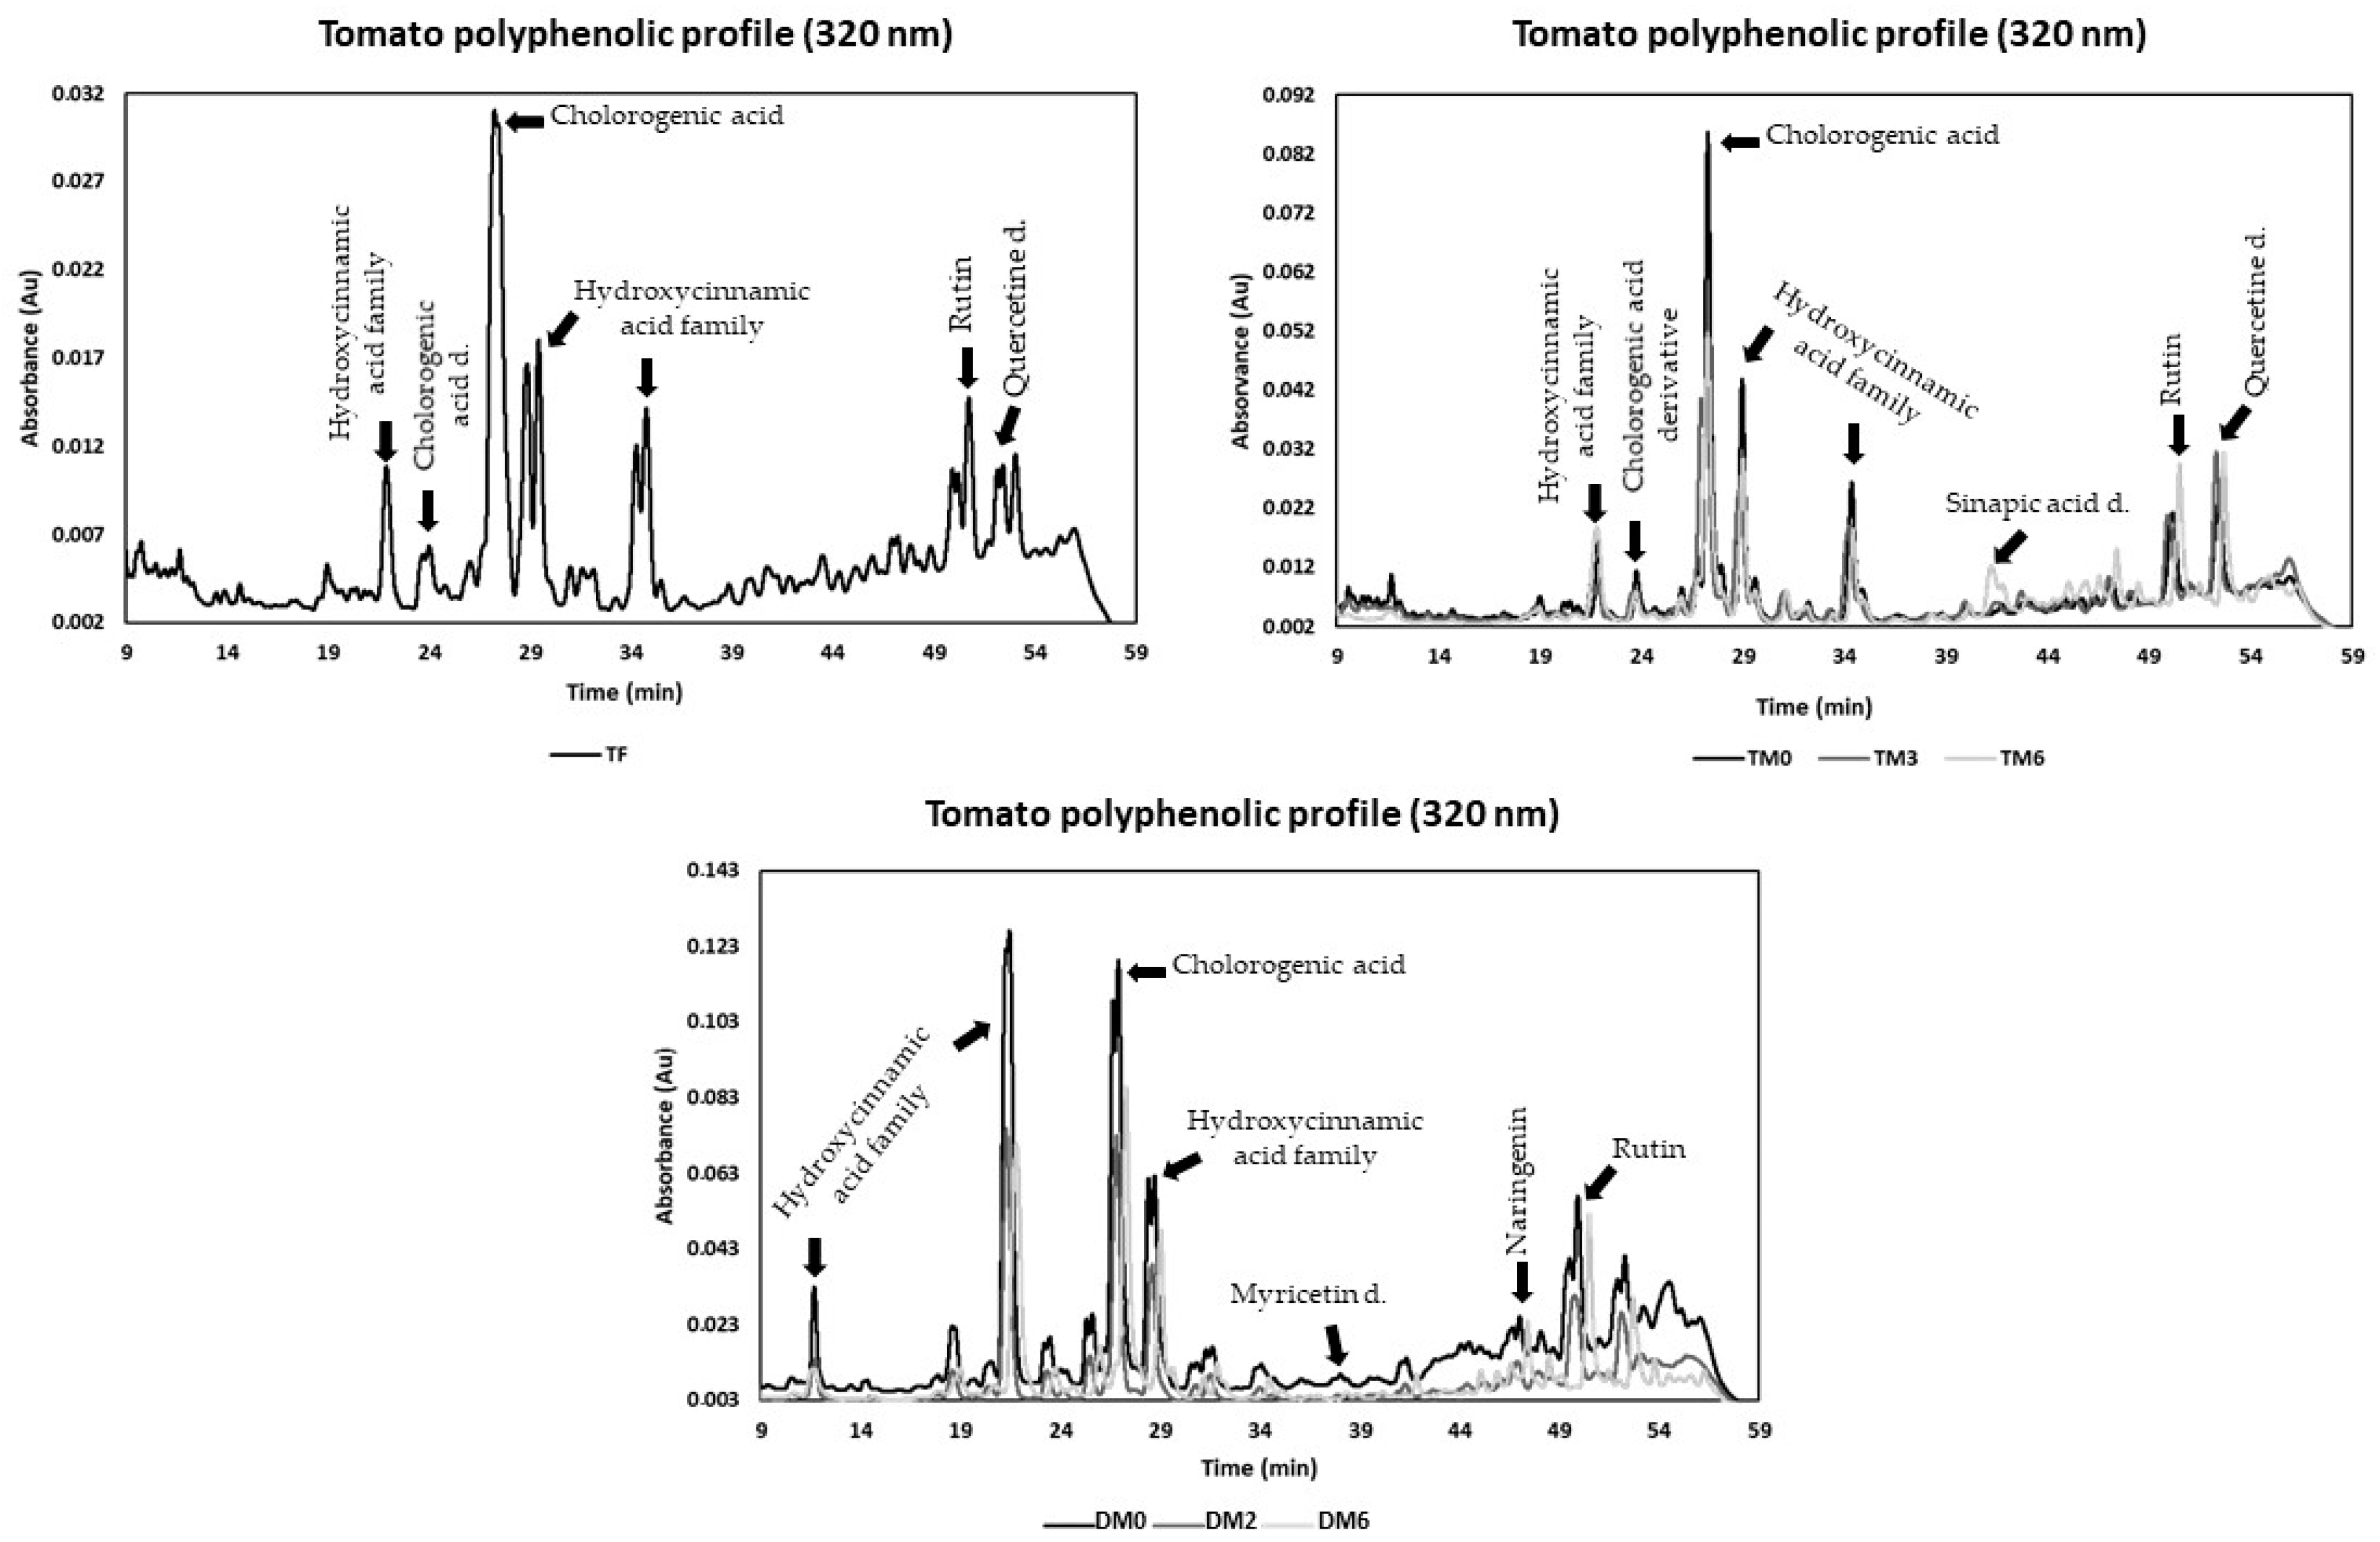
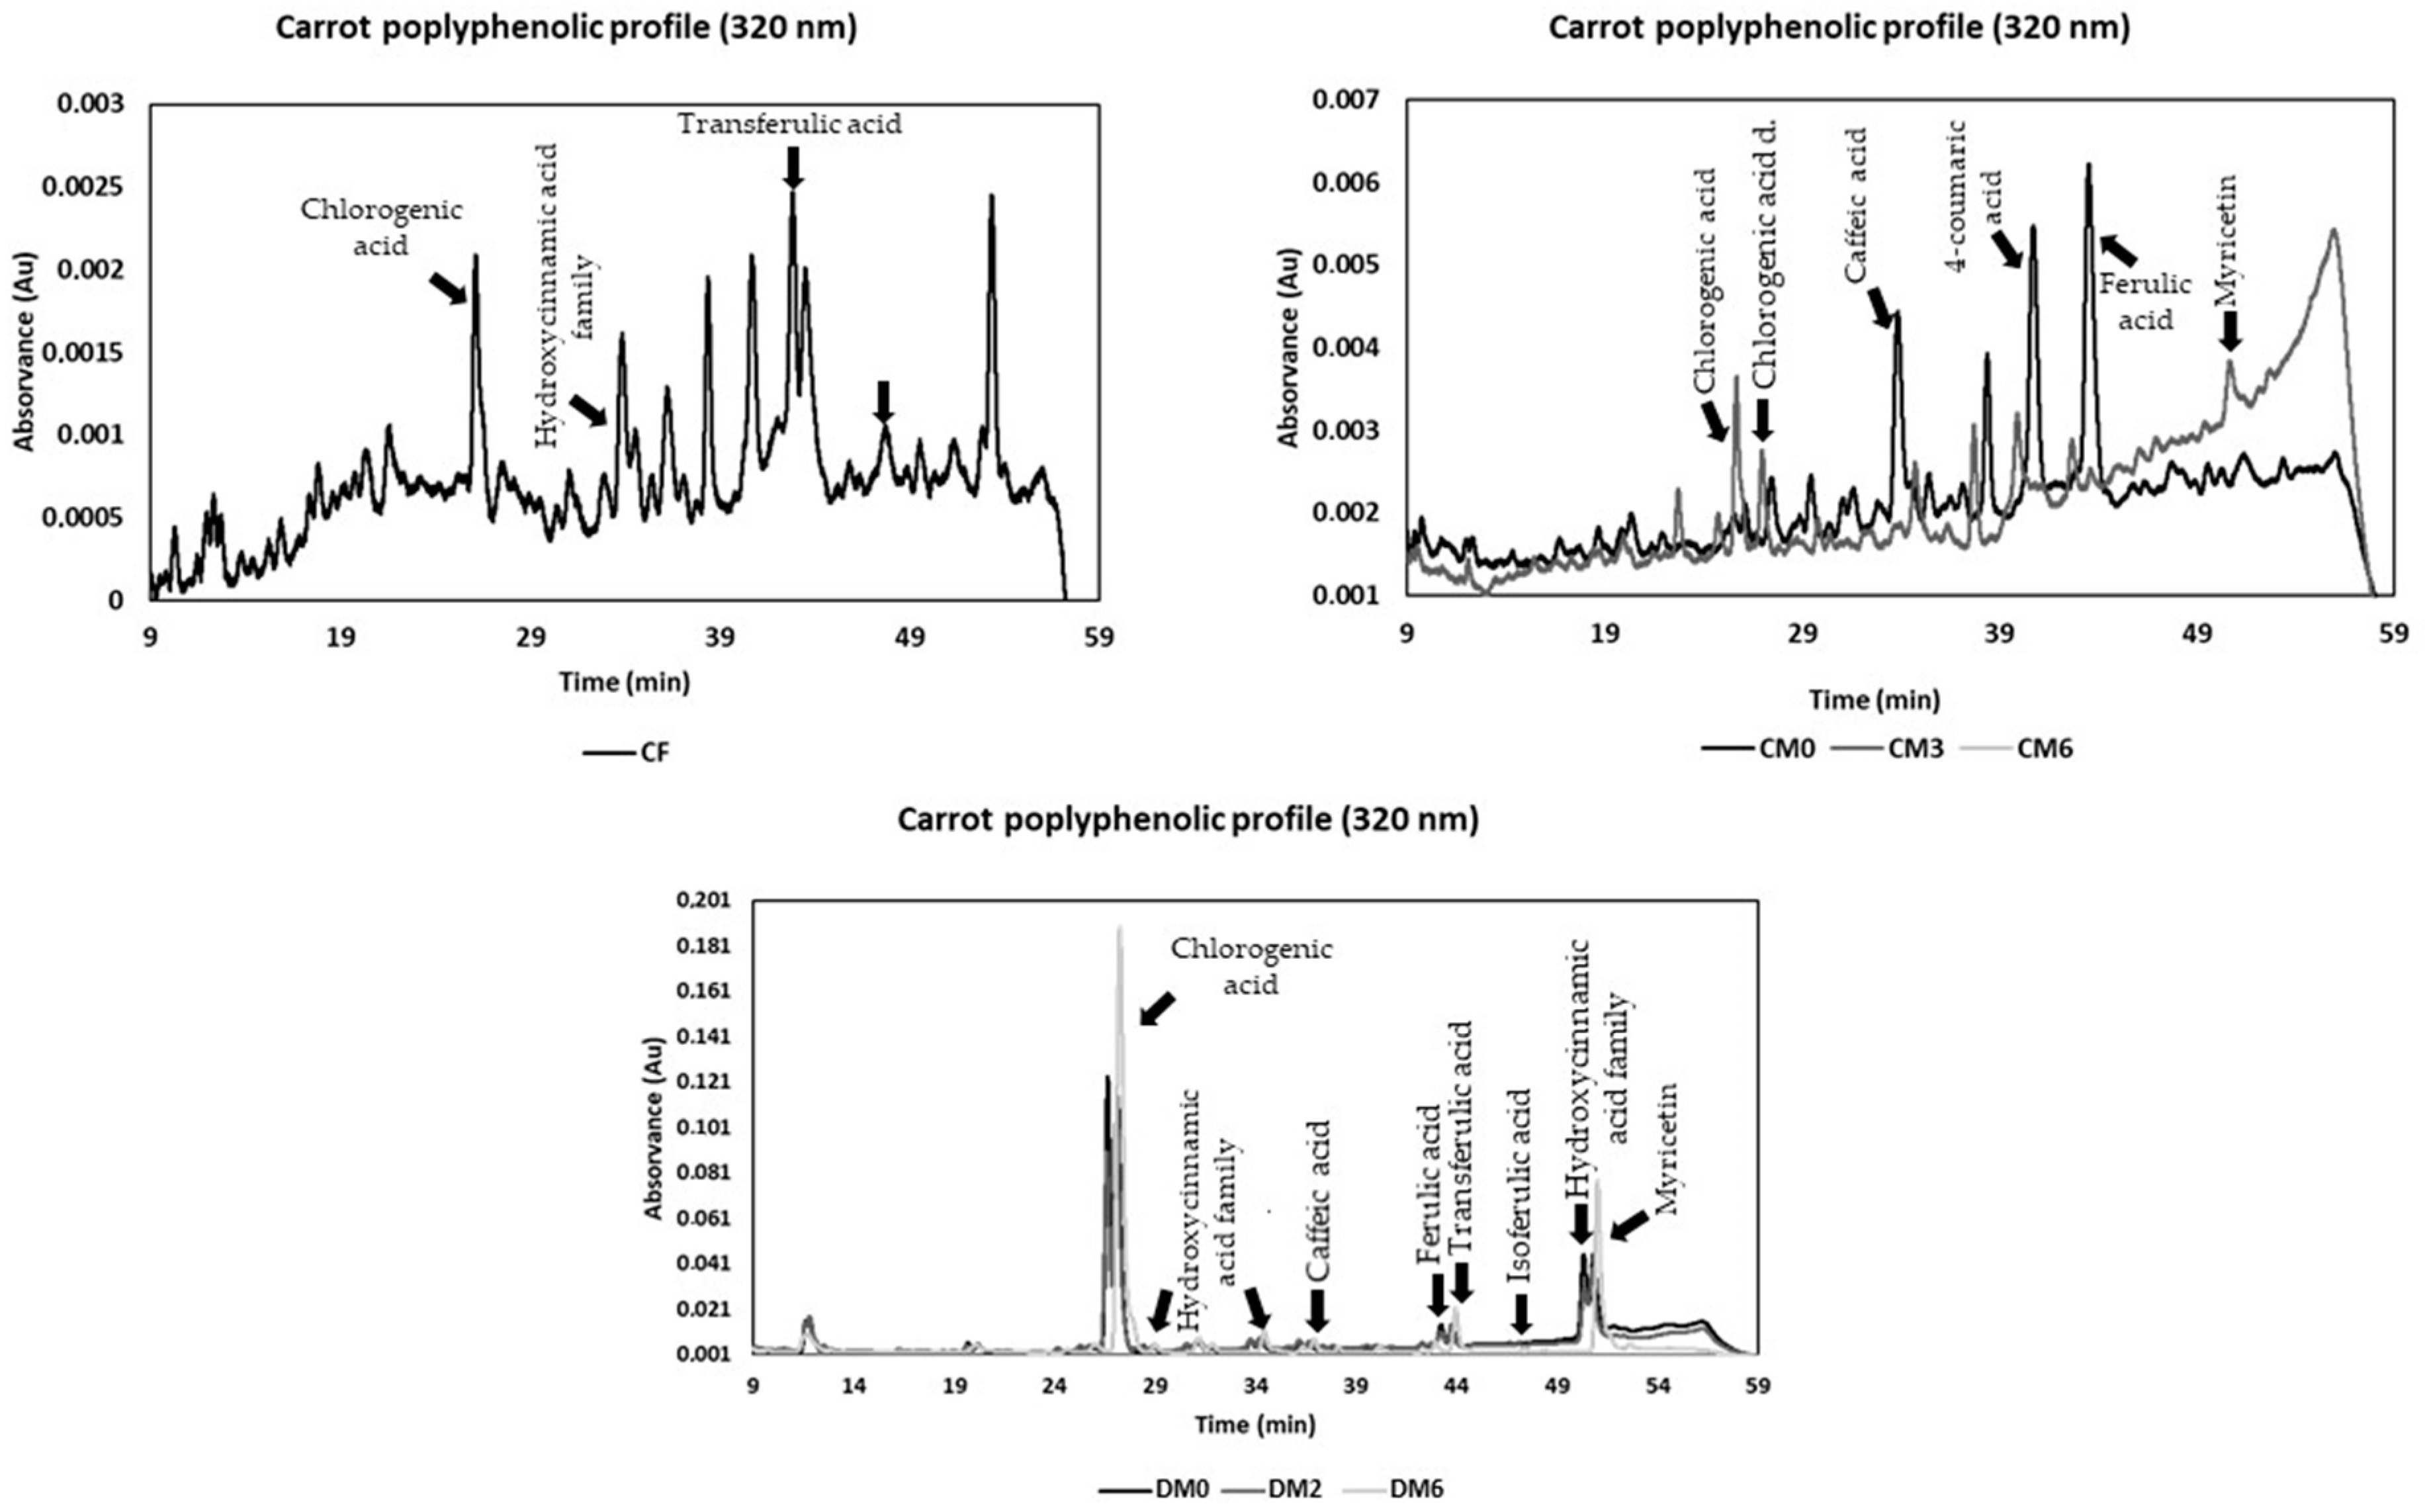
3.4. Phenolics Composition

Quantitative and qualitative determination of polyphenolic compounds present in cherry tomato and baby carrot by-products was performed by HPLC. The qualitative polyphenolic profile of fresh tomato and during frozen and dry storage are depicted in Figure 2, while their quantitative profile in Table 3, respectively. The quantitative analysis of tomato suggested the main presence of compounds belonging to the hydroxycinnamic acid family such as chlorogenic acid, sinapic acid and some derivatives of this group. Moreover, some flavonols, for instance, rutin, myricetin and quercetin derivative as well as the naringenin belonging to the flavanones groups were detected (Figure 2).
Chlorogenic acid was detected and quantified in fresh, frozen and dry tomato, with concentrations varying from 15.9 ± 0.1 to 32.4 ± 0.7 mg 100 g−1 DM during frozen storage and from 34.2 ± 0.2 to 38.0 ± 0.3 mg 100 g−1 DM. During freezing storage, a significant increase was registered after 24 h of freezing but, then, a significant decrease was verified in M1. After this period, no significant variations were found during storage. Concerning the drying approach, a significant improvement in chlorogenic acid concentration was verified but no variations during the storage period were registered. The rutin concentration varied from 8.0 ± 2.2 to 13.2 ± 1.3 mg 100 g−1 DM during the freezing storage. In this case, a significant increase until the final stage of freezing was registered. During drying storage, also a substantial improvement in rutin concentration with no variations during the time was detected. Sinapic acid, quercetin and naringenin derivatives were only detected on fresh tomato and during freezing storage, while naringenin at the dried tomato. Naringenin was the most incident phenolic compound in dry tomato, with concentrations ranging from 1132.2 ± 16.5 and 1311.5 ± 29.3 mg 100 g−1 DM. Regarding fresh and frozen tomato, a naringenin derivative was the most prevalent compound, with concentrations varied between 314.5 ± 93.8 and 556.0 ± 7.4 mg 100 g−1 DM.
The polyphenolic profile of tomatoes is consistent with the data found in the literature. Macheix et al. [35] reported the presence of some hydrocinnamic acid family derivatives, while chlorogenic acid, caffeic acid derivative compounds, rutin and naringenin chalcone were reported by Bénard et al. [36] in tomato. Moreover, Georgé et al. reported the presence of some phenolic compounds of the hydrocinnamic acid family such as chlorogenic, caffeic acid and its derivatives as well as rutin and naringenin in red tomato [27]. Regarding Kamiloglu et al., work [31], rutin and chlorogenic acid were also found in fresh and dried tomato and, naringenin was only found in dried tomato. This previous work suggested that the presence of naringenin only in dried tomato may result from the conversion of naringenin chalcone (present only in fresh tomato) into naringenin after hot-air drying at 70 °C for 36 h. This may be the reason why naringenin was only identified in dried tomatoes, while a naringenin derivative in fresh and frozen tomato. In Kamiloglu et al. work [31], the chlorogenic acid concentration was approximately 24 and 15 mg 100 g−1 DM in fresh and dried tomato while rutin concentration varied from 12 in fresh tomato to 9 mg 100 g−1 DM in dried tomato. These values are aligned with the results of the present study. As previously mentioned, the variations (the concentration of naringenin found in the dry product was also significantly lower) resulted mainly from the drying approach (conventional oven) and also HPLC conditions used.
The baby carrot qualitative polyphenolic profile is illustrated in Figure 3. The main polyphenolic compounds detected belonged to the hydroxycinnamic acid family, for instance, chlorogenic acid, transferulic, isoferulic and trans-ferulic acids, caffeic acid and (4-)p-coumaric acid. Moreover, myricetin from flavonols group was identified while protocathecuic acid of hydroxybenzoic acid family was found in M1 of frozen storage, as indicated in Table 4, where quantitative polyphenolic concentration was found.
The chlorogenic acid was the main phenolic compound detected in fresh, frozen and dry baby carrot by-products. No significant variation in concentration of this hydroxycinnamic acid was verified until M1 of storage (with a concentration of 2.48 ± 0.07 mg 100 g−1 DM in fresh carrot). After M1, the results suggested a significant improvement in its concentration, apparently stabilizing at M5 with a concentration value of 62.13 ± 0.41 mg 100 g−1 DM. Trans-ferulic acid was only detected in fresh carrot and M0 and M1 (but below the quantification limit). Protocatechuic acid was only quantified in M1 of freezing storage but detected during the total freezing period analyzed, but below the detection limit. The caffeic acid concentration was only detected since M2, with a concentration of 0.25 ± 0.02 mg 100 g−1 DM in M5 and 0.41 ± 0.03 and 0.18 ± 0.01 in DM0 and DM2, respectively. These results may suggest that caffeic acid was positively affected for both processing methods although despite being present in residual quantities.
The literature also aligned with the polyphenolic profile detected in the present study. Keser et al., work [2] reported the main presence of phenolic compounds of hydroxycinnamic acid in carrot powders. The chlorogenic acid and a caffeic acid derivative were the most incidents phenolic compounds, corroborating the results of this study. Moreover, other hydroxycinnamic acid family compounds were detected. Previous works also suggested that chlorogenic acid was the most prevalent phenolic compound [37,38], which is formed by the esterification of hydrocinnamic acids, such as caffeic, ferulic, and p-coumaric acids, with (-)-quinic acid. Zhang et al. also described chlorogenic acid as the key hydroxycinnamic acid present in different carrot tissues, representing between 42.2% to 61.8% of phenolic compounds [39], which also supported the present study results.
The phenolic acids identified in cherry tomato and/or baby carrot by-products as well as their retention time and maximum absorbance wavelength (nm) are present in Table 5. As suggested by TPC values, the HPLC quantifications suggested a higher presence of phenolic compounds in fresh tomato and from both processing methodologies adopted. The differences between HPLC quantifications and the results of TPC by Folin-Ciocalteu assay may result from the detection limit of phenolic compounds. Moreover, in TPC assay, Folin-Ciocalteu reagent can react with some interferent molecules present in extracts such as, proteins and sugars that can result in overestimation of TPC [40].

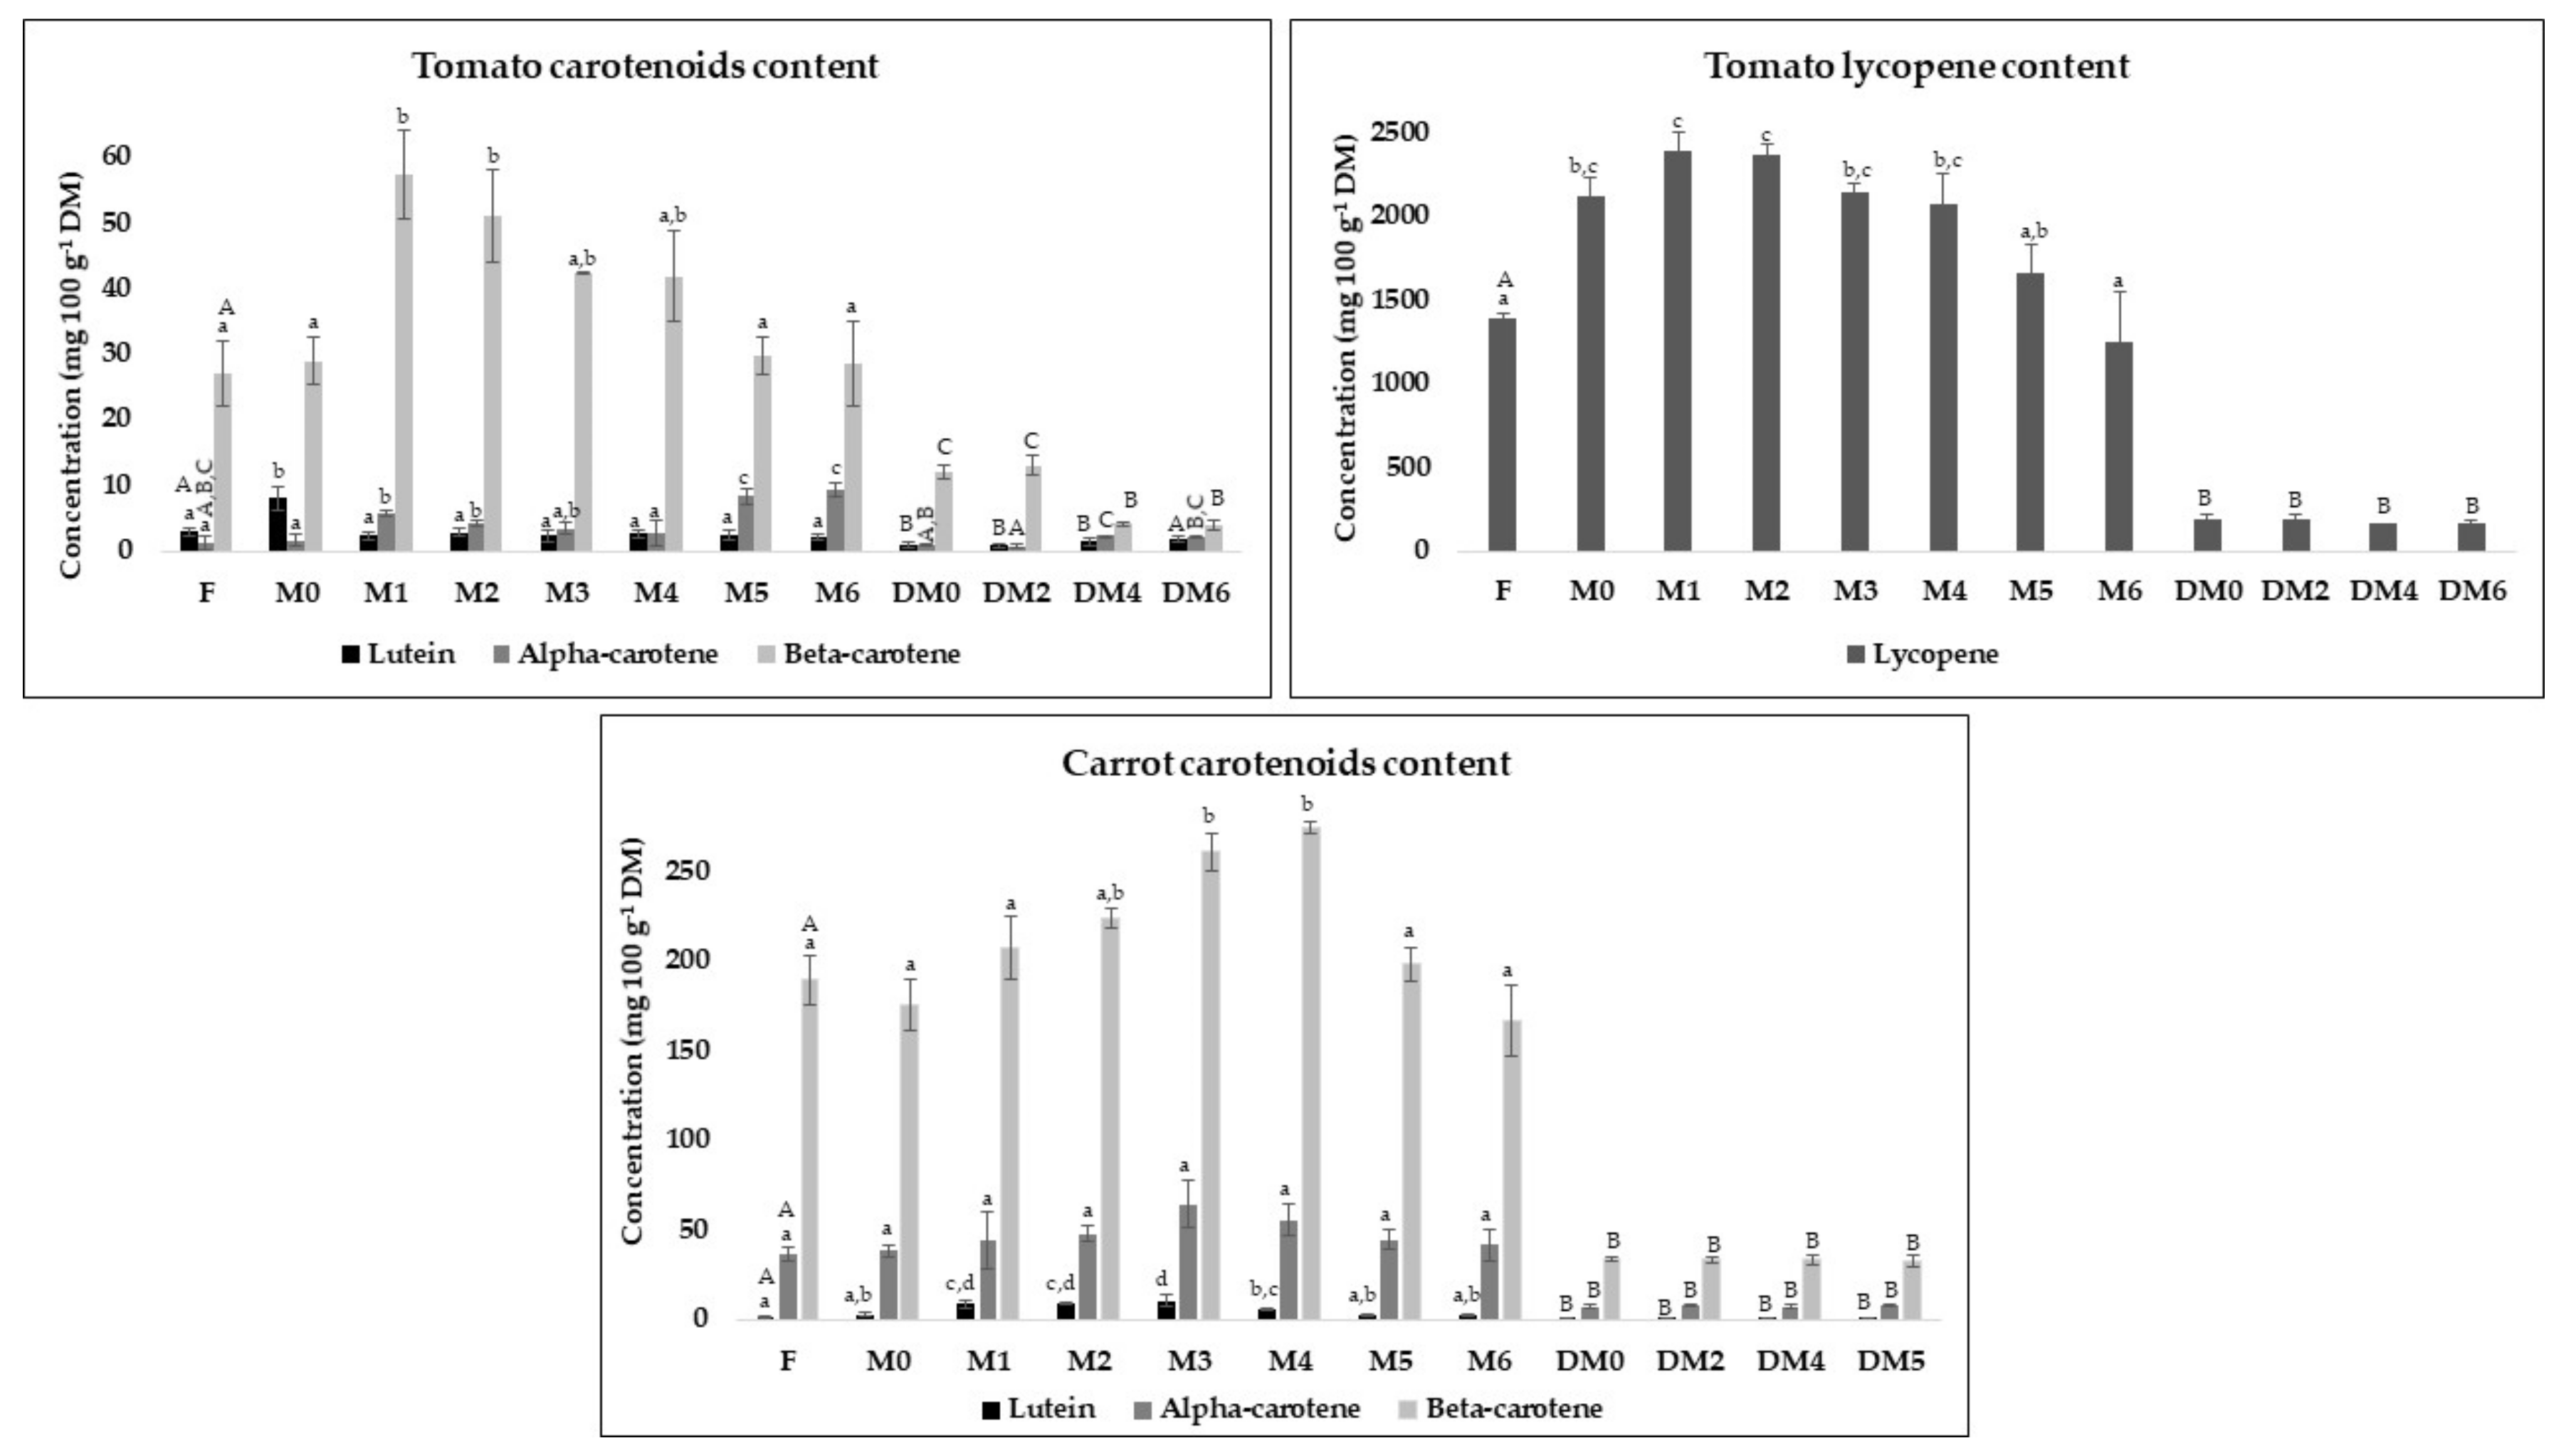
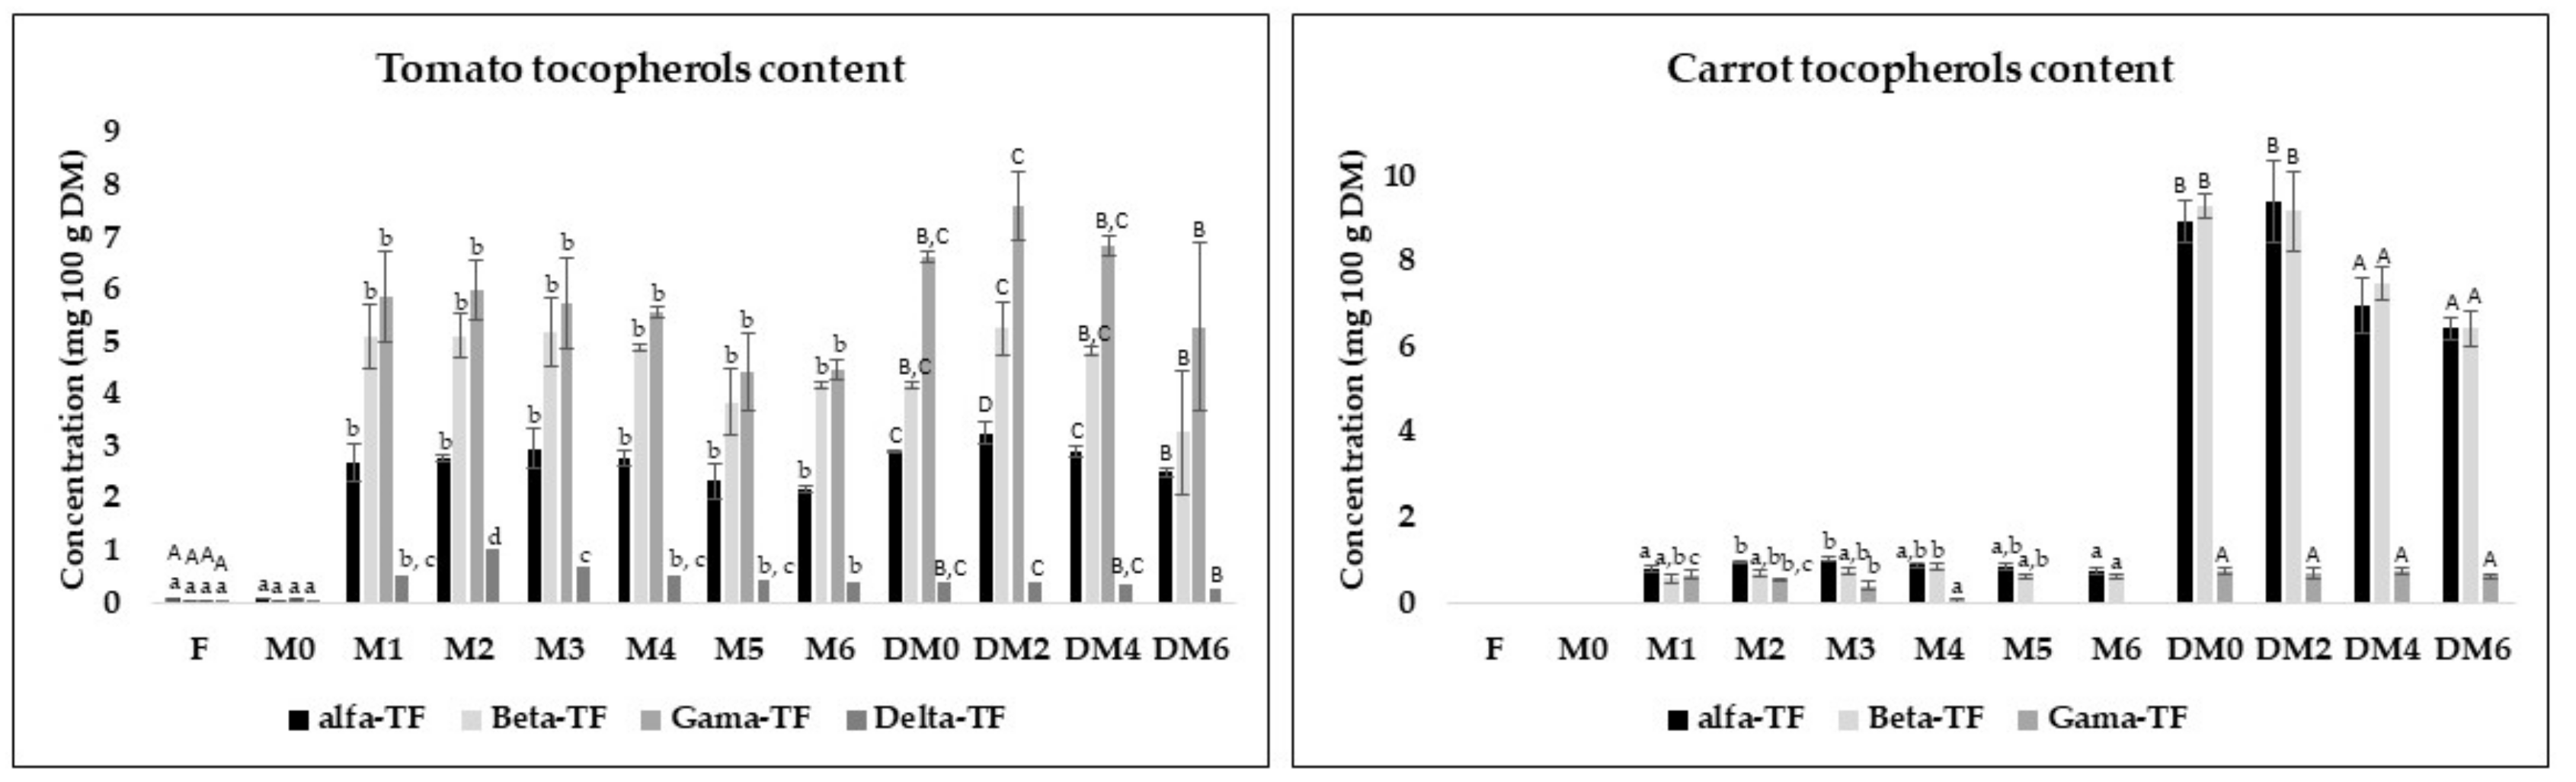
3.5. Carotenoids and Vitamine E Content

The carotenoid profile at a wavelength of 454 nm was monitored for all samples previously described and is represented in Figure 4. It is well known that tomato’s red color is mainly related to its content in lycopene and β-carotene [41]. In accordance, in this work, these carotenoids were the most prominent in both fresh and processed tomato (both tomato pulp and powder). Lycopene was the most predominant carotenoid in tomato, with concentrations between 1250.29 ± 306.39 (M6) and 2393.11 ± 112.68 (M2) mg 100 g−1 DM in frozen pulps and between 161.45 ± 3.85 and 187.16 ± 37.91 mg 100 g−1 DM in dry tomato. These values are in accordance with previous studies, where lycopene content ranged between 8 and 18 mg 100 g−1 fresh weight [42]. In another study where tomatoes were submitted to high temperatures, lycopene concentration ranged between 70 and 120 mg 100 g−1 DM [43]. Similarly in this work, the powders which suffer temperature treatment had lower carotenoids content than the pulps. The higher values comparing to the Hidalgo et al. work [43] could be justified by the lower temperatures that were used in the present work (50 °C) comparing to the temperatures used in that work (around 100 °C).
During freezing, a significant improvement in carotenoids content was verified in the first months of freezing. As previously mentioned, this could be explained by the cells membranes damage that freezing induces upon thawing depending on the size and location of the ice crystals [10]. After this period, the concentration of lutein and β-carotene carotenoids tended to decrease while α-carotene tended to rise, showing the higher concentration in M6 of freezing storage. Lutein, α- and β-carotene concentrations vary between 2.21 ± 0.57 (M6) to 8.10 ± 1.79 (24 h after freezing), 1.16 ± 1.03 (fresh) to 9.47 ± 1.11 (M6) and 27.09 ± 5.07 (fresh) to 57.49 ± 6.76 (M1), respectively. The values of carotenoids content in fresh tomato are aligned with previous studies and comparing to the Saini et al., work [44]; these values are in conformity to a higher stage of ripening as expected since the samples in this work were ripe red tomatoes. The decrease in carotenoids content after the first month of storage is probably related to chemical and enzymatic reactions that cause carotenoids degradation after their release from the membranes due to the ice crystals [10].
In contrast, there were no key variations in lycopene profile during dry storage, but a drastic decrease compared with fresh tomato (from 1502.12 to 187.16 mg 100 g−1 DM). This reduction comparatively to fresh by-product was transversal to the other carotenoids identified and quantified for dry tomato. Previous studies corroborate these results, demonstrating that drying decreases carotenoids content in tomato [29]. Moreover, before drying, vegetables were grounded and fresh-cut processed, which is known to promote cell membrane rupture. Bioactive compounds are exposed to the oxidative enzyme systems and are more vulnerable to temperature during processing [30]. Concerning lutein, α- and β-carotene, some alterations were verified during storage. In the case of lutein and α-carotene, there was a significant increase during storage from 0.86 ± 0.43 (DM0) to 1.76 ± 0.46 (DM6) mg 100 g−1 DM and 0.90 ± 0.15 (DM0) to 2.33 ± 0.11 mg 100 g−1 DM (DM4), respectively. Nevertheless, despite significant differences between the months analyzed, the concentration increase was not meaningful, which can be seen by the value of α-carotene between at DM6, being statistically not different from the previous months of storage. Otherwise, the β-carotene concentration decreased during dried storage, from 12.06 ± 1.10 (DM0) to 3.94 ± 0.79 mg 100 g−1 DM (DM6). The conjugated systems of double bonds of the carotenoids justify their vulnerability to degradation during storage by isomerization and degradation [30].
The most incident carotenoid in carrot was β-carotene in all months and storage conditions, followed by α-carotene and lutein, and lycopene was not detected which is in line with previous works on carrot [30]. The results suggested that β-carotene concentration improved from 189.89 ± 13.78 in the fresh form to 275.18 ± 3.49 mg 100 g−1 DM in M4 of frozen storage and after this phase, decreased until 167.01 ± 19.77 mg 100 g−1 DM in M6 of storage. No significant variations were registered in β-carotene concentration until the M2 of freezing and after M5 of storage. Regarding α-carotene, there was a key increase of its concentration of about half until the concentration of 64.54 ± 13.25 mg 100 g−1 DM (M3), reducing posteriorly until 42.06 ± 8.73 mg 100 g−1 DM in M6. Lutein was also detected varying between 1.87 ± 0.34 (fresh) to 10.61 ± 2.99 mg 100 g−1 DM (M3) and decreasing until 2.58 ± 0.35 mg 100 g−1 DM in M6 of storage. As previously discussed for tomato, the increased carotenoid content after the first months of freezing storage could be related to the liberation of bound compounds due to cell membrane rupture. In carrot, this liberation was slower, which could be explained by the stronger structure of carrot comparing to tomato due to higher insoluble fiber content [45]. Carotenoids are located in the chromoplasts which have a double layer membrane located inside the plant cells; thus, carotenoids are released slowly because of the several physical barriers that have to be broken for their release [30]. Previous works also demonstrated that blanching and freezing carrot slices promoted the increase in carotenoids content [46]. Similarly to tomato powders, there was a substantial loss of carotenoids concentration after drying, which is also explained by the combination of the two processing conditions during production of the vegetable powders that affect carotenoids content: (a) fresh-cut processing that liberates carotenoids from the cell wall structures turning them susceptible to oxidative enzyme systems and (b) the drying processing where the temperature promotes degradation of the free forms of these compounds that were liberated during the fresh-cut processing [30]. Previous works also demonstrated that carrot powders have lower β-carotene content than fresh carrots [41]. However, there were no significant changes during storage. The lutein, α- and β-carotene showed concentrations values of 0.66, 7.51 and 34.01, respectively.
Tocopherols (isomers of vitamin E) are lipid-soluble compounds synthesized in plastids that have antioxidant activity and are essential in the human diet [47]. α-tocopherol, β-tocopherol, γ-tocopherol and δ-tocopherol concentrations were analyzed during the entire storage monitorization (Figure 5). The four vitamins E isomers were detected in tomato while in carrot only α-tocopherol, β-tocopherol and γ-tocopherol were identified and quantified. In both cases, a significant increase after the first month of freezing storage was verified in all isomers detected. Similar to carotenoids results, the ice crystals that are created upon freezing may induce the plastids membrane rupture thus liberating these compounds, which explains the increase in tocopherols content after freezing [30].
β- and γ-tocopherols were the most incident isomers in tomato. In previous works the α-tocopherol was the most incident tocopherol in tomato followed by γ-tocopherol (the other tocopherols were not analyzed) [43], these could be related to different ripening stages of samples [44], the different varieties used and influence of the peel in the sampling as in this work peels were used contrary to the study in comparison [43].
In carrot, α-, β- and γ-tocopherols were found, which is in agreement with previous studies, where also there 3 tocopherols isomers were reported and the values are similar to those found in the pulps of baby carrots [48]. In general, the content of α-tocopherol was similar to the values reported before in literature [30]. The work by Attila et al. [48] showed that different water supply (rain-fed or irrigated) may significantly affect the tocopherols content and profile. Despite that α-tocopherol was always the most incident tocopherol, the second and third tocopherol may be β- or γ-tocopherol depending on the year of production and type of water supply.
For both vegetables, freezing and powders production increased tocopherols content, especially for tomato and carrot powder. The results also indicated that there were no significant alterations in the tocopherols concentration of tomato during all freezing period, which shows the stability of these compounds. In tomato, α-tocopherol concentration was 2.78 mg 100 g−1 DM, β-tocopherol concentration 5.19 mg 100 g−1 DM and γ-tocopherol concentration 6.00 mg 100 g−1 DM. In the case of δ-tocopherol concentration, some variations were verified during the frozen phase analyzed, with a significant increase until 1.03 ± 0.07 mg 100 g−1 DM in M2 and a decrease until 0.43 ± 0.03 mg 100 g−1 DM in the last month analyzed. In carrot, some slight variations were registered in α-tocopherol, β-tocopherol and γ-tocopherol concentrations during the frozen period. α-tocopherol concentration ranging between 0.77 ± 0.08 and 1.04 ± 0.07 mg 100 g−1 DM, β-tocopherol between 0.59 ± 0.10 and 0.87 ± 0.08 mg 100 g−1 DM and γ-tocopherol between 0.07 ± 0.03 and 0.68 ± 0.11 mg 100 g−1 DM. In general, for both vegetables, there was stability on tocopherols content of pulps during freezing storage.
The results of tocopherols concentrations also showed some variations during dry tomato storage in all isomers but in all cases with a positive impact relative to fresh by-product. This could be related to the release of these compounds during milling. Previous studies have demonstrated that granulometry affects antioxidant activity due to the increased availability of antioxidant compounds [49]. Generally, the tocopherol profile was also slightly improved comparatively with freezing storage. α-tocopherol, β-tocopherol, γ-tocopherol and δ-tocopherol showed the higher concentrations in M2 of dry storage (3.28 ± 0.23, 5.27 ± 0.49, 7.62 ± 0.67 and 0.43 ± 0.03 mg 100 g−1 DM, respectively).
In carrot, the tocopherol profile was substantially improved in the powders. The higher fiber content of carrot compared to tomato may explain this higher liberation of tocopherols during powders production comparing to tomato, as these compounds are released from fiber during this processing [21]. The higher tocopherols content found in carrot powders comparing to carrot pulps may be related to the milling step that is absent in pulp production, as previous studies demonstrated that milling promotes the liberation of bioactive compounds from the fibres [49]. No significant variations were registered in γ-tocopherol concentration during storage with concentrations around 0.68 mg 100 g−1 DM. The results also suggested no significant differences in α-tocopherol and β-tocopherol concentrations in the first two months of storage (8.95 and 9.32 mg 100 g−1 DM, respectively), with a significant decrease in month 4 and subsequent stabilization until M6 (6.97 and 7.50 mg 100 g−1 DM, respectively).

4. Conclusions

This work proves that baby carrot and cherry tomato by-products have high nutritional and functional value as ingredients when transformed both in pulps or powders as they are rich in bioactive compounds such as phenolic compounds, carotenoids and tocopherols. This study also demonstrates that the nutritional profile of these by-products is similar in bioactive terms to the profile of carrot and tomato vegetables that comply with commercialization standards. Generally, vitamin E isomers are positively impacted by both storage methods. The concentrations of α-, β-, γ- and δ-tocopherol in tomato and α-, β- and γ-tocopherol in carrot increase significantly during the freezing storage and after the drying process. The drying process negatively affects the carotenoid and polyphenolic content as well as antioxidant capacity, with significant declines after the drying process. However, there were no relevant variations in antioxidant capacity and bioactive content in dry by-products during storage. The freezing storage of pulps negatively impacted TPC and antioxidant capacity evaluated by ABTS and ORAC assays, with sequential decreases during the frozen period. In contrast, the antioxidant capacity assessed by the DPPH method, as well as the carotenoid profile, was positively affected in the first months of freezing but then in both cases, a progressive decline was verified.
Although in the case of freezing process and storage, generally there are sequential losses of antioxidant activity and bioactive compounds and the drying storage maintain the properties, the drying process showed to be more aggressive, suggesting that the nutritional profile of carrot and tomato pulps is more appealing than that of the equivalent powders. Even so, through this study, it is evident that pulps or powders exhibit a good functional character and the dry by-products present guarantee the stability during the selected storage. Overall, this study demonstrated that both processing methods result in value-added products with interesting nutritional profiles rich in bioactive substances and considered safe in terms of microbial counts. Consequently, the recovery of these by-products may have a very interesting positive economic and environmental impact.

Author Contributions

H.A.-R.: investigation, methodology, formal analysis, writing—original draft preparation. D.S.: methodology, formal analysis, writing—review and editing. D.A.C.: supervision, writing—review and editing. M.R.: resources; I.M.R.: methodology, writing—review and editing. M.E.P.: conceptualization, project administration, supervision, writing—review and editing. All authors have read and agreed to the published version of the manuscript.

Funding

This work was supported by Project MOBFOOD POCI-01-0247-FEDER-024524-LISBOA-01-0247-FEDER-024524, cofounded by PORTUGAL2020, Lisb@a2020, COMPETE 2020 and the EU. This work was also supported by National Funds from FCT—Fundação para a Ciência e a Tecnologia through project UIDB/50016/2020.

Institutional Review Board Statement

Not applicable.

Informed Consent Statement

Not applicable.

Conflicts of Interest

The authors declare no conflict of interest.

References

  1. Jenkins, W.; Tucker, M.E.; Grim, J. Routledge Handbook of Religion and Ecology; Routledge: London, UK, 2016. [Google Scholar] [CrossRef]
  2. Keser, D.; Guclu, G.; Kelebek, H.; Keskin, M.; Soysal, Y.; Sekerli, Y.E.; Selli, S. Characterization of aroma and phenolic composition of carrot (Daucus carota ‘Nantes’) powders obtained from intermittent microwave drying using GC–MS and LC–MS/MS. Food Bioprod. Process. 2020, 119, 350–359. [Google Scholar] [CrossRef]
  3. Kamiloglu, S.; Toydemir, G.; Boyacioglu, D.; Beekwilder, J.; Hall, R.; Capanoglu, E. A review on the effect of drying on antioxidant potential of fruits and vegetables. Crit. Rev. Food Sci. Nutr. 2016, 56, S110–S129. [Google Scholar] [CrossRef] [PubMed]
  4. Kapoor, S.; Aggarwal, P. Drying method affects bioactive compounds and antioxidant activity of carrot. Int. J. Veg. Sci. 2014, 21, 467–481. [Google Scholar] [CrossRef]
  5. Kyriacou, M.; Rouphael, Y. Towards a new definition of quality for fresh fruits and vegetables. Sci. Hortic. 2018, 234, 463–469. [Google Scholar] [CrossRef]
  6. Patras, A.; Tiwari, B.; Brunton, N. Influence of blanching and low temperature preservation strategies on antioxidant activity and phytochemical content of carrots, green beans and broccoli. LWT 2011, 44, 299–306. [Google Scholar] [CrossRef]
  7. Hung, P.V.; Duy, T.L. Effects of drying methods on bioactive compounds of vegetables and correlation between bioactive compounds and their antioxidantsfile. Int. Food Res. J. 2012, 19, 327–332. [Google Scholar]
  8. Nayak, B.; Liu, R.H.; Tang, J. Effect of processing on phenolic antioxidants of fruits, vegetables, and grains—A review. Crit. Rev. Food Sci. Nutr. 2015, 55, 887–918. [Google Scholar] [CrossRef] [PubMed]
  9. Ribas-Agustí, A.; Martín-Belloso, O.; Soliva-Fortuny, R.; Elez-Martínez, P. Food processing strategies to enhance phenolic compounds bioaccessibility and bioavailability in plant-based foods. Crit. Rev. Food Sci. Nutr. 2018, 58, 2531–2548. [Google Scholar] [CrossRef] [Green Version]
  10. Neri, L.; Faieta, M.; Di Mattia, C.; Sacchetti, G.; Mastrocola, D.; Pittia, P. Antioxidant activity in frozen plant foods: Effect of cryoprotectants, freezing process and frozen storage. Foods 2020, 9, 1886. [Google Scholar] [CrossRef]
  11. Murcia, M.A.; Jiménez, A.M.; Martínez-Tomé, M. Vegetables antioxidant losses during industrial processing and refrigerated storage. Food Res. Int. 2009, 42, 1046–1052. [Google Scholar] [CrossRef]
  12. Celli, G.B.; Ghanem, A.; Brooks, M.S.-L. Influence of freezing process and frozen storage on the quality of fruits and fruit products. Food Rev. Int. 2015, 32, 280–304. [Google Scholar] [CrossRef]
  13. Ijabadeniyi, O.A.; Pillay, Y. Microbial safety of low water activity Foods: Study of simulated and durban household samples. J. Food Qual. 2017, 1–7. [Google Scholar] [CrossRef] [Green Version]
  14. Gonçalves, B.; Falco, V.; Moutinho-Pereira, J.; Bacelar, E.; Peixoto, F.; Correia, C. Effects of elevated CO2 on grapevine (Vitis vinifera L.): Volatile composition, phenolic content, and in vitro antioxidant activity of red wine. J. Agric. Food Chem. 2009, 57, 265–273. [Google Scholar] [CrossRef]
  15. Coscueta, E.R.; Campos, D.; Osório, H.; Nerli, B.B.; Pintado, M. Enzymatic soy protein hydrolysis: A tool for biofunctional food ingredient production. Food Chem. X 2019, 1, 100006. [Google Scholar] [CrossRef] [PubMed]
  16. Schaich, K.; Tian, X.; Xie, J. Reprint of “Hurdles and pitfalls in measuring antioxidant efficacy: A critical evaluation of ABTS, DPPH, and ORAC assays”. J. Funct. Foods 2015, 18, 782–796. [Google Scholar] [CrossRef]
  17. Ainsworth, E.A.; Gillespie, K.M. Estimation of total phenolic content and other oxidation substrates in plant tissues using Folin-Ciocalteu reagent. Nat. Protoc. 2007, 2, 875–877. [Google Scholar] [CrossRef] [PubMed]
  18. Campos, D.A.; Ribeiro, T.B.; Teixeira, J.A.; Pastrana, L.; Pintado, M.M. Integral valorization of pineapple (Ananas comosus L.) By-products through a green chemistry approach towards Added Value Ingredients. Foods 2020, 9, 60. [Google Scholar] [CrossRef] [PubMed] [Green Version]
  19. Oliveira, A.; Pintado, M.M.; Almeida, D. Phytochemical composition and antioxidant activity of peach as affected by pasteurization and storage duration. LWT 2012, 49, 202–207. [Google Scholar] [CrossRef]
  20. Prates, J.A.M.; Quaresma, M.A.G.; Bessa, R.J.B.; Fontes, C.M.A.; Alfaia, C.M.M. Simultaneous HPLC quantification of total cholesterol, tocopherols and β-carotene in Barrosã-PDO veal. Food Chem. 2006, 94, 469–477. [Google Scholar] [CrossRef]
  21. Slavin, M.; Yu, L. A single extraction and HPLC procedure for simultaneous analysis of phytosterols, tocopherols and lutein in soybeans. Food Chem. 2012, 135, 2789–2795. [Google Scholar] [CrossRef]
  22. Vandekinderen, I.; Van Camp, J.; Devlieghere, F.; Veramme, K.; Denon, Q.; Ragaert, P.; De Meulenaer, B. Effect of Decontamination Agents on the Microbial Population, Sensorial Quality, and Nutrient Content of Grated Carrots (Daucus carota L.). J. Agric. Food Chem. 2008, 56, 5723–5731. [Google Scholar] [CrossRef]
  23. Saraiva, M.; Correia, C.B.; Cunha, I.C.; Maia, C.; Bonito, C.C.; Furtado, R.; Calhau, A. Interpretação de Resultados de Ensaios Microbiológicos em Alimentos Prontos Para Consumo e em Superfícies do Ambiente de Preparação e Distribuição Alimentar: Valores-guia; INSA IP—Instituto Nacional de Saúde Doutor Ricardo Jorge: Lisboa, Portugal, 2019. [Google Scholar]
  24. Lisiewska, Z.; Kmiecik, W. Effect of storage period and temperature on the chemical composition and organoleptic quality of frozen tomato cubes. Food Chem. 2000, 70, 167–173. [Google Scholar] [CrossRef]
  25. Bouzari, A.; Holstege, D.; Barrett, D.M. Mineral, fiber, and total phenolic retention in eight fruits and vegetables: A comparison of refrigerated and frozen storage. J. Agric. Food Chem. 2015, 63, 951–956. [Google Scholar] [CrossRef] [PubMed]
  26. Leja, M.; Kamińska, I.; Kramer, M.; Maksylewicz-Kaul, A.; Kammerer, D.; Carle, R.; Baranski, R. The content of phenolic compounds and radical scavenging activity varies with carrot origin and root color. Plant. Foods Hum. Nutr. 2013, 68, 163–170. [Google Scholar] [CrossRef] [PubMed] [Green Version]
  27. Georgé, S.; Tourniaire, F.; Gautier, H.; Goupy, P.; Rock, E.; Caris-Veyrat, C. Changes in the contents of carotenoids, phenolic compounds and vitamin C during technical processing and lyophilisation of red and yellow tomatoes. Food Chem. 2011, 124, 1603–1611. [Google Scholar] [CrossRef]
  28. Perea-Domínguez, X.P.; Hernández-Gastelum, L.Z.; Olivas-Olguin, H.R.; Espinosa-Alonso, L.G.; Valdez-Morales, M.; Medina-Godoy, S. Phenolic composition of tomato varieties and an industrial tomato by-product: Free, conjugated and bound phenolics and antioxidant activity. J. Food Sci. Technol. 2018, 55, 3453–3461. [Google Scholar] [CrossRef]
  29. Smith, J.C.; Biasi, W.V.; Holstege, D.; Mitcham, E.J. Effect of passive drying on ascorbic acid, α-tocopherol, and β-carotene in tomato and mango. J. Food Sci. 2018, 83, 1412–1421. [Google Scholar] [CrossRef]
  30. Char, C.D. Carrots (Daucus carota L.). Fruit Veg. Phytochem. 2017, 969–978. [Google Scholar]
  31. Kamiloglu, S.; Demirci, M.; Selen, S.; Toydemir, G.; Boyacioglu, D.; Capanoglu, E. Home processing of tomatoes (Solanum lycopersicum): Effects on in vitro bioaccessibility of total lycopene, phenolics, flavonoids, and antioxidant capacity. J. Sci. Food Agric. 2014, 94, 2225–2233. [Google Scholar] [CrossRef]
  32. Danesi, F.; Bordoni, A. Effect of home freezing and Italian style of cooking on antioxidant activity of edible vegetables. J. Food Sci. 2008, 73, H109–H112. [Google Scholar] [CrossRef]
  33. Nguyen, V.T.; Le, M.D. Influence of various drying conditions on phytochemical compounds and antioxidant activity of carrot peel. Beverages 2018, 4, 80. [Google Scholar] [CrossRef] [Green Version]
  34. Thaipong, K.; Boonprakob, U.; Crosby, K.; Cisneros-Zevallos, L.; Byrne, D.H. Comparison of ABTS, DPPH, FRAP, and ORAC assays for estimating antioxidant activity from guava fruit extracts. J. Food Compos. Anal. 2006, 19, 669–675. [Google Scholar] [CrossRef]
  35. Macheix, J.-J.; Fleuriet, A.; Billot, J. Fruit Phenolics; CRC Press: Boca Raton, FL, USA, 2018. [Google Scholar] [CrossRef]
  36. Bénard, C.; Gautier, H.; Bourgaud, F.; Grasselly, D.; Navez, B.; Caris-Veyrat, C.; Weiss, M.; Génard, M. Effects of low nitrogen supply on tomato (Solanum lycopersicum) fruit yield and quality with special emphasis on sugars, acids, ascorbate, carotenoids, and phenolic compounds. J. Agric. Food Chem. 2009, 57, 4112–4123. [Google Scholar] [CrossRef]
  37. Sun, T.; Simon, P.; Tanumihardjo, S.A. Antioxidant phytochemicals and antioxidant capacity of biofortified carrots (Daucus carota L.) of various colors. J. Agric. Food Chem. 2009, 57, 4142–4147. [Google Scholar] [CrossRef] [PubMed]
  38. Arscott, S.A.; Tanumihardjo, S.A. Carrots of many colors provide basic nutrition and bioavailable phytochemicals acting as a functional food. Compr. Rev. Food Sci. Food Saf. 2010, 9, 223–239. [Google Scholar] [CrossRef]
  39. Zhang, D.; Hamauzu, Y. Phenolic compounds and their antioxidant properties in different tissues of carrots (Daucus carota L.). Int. J. Food Agric. Environ. 2004, 2, 332. [Google Scholar]
  40. Gómez-García, R.; Campos, D.A.; Oliveira, A.; Aguilar, C.N.; Madureira, A.R.; Pintado, M. A chemical valorisation of melon peels towards functional food ingredients: Bioactives profile and antioxidant properties. Food Chem. 2021, 335, 127579. [Google Scholar] [CrossRef] [PubMed]
  41. Chaudhary, P.; Sharma, A.; Singh, B.; Nagpal, A.K. Bioactivities of phytochemicals present in tomato. J. Food Sci. Technol. 2018, 55, 2833–2849. [Google Scholar] [CrossRef]
  42. Martí, R.; Roselló, S.; Cebolla-Cornejo, J. Tomato as a source of carotenoids and polyphenols targeted to cancer prevention. Cancers 2016, 8, 58. [Google Scholar] [CrossRef]
  43. Hidalgo, A.; Di Prima, R.; Fongaro, L.; Cappa, C.; Lucisano, M. Tocols, carotenoids, heat damage and technological quality of diced tomatoes processed in different industrial lines. LWT 2017, 83, 254–261. [Google Scholar] [CrossRef]
  44. Saini, R.K.; Zamany, A.J.; Keum, Y.S. Ripening improves the content of carotenoid, α-tocopherol, and polyunsaturated fatty acids in tomato (Solanum lycopersicum L.) fruits. 3 Biotech 2017, 7, 1–7. [Google Scholar] [CrossRef] [Green Version]
  45. Slavin, J.L.; Lloyd, B. Health benefits of fruits and vegetables. Adv. Nutr. 2012, 1, 506–516. [Google Scholar] [CrossRef] [PubMed] [Green Version]
  46. Behsnilian, D.; Mayer-Miebach, E. Impact of blanching, freezing and frozen storage on the carotenoid profile of carrot slices (Daucus carota L. cv. Nutri Red). Food Control. 2017, 73, 761–767. [Google Scholar]
  47. Bermudez, L.F.; Del Pozo, T.; Lira, B.S.; De Godoy, F.; Boos, I.; Romanó, C.; Previtali, V.; Almeida, J.; Bréhélin, C.; Asis, R.; et al. A Tomato Tocopherol Binding Protein Sheds Light on Intracellular α-tocopherol Metabolism in Plants. Plant. Cell Physiol. 2018, 59, 2188–2203. [Google Scholar] [CrossRef] [Green Version]
  48. Ombódi, A.; Daood, H.G.; Helyes, L. Carotenoid and tocopherol composition of an orange-colored carrot as affected by water supply. HortScience 2014, 49, 729–733. [Google Scholar]
  49. Esposito, F.; Arlotti, G.; Bonifati, A.M.; Napolitano, A.; Vitale, D.; Fogliano, V. Antioxidant activity and dietary Wbre in durum wheat bran by-products. Food Res. Int. 2005, 38, 1167–1173. [Google Scholar] [CrossRef]
Figure 1. Total phenolic compounds (TPC; Folin–Ciocalteu method) and antioxidant capacity by ABTS, ORAC and DPPH assays (n = 4) of fresh carrot and tomato by-products and during the pulps freezing and drying storage. All antioxidant results (mean ± standard deviation) were expressed in mg Trolox equivalent (TE) 100 g−1 on a dry basis, while TPC results were represented in mg gallic acid equivalent (GAE) 100 g−1. Bars of the same color and corresponding to the same storage method with different superscript letters are significantly different (p < 0.05). Lowercase letters were used for fresh and frozen pulps forms while uppercase letters were used for fresh and dry powders forms. M0 = 24 h after the freezing storage of pulps. M1, M2, M3, M4, M5, M6 = month one, two, three, four, five and six of the freezing storage of pulps, respectively. DM0 = day 0 of the powders storage. DM2, DM4, DM6 = month two, four and six of the storage period of powders.
Horticulturae 07 00185 g001
Figure 2. Chromatograms of identified free phenolic compounds of (a). fresh tomato by-products and during (b). the freezing pulps and (c). drying storage of powders at a wavelength of 320 nm. TF = fresh tomato. TM0 = 24 h after the freezing storage of tomato pulp. TM3 and TM6 = month three and six of the freezing storage of tomato pulps, respectively. DM0 = day 0 of the tomato powders storage. DM2 and DM6 = month two and six of the storage period of tomato powders.
Horticulturae 07 00185 g002
Figure 3. Chromatograms of identified free phenolic compounds of (a). fresh carrot by-products and during (b). the pulps freezing and (c). drying storage of powders at a wavelength of 320 nm. CF = fresh carrot. CM0 = 24 h after the freezing storage of carrot pulp. CM3 and CM6 = month three and six of the freezing storage of carrot pulps, respectively. DM0 = day 0 of the carrot powders storage. DM2 and DM6 = month two and six of the storage period of carrot powders.
Horticulturae 07 00185 g003
Figure 4. The concentration of carotenoids (n = 3) detected in fresh carrot and tomato by-products and during the freezing and drying storage by HPLC-DAD at a wavelength of 454 nm. All results (mean ± standard deviation) were expressed in mg 100 g−1 on a dry basis. Bars of the same color and corresponding to the same storage method with different superscript letters are significantly different (p < 0.05). Lowercase letters were used for fresh and frozen pulps forms while uppercase letters were used for fresh and dry powders forms. M0 = 24 h after the freezing storage of pulps. M1, M2, M3, M4, M5, M6 = month one, two, three, four, five and six of the freezing storage of pulps, respectively; DM0 = day 0 of the powders storage. DM2, DM4, DM6 = month two, four and six of the storage period of powders.
Horticulturae 07 00185 g004
Figure 5. The concentration of α-tocopherol, β-tocopherol, γ-tocopherol and δ-tocopherol (n = 3) detected in fresh carrot and tomato by-products and during the freezing and drying storage by HPLC-DAD. All results (mean ± standard deviation) were expressed in mg 100 g−1 on a dry basis. Bars of the same color and corresponding to the same method of storage with different superscript letters are significantly different (p < 0.05). Lowercase letters were used for fresh and frozen pulps forms while uppercase letters were used for fresh and dry powders forms. M0 = 24 h after the freezing storage of pulps. M1, M2, M3, M4, M5, M6 = month one, two, three, four, five and six of the freezing storage of pulps, respectively. DM0 = day 0 of the powders’ storage. DM2, DM4, DM6 = month two, four and six of the storage period of powders.
Horticulturae 07 00185 g005
Table 1. Microbial counts (n = 2) present in cherry tomato and baby carrot by-products before and after the washing process, as well as during the 6 months of pulps freezing and drying storage. All microbial count results (mean ± standard deviation) were expressed in log(CFU g−1).
VegetableSampleTABEnterobacteriaceaYeasts and MoldsBacillus
cereus spp.
Aerobic Spore-FormsAnaerobic Spore-Forms
TomatoNon washed8.14 ± 0.156.28 ± 0.146.16 ± 0.124.63 ± 0.14--
Washed4.32 ± 0.143.82 ± 0.073.77 ± 0.072.57 ± 0.12--
Fresh pulp4.54 ± 0.113.91 ± 0.083.89 ± 0.152.65 ± 0.17--
M04.55 ± 0.153.98 ± 0.073.91 ± 0.102.57 ± 0.14--
M14.52 ± 0.074.03 ± 0.063.85 ± 0.142.53 ± 0.14--
M24.52 ± 0.154.00 ± 0.013.92 ± 0.112.56 ± 0.04--
M34.56 ± 0.044.02 ± 0.113.87 ± 0.212.51 ± 0.09--
M44.68 ± 0.104.13 ± 0.053.92 ± 0.202.63 ± 0.11--
M54.61 ± 0.134.07 ± 0.073.89 ± 0.182.56 ± 0.09--
M64.39 ± 0.013.80 ± 0.383.87 ± 0.272.62 ± 0.06--
DM02.39 ± 0.122.74 ± 1.04--3.00 ± 0.003.00 ± 0.00
DM62.15 ± 0.212.15 ± 0.21--2.00 ± 0.002.39 ± 0.12
CarrotNon washed9.18 ± 0.108.03 ± 0.105.96 ± 0.104.77 ± 0.08--
Washed5.29 ± 0.104.63 ± 0.133.65 ± 0.162.90 ± 0.09--
Fresh pulp5.36 ± 0.094.82 ± 0.103.66 ± 0.112.93 ± 0.05--
M05.34 ± 0.154.85 ± 0.133.69 ± 0.032.74 ± 0.15--
M15.27 ± 0.074.82 ± 0.103.81 ± 0.082.69 ± 0.17--
M25.26 ± 0.064.86 ± 0.073.74 ± 0.292.70 ± 0.05--
M35.23 ± 0.014.83 ± 0.093.73 ± 0.032.67 ± 0.09--
M45.31 ± 0.374.54 ± 0.213.76 ± 0.102.82 ± 0.16--
M55.28 ± 0.024.81 ± 0.213.72 ± 0.122.65 ± 0.16--
M65.22 ± 0.064.82 ± 0.243.73 ± 0.032.79 ± 0.06--
DM04.49 ± 0.884.22 ± 1.10--2.67 ± 0.952.36 ± 0.51
DM64.61 ± 0.884.16 ± 1.00--2.85 ± 0.002.50 ± 0.28
M0 = 24 h after the freezing storage of pulps. M1, M2, M3, M4, M5, M6 = month one, two, three, four, five and six of the freezing storage of pulps, respectively. DM0 = day 0 of the powders’ storage. DM6 = month six of the storage period of powders. TAB = total aerobic bacteria.
Table 2. Pulps’ viscosity (n = 5) from fresh to freezing storage of baby carrot and cherry tomato pulps for 6 months were expressed in mPa s−1. Columns corresponding to the same vegetable with different superscript letters are significantly different (p < 0.05).
VegetableSampleViscosity (mPa s−1)
TomatoFresh pulp195.88 ± 3.73 a
M0153.36 ± 1.27 b
M1142.42 ± 1.27 c
M2133.98 ± 2.15 d
M3122.04 ± 0.97 e
M4110.98 ± 3.66 f
M5105.08 ± 0.74 g
M6100.34 ± 1.39 h
CarrotFresh pulp486.98 ± 1.40 a
M0399.98 ± 4.35 b
M1390.58 ± 1.78 c
M2380.58 ± 3.43 d
M3368.94 ± 2.2 e
M4358.62 ± 2.41 f
M5351.28 ± 2.37 g
M6349.28 ± 2.92 g
M0 = 24 h after the freezing storage of pulps. M1, M2, M3, M4, M5, M6 = month one, two, three, four, five and six of the freezing storage of pulps, respectively.
Table 3. Identification and quantification of phenolic compounds (n = 4) present in fresh tomato by-products and during Table 280. 320 and 350 nm. All results (mean ± standard deviation) were expressed in mg 100 g−1 on a dry basis.
Tomato SampleChlorogenic AcidSinapic Acid DerivativeRutinQuercetin
Derivative
Naringenin
Fresh27.2 ± 2.6 b,A0.46 ± 0.28 a11.4 ± 0.8 b,c,d,A16.9 ± 0.3 c500.0 ± 27.4 a,b,*
M032.4 ± 0.7 c0.67 ± 0.09 a11.2 ± 0.4 b,c,d27.5 ± 2.0 d501.3 ± 10.7 a.b,*
M118.4 ± 0.9 a0.64 ± 0.28 a8.4 ± 2.0 a,b13.0 ± 0.9 a,b445.3 ± 5.9 b,c,*
M216.6 ± 0.5 a0.52 ± 0.16 a9.9 ± 1.4 a,b,c10.8 ± 0.7 a367.1 ± 48.1 c,e,*
M319.5 ± 2.7 a0.56 ± 0.30 a8.0 ± 2.2 a13.3 ± 1.0 b367.6 ± 52.4 c,e,*
M417.2 ± 2.4 a0.40 ± 0.12 a8.6 ± 0.3 a,b13.1 ± 0.8 b314.5 ± 93.8 e,*
M517.2 ± 0.3 a1.50 ± 0.02 b12.5 ± 0.3 c,d17.3 ± 0.4 c556.0 ± 7.4 a,*
M615.9 ± 0.1 a1.67 ± 0.09 b13.2 ± 1.3 d16.4 ± 0.4 c514.3 ± 3.1 a.b,*
DM035.6 ± 3.5 BN.D.30.5 ± 3.1 BN.D.1203.5 ± 142.3 A,B
DM234.2 ± 0.2 BN.D.32.0 ± 1.0 BN.D.1311.5 ± 29.3 B
DM435.4 ± 0.1 BN.D.30.4 ± 0.2 BN.D.1132.2 ± 16.5 A
DM638.0 ± 0.3 BN.D.32.0 ± 0.2 BN.D.1224.8 ± 22.7 A,B
Columns with different superscript letters and corresponding to the same processing and storage approach are significantly different (p < 0.05). Lowercase letters were used for fresh and frozen pulps forms while uppercase letters were used for fresh and dry powders forms. N.D. = Not detected. * = derivative. M0 = 24 h after the freezing storage of pulps. M1, M2, M3, M4, M5, M6 = month one, two, three, four, five and six of the freezing storage of pulps, respectively. DM0 = day 0 of the powders storage. DM2, DM4, DM6 = month two, four and six of the storage period of powders.
Table 4. Identification and quantification of phenolic compounds (n = 4) present in fresh carrot by-products and during the freezing and drying storage by HPLC analysis at wavelengths of 280, 320 and 350 nm. All results (mean ± standard deviation) were expressed in mg 100 g−1 on a dry basis.
Carrot
Sample
Protocatechuic AcidChlorogenic AcidCaffeic
Acid
Trans-Ferulic Acid
FreshB.Q.L.2.48 ± 0.07 a,AN.D.3.02 ± 0.03
M0B.Q.L.2.85 ± 0.23 aN.D.B.Q.L.
M114.28 ± 1.675.36 ± 2.72 aN.D.B.Q.L.
M2B.Q.L.16.58 ± 0.43 bB.Q.L.N.D.
M3B.Q.L.39.32 ± 2.51 cB.Q.L.N.D.
M4B.Q.L.53.19 ± 1.88 dB.Q.L.N.D.
M5B.Q.L.62.13 ± 0.41 e0.25 ± 0.02N.D.
M6B.Q.L.61.51 ± 0.42 eB.Q.L.N.D.
DM0N.D.56.22 ± 3.15 D0.41 ± 0.03N.D.
DM2N.D.40.04 ± 0.31 C0.18 ± 0.01N.D.
DM4N.D.37.76 ± 0.08 B,CB.Q.L.N.D.
DM6N.D.36.18 ± 0.02 BB.Q.L.N.D.
Columns with different superscript letters and corresponding to the same processing and storage approach are significantly different (p < 0.05). Lowercase letters were used for fresh and frozen pulps forms while uppercase letters were used for fresh and dry powders forms. B.Q.L. = below the quantification limit. N.D. = not detected. M0 = 24 h after the freezing storage of pulps. M1, M2, M3, M4, M5, M6 = month one, two, three, four, five and six of the freezing storage of pulps, respectively. DM0 = day 0 of the powders’ storage. DM2, DM4, DM6 = month two, four and six of the storage period of powders.
Table 5. Phenolic acids identified in cherry tomato and/or baby carrot by-products.
Phenolic AcidsChemical FormulaRetention Time (min)λ Max (nm)
Hydroxybenzoic acid
Protocatechuic acidC7H6O417.4294
Hydroxycinnamic acid
Chlorogenic acidC16H18O927.2326.0
Caffeic acidC9H8O431.0323.6
p-coumaric acidC9H8O339.9309.3
Ferulic acidC10H10O442.4322.4
Sinapic acidC11H12O542.7322.0
Trans-ferulic acidC10H10O442.6322.4
Iso-ferulic acidC10H10O445.3322.4
Flavonols
MyricetinC15H10O838.9375.3
RutinC27H30O1649.8354.7
QuercetinC15H10O749.9343.9
Flavanones
NaringeninC15H12O548.8283.0
Publisher’s Note: MDPI stays neutral with regard to jurisdictional claims in published maps and institutional affiliations.

