
Effects of Machine-Harvest Interval on Fruit Quality of Fresh Market Northern Highbush Blueberry


1
Department of Horticulture, Washington State University Northwestern Washington Research and Extension Center, 16650 State Route 536, Mount Vernon, WA 98273, USA
2
Agriculture, Agricultural Research Service, Appalachian Fruit Research Station, 2217 Wiltshire Road, Kearneysville, WV 25430, USA
3
Oxbo International, 270 Birch Bay Lynden Rd, Lynden, WA 98264, USA
*
Author to whom correspondence should be addressed.
Horticulturae 2021, 7(8), 245; https://0-doi-org.brum.beds.ac.uk/10.3390/horticulturae7080245
Submission received: 21 June 2021
/
Revised: 3 August 2021
/
Accepted: 10 August 2021
/
Published: 13 August 2021
(This article belongs to the Section Postharvest Biology, Quality, Safety, and Technology)
Abstract
:Machine harvesting blueberry (Vaccinium sp.) alleviates labor costs and shortages but can reduce fruit quality. Installation of softer catching surfaces inside modified over-the-row harvesters (modified OTR) and adjusting harvest intervals may improve fruit quality and packout. The objective of this study was to determine the effect of harvest interval on fruit quality of fresh market northern highbush blueberry (Vaccinium corymbosum L.) harvested using a modified OTR. ‘Liberty’ blueberry bushes were harvested by hand or using a modified OTR at 3-, 10-, and 14-day intervals in 2019 and at 7-, 11-, and 14-day intervals in 2020. Hand-harvested ‘Liberty’ had greater packout and firmness than machine-harvested fruit. Machine harvesting at the 3-day interval in 2019, and the 14-day interval in 2020 reduced packout from 70–80% to 60% and 54%, respectively. In 2019, machine harvesting at a 3-day interval overall resulted in fruit with greater firmness, higher titratable acidity (TA), and lower total soluble solids (TSS) and SS/TA, compared to other harvest intervals. In 2020, the 7-day machine-harvest interval had a greater TA and lower TSS/TA, compared to the 11- and 14-day intervals. Overall, modified OTR machine-harvest intervals can be extended to 10–11 days for fresh market northern highbush cultivars such as ‘Liberty’ grown in northwest Washington.
1. Introduction
Washington is a top blueberry (Vaccinium sp.) producing state in the United States (US) with a total of 76,000 metric tonnes produced in 2020 amounting to 10% of the utilized production for fresh market [1]. Northern highbush (NH) cultivars (Vaccinium corymbosum L.) are the foundation of the fresh market segment and are traditionally harvested by hand to maintain high quality and postharvest longevity [2]. However, more growers are switching to machine harvesting with conventional over-the-row (OTR) harvesters for fresh markets due to high labor costs and worker shortages [3,4,5]. Research conducted in the 1990s in Michigan, US, using the V45 blueberry harvester (BEI; South Heaven, MI, USA) demonstrated that fresh market quality can be achieved in certain NH blueberry cultivars if drop heights were low and soft catch surfaces were installed [6,7]. Recent improvements in catch plate design and materials have alleviated fruit quality losses incurred during machine harvest and suggest that conventional OTR harvesters with two up-right rotary drum shakers could be used to harvest fresh market blueberries if their hard catch plates were replaced with soft-surface catch plates and the conveyor belt on either side of the OTR machine tunnel was covered with soft materials [8,9,10].
The harvest schedule of blueberry is based on growers’ subjective observations and experiences. For early fruiting cultivars, growers may start harvest earlier using short harvest intervals to secure a higher market price return, and later for late-season cultivars. Ballinger et al. [11] recommended harvesting at a TSS/TA ratio of less than 20 for trans-Atlantic shipping, and Hancock et al. [12] found improved postharvest quality among berries harvested at earlier maturity stages due to higher firmness than those harvested at fully maturity. Thus, growers may pick early and more frequently for long-distance shipping. Conversely, growers may start harvesting at more advanced maturity stages and harvest over longer intervals to minimize their harvest operational costs.
Blueberry fruits have three development stages. Berries undergo initial fruit enlargement and dry weight gain in Stage I. Seed development primarily occurs in Stage II. In Stage III, berries transition from growth to ripening with size further increasing, color changing from green, to pink, red, and blue, and there is a rapid increase in total soluble solids (TSS) and decreasing in titratable acidity (TA) [13,14]. The change in TSS and TA results in a steady increase in the ratio of TSS and TA, which impacts flavor and quality [15]. The fruit will also begin to soften at this stage due to the enzymatic digestion of cell walls [16]. However, blueberry fruits within a cluster and clusters that are borne on a bush do not ripen uniformly and this results in large variation in berry maturity stages within a single harvest time [17]. This heterogeneity in fruit quality differs among NH cultivars. For example, ‘Aurora’ and ‘Liberty’ can be picked at higher maturity stages without affecting storage longevity, compared to ‘Elliott’ [18]. Cultivars with higher fruit firmness and less variation in firmness between maturity stages can have a longer harvest interval [19].
Strik [20] compared three hand-harvest intervals across six NH cultivars (Aurora, Bluecrop, Draper, Duke, Legacy, Liberty) and a rabbiteye (Vaccinium virgatum Aiton) blueberry cultivar (Ozarkblue) in Oregon, USA. The study found no effect of harvest interval on yield, little-to-no loss in fruit quality, and some increase in TSS/TA. The results suggested that extending harvest intervals to 12 days was feasible with a 64% cost reduction, compared to 4-day hand-harvest intervals. However, longer harvest intervals will result in a greater proportion of overripe, soft fruits. Soft fruits at harvest are more prone to firmness losses and internal bruising that may negatively impact quality in postharvest storage, especially if subjected to mechanical impacts during machine harvesting [17,18]. Conversely, shorter harvest intervals can amplify the removal of unripe, green fruit as OTR machine harvesting is less selective than hand harvesting.
Few published studies exist that test the effects of different machine-harvest intervals on NH blueberry. As machine harvesting technologies evolve to harvest fresh market blueberry, practices such as harvesting intervals will need to be tested to ensure efficiency and high fruit quality. The objective of this study was to determine the effect of harvest interval on fruit quality of fresh market NH blueberry harvested using a modified OTR. The cultivar Liberty was selected for this study because it is an important cultivar in the Pacific Northwest and is usually hand-harvested 3–4 times per season. Although ‘Liberty’ is considered difficult to machine harvest for fresh markets due to less concentrated ripening [21] and low firmness [22], it is the only viable mid-late season cultivar that fills the production window during late-July to mid-August [23] in western Washington and in British Columbia, Canada. Therefore, ‘Liberty’ is still a commercially important cultivar and both growers and harvester manufacturers have an interest in testing the machine harvestability of this cultivar.
2. Materials and Methods
2.1. Experimental Design
In total, 10 rows of mature ‘Liberty’ were harvested each at two separate locations with one commercial field site in 2019 (Experiment 1: lat.48°56′ N, long.122°36′ W) in Lynden, WA, USA, and another commercial field site in 2020 (Experiment 2: lat.48°27′ N, long.122°23′ W) in Burlington, VT, USA. Plants used in Experiments 1 and 2 were planted in 2009 and 2010, respectively. Both sites were conventionally managed, with annual pruning, fertilizer application using a combination of dry and liquid fertilizers, and pesticides applied primarily for the management of mummy berry [Monilinia vaccinii-corymbosi (Reade) Honey], gray mold (Botrytis cinerea Pers.:Fr.), and spotted wing drosophila [Drosophila suzukii (Matsumura)]. Specific nutrient and pest management information is not able to be provided by the grower cooperators due to privacy concerns. Each experiment was a 2 × 3 factorial design, replicated three times. The two harvesting methods were hand (control; referred to as “hand harvest”) and modified OTR machine harvest (referred to as “modified OTR”). Each plot was either hand- or machine-harvested twice in both years at 3-, 10- or 14-day intervals in 2019 (Experiment 1) and 7-, 11- or 14-day intervals in 2020 (Experiment 2). Within each plot, the first harvest was the baseline harvest that established the interval and the second was the specific harvest interval treatment (e.g., 3, 10, or 14 days in 2019 and 7, 11, or 14 days in 2020). The selection of these harvest intervals was developed in consultation with growers and machine harvesting cooperators and reflected short, intermediate, and long harvest intervals for the region. One of the ten rows was selected for hand harvest and the other nine rows were randomly assigned a harvest interval treatment. Machine harvest data were collected from single 19 m plots within each row and served as the experimental unit. Hand harvest data were collected from 3 adjacent 8.5 m long plots within one row and each was assigned a harvest interval. The size of hand-harvested plots had to be reduced to one plot per interval relative to machine-picked plots due to a shortage of hand pickers. Any remaining fruits after harvesting the treatment plots or rows were harvested by the growers using a conventional OTR.
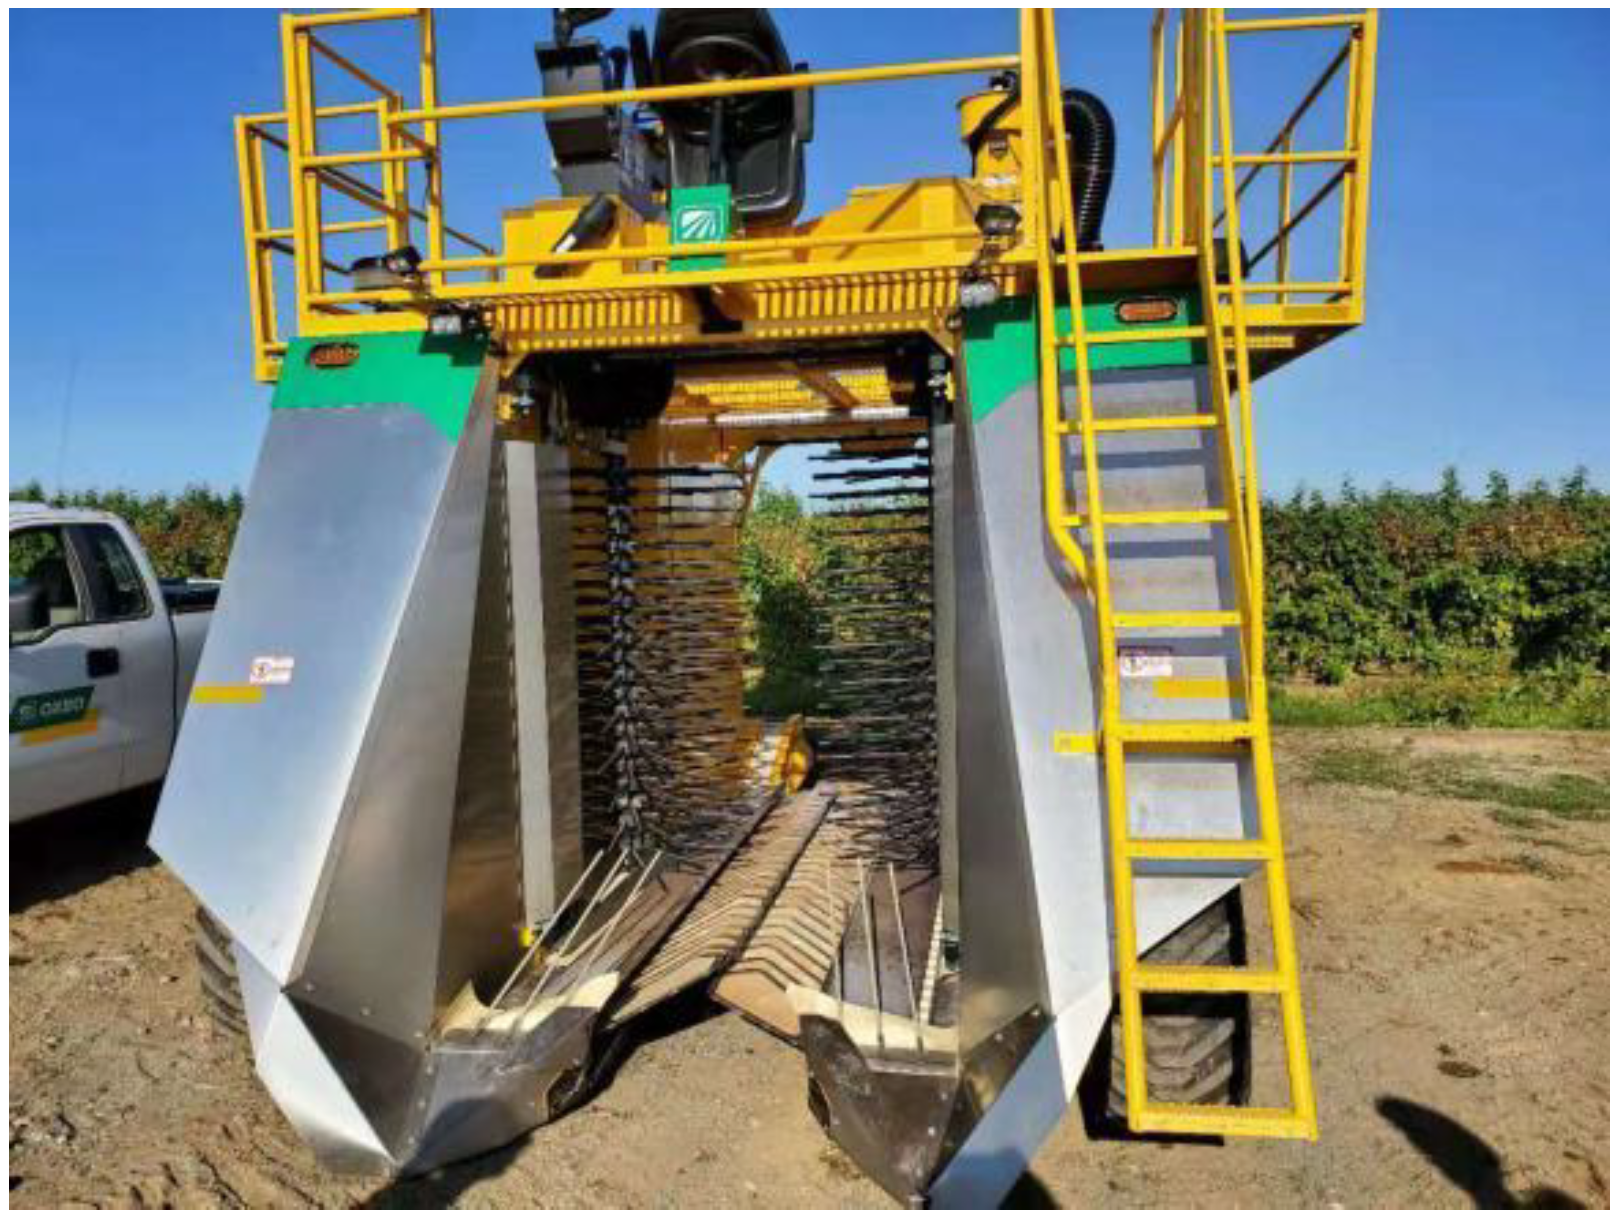
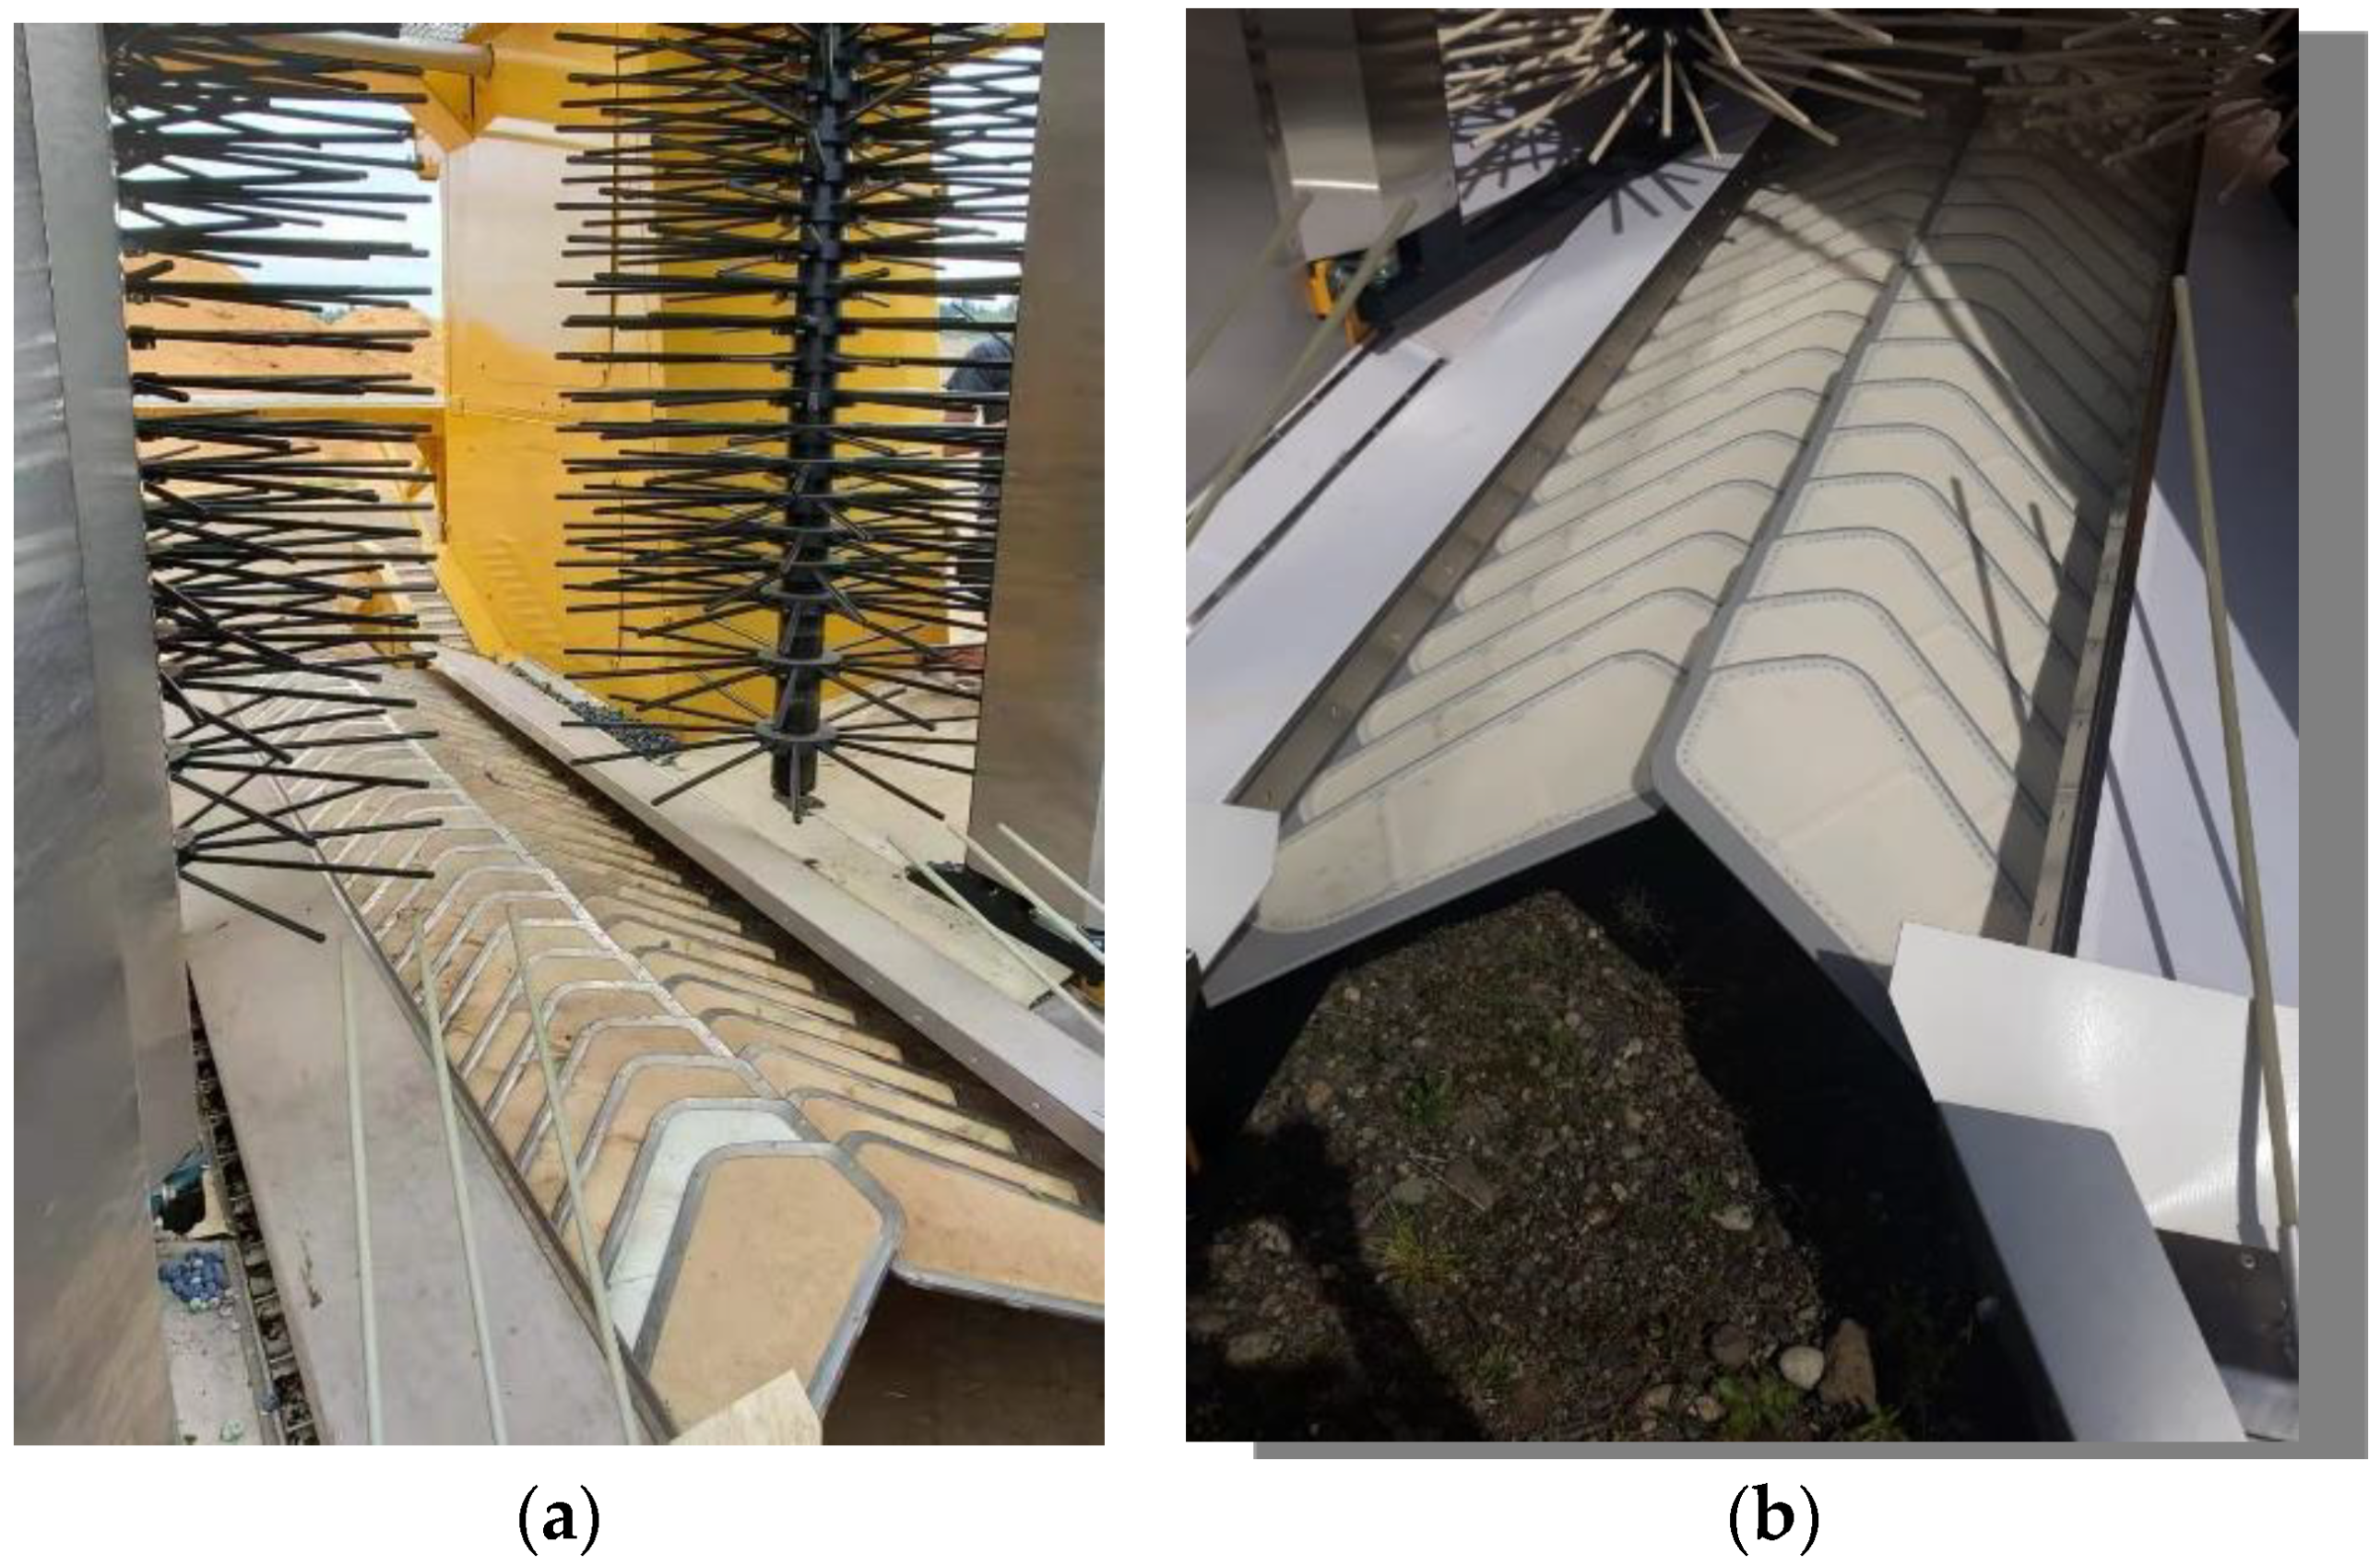
All of the machine harvest rows and hand-harvested plots were gently harvested on 12 August 2019 and 11 August 2020 using a modified OTR to remove the ripest fruits and establish a baseline for the interval treatments. The interval treatments were then randomly assigned to rows except for hand-harvest plots in 2019. In 2019, the hand harvest row was harvested by plot designated within the row with the original plots plus an additional plot harvested on each machine harvest day. Table 1 provides a summary of percent blue fruits visually estimated from bushes within plots before and after harvest, as well as harvester ground and head speeds. The harvest date and machine set were determined by growers and machine harvest operators. Differences in percent blue fruit at and remaining after harvest between 2019 and 2020 were due to different operations of the two farms. For both experiments, the modified OTR harvester was an Oxbo 7440 (Oxbo International Corp., Lynden, WA, USA; Figure 1). Modifications to the harvester included the installation of a SoftSurface kit, which consisted of an experimental, food-grade elastomeric polymer installed into catch plates and a soft material mounted on a catch frame suspended above the catch plate surfaces and conveyor belts (Figure 2a). The SoftSurface kit and associated materials were upgraded in 2020 to a food-grade, patent-pending elastomeric polymer that was injection molded and installed into the plastic catch plate frame (Figure 2b). The soft material mounted on catch frames above the catch plates and conveyor belts remained the same between years. Specific details about the polymers are propriety information, but laboratory tests demonstrate it reduces impact force as measured with a blueberry impact recording device [24,25,26]. Bruising among dropped berries is also reduced relative to the standard; polycarbonate hard surface materials found in conventional OTR harvester catch plates only when the elastomeric sheet is not in contact with any surface underneath itself [27]. Since the catch plates on the OTR harvester were overlapping, the adjacent catch plates and a certain amount of the elastomeric sheet rested on the catch plate below.
2.2. Harvest Procedures
Fruits were harvested in coordination with cooperating growers for both experiments. Operation of the harvester including ground and head speed settings of the machine harvester (Table 1) were determined with input from both growers and Oxbo technicians with consideration of the percent mature fruits at each harvest. Berries were harvested between 0800 to 1000 h. At the beginning and end of each machine-harvested plot, harvesters were stopped with the rotary shakers and conveyor system running to clear berries from the conveyor belt (~30 s). This allowed the separation of blueberries between plots. Berries from hand-harvested plots were picked at the same time as the machine-harvested treatments. Berries from each plot were weighed in the field immediately after harvest, and the total yield and number of harvested flats per plot were calculated. Six randomly chosen clusters on each side of machine harvest plots were tagged with flagging tape and berries below the tag were enumerated by maturity category (i.e., blue, red, or green) before and after harvest to estimate the selectivity of the machine harvesters in the first harvest of 2019. For the second harvest, selectivity was visually estimated by percentage blue before and after machine harvesting. In 2020, selectivity was measured at each harvest through cluster counting using the same procedures as the first harvest in 2019. Percentage (%) blue remaining was calculated using the following equation:
% blue remaining = (number of blueberries after harvest)/(number of blueberries before harvest)
2.3. Packing House Procedures
Immediately after harvest, fruits were covered with empty lugs stacked on top to reduce radiant heat exposure and transported to a commercial packing plant to determine packout. The packing line had color and soft sorters (WECO sorters, Woodside Electronics Corp., Woodland, CA, USA) set to commercial standards for the cultivar. ‘Liberty’ in 2019 (Experiment 1) was packed on the same day as harvest. In 2020 (Experiment 2), the berries were held in cold storage at 0.6 °C and then packed and graded the second day. Time differences between harvest and packing were due to different practices implemented on the farms and both are acceptable commercial practices. The final marketable packout and color and soft sort-outs were collected and weighed for each plot, as permitted in the packing house. In a few cases, our samples were inadvertently commingled, and those samples are noted in the results. The percentage of marketable packout and sort-outs due to color and softness were calculated.
2.4. Fruit Quality Assessments
Five plastic clamshells (300 g, Sonoco, Hartsville, SC, USA) of commercially packed, marketable blueberries from each plot were transported to the lab for fruit quality assessments. Berries were transported in insulated coolers with blue ice on the bottom and several layers of paper were placed between the blue ice and clamshells to ensure that condensation on the blue ice did not lead to free moisture on the berries nor freeze the berries. Berries were stored in a walk-in cooler set around 1 °C and maintained at 91% relative humidity for 28 days. Fruit quality measurements were collected 1, 7, 14, 21, and 28 days after storage. Firmness was measured 4 h after removal of berries from cold storage to ensure the fruits were at room temperature and comparable across treatments. Firmness was measured from a 50-berry sample from each plot using a FirmTech II instrument (Bioworks, FirmTech II, Bioworks, Wamego, KS, USA). The instrument was set with maximum and minimum compression forces of 250 g/mm and 25 g/mm, respectively.
The remaining berries after firmness measurements were collected and frozen for later fruit quality analyses that included TSS, juice pH, and TA. Berries were hand-squeezed using cheesecloth through a funnel into a plastic cup to produce ~40 mL of juice. TSS was determined using a digital refractometer (H19680 Refractometer; Hanna Instruments, Woonsocket, RI, USA). Juice pH and TA as percentage citric acid were measured using digital titrators (HI-84532; Hanna Instruments, Woonsocket, RI, USA, in 2019; HI-922 Autosampler; Hanna Instruments, Woonsocket, RI, USA, in 2020) to an end point of pH 8.2. The sugar to acid ratio was calculated as % TSS/TA. Total soluble solids, juice pH, and TA data were performed in triplicate.
2.5. Data Analysis
Data were evaluated for normality using the Shapiro–Wilk test and equal variance using Bartlett’s test prior to analysis of variance in R-studio (R Development Core Team; R Foundation for Statistical Computing, Vienna, Austria). No data transformations were needed. Data were analyzed by harvest type, harvest interval, and the interaction between them using a two-way ANOVA, and post hoc multiple comparison analyses were conducted using Tukey’s HSD test. Individual variables were considered significant at α < 0.05. Fruit quality data were combined across an interval when there was no harvest method nor harvest method by interval interactions.
3. Results
3.1. Packout
In 2019, interactions of harvest method and interval had different effects on packout, color, and soft defects (Table 2). The main effects of harvest method and interval were also observed on percentages for packout, color, and soft defects. There was no packout difference in hand-harvested fruits and the first machine harvest and 10-day interval. Machine-harvested fruits from the 14-day interval had packout in between the 3-day interval and remaining intervals. Color defects were highest at the 3-day machine-harvest interval. The 10-day machine-harvest interval had intermediate color defects and no difference was observed among the rest. Soft defects were also highest at the 3-day machine-harvest interval, followed by the 14-day machine-harvest interval. In addition, 3- and 14-day hand-harvest intervals had fewer soft defects than the 14-day machine-harvest interval, but soft defects were higher than both first harvest by machine and by hand. Soft defects from 10-day intervals by hand and machine were similar.
In 2020, there were no differences in packout and soft defects between hand and modified-OTR harvest at the first harvest, while color defects among machine-harvested fruits were higher than hand-harvested fruits (Table 3). There was no difference in packout and color defects between the first harvest and 7-day interval among fruits harvested using either hand or modified OTR. More soft defects were found at the 7-day interval relative to the first harvest among machine-harvested fruits.
3.2. Firmness
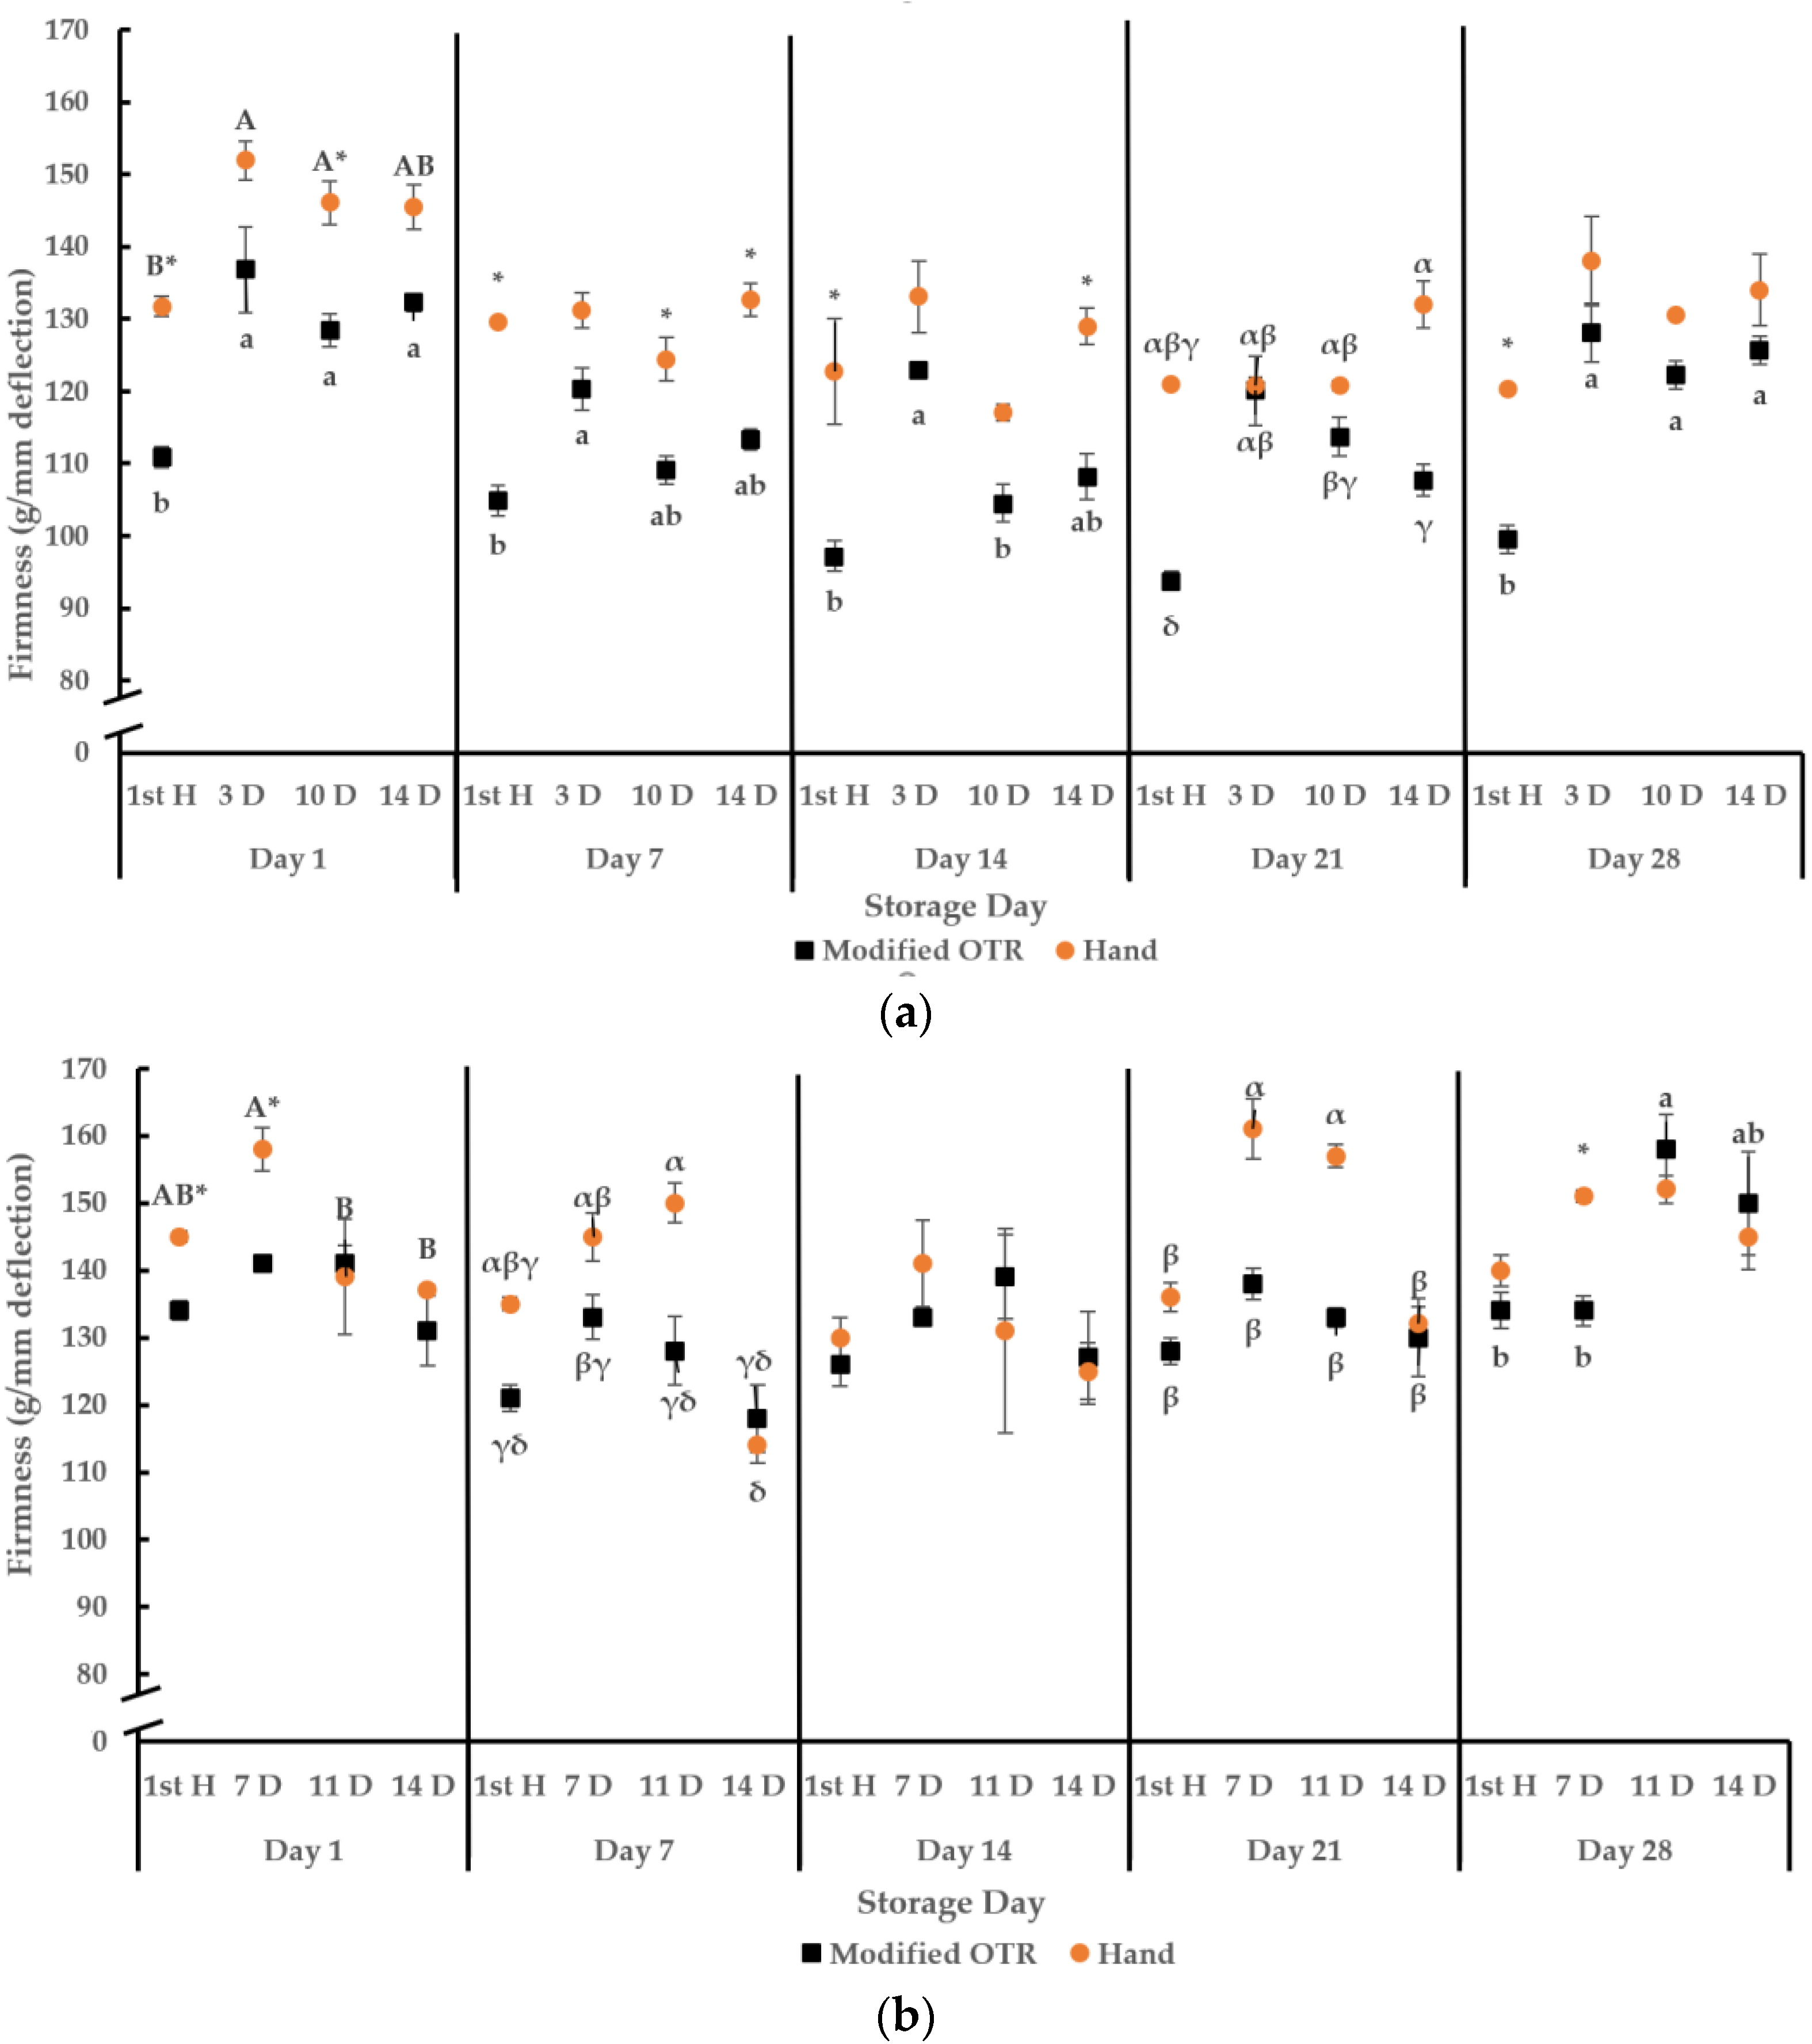
In 2019, there were no interaction effects of harvest method and interval on berry firmness except on day 21. There was an effect of the harvest method on firmness (Figure 3a). Overall, the firmness of hand-harvested fruits was greater than machine-harvested fruits, especially at the first harvest. Firmness among hand-harvested fruits was greater than machine-harvested fruit throughout the storage period for fruits collected at the first harvest. At the 10-day interval, firmness was greater among hand-harvested fruits on storage days 1 and 7, while it was greater on storage days 7, 14, and 21 among hand-harvested fruits at the 14-day interval. The effects of harvest interval among hand-harvested fruits were only found on storage day 1 in which fruits from the first harvest had lower firmness than fruits from the 3- and 10-day intervals. Machine-harvested fruits from the first harvest had lower firmness throughout the storage periods. Firmness among fruits at the 3-, 10- and 14-day intervals was the same or similar on storage days 1, 7, and 28. The firmness of fruits at the 3-day interval was greater than the 10-day interval on storage day 14 and greater than fruits at the 14-day interval on storage day 21.
In 2020, interaction effects of harvest method and interval on firmness were observed on storage days 7 and 21. There was an effect of the harvest method on firmness when compared within a harvest interval (Figure 3b). Firmness among hand-harvested fruits was greater than fruits harvested by machine on storage days 1 and 7 at the first harvest, storage days 1, 21, and 28, at the 7-day interval, and storage days 7 and 21, at the 11-day interval. There was a harvest interval effect among hand-harvested fruits. The firmness of fruits harvested by hand at the 14-day interval was the same or similar to the first harvest and the 11-day interval and lower than the 7-day interval on storage day 1. Firmness at the 14-day interval was lower than firmness at the 7- and 11-day intervals on storage days 7 and 21, while the same as the first harvest on day 21. A harvest interval effect on firmness among machine-harvested fruits was only observed on day 28 in which fruits harvested at the 11-day interval had greater firmness than the first harvest and the 7-day interval, while fruits at the 14-day interval were similar to all other intervals.
3.3. Total Soluble Solids
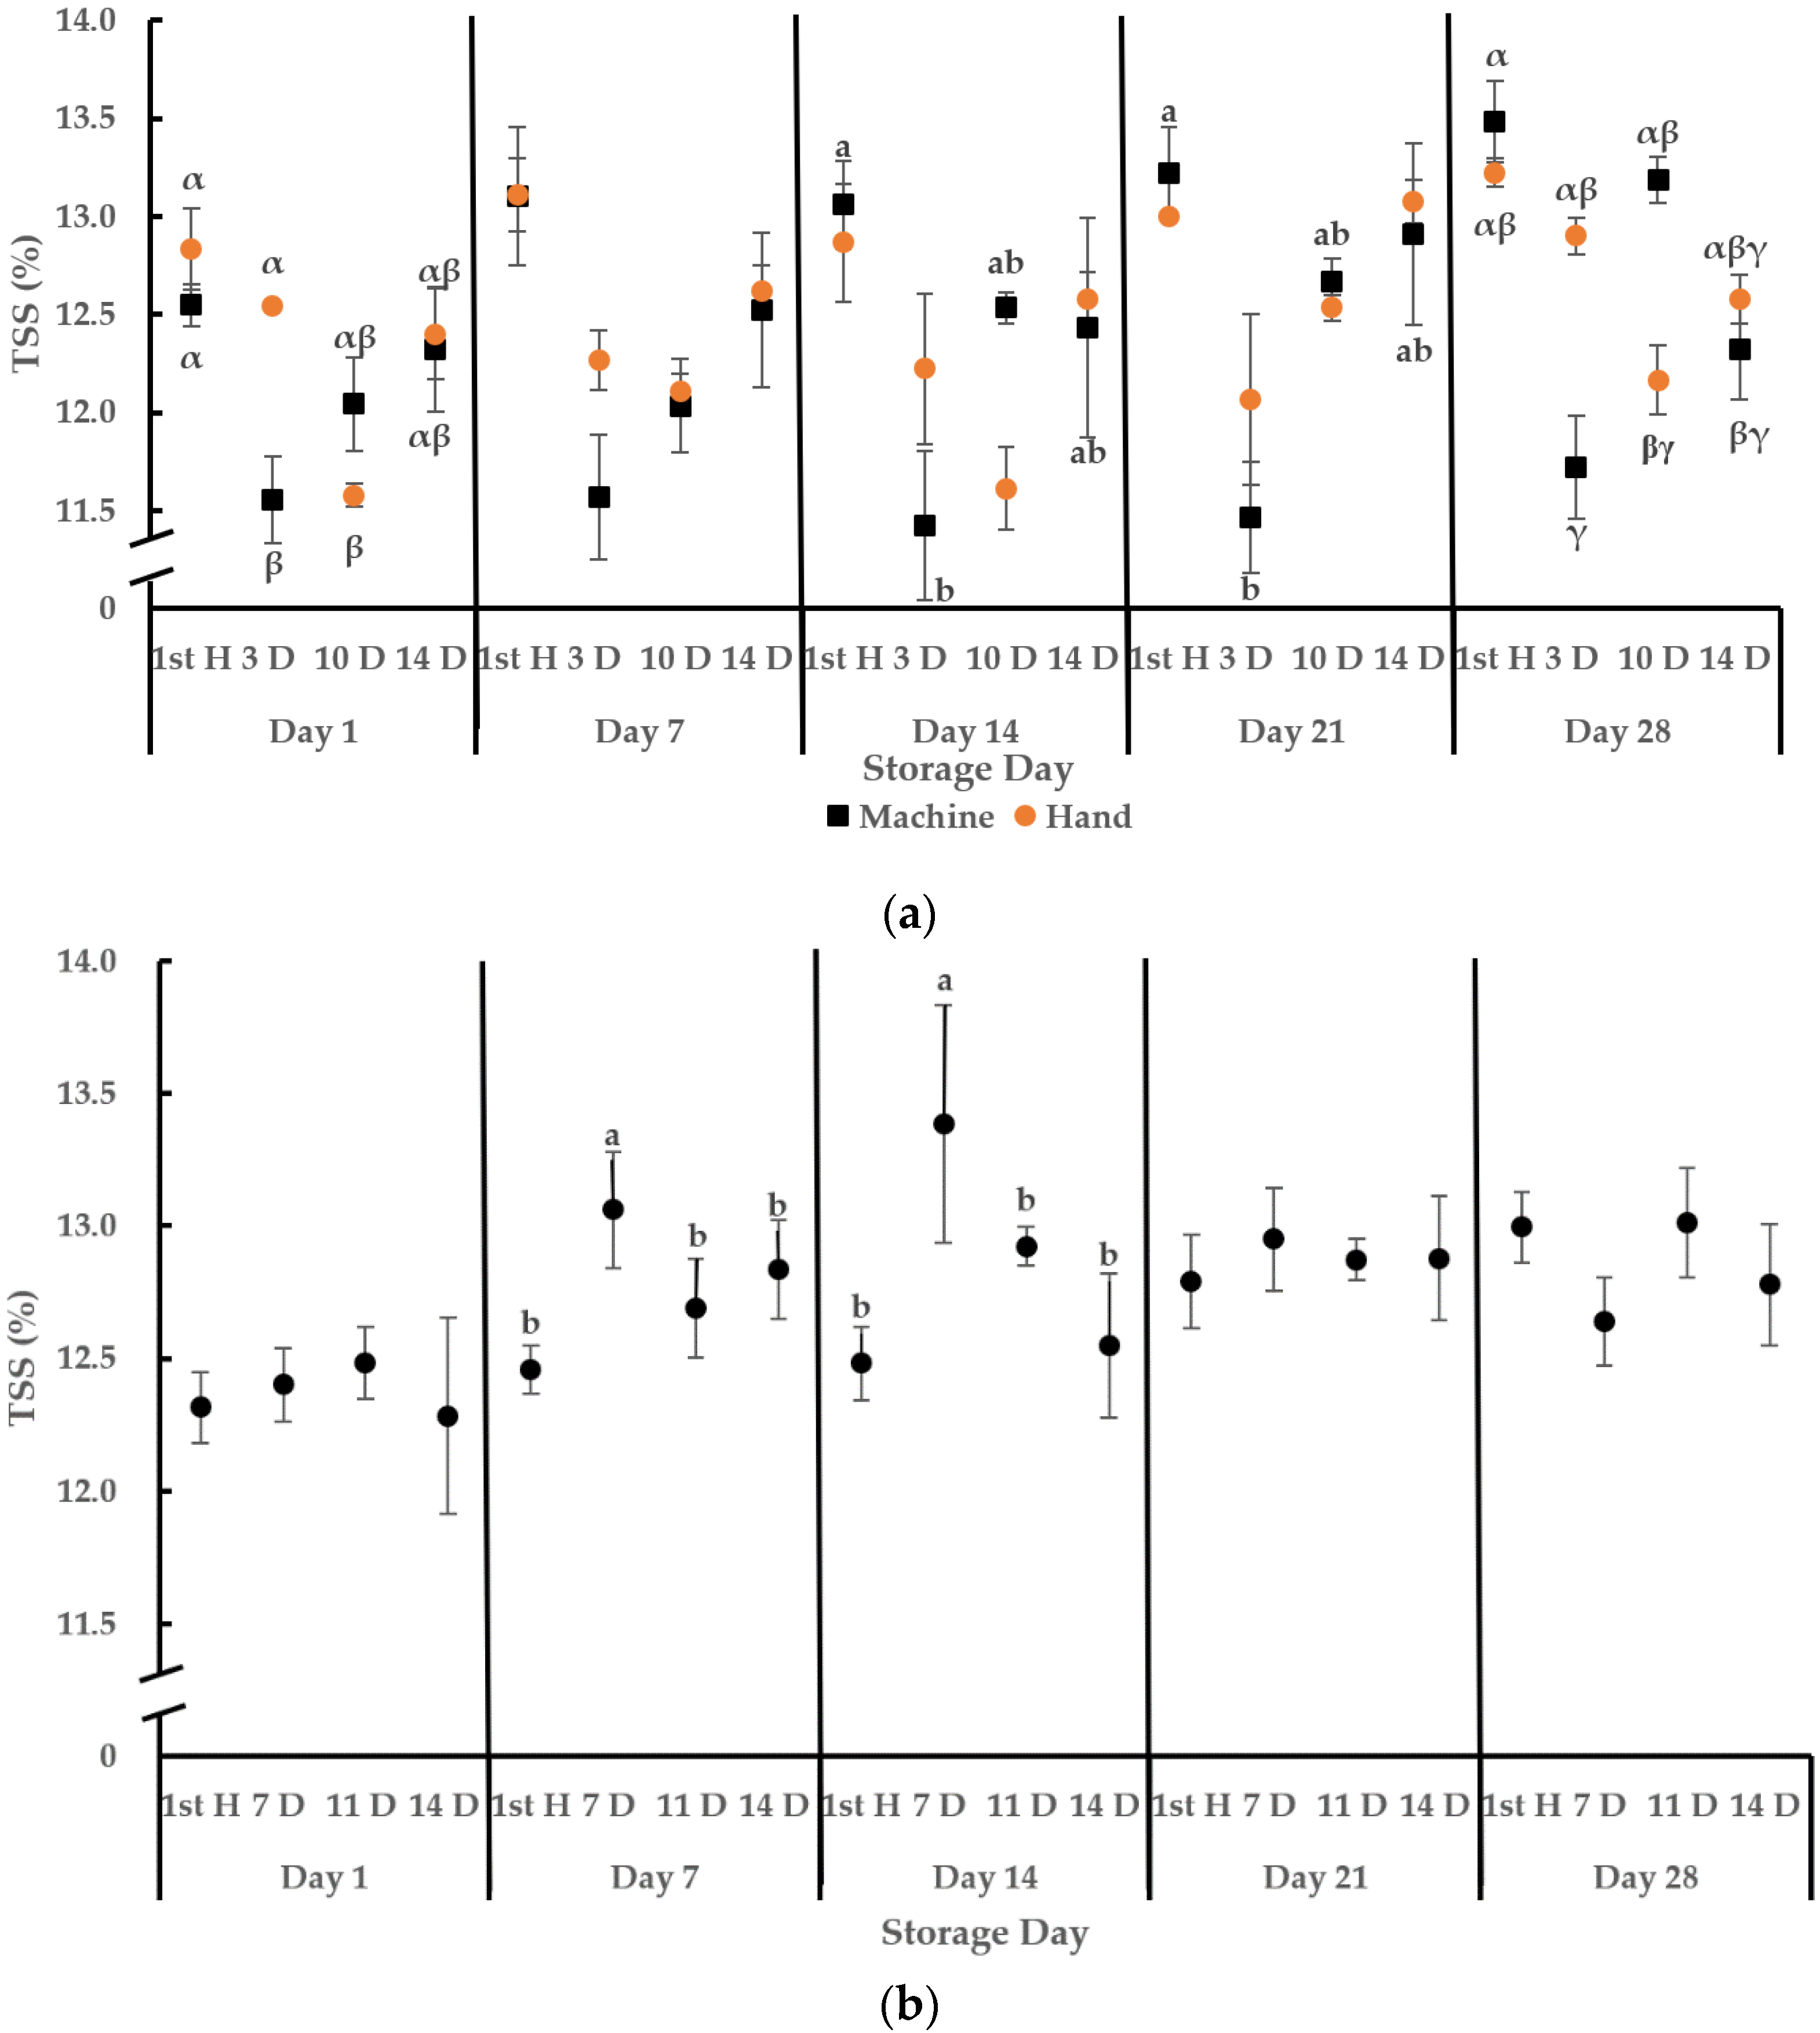
In 2019, an interaction effect of harvest method and interval was found for TSS on storage days 1 and 28. There was no effect of harvest method on TSS when compared within the same harvest interval and no harvest interval by method interaction (Figure 4a). Fruits at the 3-day interval had lower TSS than fruits from the first harvest throughout storage. TSS from fruits at 10- and 14-day intervals were the same or similar to fruits at the 3-day interval except on storage day 21 when they were the same as the fruits at the first harvest. In 2020, there was no effect of the harvest method on TSS when compared within the same harvest interval. There was a harvest interval effect on storage days 7 and 14, in which fruits harvested at the 7-day interval had higher TSS than fruits at the first harvest, and 11- and 14-day intervals (Figure 4b).
3.4. Initial Juice pH
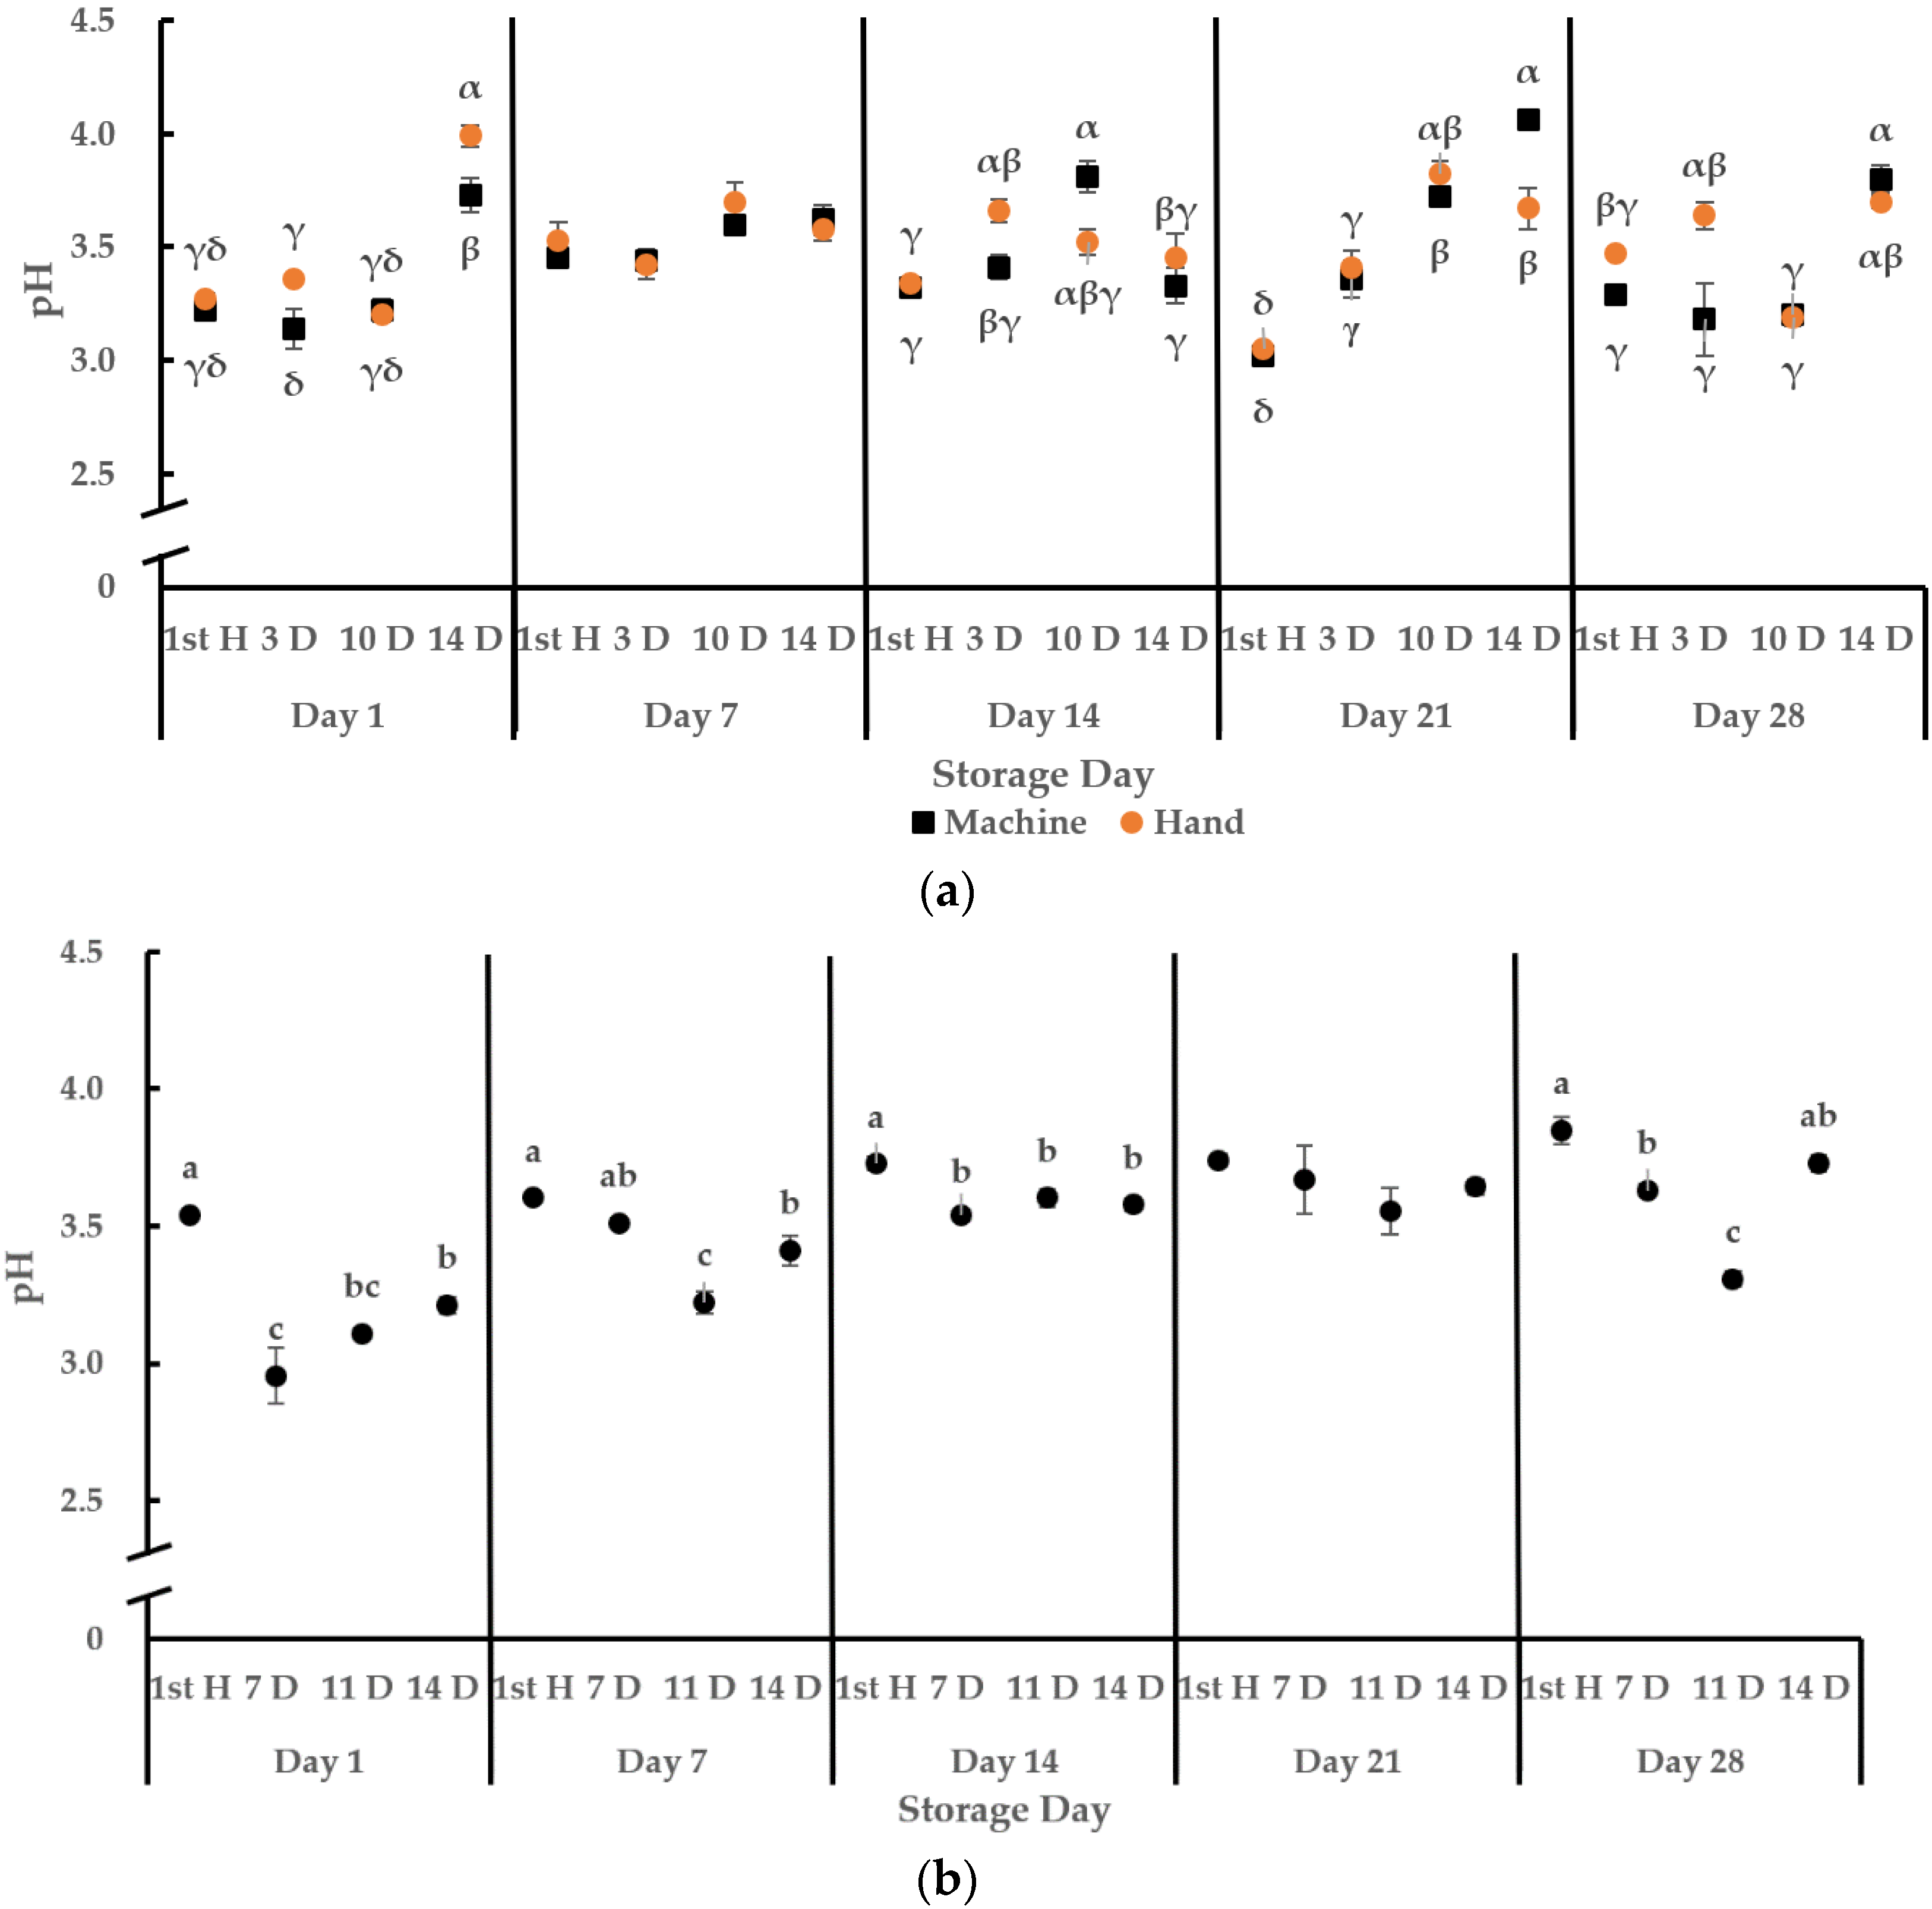
In 2019, there was an interaction effect of harvest method and interval on juice pH on storage days 1, 14, 21, and 28. There was also an effect of the harvest method on juice pH within the same harvest interval (Figure 5a). Juice pH among hand-harvested fruits was greater than machine-harvested fruits at the 3-day interval on storage days 1 and 28. Greater pH was found among hand-harvested fruits at the 14-day interval on storage day 1 relative to machine-harvested fruits, while this was the opposite on storage day 21. The effect of harvest interval varied among hand-harvested fruits, and pH at the first harvest was generally lower. Greater pH was found at the 14-day interval on storage day 1, at the 3-day interval on storage day 14, at both 10- and 14-day intervals on storage day 21, and at the 3- and 14-day intervals on storage day 28. Juice pH in machine harvested fruits from the first harvest and 3-day interval was also lower. Greater pH was found at the 14-day interval on storage days 1, 21, and 28 as well as at the 10-day interval on storage day 14.
There was no interaction effect of harvest method and interval on juice pH and no effect of harvest method when compared within the same harvest interval in 2020 (Figure 5b). Juice pH was greater in fruits from the first harvest throughout storage except on day 21 when there was no interval effect. Fruits from the 14-day interval had intermediate pH on storage days 1 and 7, while fruit at the 7-day interval had intermediate pH on storage day 28. The lowest pH was found in fruits from the 7-day interval on storage day 1, and at the 11-day interval on storage days 7 and 28.
3.5. Titratable Acidity
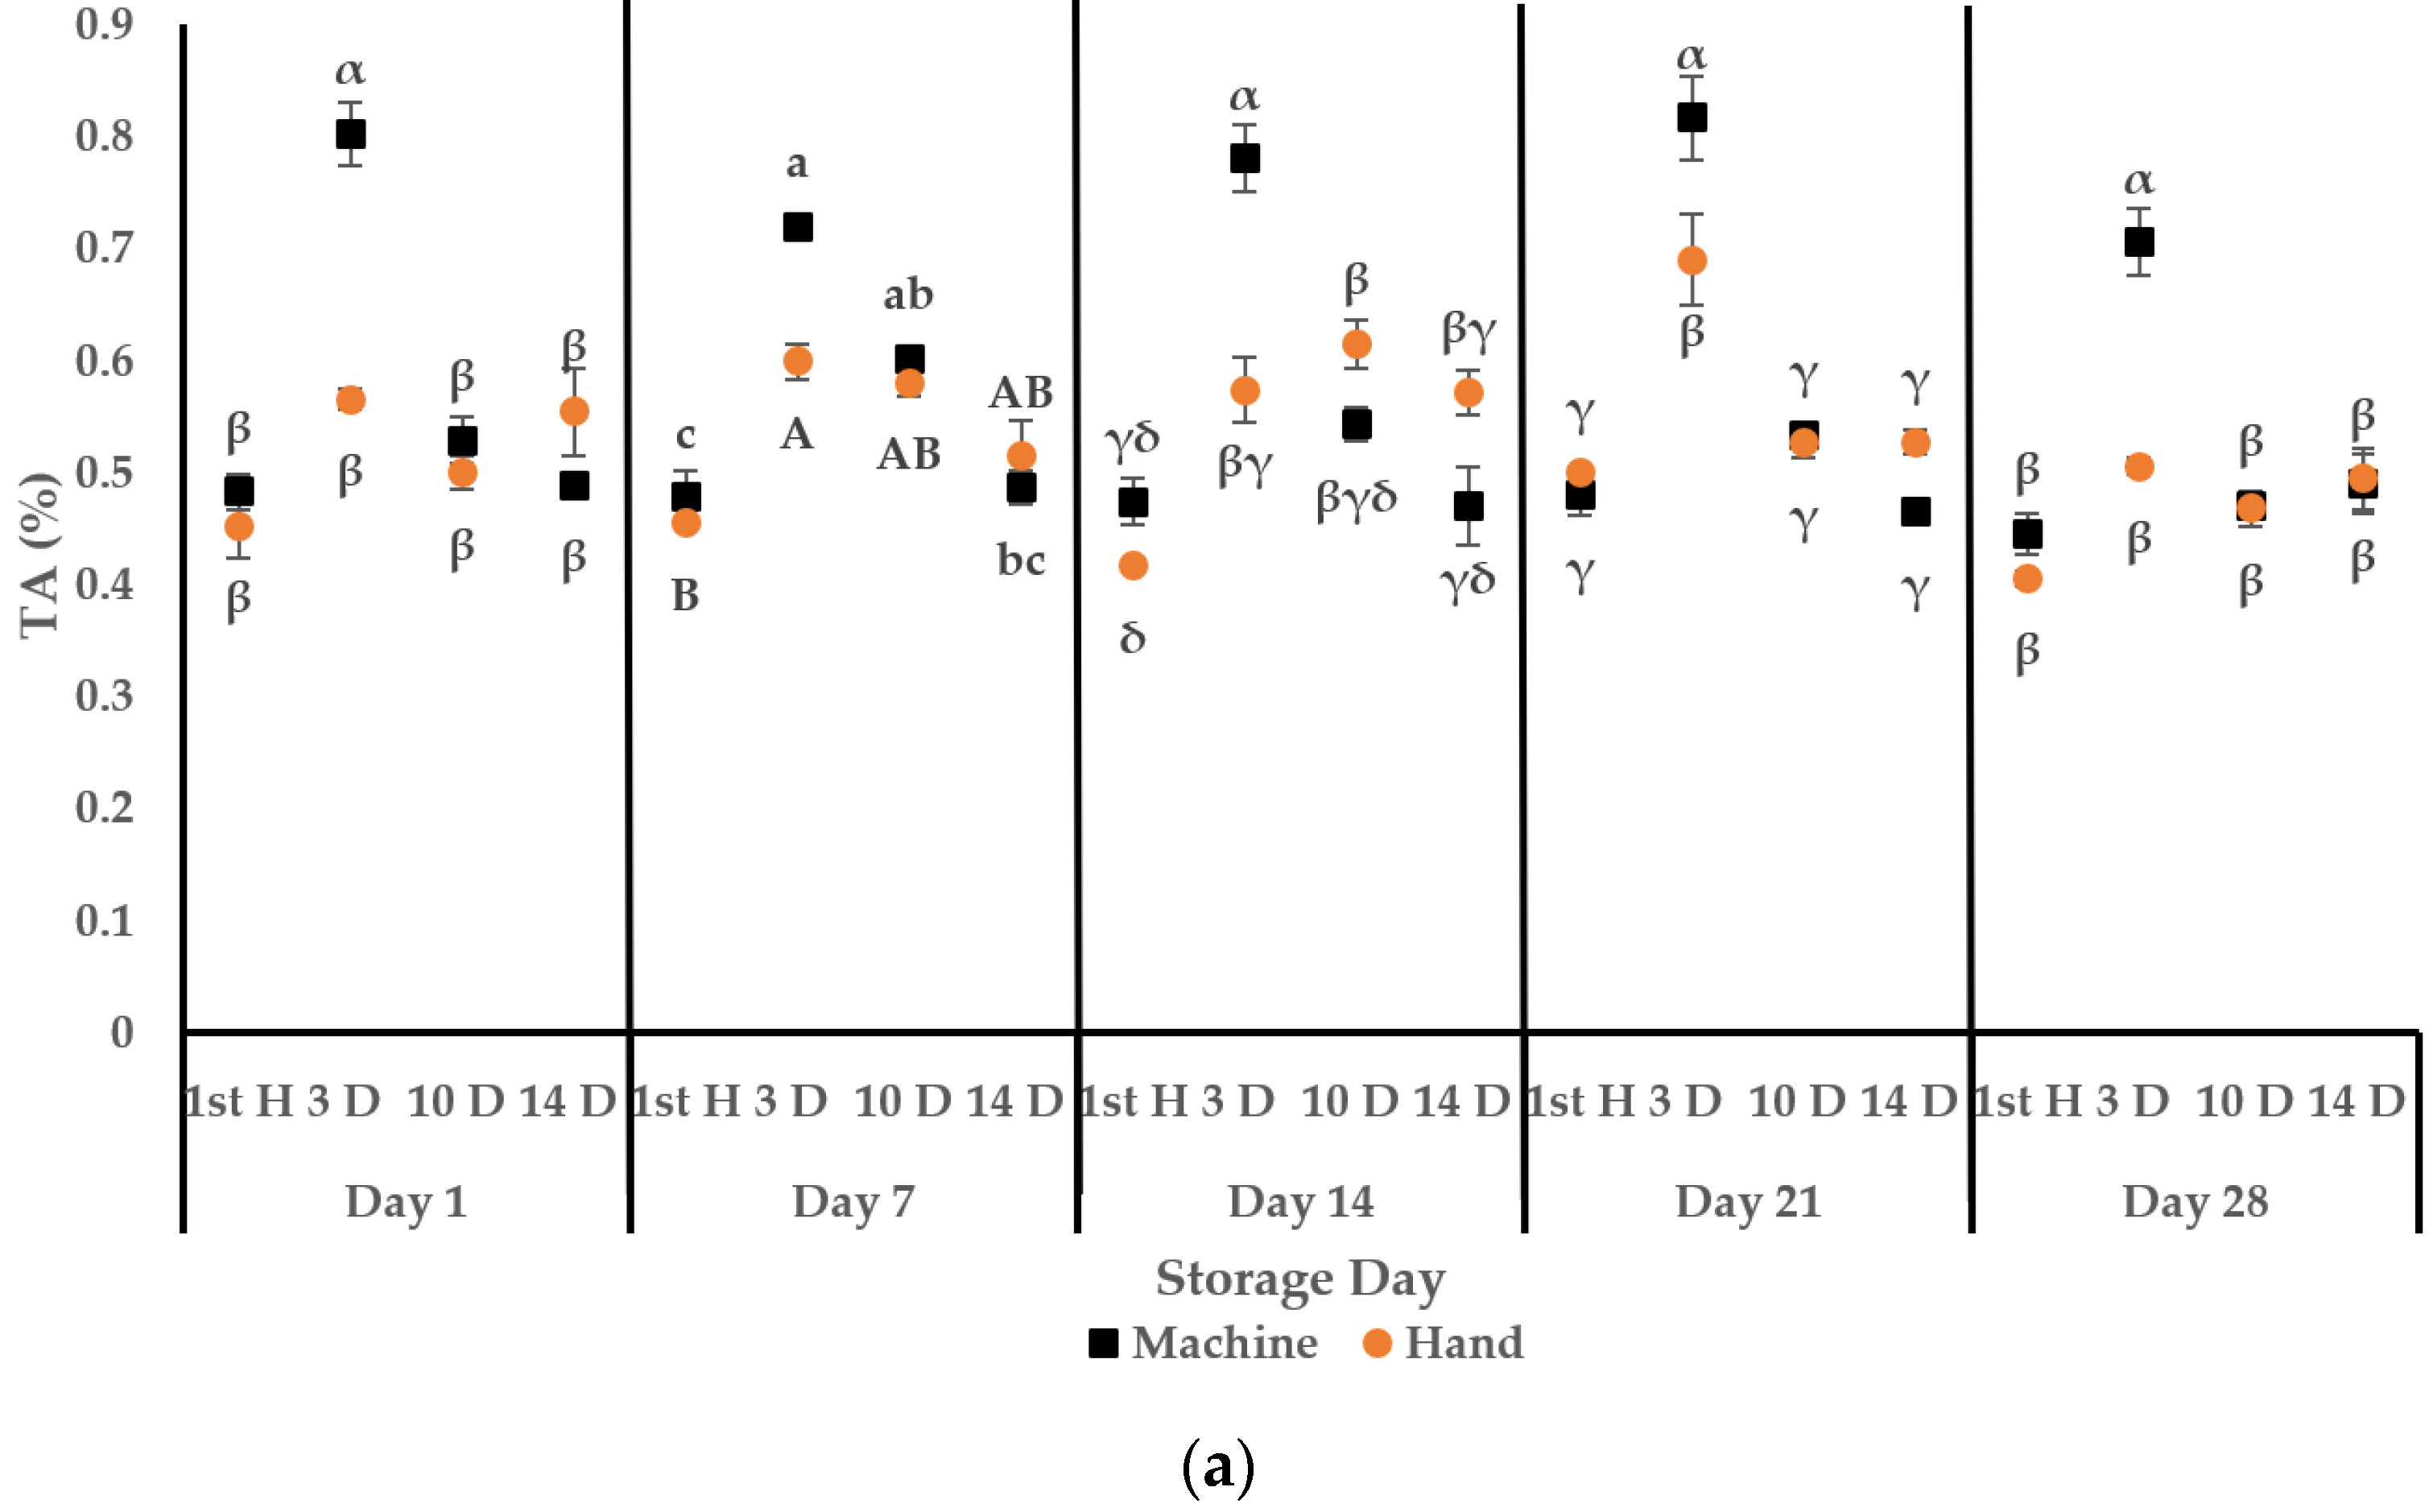
In 2019, TA showed interaction effects of harvest method and interval throughout the storage period except on storage day 7. The overall main effect for the harvest method at all storage dates was not significant (Figure 6a). The 3-day interval also resulted in a greater TA than the first harvest through 28 days of storage. TA of fruits from the 10- and 14-day intervals was the same as the first harvest and lower than the 3-day interval on storage days 1, 21, and 28. TA in fruits at the 10-day interval was the same or similar as the 3-day interval and greater than fruits at the first harvest on storage day 7, and fruits at the 14-day interval had the same or similar TA to the first harvest on storage days 7 and 14.
In 2020, there was only an effect of harvest interval (Figure 6b). TA among fruits at the 7-day interval was greater throughout storage, and TA among fruits at the first harvest, 11- and 14-day intervals was the same except on storage day 28. TA in fruits from the 11-day interval was intermediate and greater than the 14-day interval on storage day 28. Fruits at the first harvest had similar TA to the 11- and 14-day intervals.
3.6. Ratio of TSS/TA
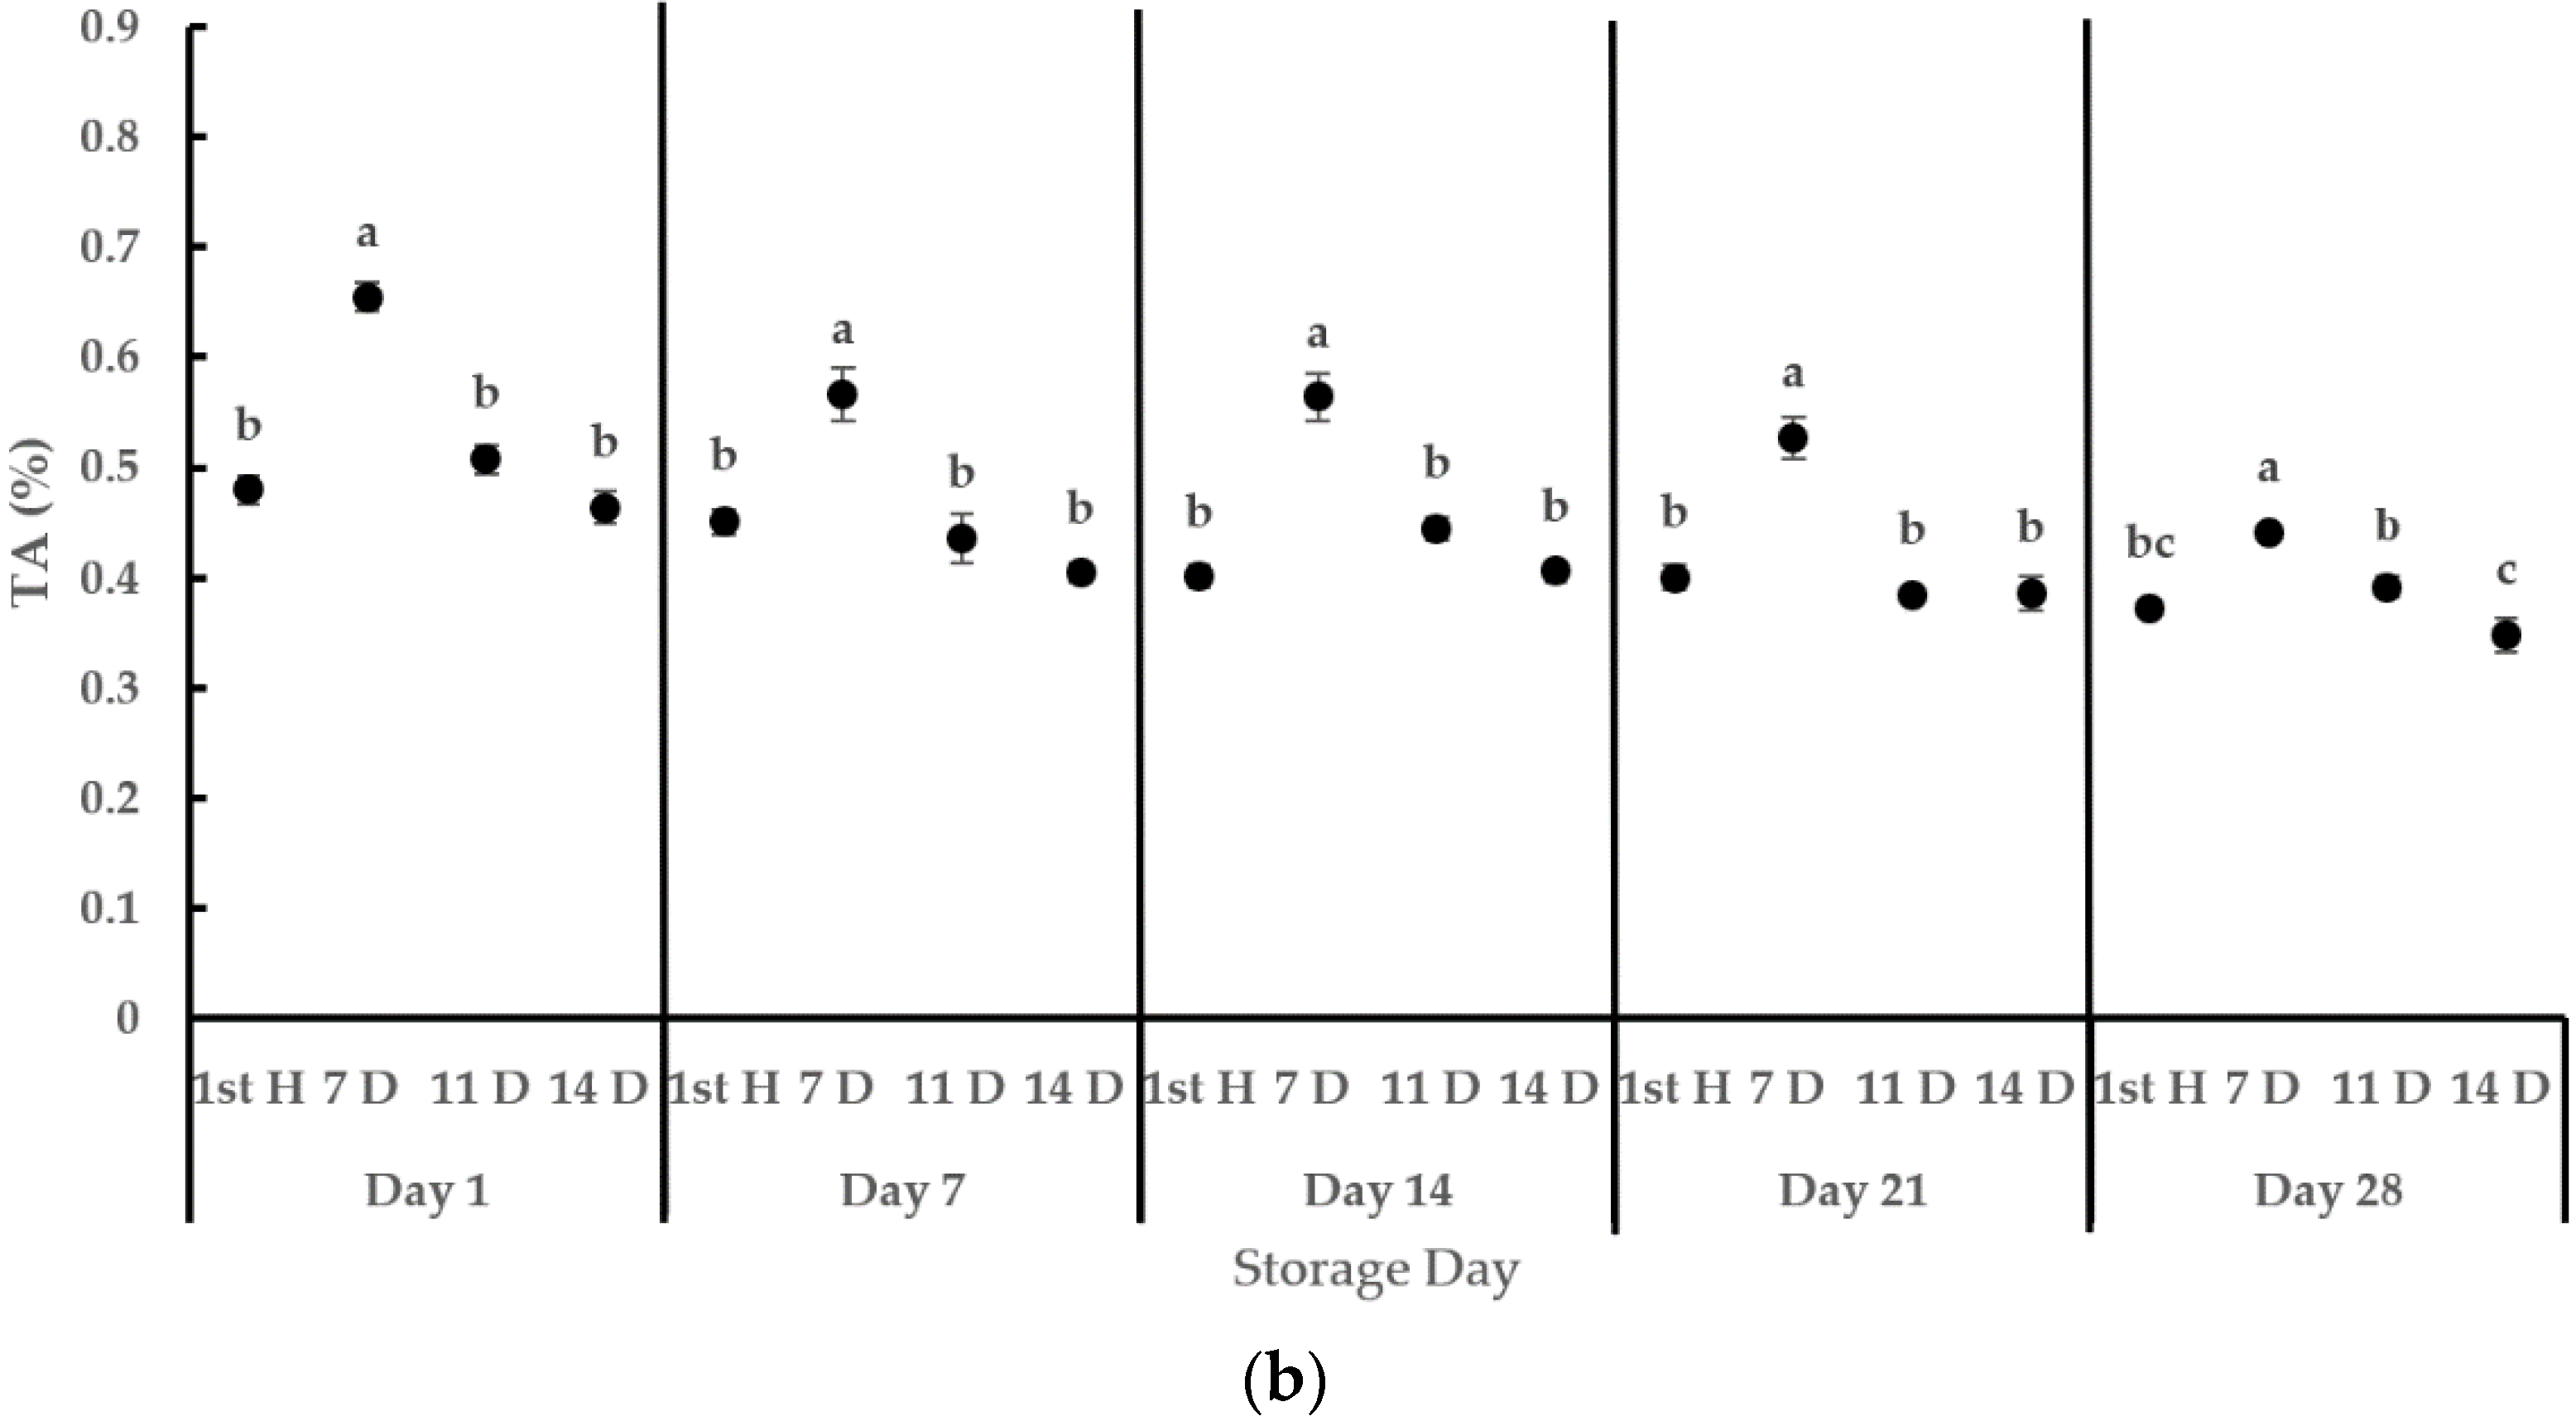
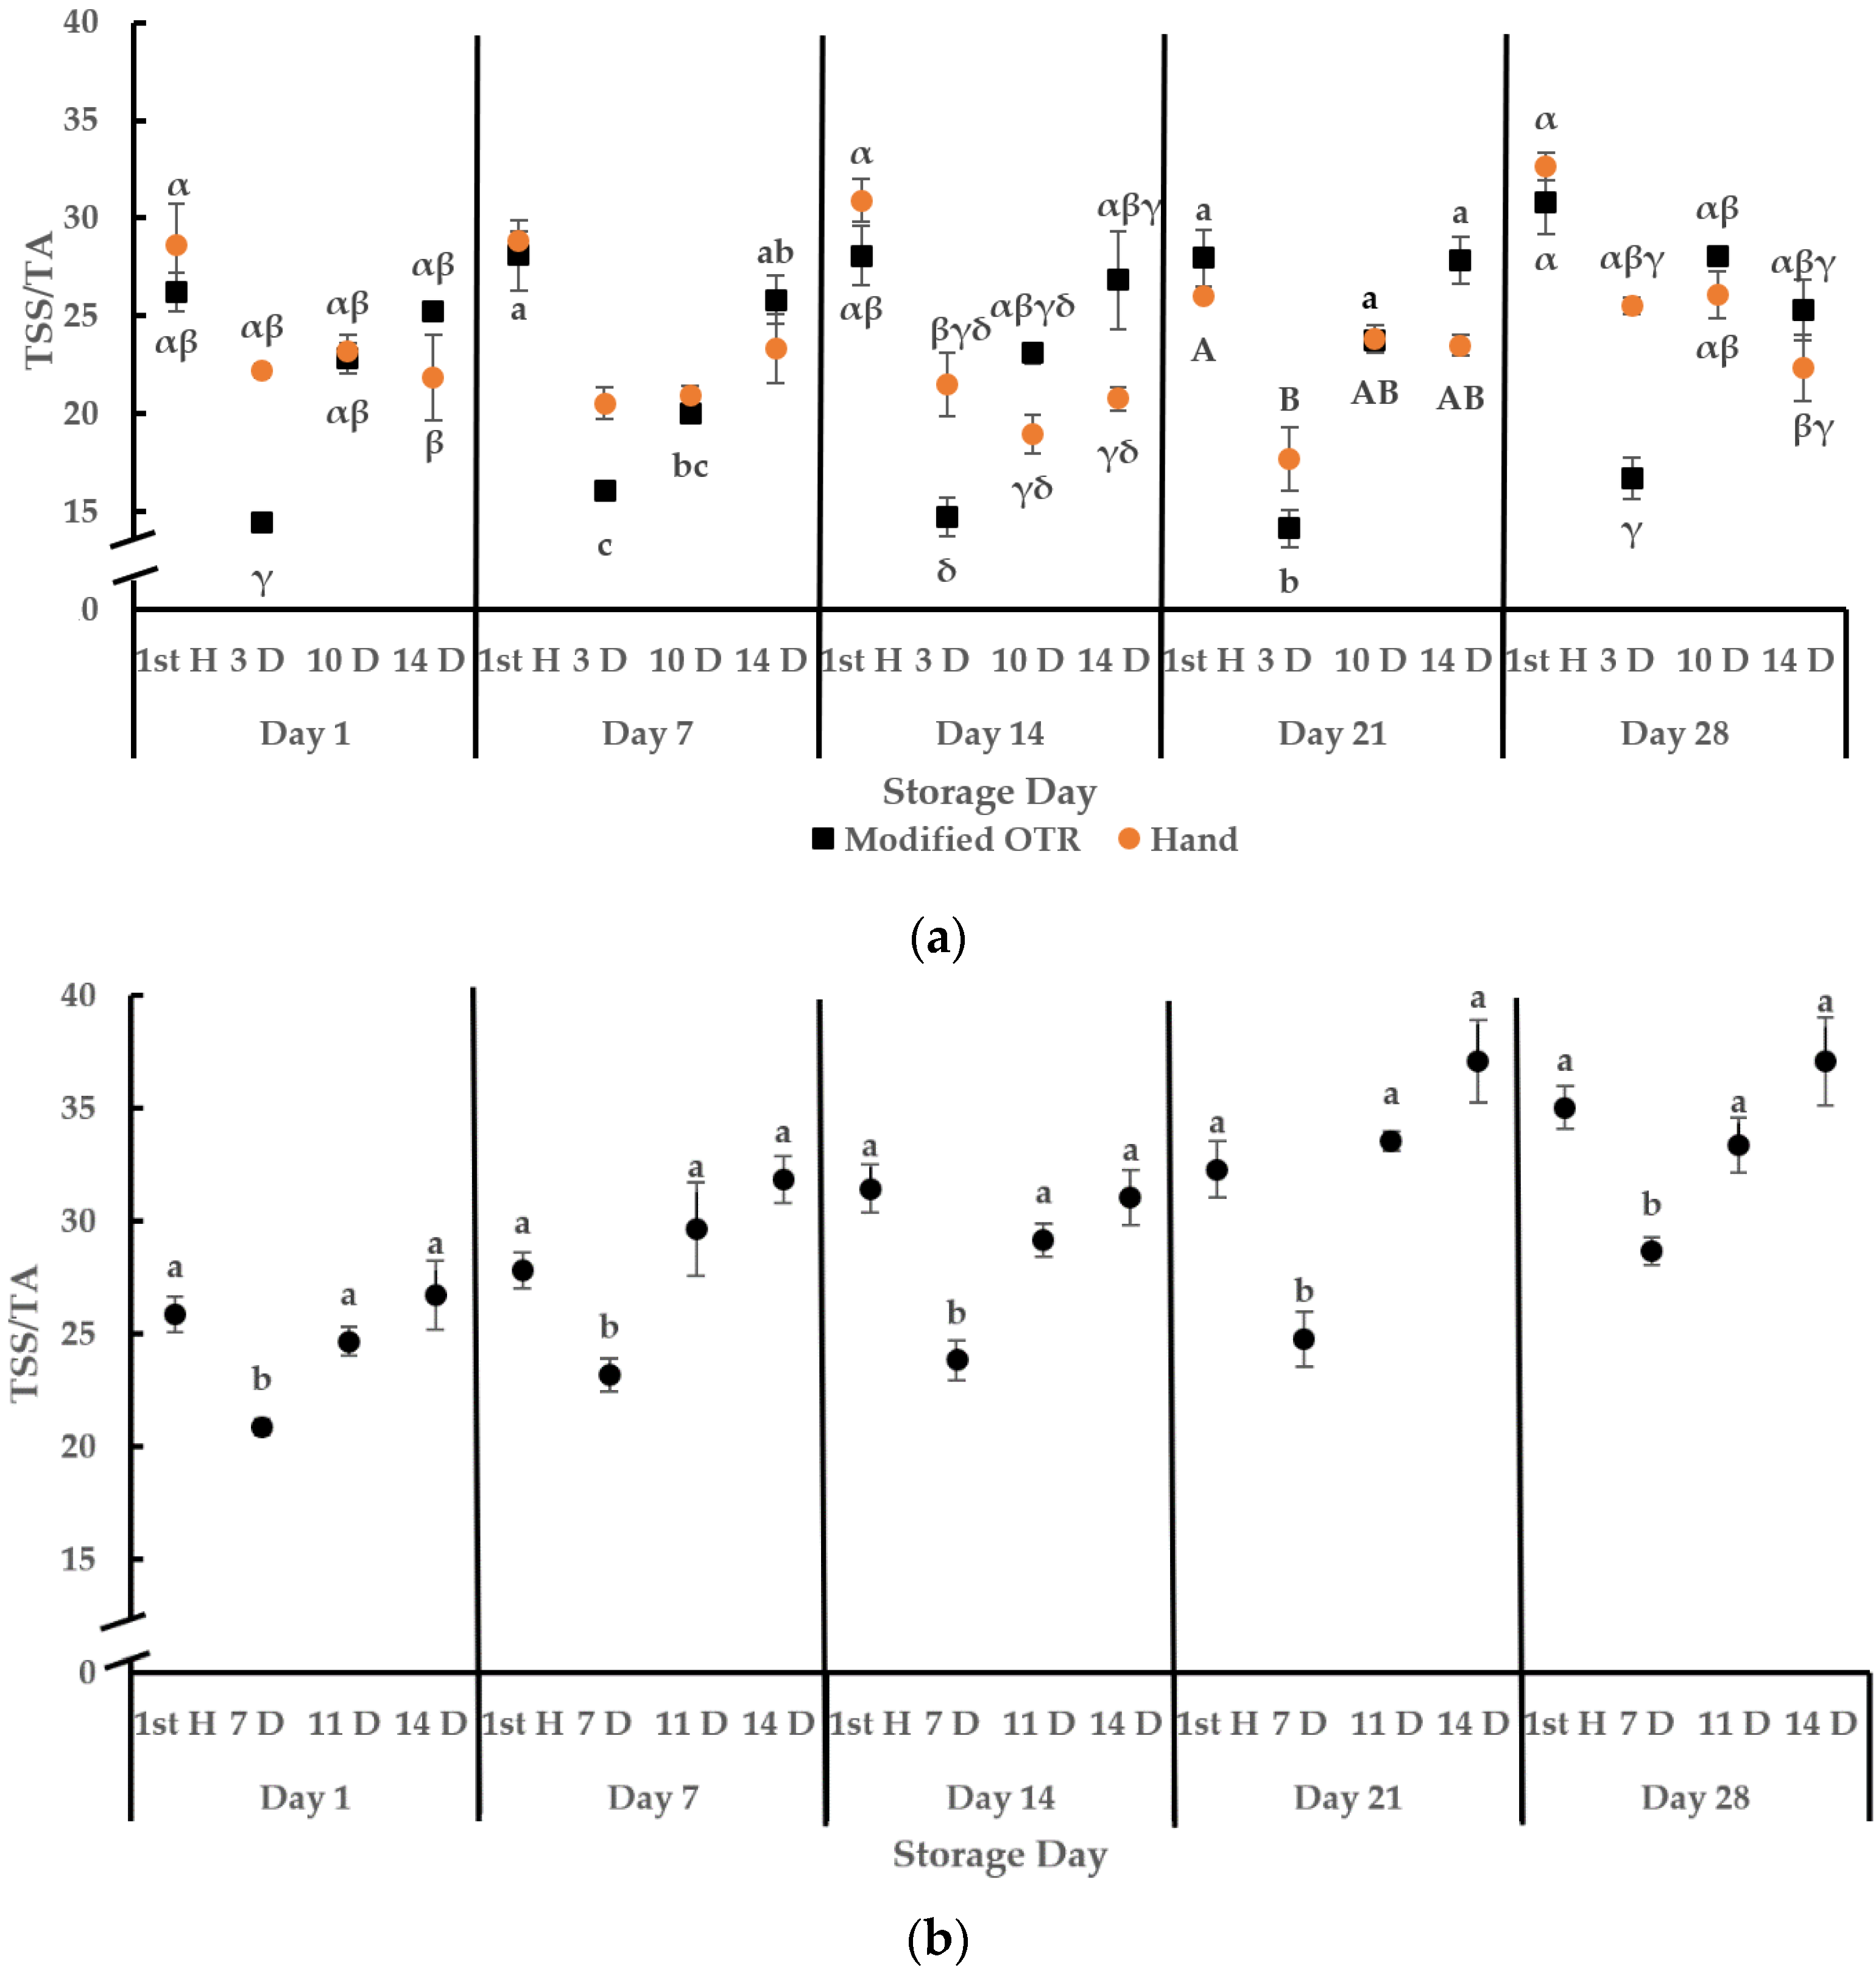
In 2019, there were interaction effects of harvest method and interval on TSS/TA on storage days 1, 14, and 28 and harvest interval effects throughout storage (Figure 7a). TSS/TA in fruits was higher at the first harvest, while it was lower at the 3-day interval throughout storage but was the same or similar to the 10-day interval on storage days 1, 7, and 14 and 14-day interval after 28 days of storage. TSS/TA in fruits at the 10-day interval was the same or similar to the fruits at the first harvest and greater than TA at the 3-day interval after storage day 21. TSS/TA in fruits from the 14-day interval was the same or similar to the fruits at the first harvest except on storage day 28. In 2020, there was no harvest method by interval interaction, and no effect of harvest method on TSS/TA when compared within the same harvest interval (Figure 7b). TSS/TA in fruits at the 7-day interval was lower than the rest of the intervals.
4. Discussion
Harvest interval had a larger effect on chemical variables of fruit quality relative to the harvest method. Packout and firmness were negatively impacted by machine harvesting. Similar results were reported for southern highbush blueberry (complex hybrids of V. corymbosum and V. darrowii Camp) in Florida, USA, by Sargent et al. [9] using a modified harvester with similar soft catching plate materials but using hand-held shakers instead of a rotary drum shaker. Firmness was observed to decrease, while the incidence of bruising increased among fruits harvested using a modified harvester when compared to hand harvest. However, the magnitude of fruit quality declines in terms of reduced firmness and increased bruising was greater for conventional machine-harvested fruits relative to the modified harvester. In our study, the modified harvester was upgraded in 2020. A softer polymer was used for the catching surfaces, and the hard metal fastening rings at each catch plate frame was converted to plastic and decreased in size, which slightly reduced the chances of berries hitting hard surfaces and becoming bruised. An improvement in firmness among machine-harvested fruits was subsequently observed, and firmness of machine-harvested fruits in 2020 were all above 110 g/mm during 4 weeks of storage. These effects could also be attributed to different harvesting times and corresponding maturity, but this is unlikely given berries were more mature in 2020 and were correspondingly more susceptible to firmness losses.
Few differences in TSS, pH, TA, and TSS/TA among hand-and machine-harvested fruits within each harvest interval were detected. These data show harvest method has less of an effect than harvest timing on these variables for berry quality under the conditions of the study, since both hand- and machine-harvested fruit were harvested at a similar maturity stage.
Similar effects on fruit quality variables are not expected, as harvest technology can impart large effects on quality and storability. Although fruit quality losses occurred when using the modified harvester, modified machine harvesting is often more economically feasible and fruit quality is frequently improved in terms of reduced bruising and greater firmness compared to conventional OTR harvesters [8,9,28]. High labor costs and reduced labor availability have become bottlenecks to the blueberry industry [3]. The benefit of using an OTR harvester is that it can reduce labor needs from 1300 to 8 labor h/ha thereby reducing harvest labor costs by 85–98% [6,29]. Gallardo et al. [30] studied the net revenue of harvest methods and found the modified OTR harvester similar to what was used in this experiment had the highest net present revenue, while net revenue was lowest in hand harvesting scenarios. Due to these labor issues, there is a trend for more machine harvesting fresh market blueberries and extending harvest intervals [20].
In each experiment, the percentage of mature (blue) berries left on bushes after harvesting was similar across experimental plots. This implies the mechanical settings at each harvest were consistent and the cause of packout differences among intervals was mainly due to the maturity stage of fruits. The 3-day machine-harvest interval had a lower packout (60%) relative to 10- and 14-day intervals, along with a higher percentage of color defects (21%). This suggests the 3-day interval is too short to allow berries to ripen adequately before the next machine harvest, even though the visual estimation of fruit maturity based on assessing percent blue fruits on bushes was 60% among the first harvest and 3- and 10-day intervals. This indicates visual observations of bush maturity were not adequate for assessing ripeness and fruit quality, likely because many berries are obscured by leaves and/or are located within the interior of the bush. Additionally, the red coloration that indicates immaturity at the pedicle end is easy to miss. Given that these visual observations were based on grower consultations, the discrepancy between visual observations of bush maturity and actual maturity of harvested fruits supports the development of more robust and less subjective ways to assess maturity and determine optimal machine harvest timing. Ni et al. [31,32] showed deep-learning, combined with 3D photogrammetry and 2D instance segmentation, can determine cluster traits in blueberry that can be used to monitor development and inform harvest timing. It is also possible that the machine was not set optimally to harvest fruits at this stage. In contrast, there were no differences in color defects among different intervals among hand-harvested fruits because hand harvesting is more selective than machine harvesting. Regardless, a higher percentage of immature fruits might slow down the pace of hand harvesting and be costly. Thus, hand harvesting at short intervals (e.g., 3-day interval) is not efficient either.
Machine-harvested fruits from the 10-day interval had more color defects than the 14-day interval, while soft defects at the 14-day interval were higher, resulting in the same packout between machine-harvested fruits at the 10- and 14-day intervals. In 2020, the 14-day interval resulted in a low packout (54%) among machine-harvested fruits. Due to an accidental mixing of sort-outs in the packing house, the individual values of soft and color defects are not known. Considering the high percentage of fruit maturity (80–85% blue in field), we believe the majority of the defects (45% defects) was due to the soft fruit removal because a greater proportion of berries could have been overripe at this harvest time, and soft fruits do not machine pick as well as firm fruits [16,33,34]. The 14-day interval in 2019 had numerically fewer soft defects and a higher packout, compared to the 14-day interval in 2020. The difference may be attributed to the weather during harvest since year and harvest date are known to impact quality variables such as firmness [35]. The average daily temperature was greater and average solar radiation was lower in 2019 relative to 2020 based on WSU AgWeatherNet weather data. This implies that the weather conditions during harvest should also be considered when selecting harvest intervals. Furthermore, fruits in 2019 were harvested at a lower percentage maturity (70% blue in the field), highlighting the importance of considering the overall maturity stages in the determination of harvest intervals. Lastly, the sorting lines in 2019 and 2020 could also have contributed to packout and defect differences, especially if the same sorter settings for defects were not used both years [17]. Settings were requested to be consistent across the study, but given that we do not have a record of settings, this cannot be verified.
Fruits harvested at lower maturity stages had greater firmness. Fruits from the 3-day machine-harvest interval had a greater firmness than the 10- and 14-day intervals, while there were few differences between the 10- and 14-day intervals. There were no differences in firmness among 7-, 11- and 14-day intervals in 2020. Hancock et al. [12] found ‘Elliott’ NH blueberry harvested at 30% bush maturity was greater in firmness than fruits harvested at 60% maturity. Similar findings were reported by Lobos et al. [18] for ‘Liberty’ fruits harvested at 20% bush maturity, which was higher in firmness, compared to 40% and 60% maturity. In our study, some nearly mature fruits (with some redness on the pedicle end) could be missed during sorting, resulting in higher firmness at the 3-day interval. Ehlenfeldt [33] tested firmness changes across ten NH blueberry cultivars during three harvests separated by 7-day intervals and found the ability to retain firmness varied among cultivars. In our study, there were no differences in firmness between the 10- and 14-day intervals and among 7-, 11- and 14-day intervals in both years among machine-harvested fruit, indicating ‘Liberty’ was able to retain firmness quite well between 7 and 11 days following the first harvest date.
Machine harvesting at the 3-day interval resulted in fruits with the lowest TSS, TSS/TA, and highest TA. Machine harvesting at a 7-day interval also led to greater TA and lower TSS/TA but without an impact on TSS. There were no differences in TSS, TA, and TSS/TA between the 10- and 14-day intervals in 2019, and 11- and 14-day intervals in 2020. Juice pH was lowest in machine-harvested fruit at the 3-day interval, intermediate at the 10-day interval, and highest at the 14-day interval in 2019. In 2020, pH results varied among harvest intervals, but the 14-day interval had a greater pH in general. It is very likely that the difference was due to maturity stages. Moggia et al. [19,36] studied the effect of maturity stages on blueberry quality and found TSS increased and TA decreased during the development of ‘Duke’ and ‘Brigitta’ from 100% green to 100% blue fruits. After fully mature, there were no changes in TSS and TA between fruits picked just at 100% blue and 5–7 days after reaching 100% blue. Strik [20] also reported the similar finding of greater TA and lower TSS and TSS/TA when fruits were picked at high harvest frequency (4 days) and no differences in between medium (8 days) and low frequencies (12 days) in seven blueberry cultivars including ‘Liberty’ in Oregon, USA. Additionally, Lobos et al. [18] reported no differences in TSS, TA, and TSS/TA among ‘Liberty’ when harvested at 20%, 40%, and 60% maturity in Michigan, USA.
It is important to note harvest method can also affect chemical variables of fruit quality. Sargent et al. [9] compared hand-harvested ‘Meadowlark’ and ‘Farthing’ southern highbush blueberries to machine-harvested fruits using a similar modified OTR with soft- and hard-catch plates. The harvest method had minimal effects on SSC, TA, and TSS/TA within a cultivar. In contrast, Casamali et al. [37] found machine-harvested ‘Farthing’ blueberries had greater TSS than hand-harvested fruits only during the early harvest period and not at mid- and late-harvest points. Total titratable acidity was also greater among hand-harvested ‘Farthing’ and ‘Meadowlark’ berries when compared to machine-harvested fruits. The TSS/TA ratio of machine-harvested fruits was also greater than hand-harvested berries in both “Farthing” and “Meadowlark” across the harvest season. Yet, other experiments that simulate machine harvesting show TA tends not to be affected when subjected to impact forces similar to machine harvesting [38] As machine harvesting technologies advance for the fresh market, it will be important to continue monitoring fruit quality to ensure fruit sold on the market maintain quality and encourage repeat purchasing among consumers.
Postharvest fruit quality is associated with many factors such as firmness, TSS, TA, and TSS/TA [33]. There were no differences in storability of ‘Duke’ and ‘Brigitta’, as measured by percentage sound fruits and water loss when harvested at 75% blue and 100% blue and refrigerated for 45 days [20]. However, the blueberry maturity stage is heterogeneous on a bush, and fruits picked at earlier overall maturity stages tend to store longer relative to fruits collected at more advanced maturity stages [12,31,32]. Our study showed fruits machine-picked at 3-day intervals had higher firmness than fruits from the 10- and 14-day intervals, but a reduced packout due to immature fruits. Although there were no differences in firmness at later harvest intervals, firmness measurements are somewhat limited as only one point along the berry equatorial axis is measured per berry. The correlation between firmness and internal bruising in blueberry has been found to be inconsistent [3,36]; therefore, firmness data should not be misinterpreted as bruise data, and softness due to bruising cannot be reliably detected using firmness measures. In future studies, a high throughput method to measure internal bruising should be included for more comprehensive assessments of how harvesting technologies impact internal bruising. However, firmness data in our study are still indicative of quality as changes in firmness over time could be exacerbated by internal bruising. Furthermore, Moggia et al. [17] segregated hand-harvested ‘Duke’ and ‘Brigitta’ into three groups based on their firmness at harvest and showed fruits in the “soft” category were more susceptible to internal bruising after being dropped from a 32 cm height on a hard surface.
Both the 3-day interval in 2019 and the 7-day interval in 2020 had a lower TSS/TA (14.4 and 18.9 at harvest, respectively). Ballinger et al. [11] recommended a TSS/TA ratio of less than 20 for trans-Atlantic shipping, 20–27 for transcontinental shipping, and 27–30 for local shipping. The TSS/TA ratio at the 10-, 11- and 14-day intervals in our study were all between 20 to 27, which is not suitable for trans-Atlantic shipping. However, although fruits picked at 3- and 7-day intervals can store longer, a tradeoff for harvesting earlier is reduced aroma and flavor, as well as a lower consumer acceptance due to a lower TSS/TA [14,18]. Long harvest intervals can save harvest operational costs and increase harvest efficiency. The long harvest interval (14-day) using ‘Liberty’ resulted in similar fruit quality relative to 7-, 10- and 11-day intervals; however, it caused a reduced packout along with excessive soft fruits during packing. Therefore, machine-harvest intervals in northwest Washington and the greater Pacific Northwest region can be extended to 10/11 days for ‘Liberty’ NH blueberry unless targeting long-distance shipping and in which case, a 7-day interval can be chosen.
5. Conclusions
This study demonstrated machine harvesting of ‘Liberty’ NH blueberry using modified OTR technologies for the fresh market is feasible and chemical variables of fruit quality are more influenced by harvest timing than harvest method. The overall fresh market quality of machine-harvested fruits was still lower than hand-harvested fruits due to reduced firmness. Although machine harvesting at a 3-day interval resulted in fruits with greater firmness, it has tradeoffs in terms of sweetness and packout. The practical application of our results is that growers and crop advisors can continue transitioning to machine harvesting of fresh market fruit using modified OTR technologies, and the machine-harvest interval can be extended to 10/11 days for local and/or regional sales of the fresh market ‘Liberty’ NH blueberry. While the quality of machine-harvested fruit is not the same as hand-harvested fruit, machine harvesting still provides the opportunity to save operational costs and increase harvest efficiency. Improved sorting technologies in packing houses and postharvest storage conditions can also improve the quality and longevity of fruit in the retail space. Furthermore, the 10/11-day interval can also serve as a baseline for other NH blueberry cultivars grown in similar climates. However, the harvest interval still depends on the overall fruit maturity stage, cultivar, and weather conditions, and those will need to be considered to optimize harvest intervals.
Author Contributions
Conceptualization, L.W.D. and F.T.; methodology, L.W.D. and F.T.; validation, Y.C.; formal analysis, Y.C.; investigation, Y.C.; resources, L.W.D. and B.F.; writing—original draft preparation, Y.C.; writing—review and editing, F.T. and L.W.D.; project administration, L.W.D.; funding acquisition, L.W.D. All authors have read and agreed to the published version of the manuscript.
Funding
This research was funded by the Washington State Department of Agriculture Specialty Crop Block Grant Program and the Washington Blueberry Commission.
Institutional Review Board Statement
Not applicable.
Informed Consent Statement
Not applicable.
Data Availability Statement
The data present in this study are available on request from the corresponding author.
Acknowledgments
We would acknowledge the assistance of Sean Watkinson, Huan Zhang, Qianwen Lu, Amit Bhasin, Brenda Madrid, Xuechun “May” Wang, Chelsea Batten, Katheryn Van Weerdhuizen, and Clayton Polinder. We would also like to acknowledge the assistance provided by commercial growers, including Spencer Fiser and Allen Brown. We would appreciate the technical support from Oxbo International.
Conflicts of Interest
The authors declare no conflict of interest. The funders had no role in the design of the study; in the collection, analyses, or interpretation of data; in the writing of the manuscript, or in the decision to publish the results.
References
- United States Department of Agriculture National Agricultural Statistics Services (USDA NASS). Noncitrus Fruit and Nuts 2020 Summary. 2021. Available online: https://downloads.usda.library.cornell.edu/usda-esmis/files/zs25x846c/sf269213r/6t054c23t/ncit0521.pdf (accessed on 21 June 2021).
- Strik, B.C.; Yarborough, D. Blueberry production trends in North America, 1992 to 2003, and predictions for growth. HortTechnology 2005, 15, 391–398. [Google Scholar] [CrossRef]
- Clark, M. Washington State’s Agricultural Labor Shortage. Washington Policy Center. 2017. Available online: https://www.washingtonpolicy.org/publications/detail/washington-states-agricultural-labor-shortage (accessed on 1 September 2020).
- Gallardo, R.K.; Zilberman, D. The economic feasibility of adopting mechanical harvesters by the highbush blueberry industry. HortTechnology 2016, 26, 299–308. [Google Scholar] [CrossRef] [Green Version]
- Gallardo, R.K.; Stafne, E.T.; DeVetter, L.W.; Zhang, Q.; Li, C.; Takeda, F.; Williamson, J.; Yang, W.Q.; Cline, W.O.; Beaudry, R.; et al. Blueberry producers’ attitudes toward harvest mechanization for fresh market. HortTechnology 2018, 28, 10–16. [Google Scholar] [CrossRef] [Green Version]
- Peterson, D.L.; Brown, G.K. Mechanical harvester for fresh market quality blueberries. Trans. ASAE 1996, 39, 823–828. [Google Scholar] [CrossRef]
- Peterson, D.L.; Wolford, S.D.; Timm, E.J.; Takeda, F. Fresh market quality blueberry harvester. Trans. ASAE 1997, 40, 535–540. [Google Scholar] [CrossRef]
- DeVetter, L.W.; Yang, W.Q.; Takeda, F.; Korthuis, S.; Li, C. Modified over-the-row machine harvesters to improve northern highbush blueberry fresh fruit quality. Agriculture 2019, 9, 13. [Google Scholar] [CrossRef] [Green Version]
- Sargent, S.A.; Takeda, F.; Williamson, J.G.; Berry, A.D. Harvest of southern highbush blueberry with a modified, over-the-row mechanical harvester: Use of handheld shakers and soft catch surfaces. Agriculture 2020, 10, 4. [Google Scholar] [CrossRef] [Green Version]
- Takeda, F.; Yang, W.; Li, C.; Freivalds, A.; Sung, K.; Xu, R.; Hu, B.; Williamson, J.; Sargent, S. Applying new technologies to transform blueberry harvesting. Agronomy 2017, 7, 33. [Google Scholar] [CrossRef] [Green Version]
- Ballinger, W.E.; Maness, E.P.; McClure, W.F. Relationship of stage of ripeness and holding temperature to decay development of blueberries. J. Am. Soc. Hortic. Sci. 1978, 103, 130–134. [Google Scholar]
- Hancock, J.; Callow, P.; Serçe, S.; Hanson, E.; Beaudry, R. Effect of cultivar, controlled atmosphere storage, and fruit ripeness on the long-term storage of highbush blueberries. HortTechnology 2008, 18, 199–205. [Google Scholar] [CrossRef]
- Forney, C.F.; Wilhelmina, K.; Michael, A.J.; Melinda, R.V.; Fillmore, S. Blueberry and cranberry fruit composition during development. J. Berry Res. 2012, 2, 169–177. [Google Scholar] [CrossRef] [Green Version]
- Retamales, J.B.; Hancock, J.F. Blueberries, 2nd ed.; CABI: Oxfordshire, UK, 2018; pp. 60–85. [Google Scholar]
- Woodruff, R.E.; Dewey, D.H.; Sell, H.M. Chemical changes of Jersey and Rubel blueberry fruit associated with ripening and deterioration. Proc. Am. Soc. Hortic. Sci. 1960, 75, 387–401. [Google Scholar]
- Proctor, A.; Miesle, T.J. Polygalacturonase and pectinmethylesterase activities in developing highbush blueberries. HortScience 1991, 26, 579–581. [Google Scholar] [CrossRef] [Green Version]
- Moggia, C.; Graell, J.; Lara, I.; González, G.; Lobos, G.A. Firmness at harvest impacts postharvest fruit softening and internal browning development in mechanically damaged and non-damaged highbush blueberries (Vaccinium corymbosum L.). Front. Plant Sci. 2017, 11, 535. [Google Scholar] [CrossRef] [Green Version]
- Lobos, G.A.; Callow, P.; Hancock, J.F. The effect of delaying harvest date on fruit quality and storage of late highbush blueberry cultivars (Vaccinium corymbosum L.). Postharvest Biol. Tech. 2014, 87, 33–139. [Google Scholar] [CrossRef]
- Moggia, C.; Graell, J.; Lara, I.; Schmeda-Hirschmann, G.; Thomas-Valdé, S.; Lobos, G.A. Fruit characteristics and cuticle triterpenes as related to postharvest quality of highbush blueberries. Sci. Hortic. 2016, 211, 449–457. [Google Scholar] [CrossRef] [Green Version]
- Strik, B.C. Frequency of harvest affects berry weight, firmness, titratable acidity, and percent soluble solids of highbush blueberry cultivars in Oregon. J. Am. Pom. Soc. 2019, 73, 254–268. [Google Scholar] [CrossRef] [Green Version]
- DeVetter, L.W.; (Washington State University, WA, USA). Personal Communication, 2020.
- Yang, W.Q.; Harpole, J.; Finn, C.E.; Strik, B.C. Evaluating berry firmness and total soluble solids of newly released highbush blueberry cultivars. Acta Hortic. 2008, 810, 863–868. [Google Scholar] [CrossRef] [Green Version]
- Strik, B.C.; Moore, P.; Finn, C.E. Blueberry Cultivars for the Pacific Northwest. 2014. Available online: https://catalog.extension.oregonstate.edu/sites/catalog/files/project/pdf/pnw656.pdf (accessed on 1 September 2020).
- Xu, R.; Takeda, F.; Krewer, G.; Li, C. Measure of mechanical impacts in commercial blueberry packing lines and potential damage to blueberry fruit. Postharvest Biol. Tech. 2015, 110, 103–113. [Google Scholar] [CrossRef]
- Yu, P.; Li, C.; Takeda, F.; Krewer, G.; Rains, G.; Hamrita, T. Measurement of mechanical impacts created by rotary, slapper, and sway blueberry mechanical harvesters. Comput. Electron. Agr. 2014, 101, 84–92. [Google Scholar] [CrossRef]
- Yu, P.; Li, C.; Takeda, F.; Krewer, G. Visual bruise assessment and analysis of mechanical impact measurement in southern highbush blueberries. Appl. Eng. Agric. 2014, 30, 29–37. [Google Scholar] [CrossRef]
- Takeda, F.; DeVetter, L.W. Blueberry drop test. Unpublished.
- Cai, Y. Machine Harvesting Comparison and Optimization of Machine Harvest Intervals in Fresh Market Blueberry. Master’s Thesis, Washington State University, Pullman, WA, USA, 2020. [Google Scholar]
- Galinato, S.P.; Gallardo, R.K.; Hong, Y.A. 2015 Cost Estimates of Establishing and Producing Organic Highbush Blueberries in Eastern Washington. WSU Extension TB28. 2016. Available online: http://pubs.cahnrs.wsu.edu/publications/pubs/tb28/ (accessed on 1 September 2020).
- Gallardo, K.; Lu, L.; Zilberman, D.; Jung, A.R. Adoption of Mechanization Solutions for Harvesting Fresh Market Blueberries. In Proceedings of the Agricultural and Applied Economics Association Annual Meeting, Atlanta, GA, USA, 21–23 July 2019. [Google Scholar]
- Ni, X.; Li, C.; Jiang, H.; Takeda, F. Deep learning image segmentation and extraction of blueberry fruit traits associated with harvestability and yield. Hortic. Res. 2020, 7, 110. [Google Scholar] [CrossRef]
- Ni, X.; Li, C.; Jiang, H.; Takeda, F. Three-dimensional photogrammetry with deep learning instance segmentation to extract berry fruit harvestability traits. Photogramm. Remote Sens. 2021, 271, 297–309. [Google Scholar] [CrossRef]
- Ehlenfeldt, M.K. Fruit firmness and holding ability in highbush blueberry—Implications for mechanical harvesting. Int. J. Fruit Sci. 2005, 5, 83–91. [Google Scholar] [CrossRef]
- Ballington, J.R.; Ballinger, W.E.; Swallow, W.H.; Galletta, G.J.; Kushman, L.J. Fruit quality characterization of 11 Vaccinium species. J. Am. Soc. Hort. 1984, 109, 684–689. [Google Scholar]
- Ballinger, W.E.; Kushman, L.J.; Hamann, D.D. Factors affecting the firmness of highbush blueberries. J. Am. Soc. Hort. Sci. 1973, 98, 583–587. [Google Scholar]
- Moggia, C.; González, C.; Lobos, G.A.; Bravo, C.; Valdés, M.; Lara, I.; Graell, J. Changes in quality and maturity of ‘Duke’ and ‘Brigitta’ blueberries during fruit development: Postharvest implications. Acta Hortic. 2018, 1194, 1495–1501. [Google Scholar] [CrossRef] [Green Version]
- Casamali, B.; Williamson, J.G.; Kovaleski, A.P.; Sargent, S.A.; Darnell, R.L. Mechanical harvesting and postharvest storage of two Southern highbush blueberry cultivars grafted onto Vaccinium arboretum rootstocks. HortScience 2016, 51, 1503–1510. [Google Scholar] [CrossRef] [Green Version]
- Sargent, S.A.; Berry, A.D.; Brecht, J.K.; Santana, M.; Zhang, S.; Ristow, N. Studies on quality of southern highbush blueberry cultivars: Effects of pulp temperature, impact and hydrocooling. Acta Hortic. 2017, 1180, 497–502. [Google Scholar] [CrossRef]
Figure 1.
Oxbo modified over-the-row (OTR) 7440 harvester (Oxbo International Corp., Lynden, WA, USA) used in the 2019 and 2020 harvest interval experiments.
Figure 1.
Oxbo modified over-the-row (OTR) 7440 harvester (Oxbo International Corp., Lynden, WA, USA) used in the 2019 and 2020 harvest interval experiments.

Figure 2.
Harvester modifications in the Oxbo 7440: (a) experimental, food-grade elastomeric polymer installed in catch plates and intermediary catching surfaces suspended above the conveyor belts in 2019; (b) upgraded, patent-pending, food-grade, elastomeric polymer material in 2020 that was injection molded and installed into plastic catch plates.

Figure 3.
Firmness of ‘Liberty’ northern highbush blueberry in 2019 (a) and 2020 (b) at 1, 7, 14, 21, and 28 days after packing. Fruits were harvested at 3-, 10-, and 14-day harvest intervals in 2019 and at 7-, 11-, and 14-day harvest intervals in 2020. The first harvest was the baseline from which interval treatments were established. Fruits were harvested by hand or using a modified over-the-row (OTR) harvester with patent-pending elastomeric polymers installed on catching surfaces in northwest Washington, USA. Values are mean ± SE (N = 3). Different uppercase letters indicate significant differences (p < 0.05) within hand-harvested fruits on each evaluation day due to harvest interval effects. Different lowercase letters indicate significant differences (p < 0.05) within machine-harvested fruits on each evaluation day due to harvest interval effects. * indicates significant differences (p < 0.05) within the same harvest interval on each evaluation day due to harvest method effect. Different Greek letters indicate significant differences (p < 0.05) among both hand- and machine-harvested fruit on each evaluation day due to interaction effects of harvest method and interval.

Figure 4.
Total soluble solids (TSS) of ‘Liberty’ northern highbush blueberry in 2019 (a) and 2020 (b) at 1, 7, 14, 21, and 28 days after packing. Fruits were harvested at 3-, 10-, and 14-day harvest intervals in 2019 and at 7-, 11-, and 14-day harvest intervals in 2020. The first harvest was the baseline from which interval treatments were established. Fruits were harvested by hand or using a modified over-the-row (OTR) harvester with patent-pending elastomeric polymers installed on catching surfaces in northwest Washington, USA. Values are mean ± SE (N = 6). Different lowercase letters indicate significant differences (p < 0.05) due to interval effects on each evaluation day. Different Greek letters indicate significant differences (p < 0.05) among both hand- and machine- harvested fruit on each evaluation day due to interaction effects of harvest method and interval. Hand and machine harvesting data are combined in 2020 due to lack of harvest method or interaction effects (b).

Figure 5.
Juice pH of ‘Liberty’ northern highbush blueberry in 2019 (a) and 2020 (b) at 1, 7, 14, 21, and 28 days after packing. Fruits were harvested at 3-, 10-, and 14-day harvest intervals in 2019 and at 7-, 11-, and 14- day harvest intervals in 2020. The first harvest was the baseline from which interval treatments were established. Fruits were harvested by hand or using a modified over-the-row (OTR) harvester with patent-pending elastomeric polymers installed on catching surfaces in northwest Washington, USA. Values are mean ± SE (a: N = 3; b: N = 6). Different Greek letters indicate significant differences (p < 0.05) among both hand and machine harvested fruit on each evaluation day due to interaction effects of harvest method and interval. Different lowercase letters indicate significant differences (p < 0.05) due to intervals on each evaluation day. Hand and machine harvesting data are combined due to lack of harvest method and interaction effects in 2020 (b).

Figure 6.
Titratable acidity (TA) of ‘Liberty’ northern highbush blueberry in 2019 (a) and 2020 (b) at 1, 7, 14, 21, and 28 days after packing. Fruits were harvested at 3-, 10-, and 14-day harvest intervals in 2019 and at 7-, 11-, and 14-day harvest intervals in 2020. The first harvest was the baseline from which interval treatments were established. Fruits were harvested by hand or using a modified over-the-row (OTR) harvester with patent-pending elastomeric polymers installed on catching surfaces in northwest Washington, USA. Values are mean ± SE (N = 6). Different lowercase letters indicate significant differences (p < 0.05) due to interval on each evaluation day. Different uppercase letters indicate significant differences (p < 0.05) within hand-harvested fruits on each evaluation day due to harvest interval effect. Different Greek letters indicate significant differences (p < 0.05) among both hand- and machine-harvested fruit on each evaluation day due to interaction effects of harvest method and interval. Hand and machine harvesting data are combined due to lack of harvest method and interaction effects in 2020 (b).


Figure 7.
The ratio of total soluble solids (TSS) over titratable acidity (TA) of ‘Liberty’ northern highbush blueberry in 2019 (a) and 2020 (b) at 1, 7, 14, 21, and 28 days after packing. Fruits were harvested at 3-, 10-, and 14-day harvest intervals in 2019 and at 7-, 11-, and 14-day harvest intervals in 2020. The first harvest was the baseline from which interval treatments were established. Fruits were harvested by hand or using a modified over-the-row (OTR) harvester with patent-pending elastomeric polymers installed on catching surfaces in northwest Washington, USA. Values are mean ± SE (N = 6). Different lowercase letters indicate significant differences (p < 0.05) due to intervals on each evaluation day. Different uppercase letters indicate significant differences (p < 0.05) within hand-harvested fruits on each evaluation day due to harvest interval effect. Different Greek letters indicate significant differences (p < 0.05) among both hand- and machine-harvested fruit on each evaluation day due to interaction effects of harvest method and interval. Hand and machine harvesting data are combined due to lack of harvest method and interaction effects in 2020 (b).


Table 1.
Percent blue fruit visually estimated on bushes before and after harvest and ground and head speeds of a modified over-the-row (OTR) harvester used to harvest ‘Liberty’ northern highbush blueberry at different harvest intervals in northwest Washington, USA, 2019–2020.
Table 1.
Percent blue fruit visually estimated on bushes before and after harvest and ground and head speeds of a modified over-the-row (OTR) harvester used to harvest ‘Liberty’ northern highbush blueberry at different harvest intervals in northwest Washington, USA, 2019–2020.
| 2019 | 2020 z | |||||||
|---|---|---|---|---|---|---|---|---|
| 1st Harvest (Baseline) | 3-Day Interval | 10-Day Interval | 14-Day Interval | 1st Harvest (Baseline) | 7-Day Interval | 11-Day Interval | 14-Day Interval | |
| Blue fruits before harvest (%) | 60 | 60 | 60 | 70 | 75–80 | 50–60 | 70–75 | 80–85 |
| Blue fruits after harvest (%) | 10 | 10 | 15 | 10 | 35 | 42 | 44 | 20 |
| Ground speed (km/hour) | 0.60 | 0.80 | 0.85 | 0.80 | 0.80 | 0.97 | 1.29 | 1.00 |
| Head speed (rpm) | 305 | 320 | 325 | 325 | 325 | 335 | 345 | 414 |
z The food-grade, soft material installed inside catch plates was upgraded in 2020 to injection molded, patent-pending elastomeric polymers.
Table 2.
Packout, color, and soft defects of ‘Liberty’ northern highbush blueberry in 2019. Fruits were harvested at 3-, 10-, and 14- day harvest intervals by hand or using a modified over-the-row (OTR) harvester with patent-pending elastomeric polymer installed on catching surfaces in northwest Washington. The first harvest was the baseline from which interval treatments were established. Data are reported in percentages.
| Harvest Method | Harvest Interval | Packout | Color | Soft |
|---|---|---|---|---|
| Hand | 1st harvest (baseline) | 87 A z | 5 C | 1 D |
| 3-D interval | 87 A | 8 C | 6 C | |
| 10-D interval | 83 A | 8 C | 3 CD | |
| 14-D interval | 82 A | 8 C | 6 C | |
| Modified OTR | 1st harvest (baseline) | 80 A | 10 C | 2 D |
| 3-D interval | 60 C | 21 A | 15 A | |
| 10-D interval | 79 A | 15 B | 5 CD | |
| 14-D interval | 71 B | 7 C | 10 B | |
| p-values | ||||
| Harvest method | <0.0001 | <0.0001 | 0.0003 | |
| Harvest interval | <0.0001 | <0.0001 | <0.0001 | |
| Method × interval | 0.0004 | 0.0002 | 0.001 | |
z Harvest method and interval interaction effects—means followed by different uppercase letters within a column are statistically different at α = 0.05.
Table 3.
Packout, color, and soft defects of ‘Liberty’ northern highbush blueberry in 2020. Fruits were harvested at 7-, 11-, and 14- day harvest intervals by hand or using a modified over-the-row (OTR) harvester with a patent-pending elastomeric polymer installed on catching surfaces in northwest Washington. The first harvest was the baseline from which interval treatments were established. Data are reported in percentages.
| Harvest Interval | Harvest Method | Packout | Defects | |
|---|---|---|---|---|
| Color | Soft | |||
| 1st harvest (baseline) | Hand | 89 | 5 B z | 4 |
| Modified OTR | 85 | 9 A | 4 b y | |
| p-value x (Hand vs. Modified OTR) | 0.08 | 0.04 | 1.00 | |
| 7-day interval | Hand | 96 | 2 | 0.4 |
| Modified OTR | 82 | 6 | 10 a | |
| p-value x (1st harvest vs. 7-day interval in machine harvesting) | 0.22 | 0.11 | 0.008 | |
| 11-day interval | Hand | 85 | 8 | 5 |
| Modified OTR | 78 | 7 | 13 | |
| 14-day interval | Hand | 67 | 31 w | |
| Modified OTR | 54 | 45 | ||
z Harvest method effects—means followed by the same uppercase letters within a column in the 1st harvest are not statistically different at α = 0.05 between harvest method. y Harvest interval effects—means followed by the same lowercase letters within a column are not statistically different at α = 0.05 in modified OTR harvesting between the 1st harvest and 7-day interval. x Statistical analysis between harvest method was only performed for the 1st harvest due to lack of replication of packout data in hand-harvested plots at 7, 11, and 14-day intervals. w Soft and color sort-outs were unable to be separated at the 14-day interval.
Publisher’s Note: MDPI stays neutral with regard to jurisdictional claims in published maps and institutional affiliations. |
© 2021 by the authors. Licensee MDPI, Basel, Switzerland. This article is an open access article distributed under the terms and conditions of the Creative Commons Attribution (CC BY) license (https://creativecommons.org/licenses/by/4.0/).
Share and Cite
MDPI and ACS Style
Cai, Y.; Takeda, F.; Foote, B.; DeVetter, L.W. Effects of Machine-Harvest Interval on Fruit Quality of Fresh Market Northern Highbush Blueberry. Horticulturae 2021, 7, 245. https://0-doi-org.brum.beds.ac.uk/10.3390/horticulturae7080245
AMA Style
Cai Y, Takeda F, Foote B, DeVetter LW. Effects of Machine-Harvest Interval on Fruit Quality of Fresh Market Northern Highbush Blueberry. Horticulturae. 2021; 7(8):245. https://0-doi-org.brum.beds.ac.uk/10.3390/horticulturae7080245
Chicago/Turabian StyleCai, Yixin, Fumiomi Takeda, Brian Foote, and Lisa Wasko DeVetter. 2021. "Effects of Machine-Harvest Interval on Fruit Quality of Fresh Market Northern Highbush Blueberry" Horticulturae 7, no. 8: 245. https://0-doi-org.brum.beds.ac.uk/10.3390/horticulturae7080245
Note that from the first issue of 2016, this journal uses article numbers instead of page numbers. See further details here.