
Insight into Sources of Benzene, TCE, and PFOA/PFOS in Groundwater at Naval Air Station Whiting Field, Florida, through Numerical Particle-Tracking Simulations
Abstract
:1. Introduction
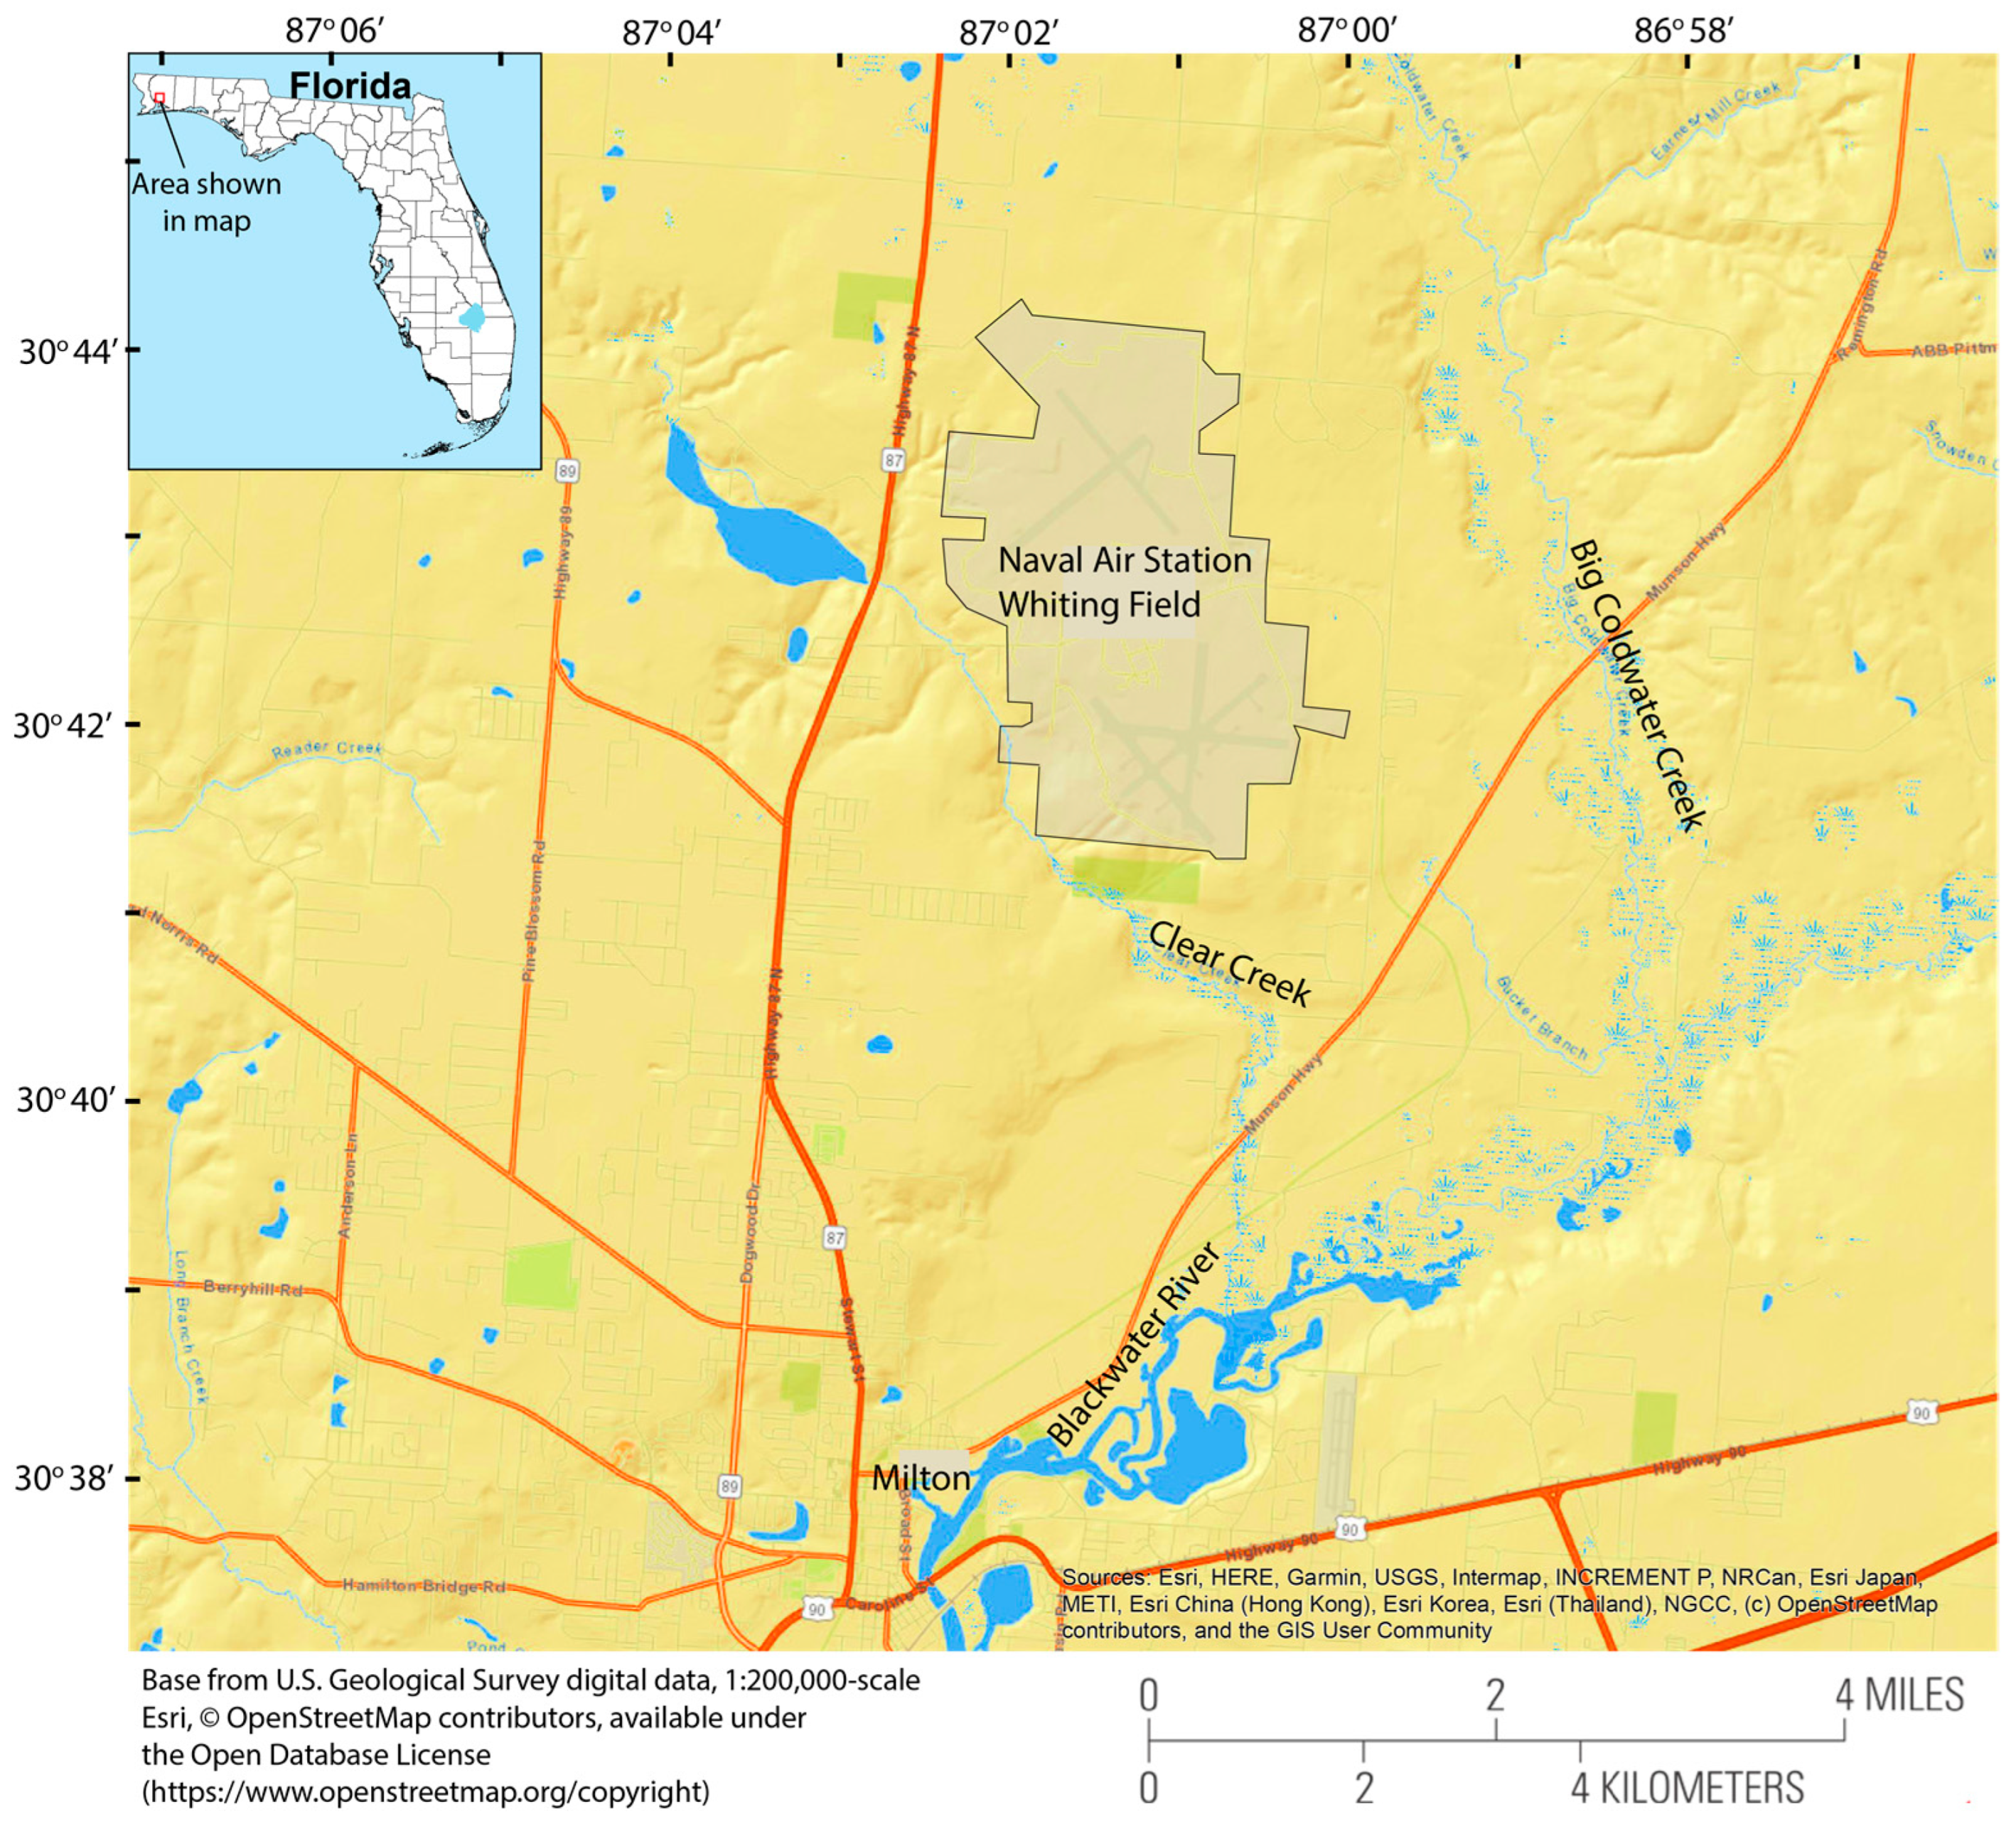
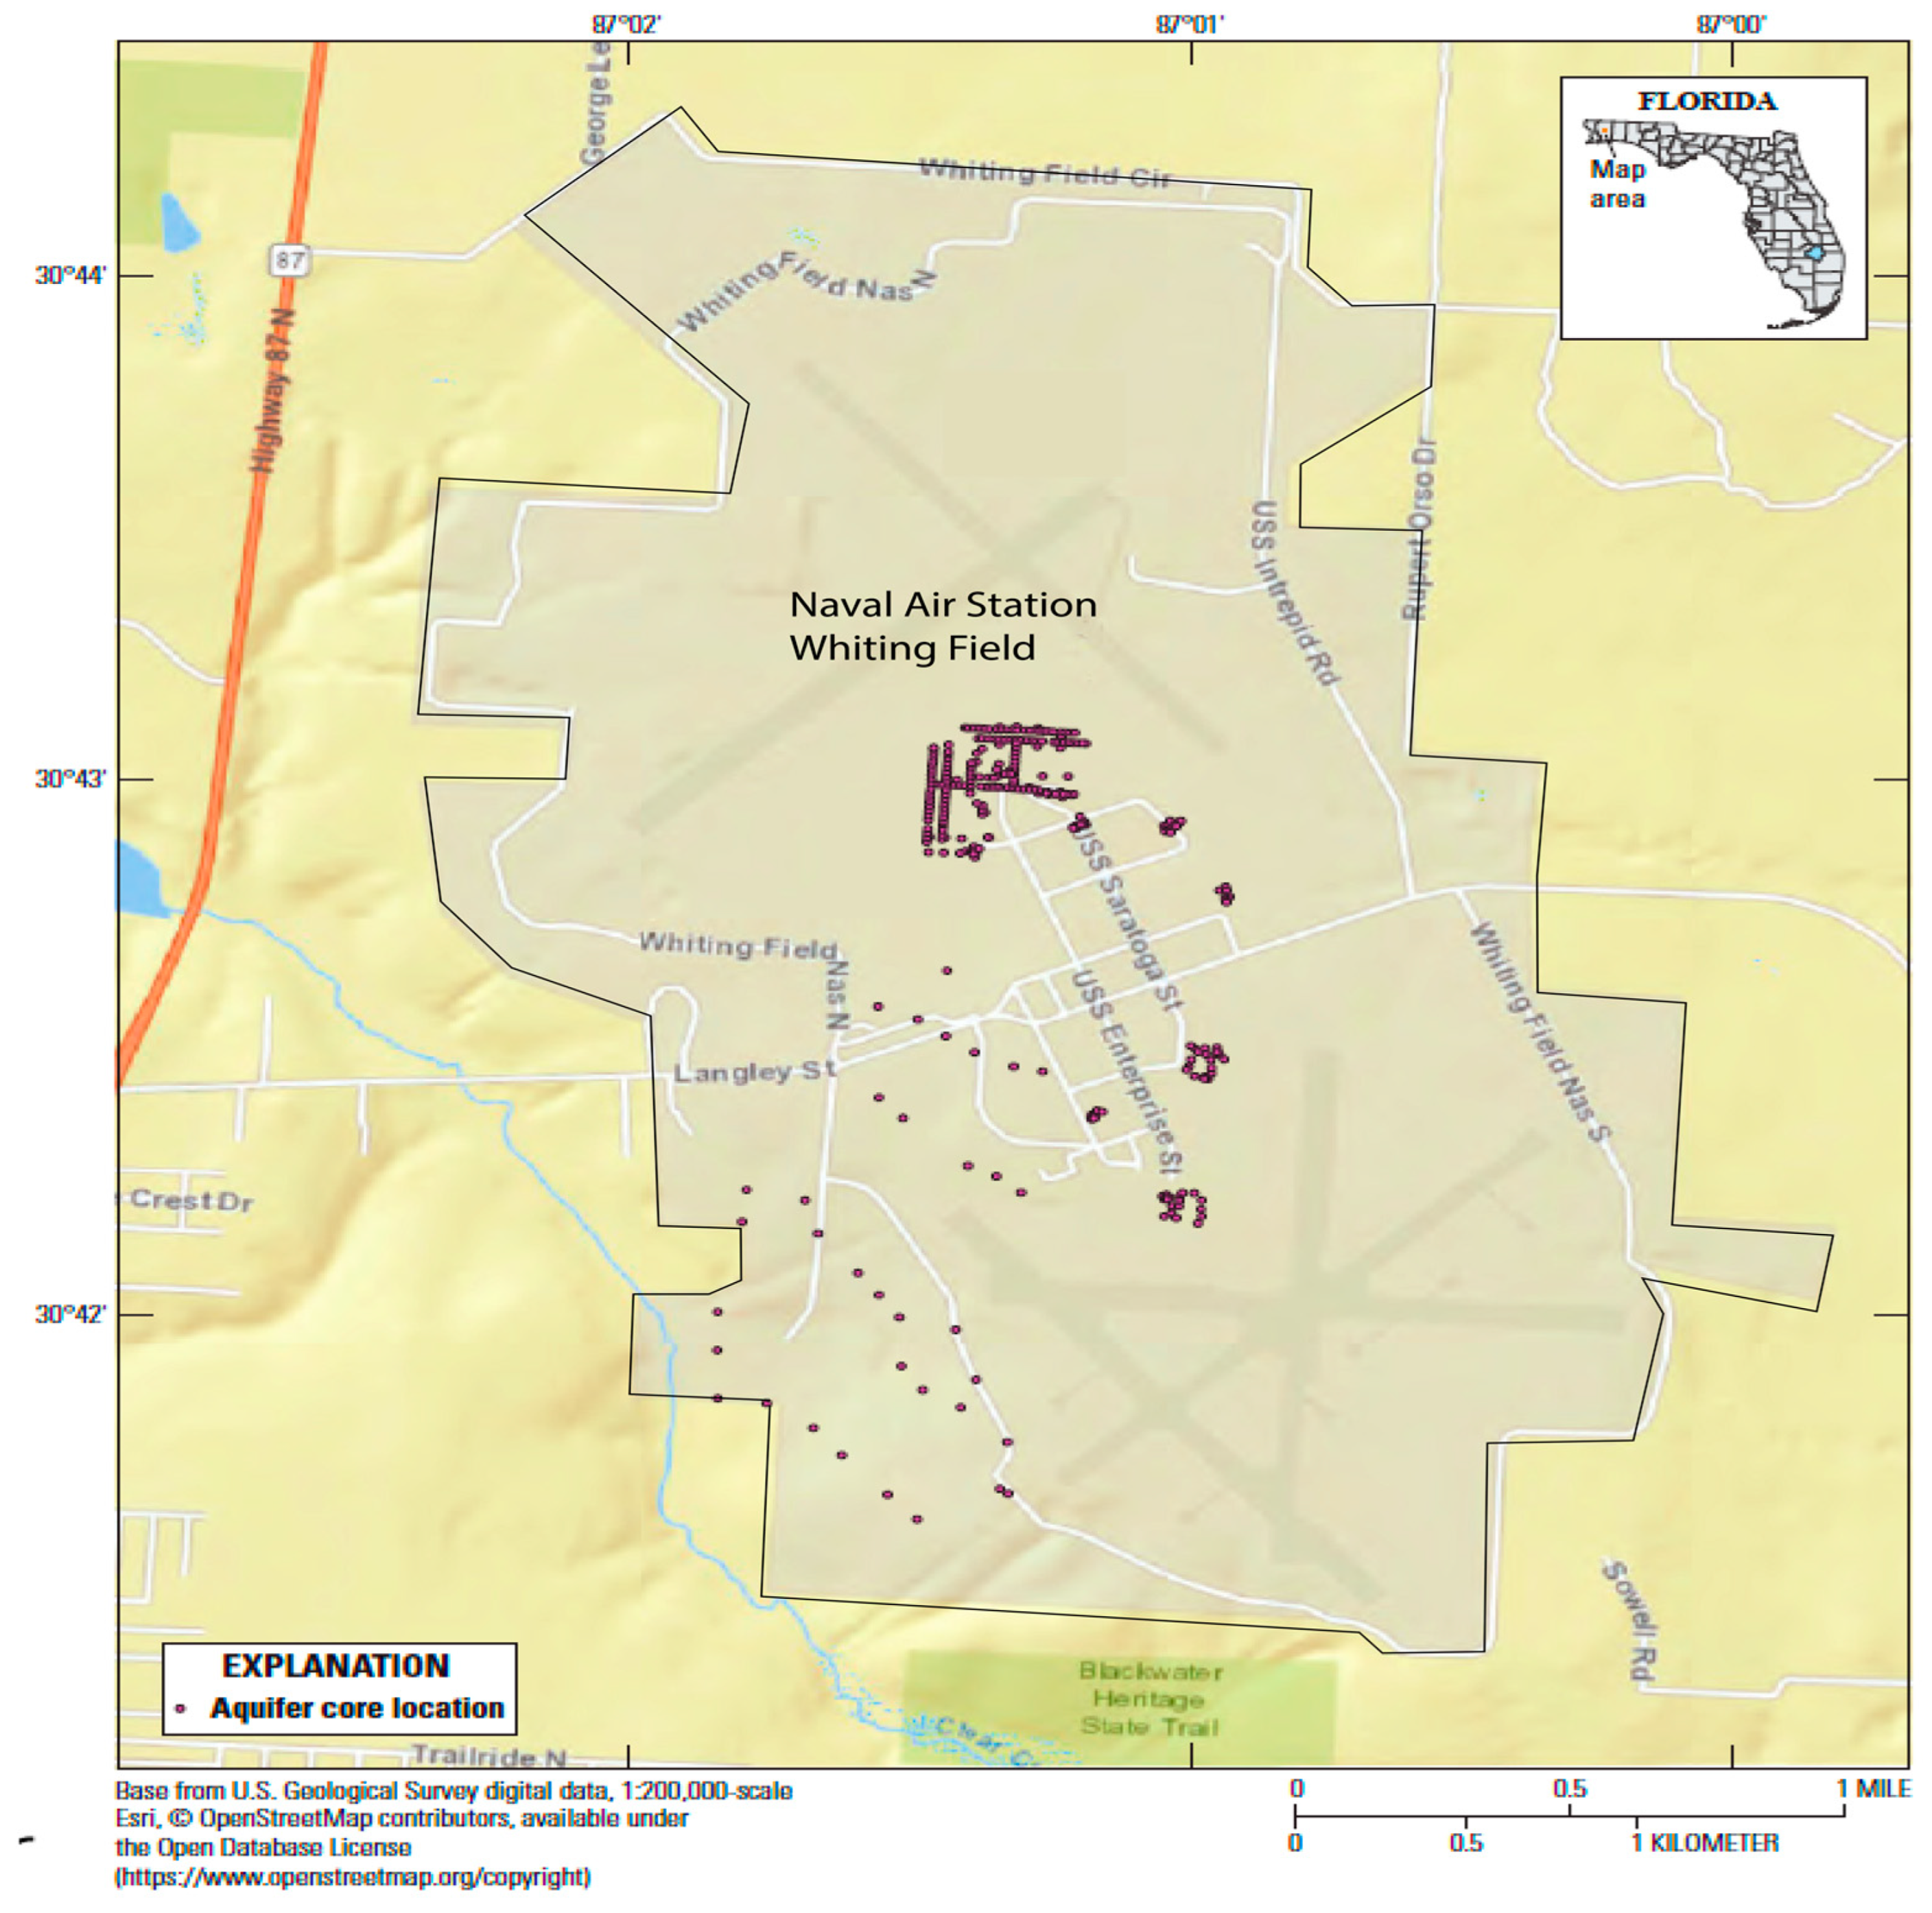
2. Study Area
3. Materials and Methods
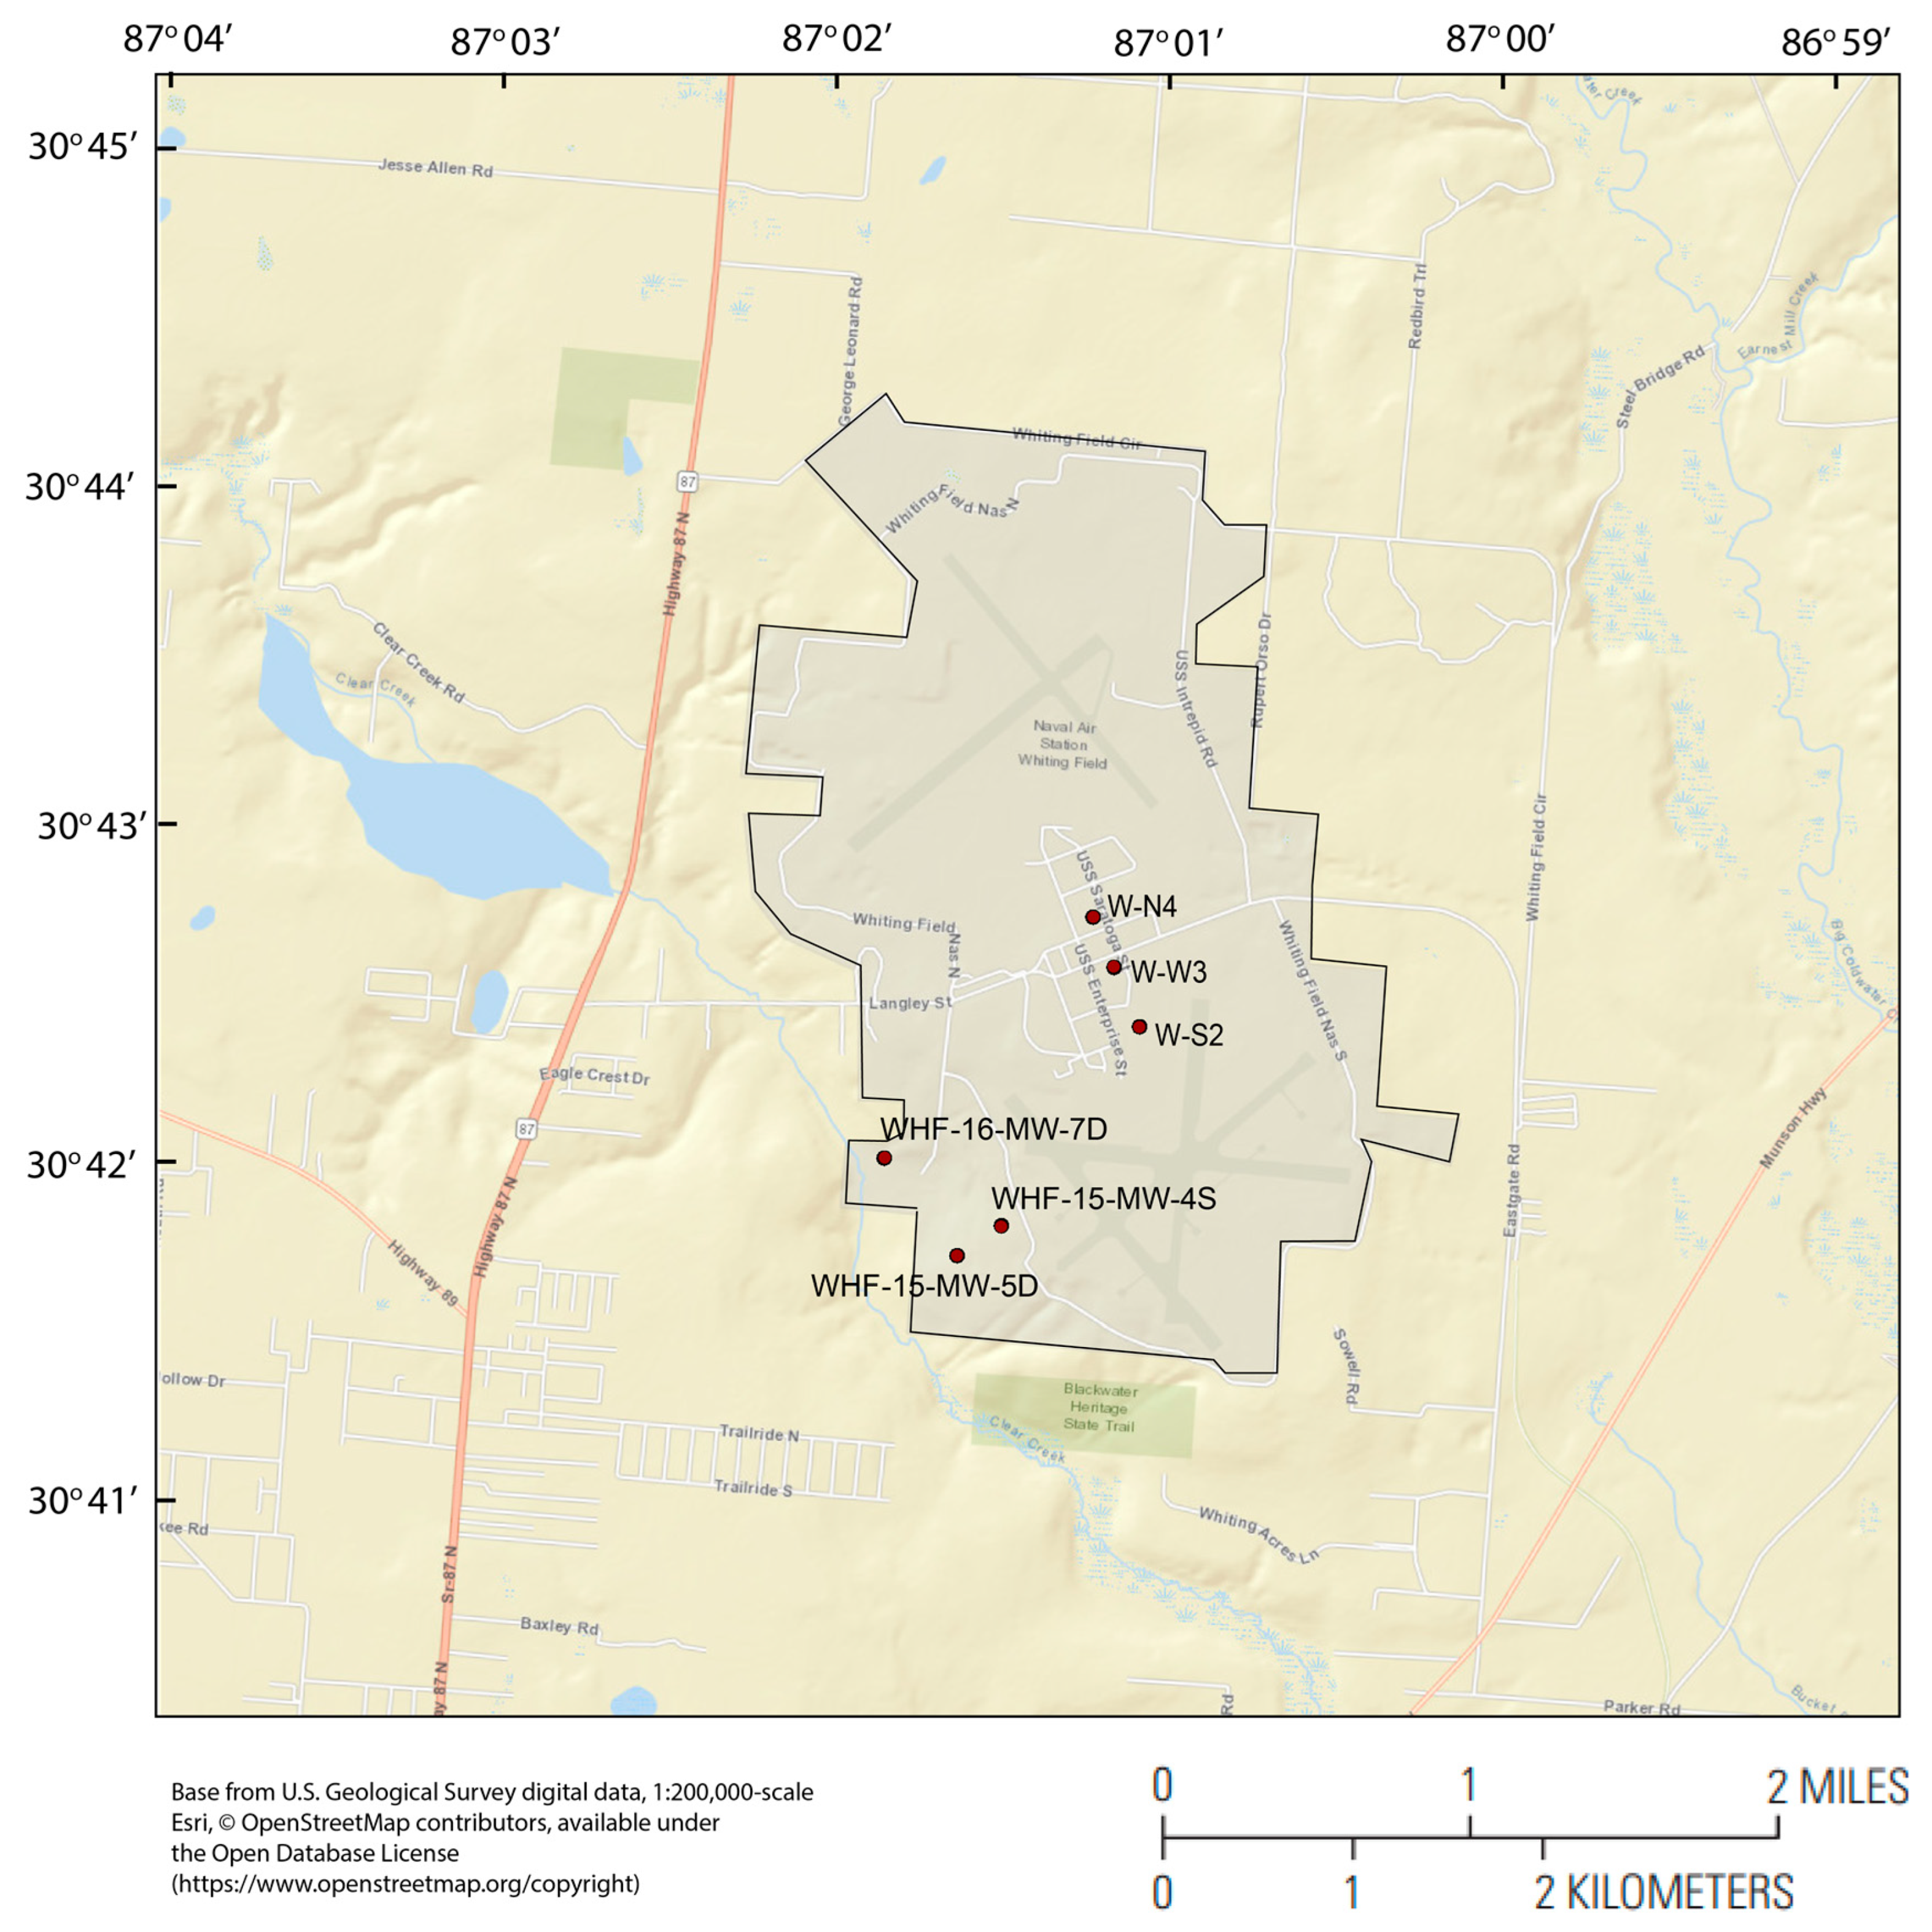
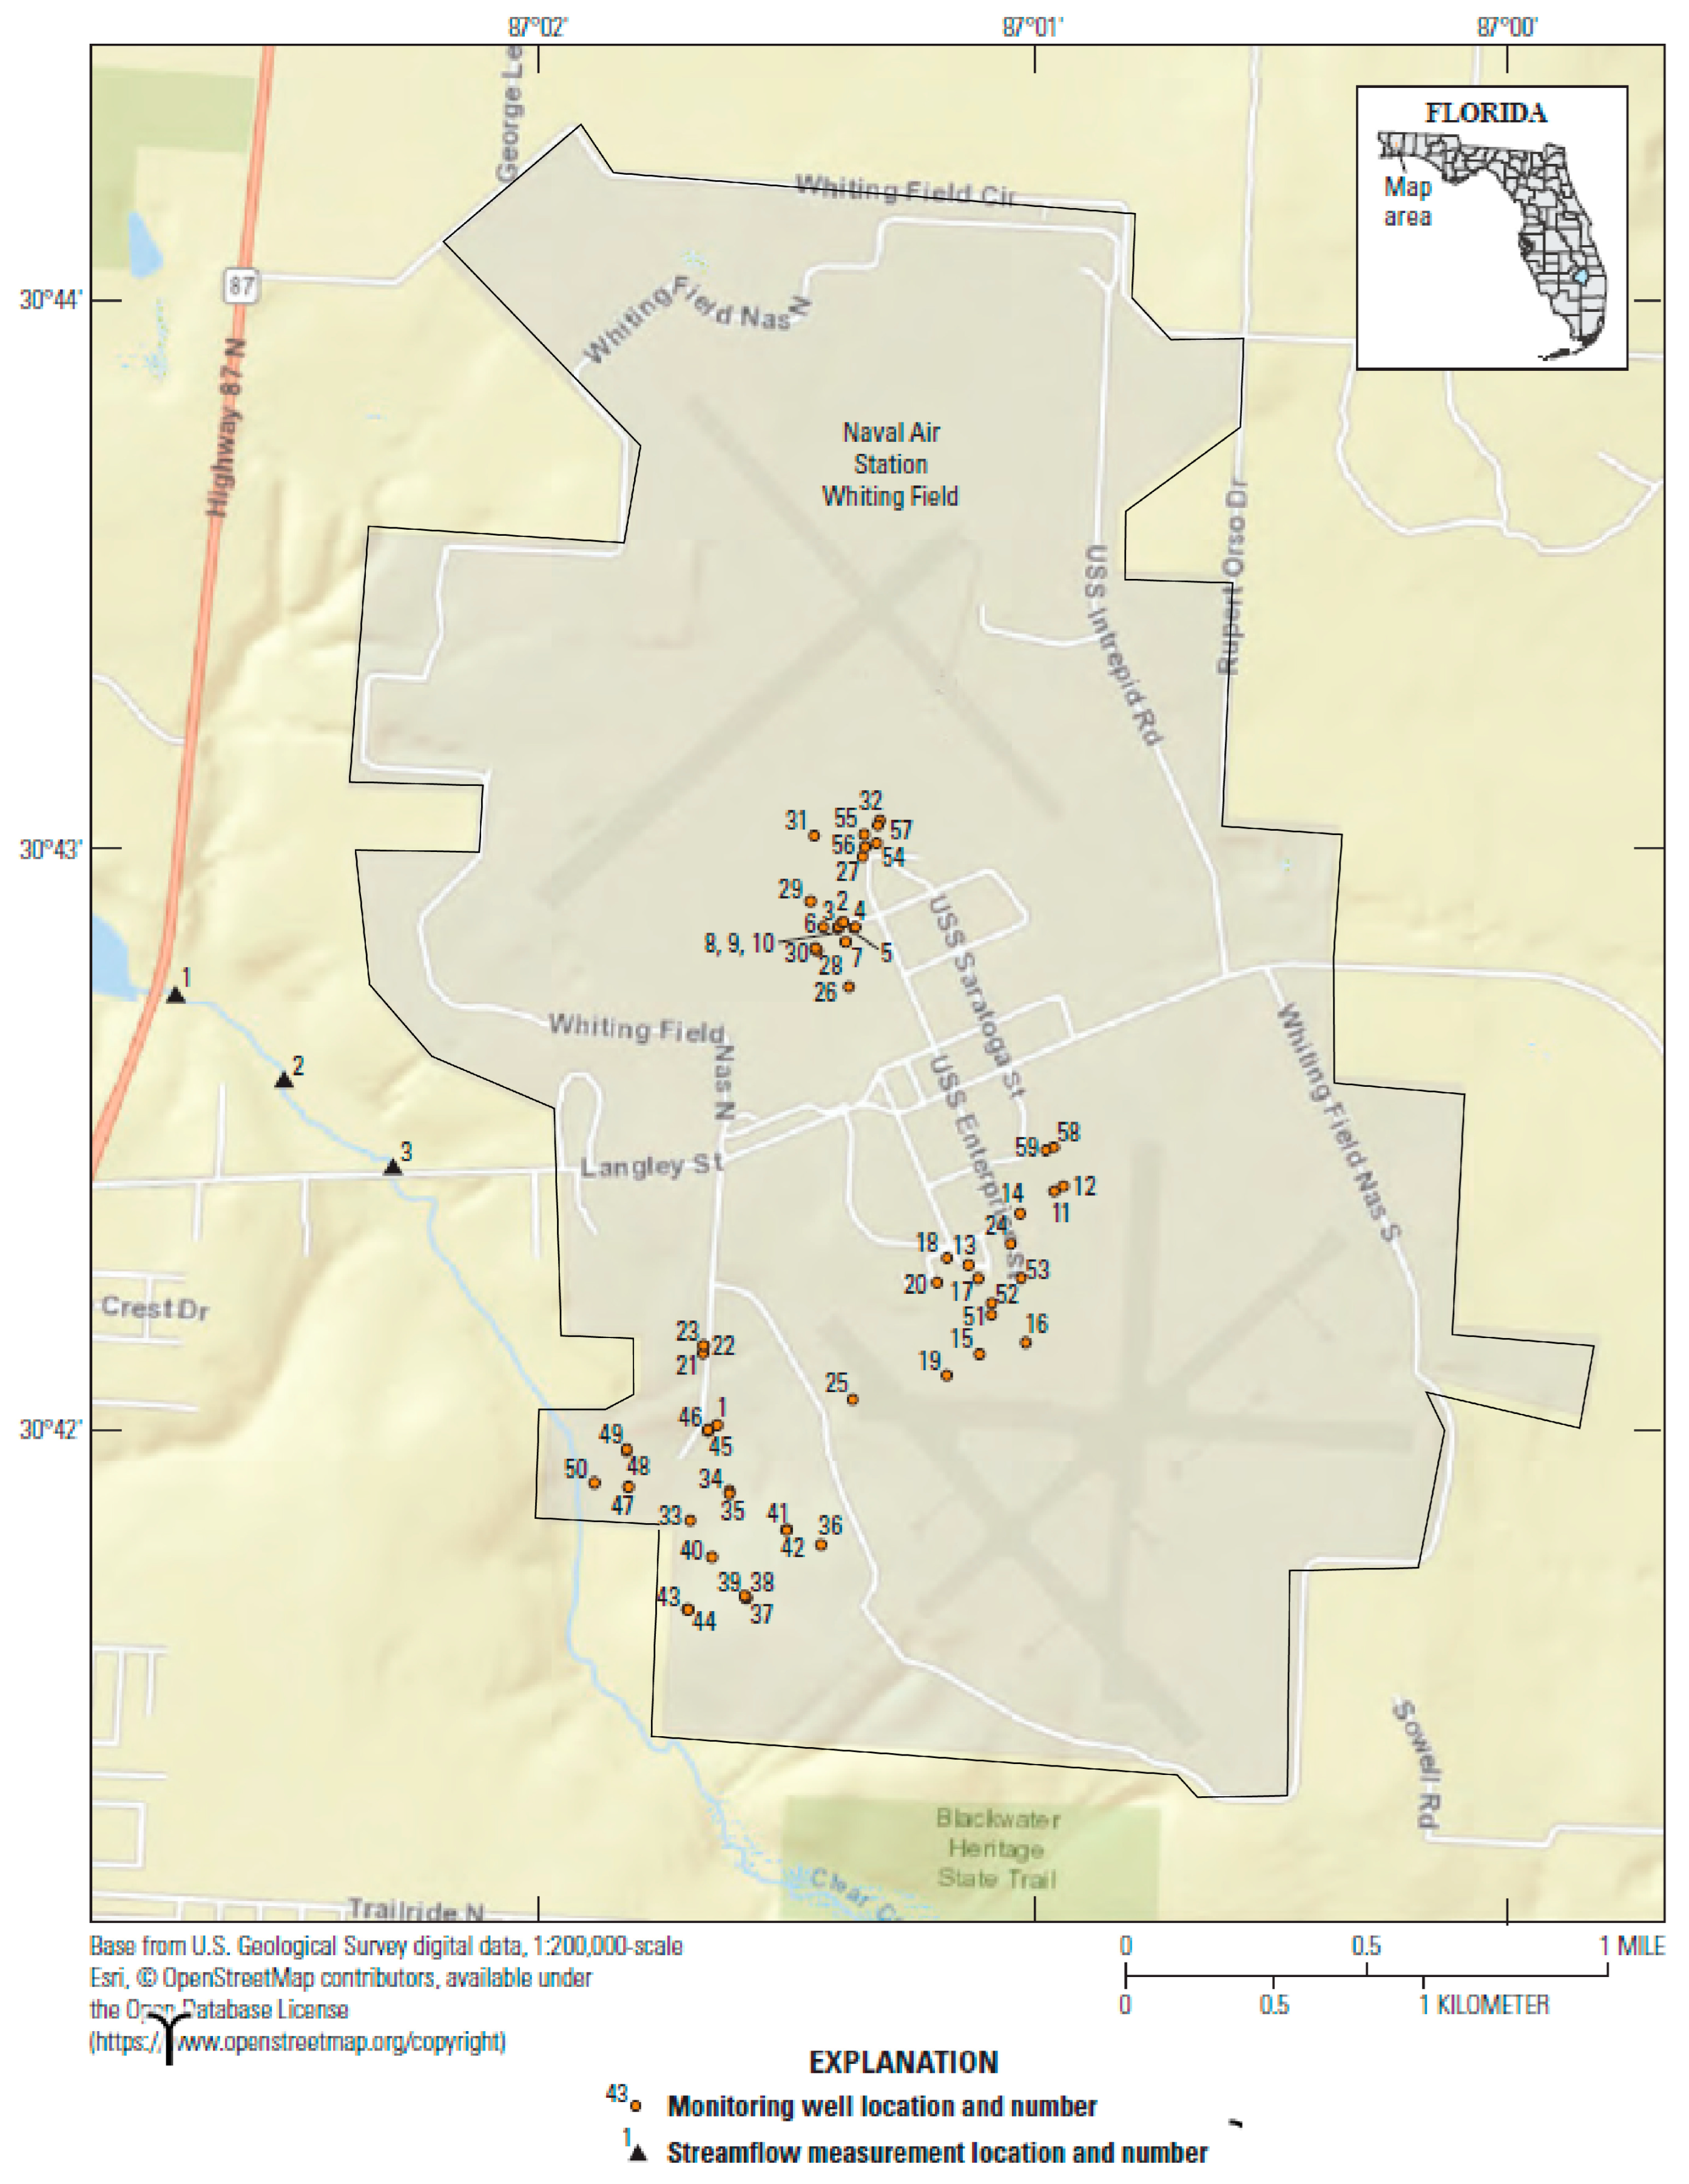
3.1. Monitoring and Public Supply Wells
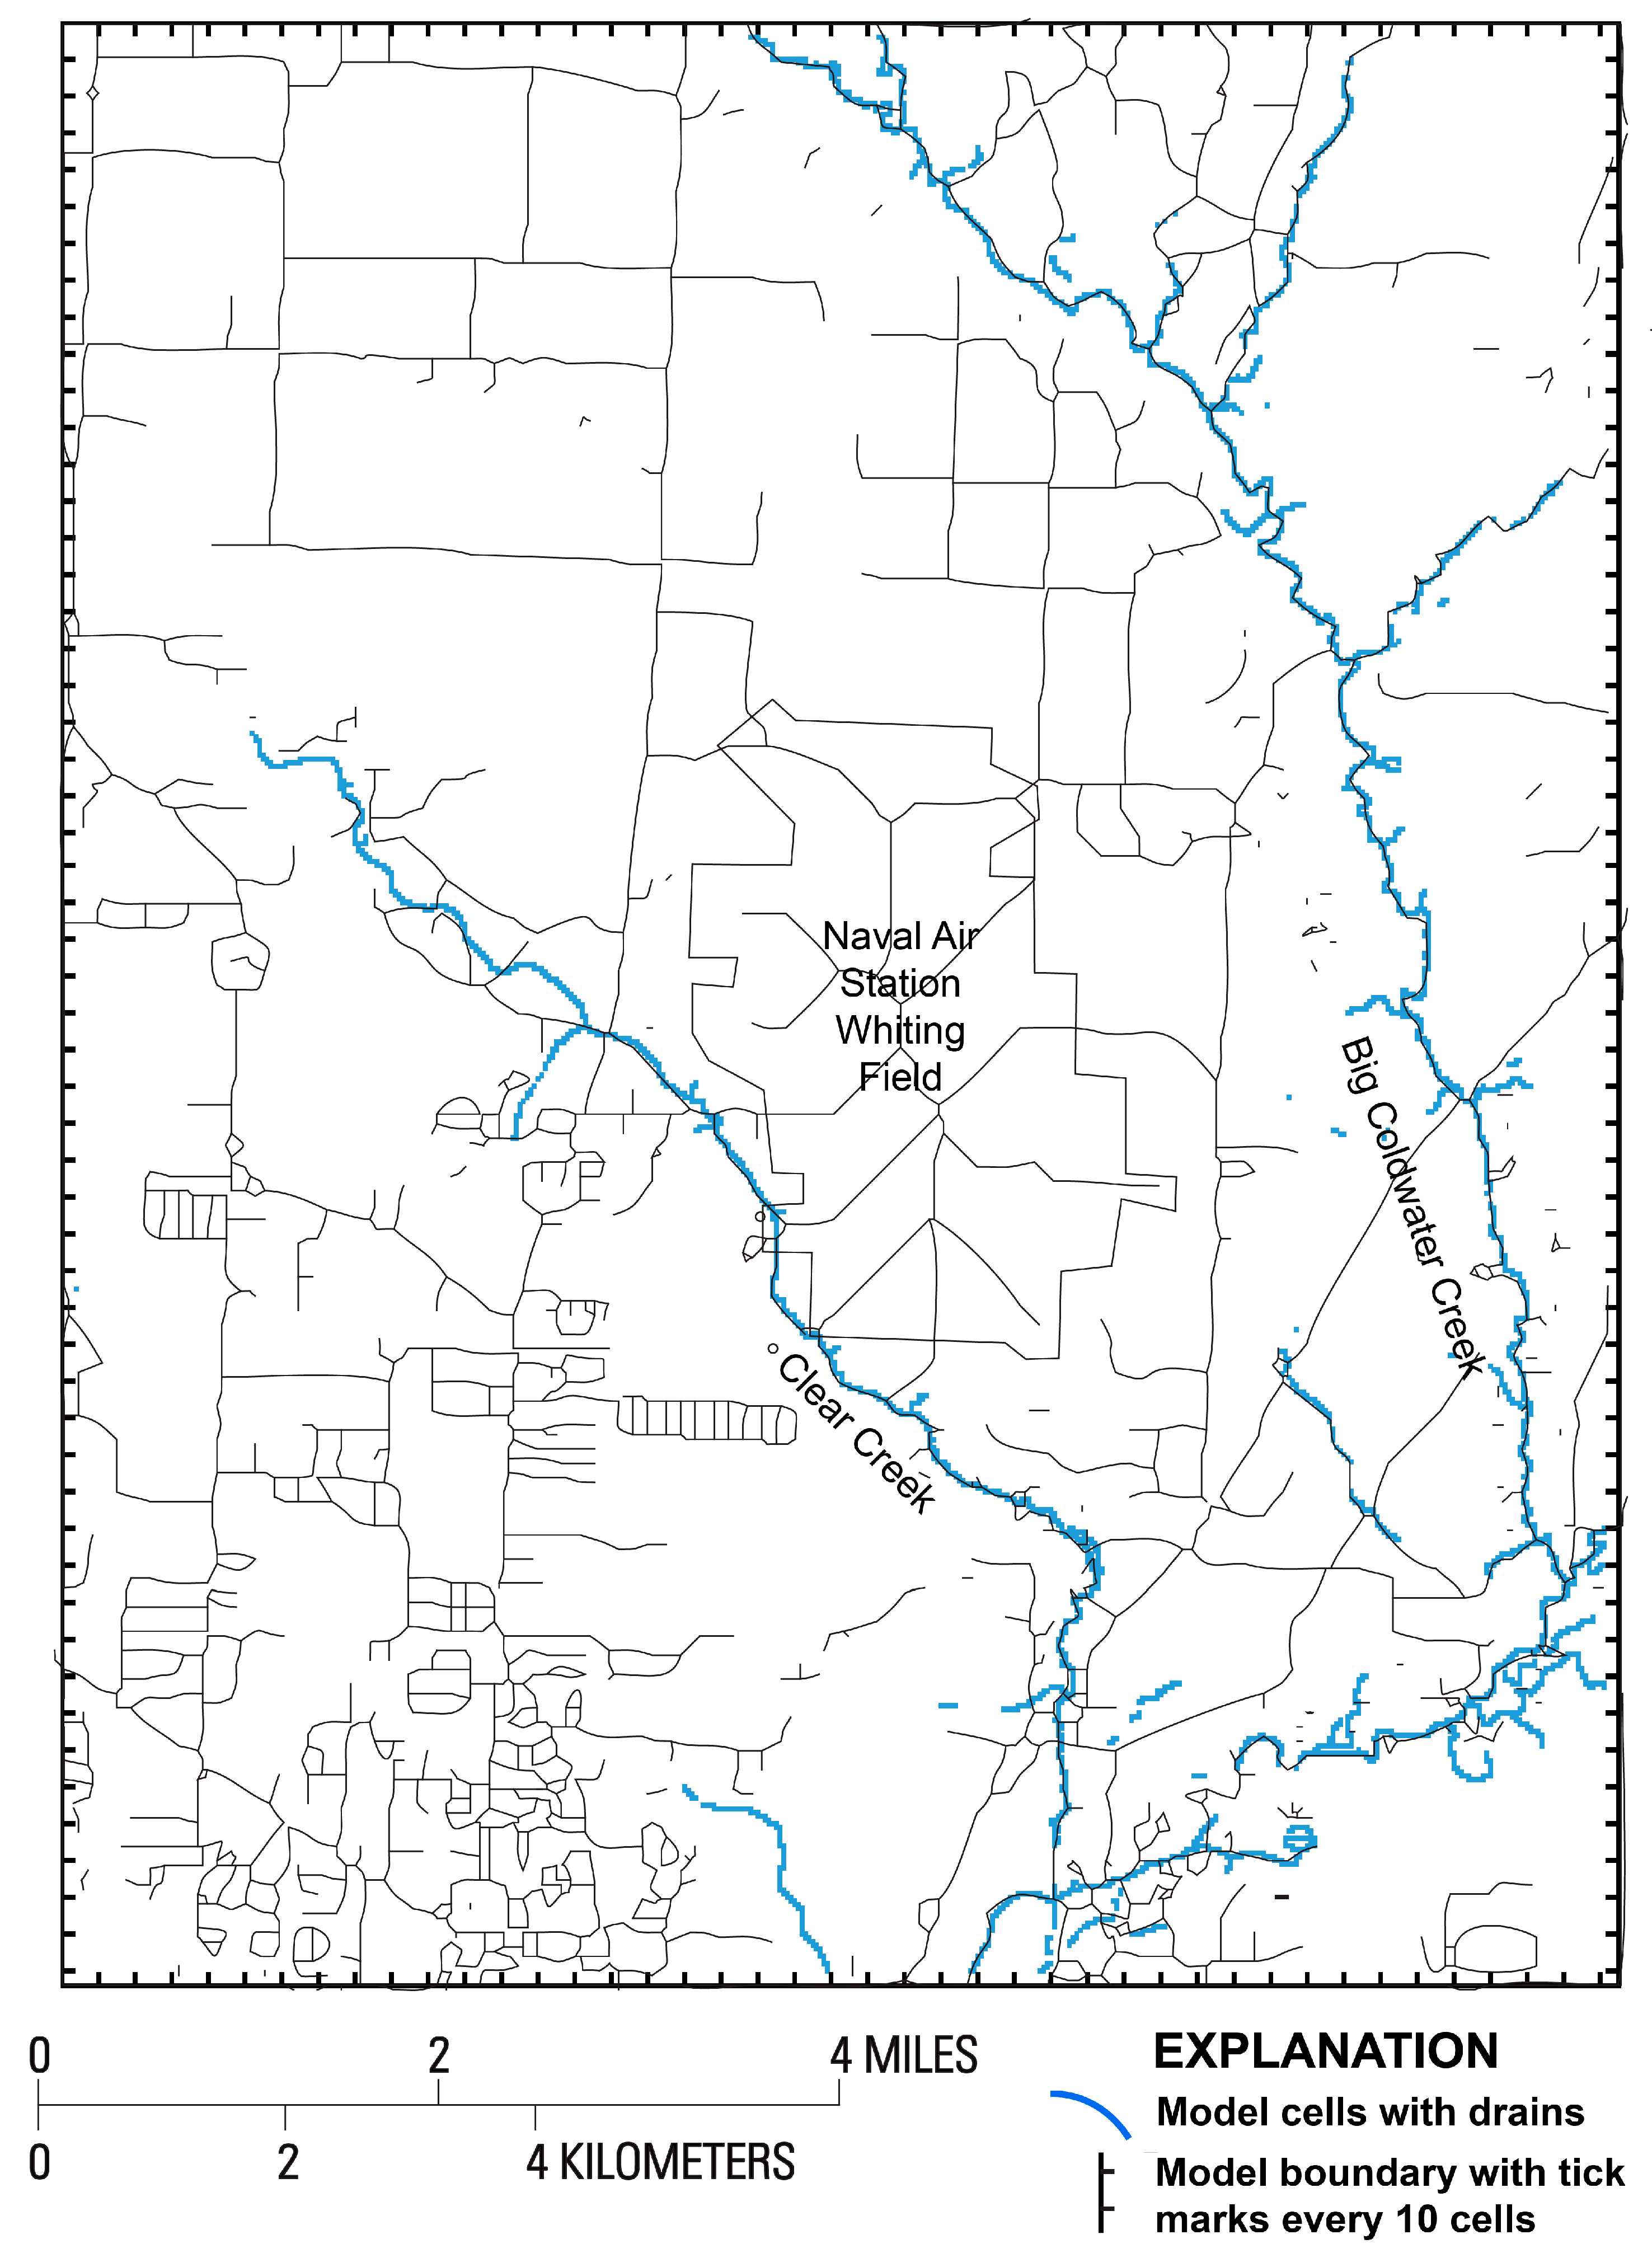
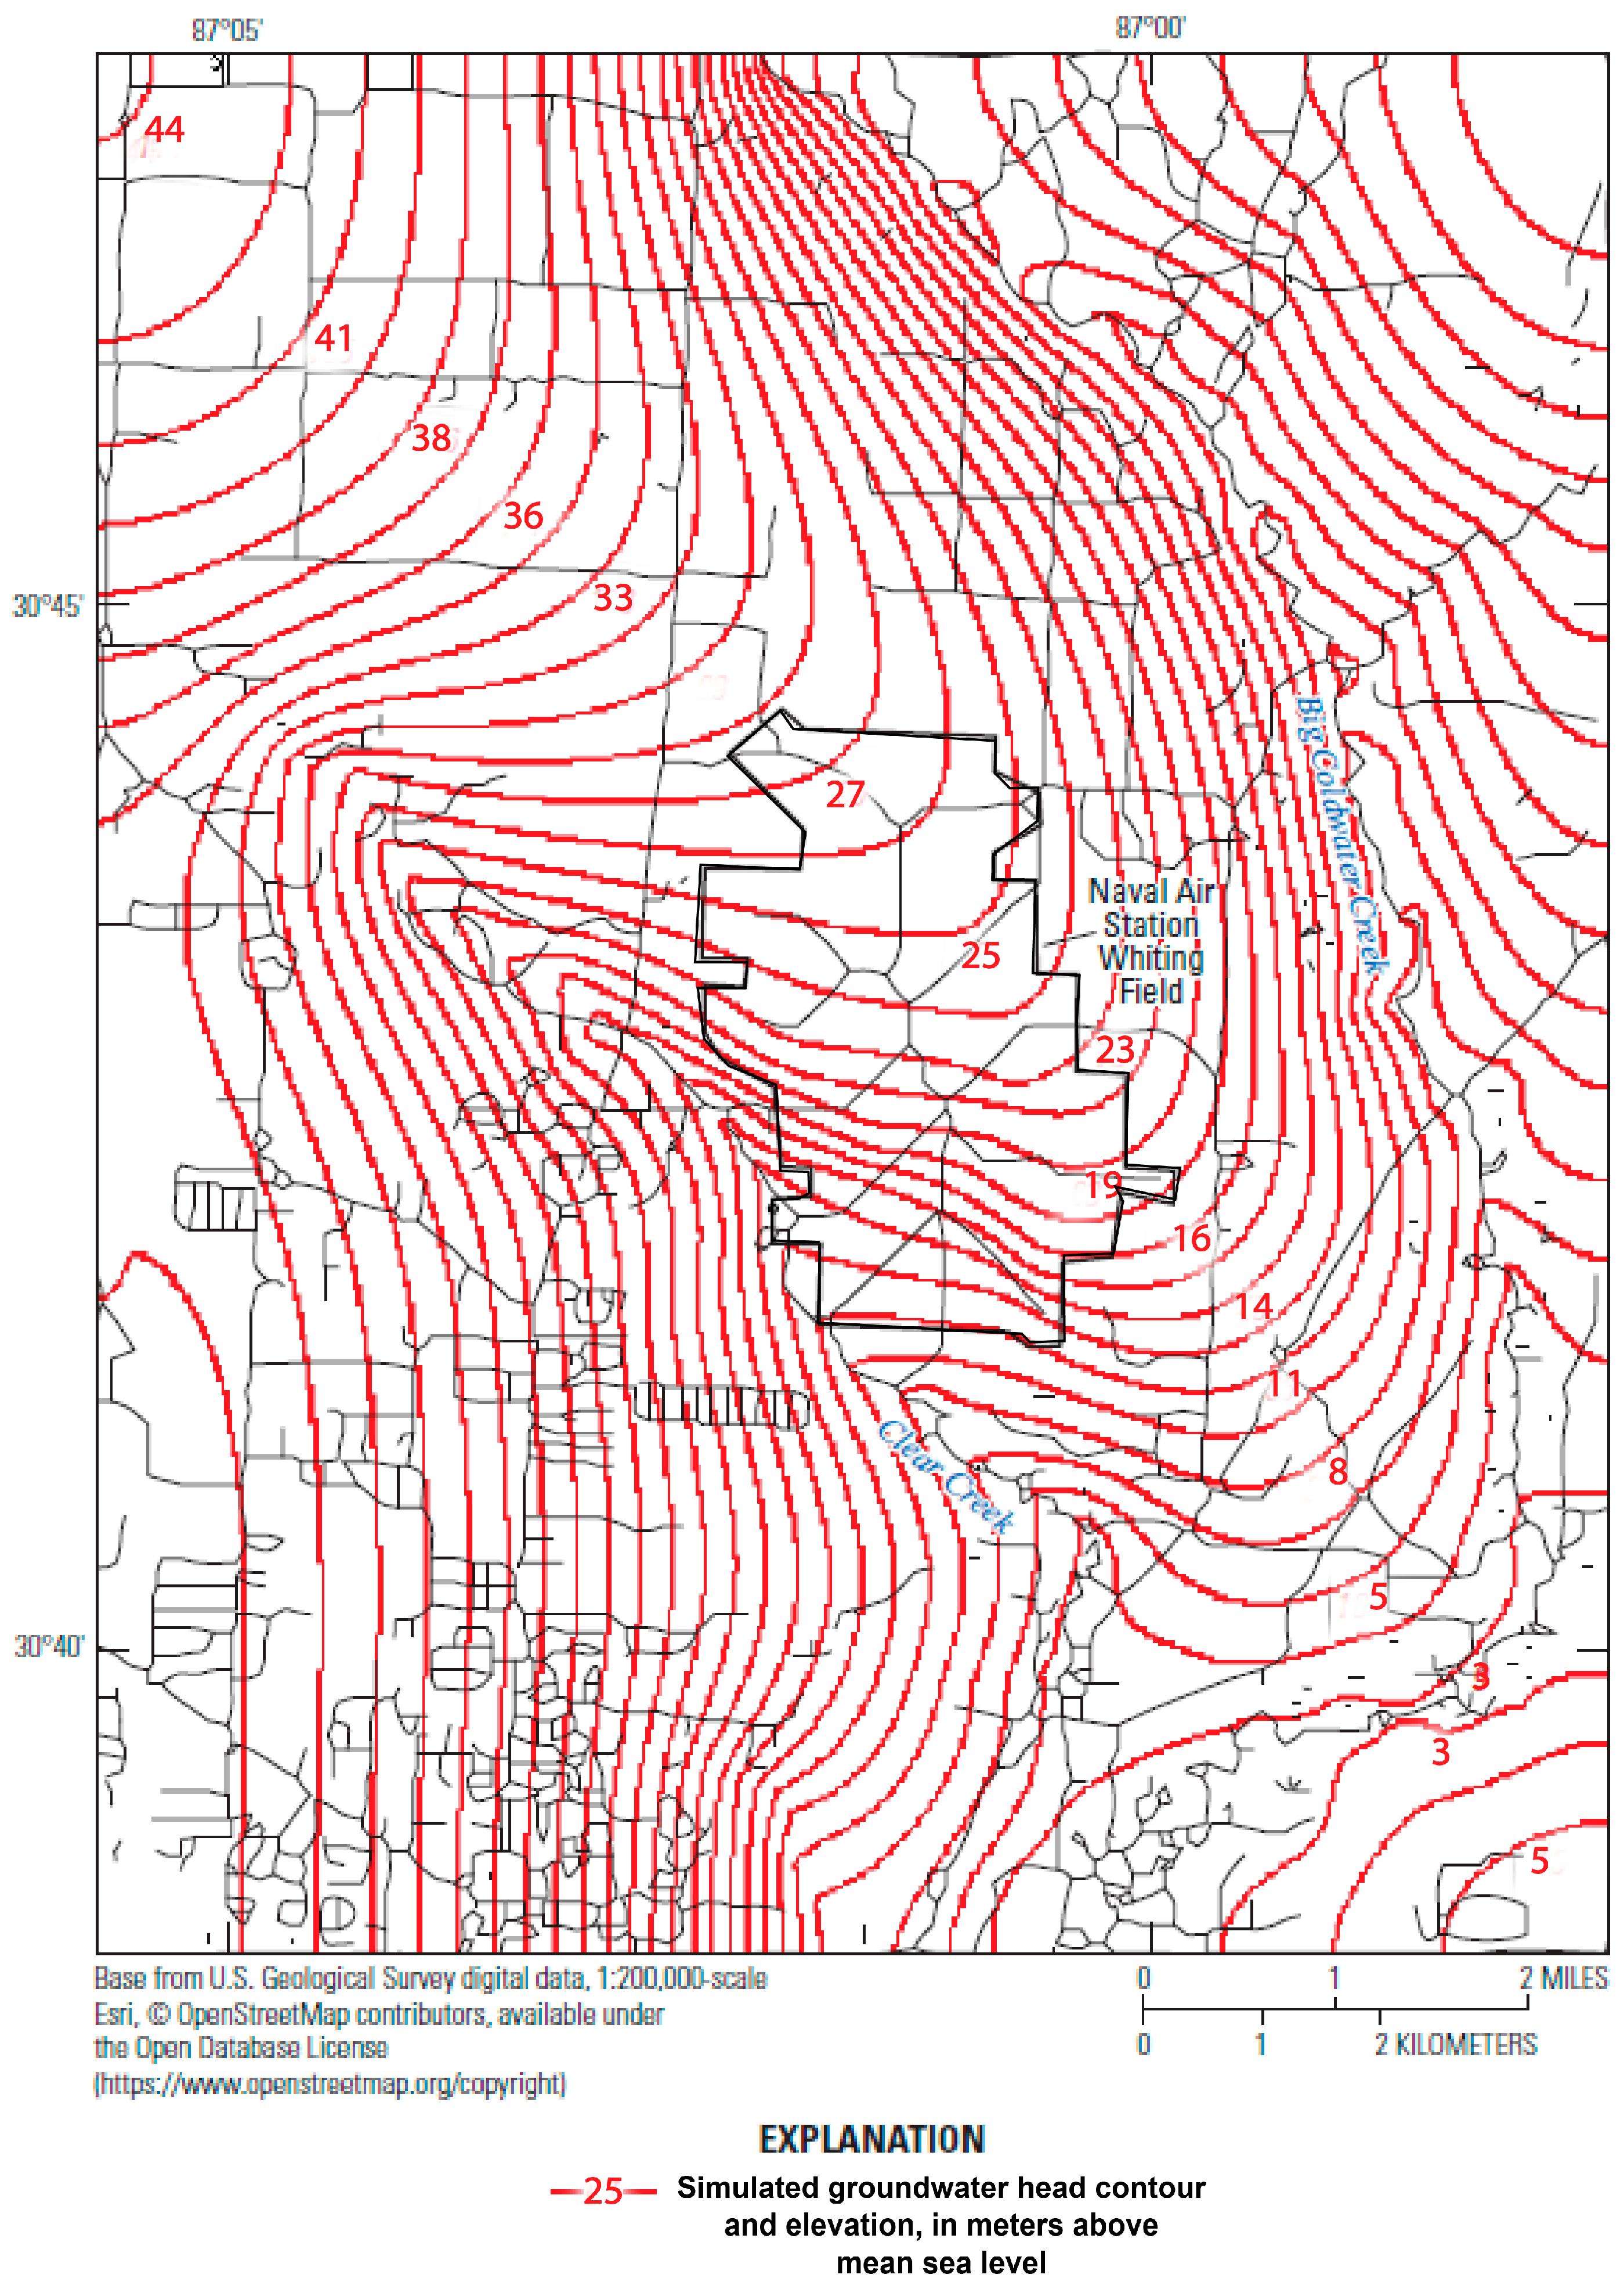
3.2. Whiting Field Groundwater Model (WFGM)
4. Results
4.1. Particle Backtracking Locations
4.2. Particle Backtracking Locations
5. Implications for Naval Air Station Whiting Field
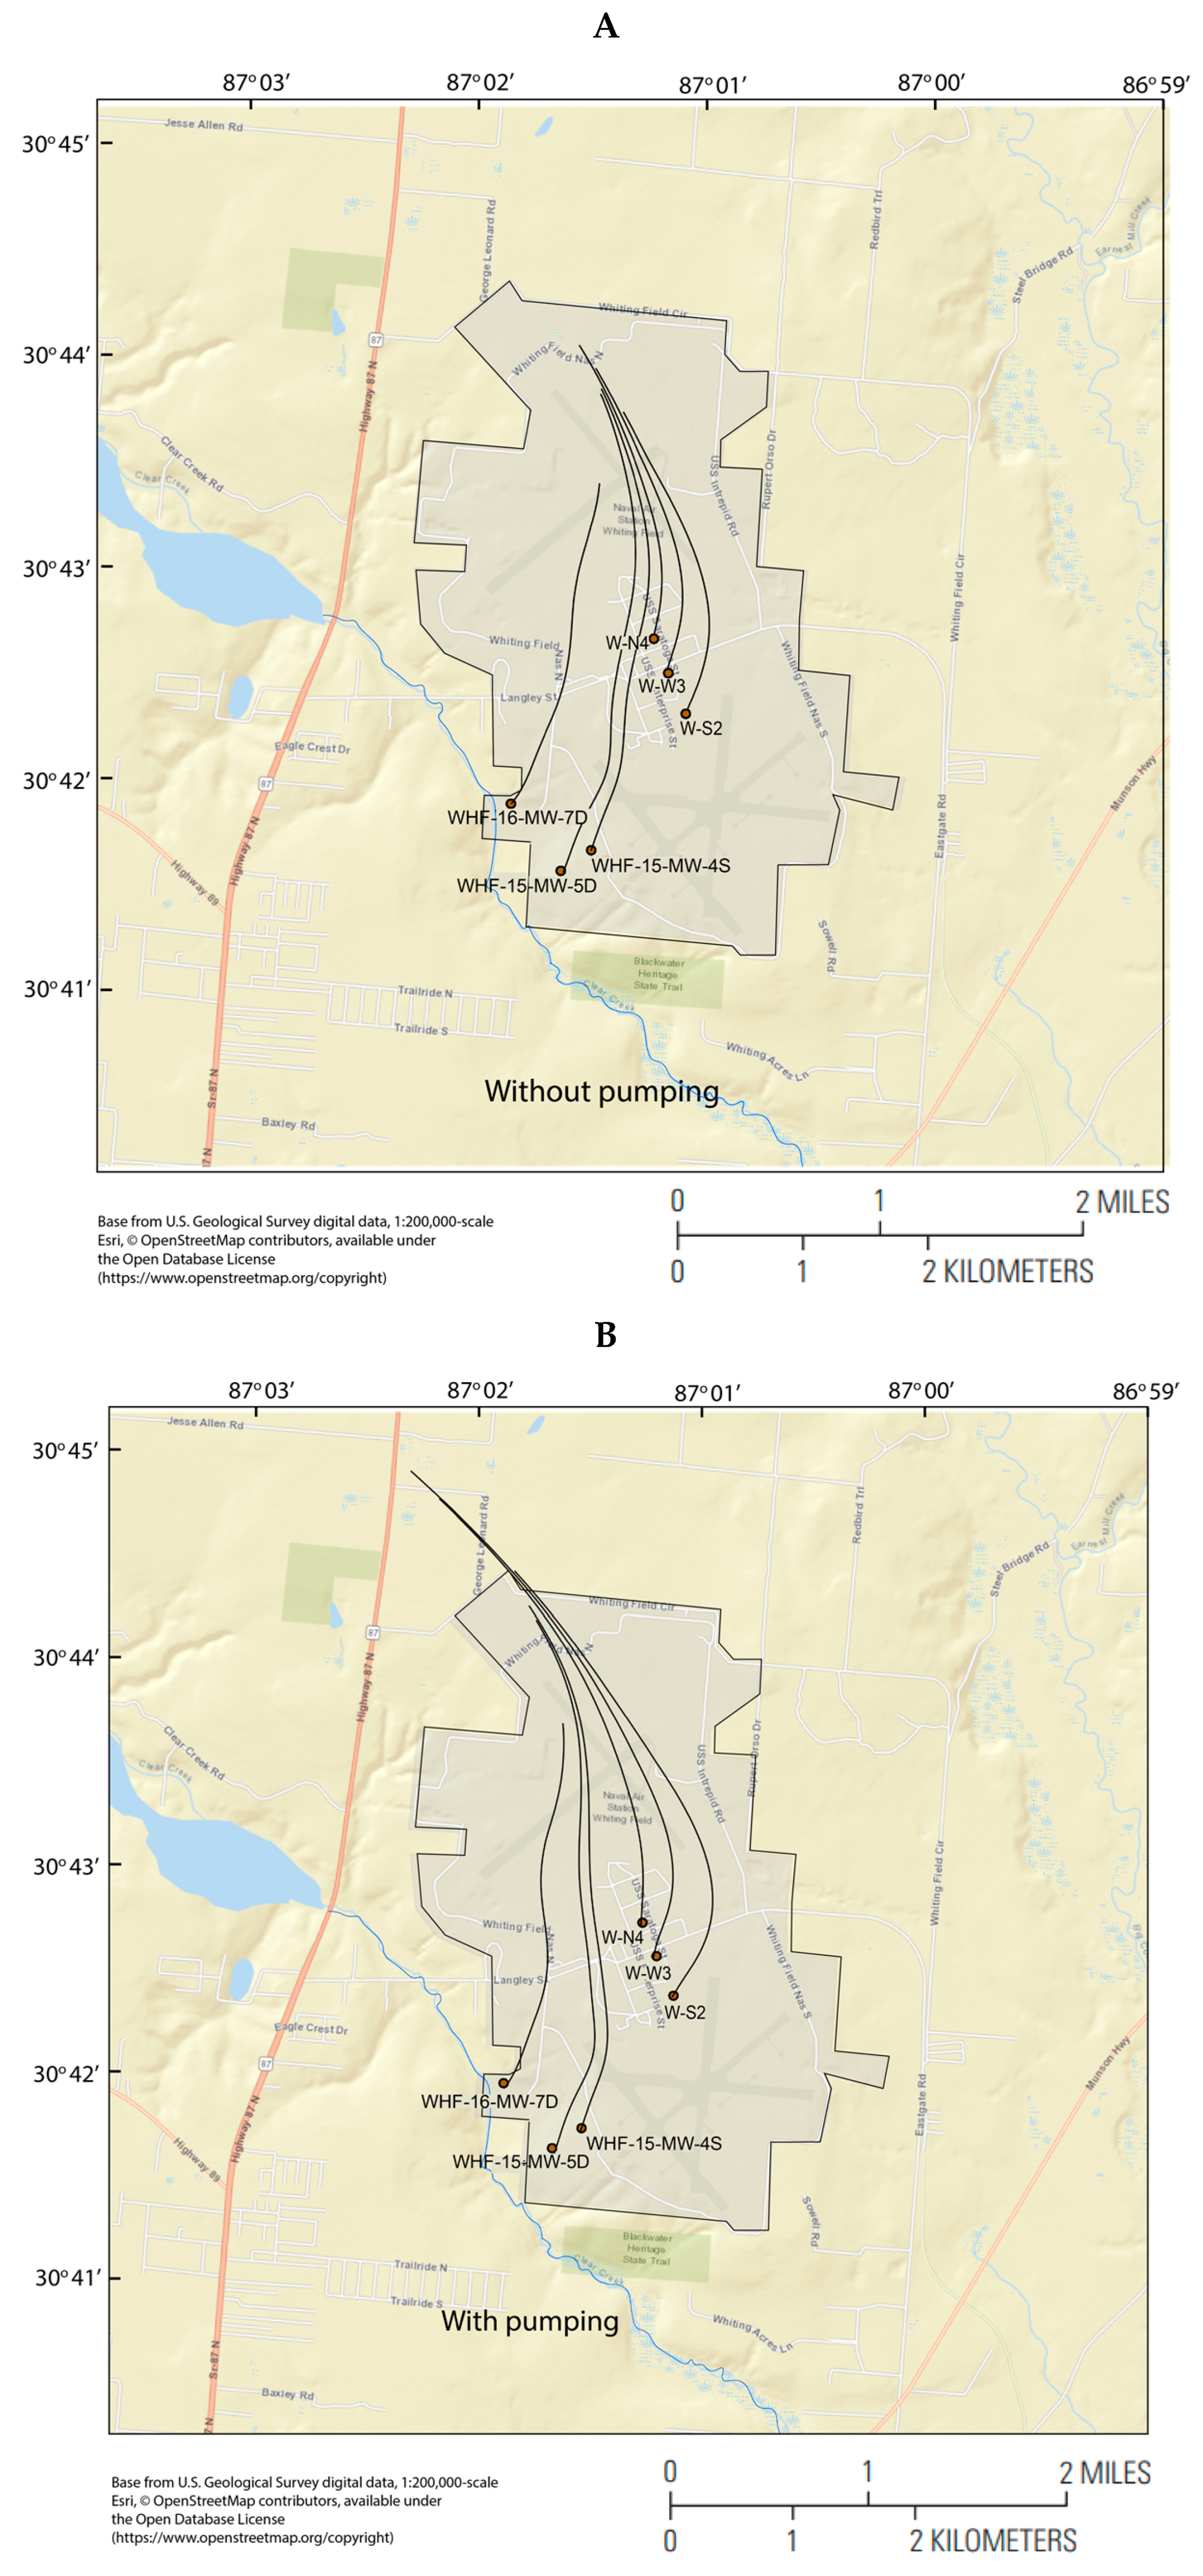
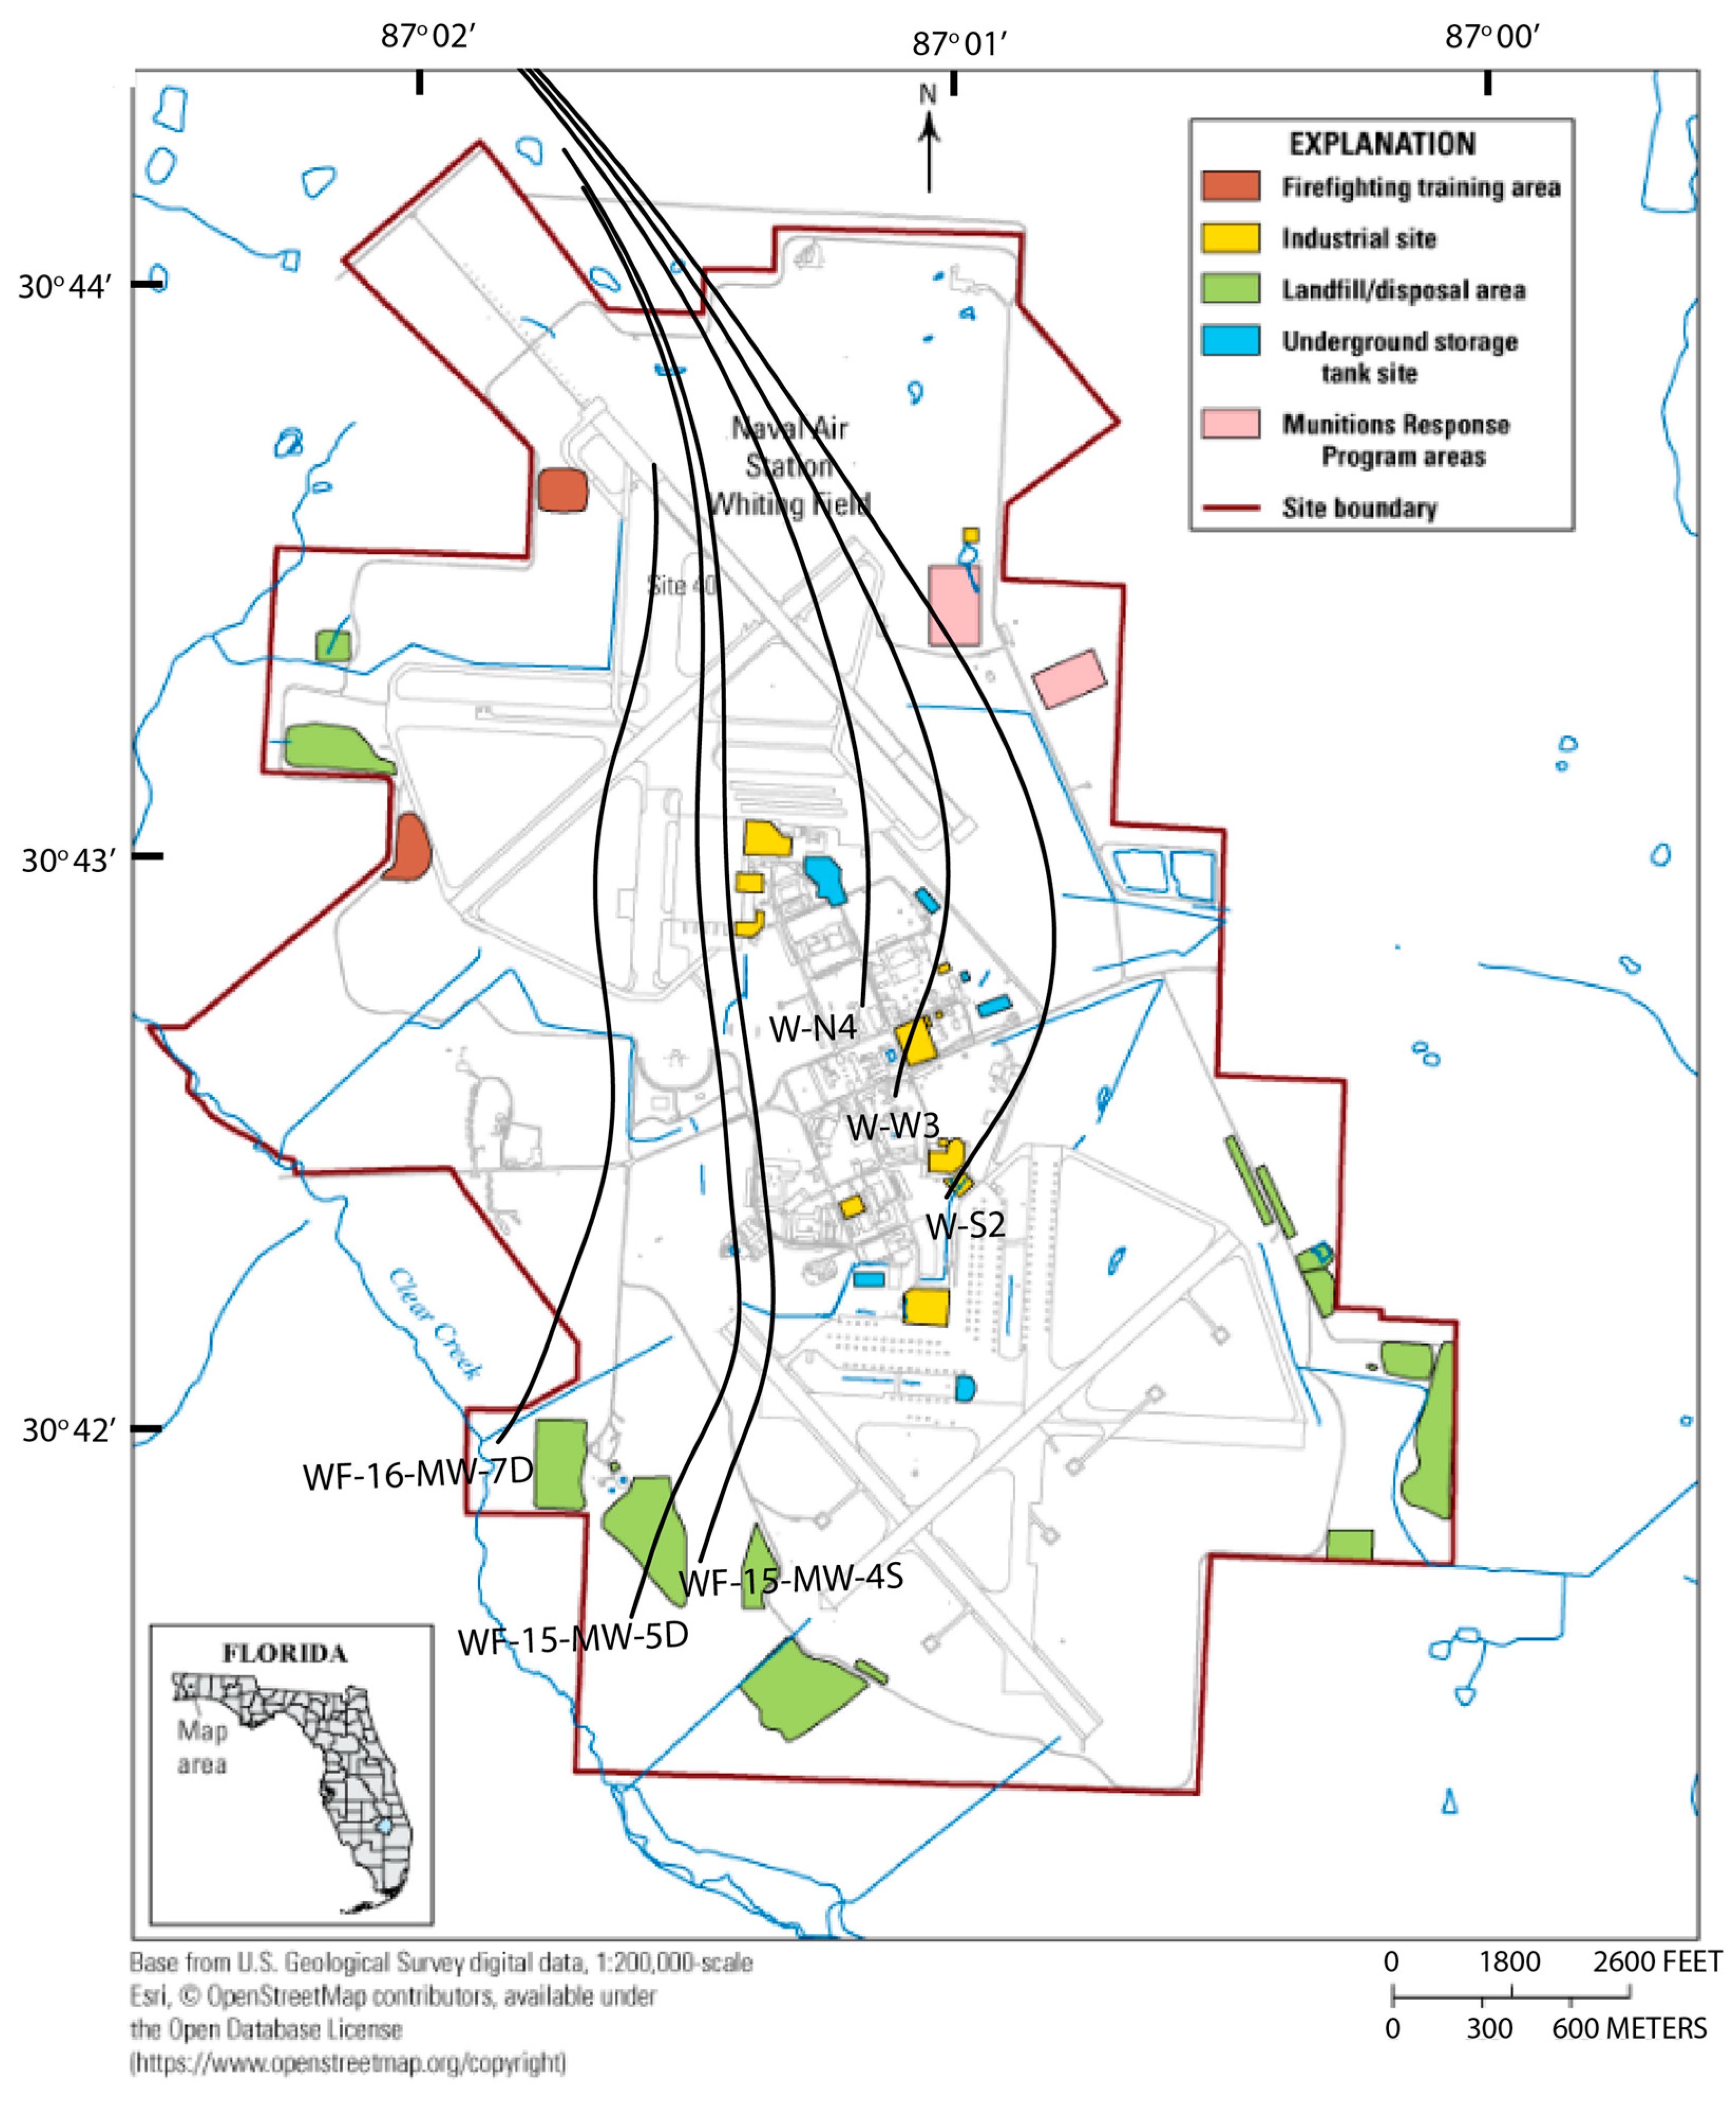
- The higher pumping rate at the three public supply wells lengthens simulated groundwater flow pathways to these wells and changes flow patterns nearby, as can be seen in the flow paths to wells WHF-16-MW-7D, WHF-15-MW-4S, and WHF-15-MW-5D (Figure 8).
- Relating the simulated groundwater flow pathways to features in NASWF yields estimates of known and unknown source areas (Figure 9). Monitoring wells WHF-15-MW-4S and WHF-15-MW-5D have flow pathways that pass close to known landfill/disposal areas and industrial sites near the center of NASWF [3]. The flow pathway to WHF-16-MW-7D also passes a nearby landfill/disposal area and has a source near a firefighter training area in the north of NASWF (Figure 8). It was stated by [3] that the benzene contamination in WHF-16-MW-7D likely came from the underground storage tank site near the center of NASWF (Figure 9), but the particle-tracking results indicate that the flow path to WHF-16-MW-7D is not as close to the underground storage tanks as other wells. However, a possible explanation for this difference is that dispersion was not represented in the particle-tracking simulation and could allow for the additional movement of contaminants. Also, a source farther north might be possible.
- The simulated sources of water for the three pumping public supply wells were farther north than those of the monitoring wells, and it seems that any contamination detected in monitoring wells WHF-15-MW-4S and WHF-15-MW-5D might also be detected in the three public supply wells. Moreover, the simulated groundwater flow pathways for the three public supply wells did not approach known firefighter training areas (Figure 9). As such, at this time, the source of chemicals such as PFOS and PFOA detected in these wells remains a focus of future investigation. In fact, there may be sources off base, as shown by the flow pathways (Figure 9), in areas that are characterized by agricultural land uses.
6. Simulation Limitations
- MODPATH calculates the average linear velocity from the flow across a model cell face. Therefore, MODPATH cannot simulate the actual velocity distribution that occurs due to variations in the aquifer that cause dispersion. The sporadic nature of rainfall–recharge causes vertical groundwater gradients to temporally fluctuate, causing dispersion not represented in the simulation.
- The depth of the point where a particle reaches a well is approximated in the simulation by the depth of the well, but actual interchange between the aquifer and a well occurs over the well’s screened interval. This discrepancy is likely to affect travel-time estimates as uncertainty in depth from surface recharge produces uncertainty in vertical transport times. However, particle pathlines are less likely to be affected as vertical variations in horizontal groundwater flow velocity and direction are minimal [3].
- Porosity, which inversely affects groundwater flow velocity, was simulated as spatially uniform and given a nominal value of 0.3. If there were additional field data, the porosity could be made spatially variable and calibrated with the measured travel time data. However, it was of interest to see how groundwater flow generated by the WFGM produced simulated particle travel time without specific calibration to the field data. With a steady-state groundwater simulation, porosity data are not used in the groundwater simulation and only act as a divisor for computing particle-tracking velocity from the computed flow. So, any spatially uniform change in porosity produces the same particle paths and changes the travel time by the ratio of the old porosity to the new porosity.
- The use of the steady-state WFGM simulation ignores possible seasonal and long-term fluctuations in groundwater flow magnitude and direction. Surficial recharge was calibrated in the WFGM for groundwater heads from August 1997, so the recharge and groundwater flows may not have reflected entire multi-decadal particle travel times. Seasonal fluctuations generally increase flow in the wet season and decrease flow in the dry season, with the steady-state simulation representing intermediate flows, a good long-term average.
- The groundwater flow velocities used by the particle-tracking application are interpolated between WFGM grid cells and cannot take any smaller-scale features into account. This limitation comes from the groundwater model simulation.
7. Conclusions
Author Contributions
Funding
Data Availability Statement
Acknowledgments
Conflicts of Interest
References
- Naval Facilities Engineering Command Southern Division. NAS Whiting Field and Outlying Landing Fields: Master Plan; Naval Facilities Engineering Command Southern Division: Jacksonville, FL, USA, 1988; Available online: https://books.google.com/books?id=KIditwAACAAJ (accessed on 22 February 2024).
- Navy, U.S. Draft Final Remedial Investigation Report for Site 40, Base-Wide Groundwater, Naval Air Station Whiting Field Milton, Florida, 2012. Available online: https://prodenv.dep.state.fl.us/DepStaging/api/dms/5.187897.1 (accessed on 22 February 2024).
- Landmeyer, J.E.; Swain, E.D.; Johnson, C.D.; Lisle, J.T.; McBride, W.S.; Chung, D.H.; Singletary, M.A. Groundwater Chemistry, Hydrogeologic Properties, Bioremediation Potential, and Three-Dimensional Numerical Simulation of the Sand and Gravel Aquifer at Naval Air Station Whiting Field, near Milton, Florida, 2015–2020. In U.S. Geological Survey Scientific Investigations Report 2021–5124; USGS: Reston, VA, USA, 2021; 52p. [Google Scholar] [CrossRef]
- Kotowski, T.; Chudzik, L.; Najman, J. Application of dissolved gases concentration measurements, hydrochemical and isotopic data to determine the circulation conditions and age of groundwater in the Central Sudetes Mts. J. Hydrol. 2019, 569, 735–752. [Google Scholar] [CrossRef]
- Kotowski, T.; Najman, J.; Nowobilska-Luberda, A.; Bergel, T.; Kaczor, G. Analysis of the interaction between surface water and groundwater using gaseous tracers in a dynamic test at a riverbank filtration intake. Hydrol. Process. 2023, 37, e14862. [Google Scholar] [CrossRef]
- Pollock, D.W. Extending the MODPATH algorithm to rectangular unstructured grids. Groundwater 2016, 54, 121–125. [Google Scholar] [CrossRef] [PubMed]
- Craig, J.R.; Ramadhan, M.; Muffels, C. A particle tracking algorithm for arbitrary unstructured grids. Groundwater 2019, 58, 19–26. [Google Scholar] [CrossRef] [PubMed]
- Cayar, M.; Najmus, S.; Taghavi, A. A Particle Tracking Model, IGSM_PT, as a Post-Processor to Finite-Element Groundwater Flow Model, IGSM. In World Environmental and Water Resources Congress 2010: Challenges of Change; American Society of Civil Engineers: Reston, VA, USA, 2010; pp. 647–657. [Google Scholar]
- Cousquer, Y.; Pryet, A.; Atteia, O.; Ferré, T.P.; Delbart, C.; Valois, R.; Dupuy, A. Developing a particle tracking surrogate model to improve inversion of ground water—Surface water models. J. Hydrol. 2018, 558, 356–365. [Google Scholar] [CrossRef]
- Gusyev, M.A.; Abrams, D.; Toews, M.W.; Morgenstern, U.; Stewart, M.K. A comparison of particle-tracking and solute transport methods for simulation of tritium concentrations and groundwater transit times in river water. Hydrol. Earth Syst. Sci. 2014, 18, 3109–3119. [Google Scholar] [CrossRef]
- Jing, M.; Kumar, R.; Attinger, S.; Li, Q.; Lu, C.; Hesse, F. Assessing the contribution of groundwater to catchment travel time distributions through integrating conceptual flux tracking with explicit Lagrangian particle tracking. Adv. Water Resour. 2021, 149, 103849. [Google Scholar] [CrossRef]
- Yidana, S.M. Groundwater flow modeling and particle tracking for chemical transport in the southern Voltaian aquifers. Environ. Earth Sci. 2010, 63, 709–721. [Google Scholar] [CrossRef]
- Florida Department of Environmental Protection, Factsheet about Outstanding Florida Waters (OFWs): Florida Department of Environmental Protection, 2020, 5p. Available online: https://floridadep.gov/sites/default/files/OFW_factsheet.pdf (accessed on 11 August 2020).
- Marsh, O.T. Geology of Escambia and Santa Rosa Counties, western Florida Panhandle: Florida Geological Survey Bulletin no. 46, 1966, 140p. Available online: https://ufdc.ufl.edu/uf00000233/00001 (accessed on 22 February 2024).
- Niswonger, R.G.; Panday, S.; Ibaraki, M. MODFLOW-NWT, a Newton Formulation for MODFLOW-2005: U.S. Geological Survey Techniques and Methods 6–A37; USGS: Reston, VA, USA, 2011; 44p. [Google Scholar] [CrossRef]
- Pollock, D.W. Documentation of Computer Programs to Compute and Display Pathlines Using Results from the U.S. Geological Survey Modular Three-Dimensional Finite-Difference Ground-Water Flow Model; U.S. Geological Survey Open-File Report 89-381; USGS: Reston, VA, USA, 1989. [Google Scholar] [CrossRef]
- Elshall, A.S.; Tsai, F.T.-C.; Hanor, J.S. Indicator geostatistics for reconstructing Baton Rouge aquifer-fault hydrostratigraphy, Louisiana, USA. Hydrogeol. J. 2013, 21, 1731–1747. [Google Scholar] [CrossRef]
- Elshall, A.S.; Tsai, F.T.-C. Constructive epistemic modeling of groundwater flow with geological structure and boundary condition uncertainty under the Bayesian paradigm. J. Hydrol. 2014, 517, 105–119. [Google Scholar] [CrossRef]
- Swain, E.D. MODFLOW Simulator used to Assess Groundwater Flow for the Whiting Field Naval Air Station, Milton, FL; USGS: Reston, VA, USA, 2021. [Google Scholar] [CrossRef]


| Well Name (Figure 3) | USGS ID | Easting | Northing | Well Type | Screened Depth m bls | Pumping Rate lpm | WFGM | |
|---|---|---|---|---|---|---|---|---|
| Row | Column | |||||||
| WHF-16-MW-7D | 304153087015101 | 497052 | 3396147 | Monitoring | - | - | 322 | 201 |
| WHF-15-MW-4S | 304147087012301 | 499488 | 3395483 | Monitoring | 28.7–33.3 | - | 333 | 223 |
| WHF-15-MW-5D | 304141087013201 | 498689 | 3394910 | Monitoring | 36.0–39.0 | - | 339 | 216 |
| W-N4 | 304244087010701 | 498222 | 3397722 | Public supply | 61.0–67.1 | 1900 | 276 | 237 |
| W-W3 | 304235087010201 | 498351 | 3397447 | Public supply | 51.8–61.3 | 1900 | 285 | 241 |
| W-S2 | 304225087005601 | 498515 | 3397120 | Public supply | 51.8–68.6 | 1900 | 295 | 247 |
| Simulated Particle Travel Time, Years | |||
|---|---|---|---|
| Well Name | No Pumping | Pumping | Estimated from Field Data [3] |
| WHF-16-MW-7D | 26.3 | 25.9 | 25 |
| WHF-15-MW-4S | 31.3 | 33.3 | 39 |
| WHF-15-MW-5D | 31.4 | 33.4 | 38 |
| W-N4 | 29.4 | 37.6 | - |
| W-W3 | 31.2 | 43.7 | - |
| W-S2 | 35.8 | 45.9 | - |
Disclaimer/Publisher’s Note: The statements, opinions and data contained in all publications are solely those of the individual author(s) and contributor(s) and not of MDPI and/or the editor(s). MDPI and/or the editor(s) disclaim responsibility for any injury to people or property resulting from any ideas, methods, instructions or products referred to in the content. |
© 2024 by the authors. Licensee MDPI, Basel, Switzerland. This article is an open access article distributed under the terms and conditions of the Creative Commons Attribution (CC BY) license (https://creativecommons.org/licenses/by/4.0/).
Share and Cite
Swain, E.D.; Landmeyer, J.E.; Singletary, M.A.; Provenzano, S.E. Insight into Sources of Benzene, TCE, and PFOA/PFOS in Groundwater at Naval Air Station Whiting Field, Florida, through Numerical Particle-Tracking Simulations. Hydrology 2024, 11, 37. https://0-doi-org.brum.beds.ac.uk/10.3390/hydrology11030037
Swain ED, Landmeyer JE, Singletary MA, Provenzano SE. Insight into Sources of Benzene, TCE, and PFOA/PFOS in Groundwater at Naval Air Station Whiting Field, Florida, through Numerical Particle-Tracking Simulations. Hydrology. 2024; 11(3):37. https://0-doi-org.brum.beds.ac.uk/10.3390/hydrology11030037
Chicago/Turabian StyleSwain, Eric D., James E. Landmeyer, Michael A. Singletary, and Shannon E. Provenzano. 2024. "Insight into Sources of Benzene, TCE, and PFOA/PFOS in Groundwater at Naval Air Station Whiting Field, Florida, through Numerical Particle-Tracking Simulations" Hydrology 11, no. 3: 37. https://0-doi-org.brum.beds.ac.uk/10.3390/hydrology11030037