

An Integrated Remote Sensing and GIS-Based Technique for Mapping Groundwater Recharge Zones: A Case Study of SW Riyadh, Central Saudi Arabia


Abstract
:1. Introduction
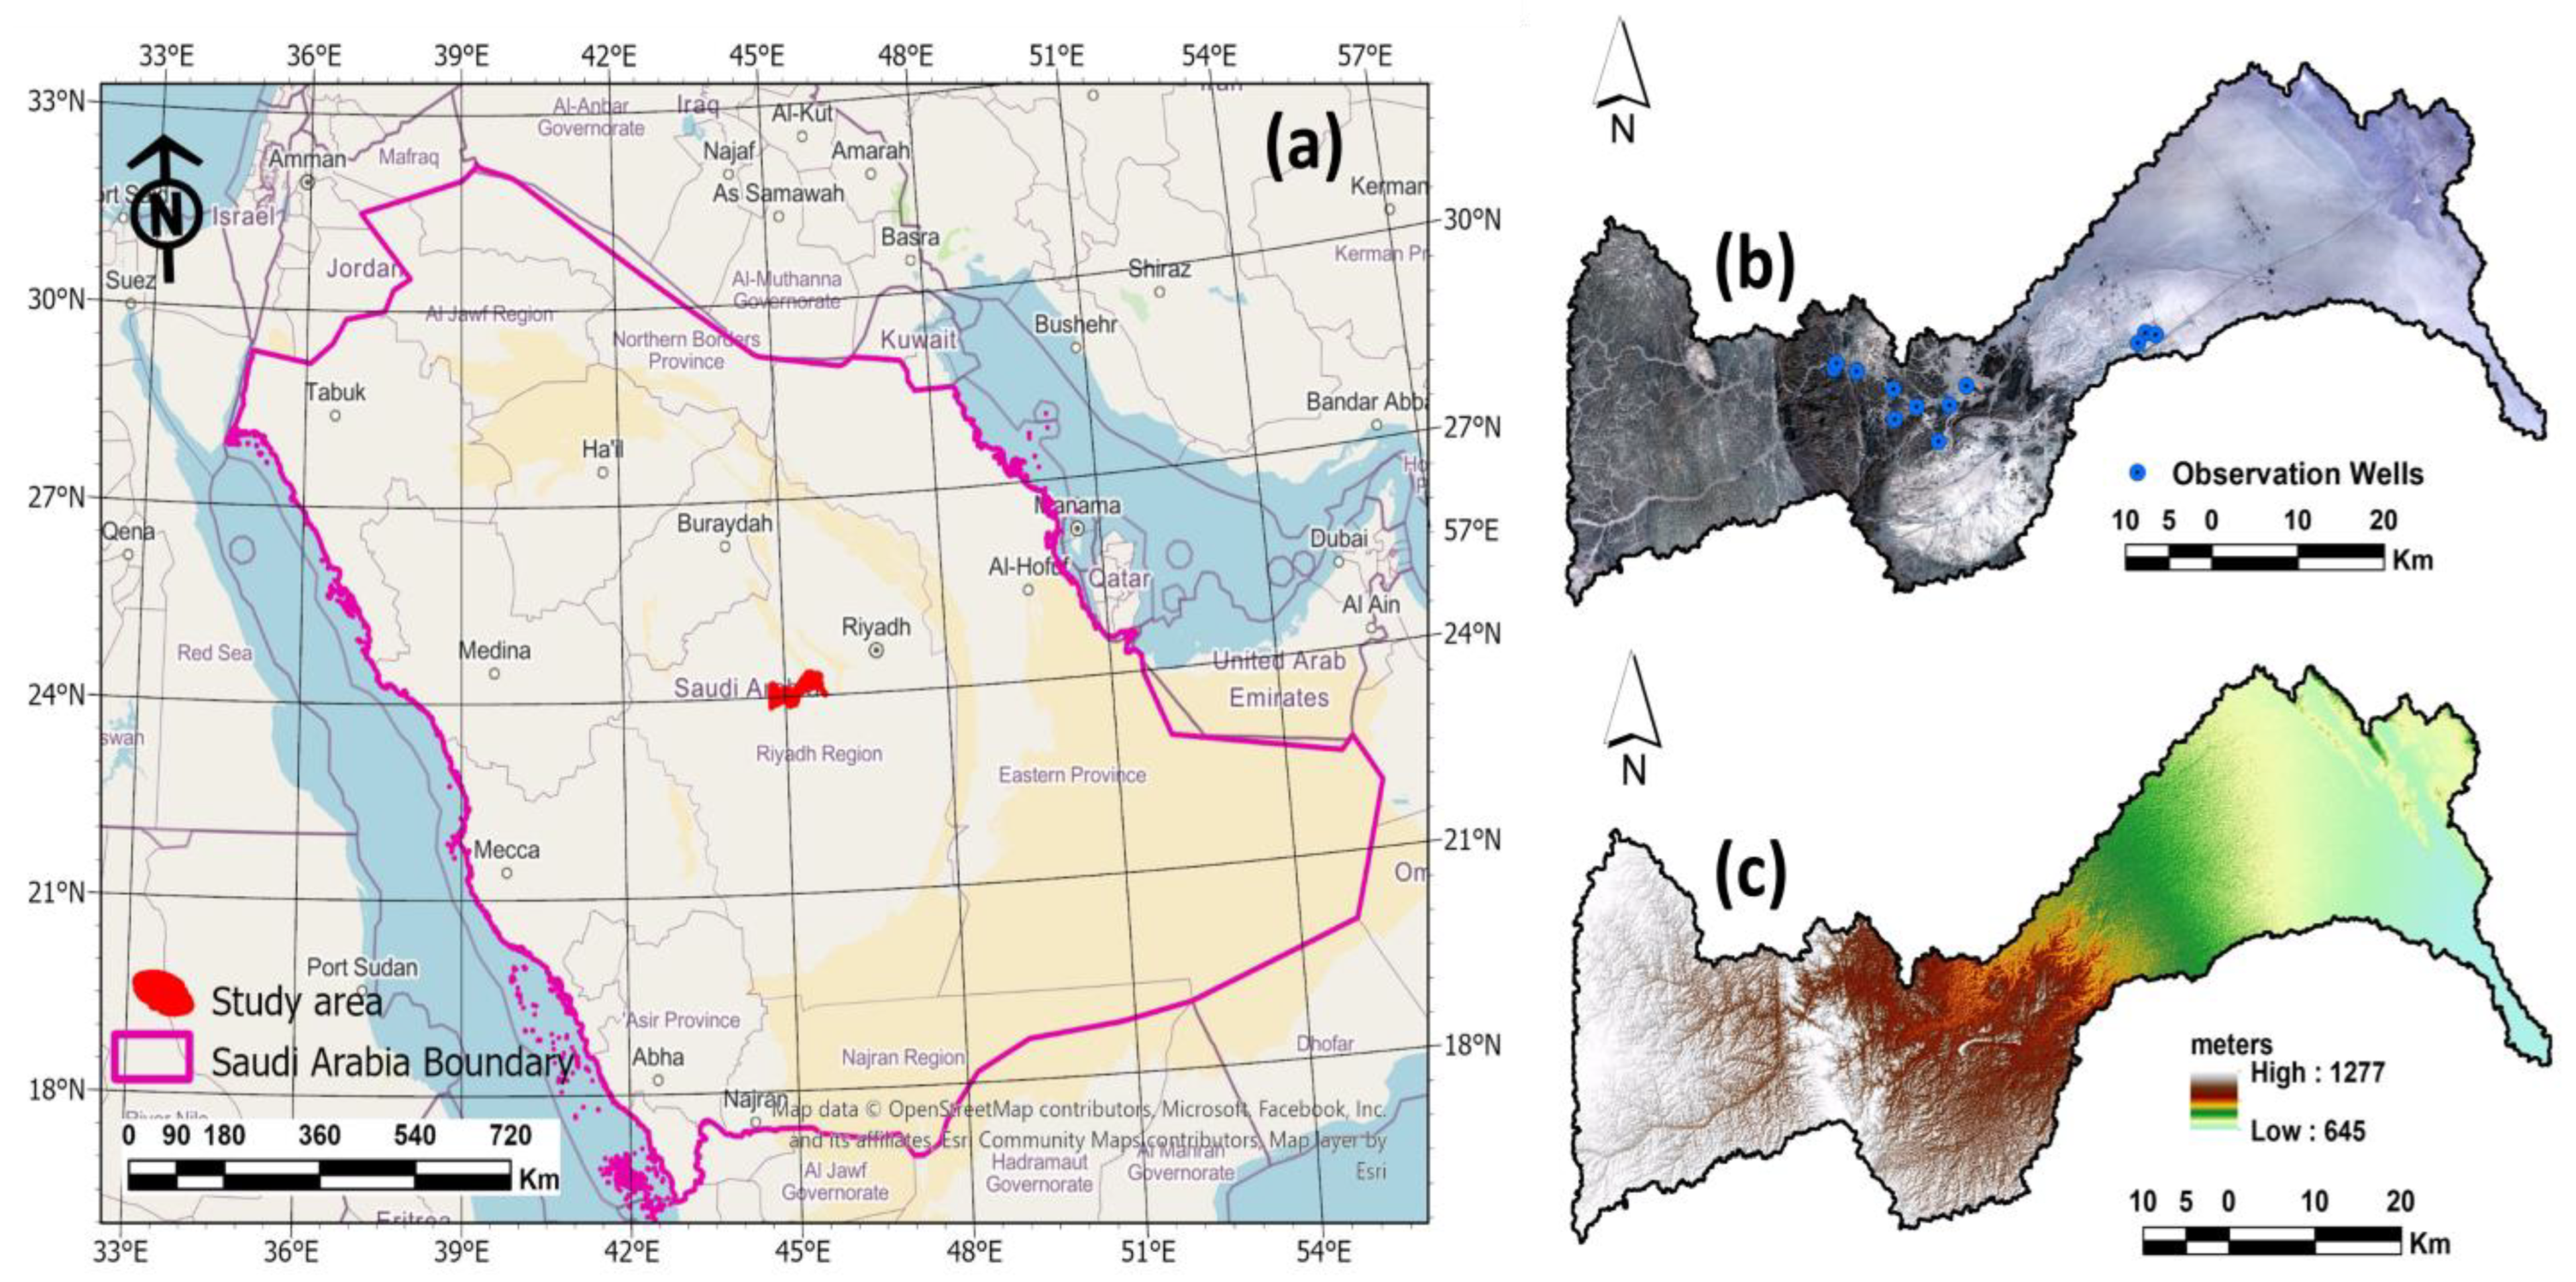
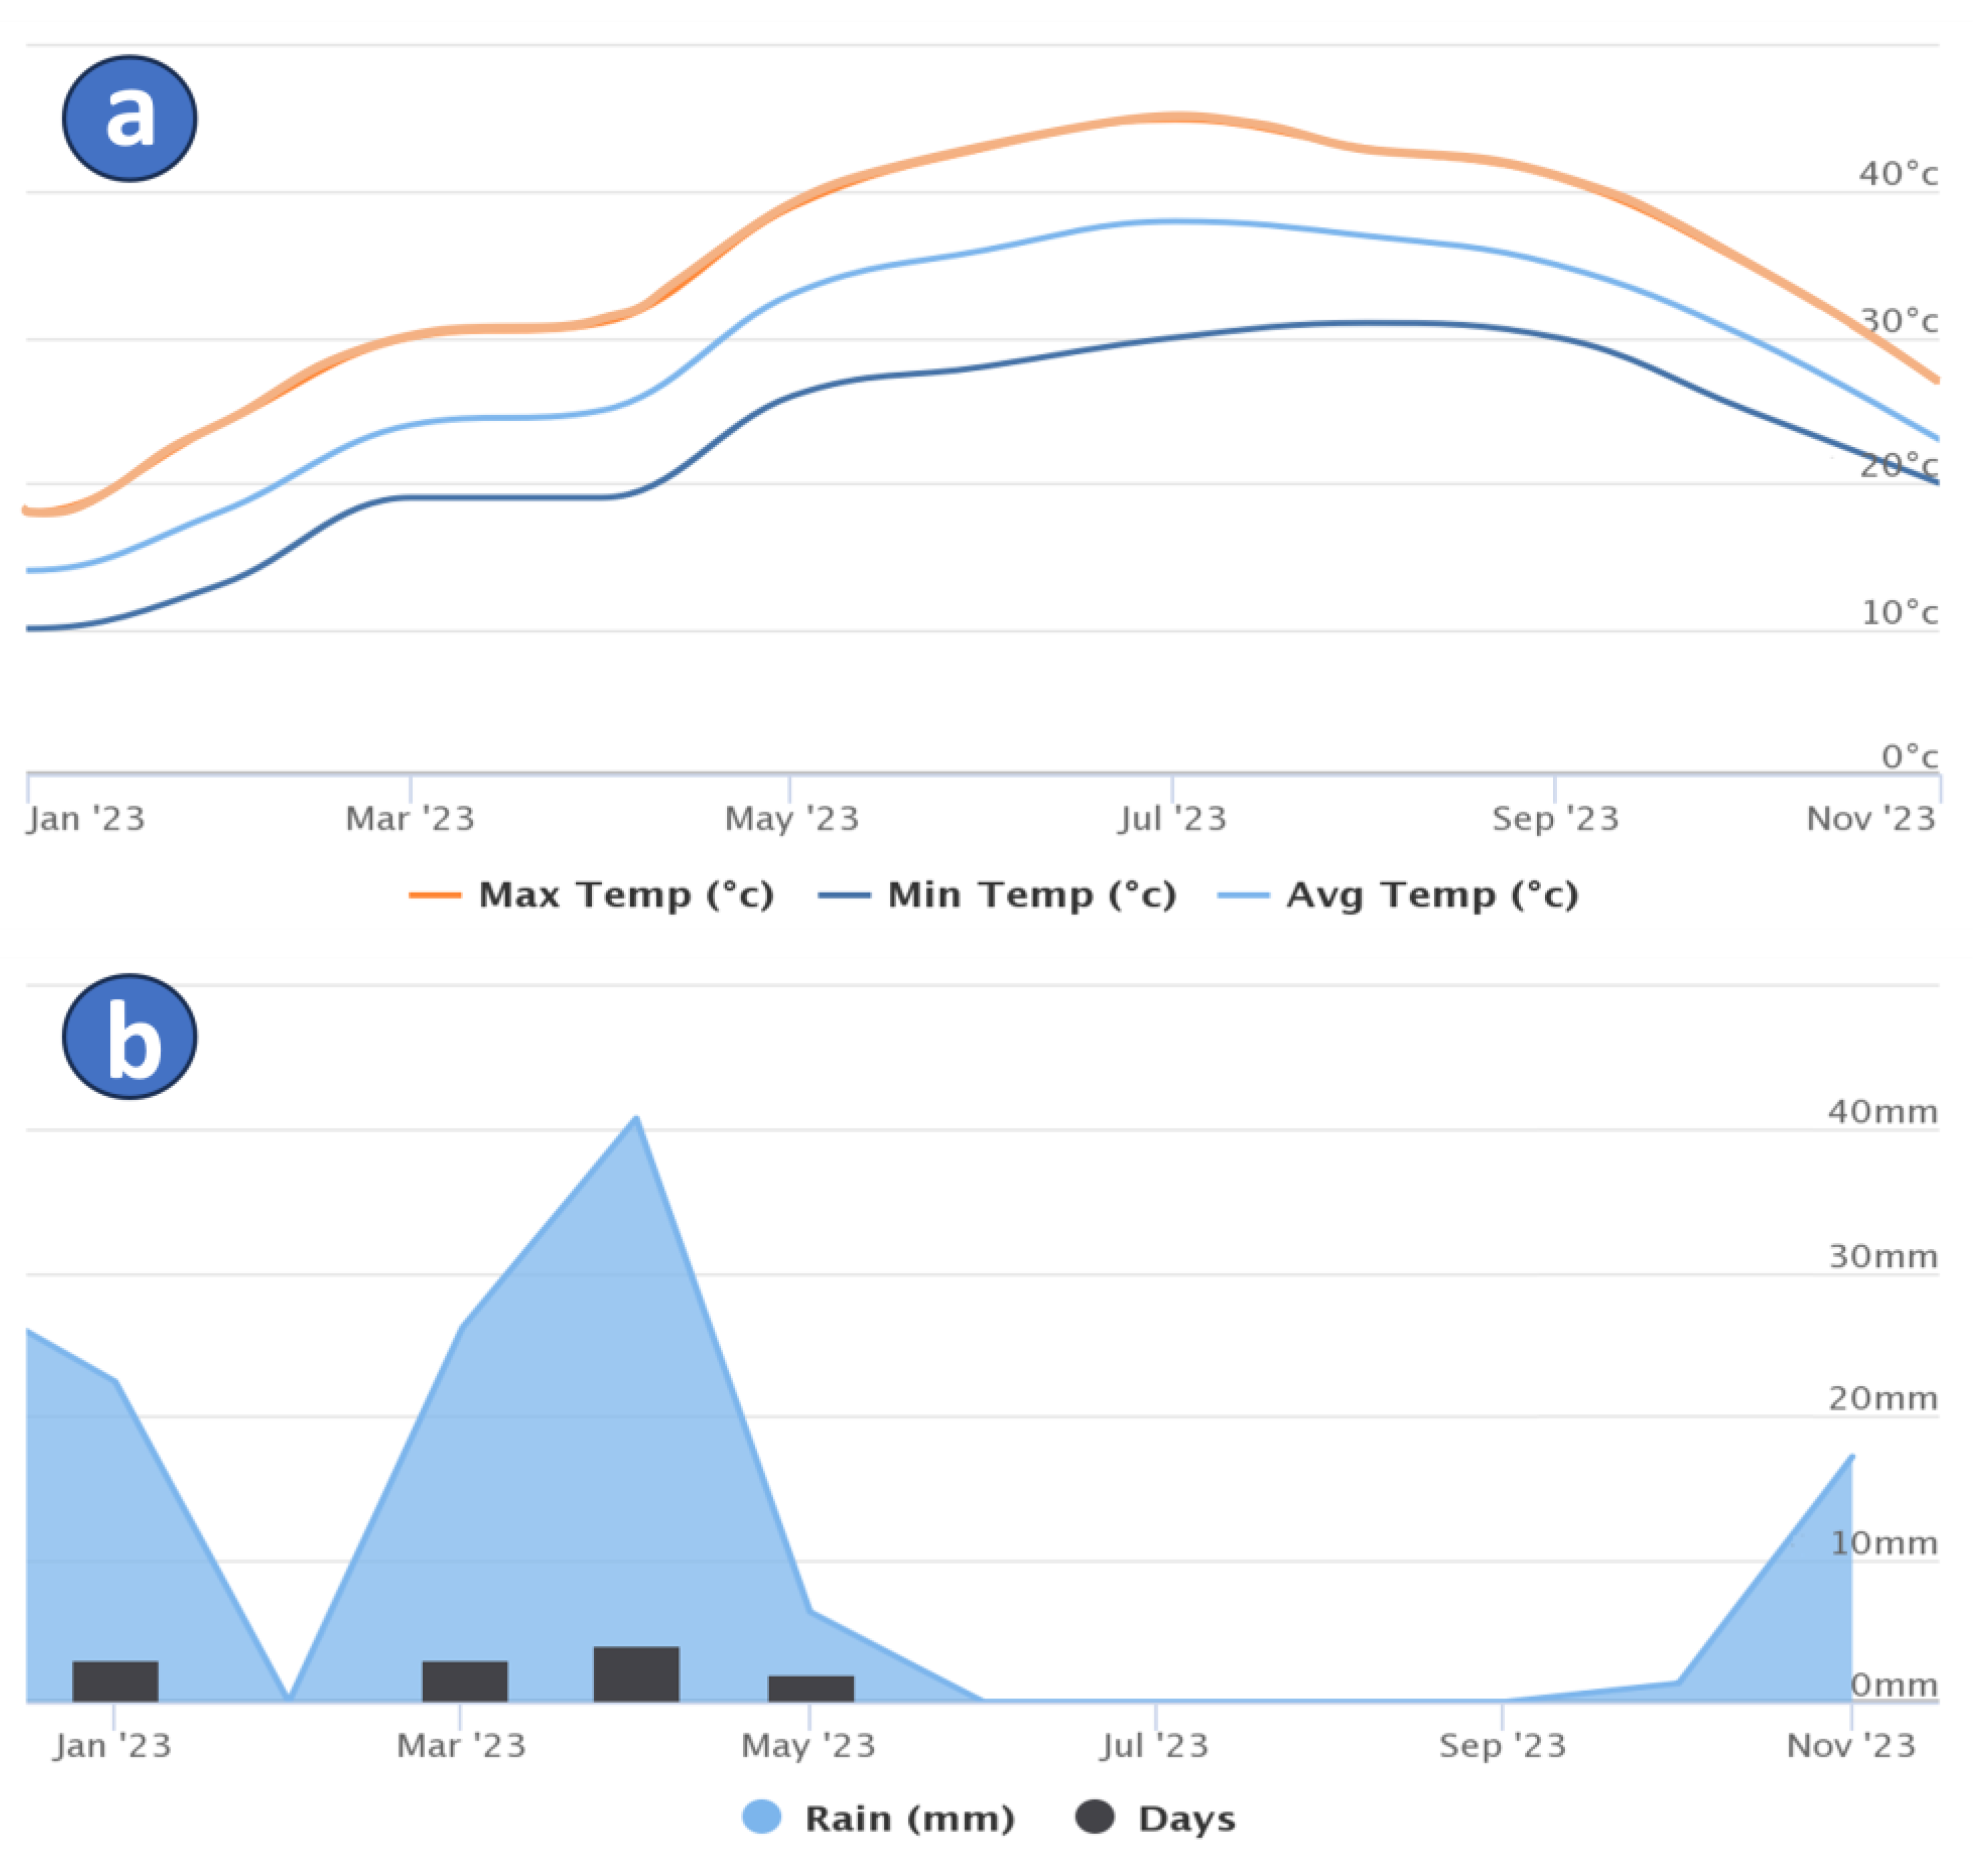
2. The Study Area
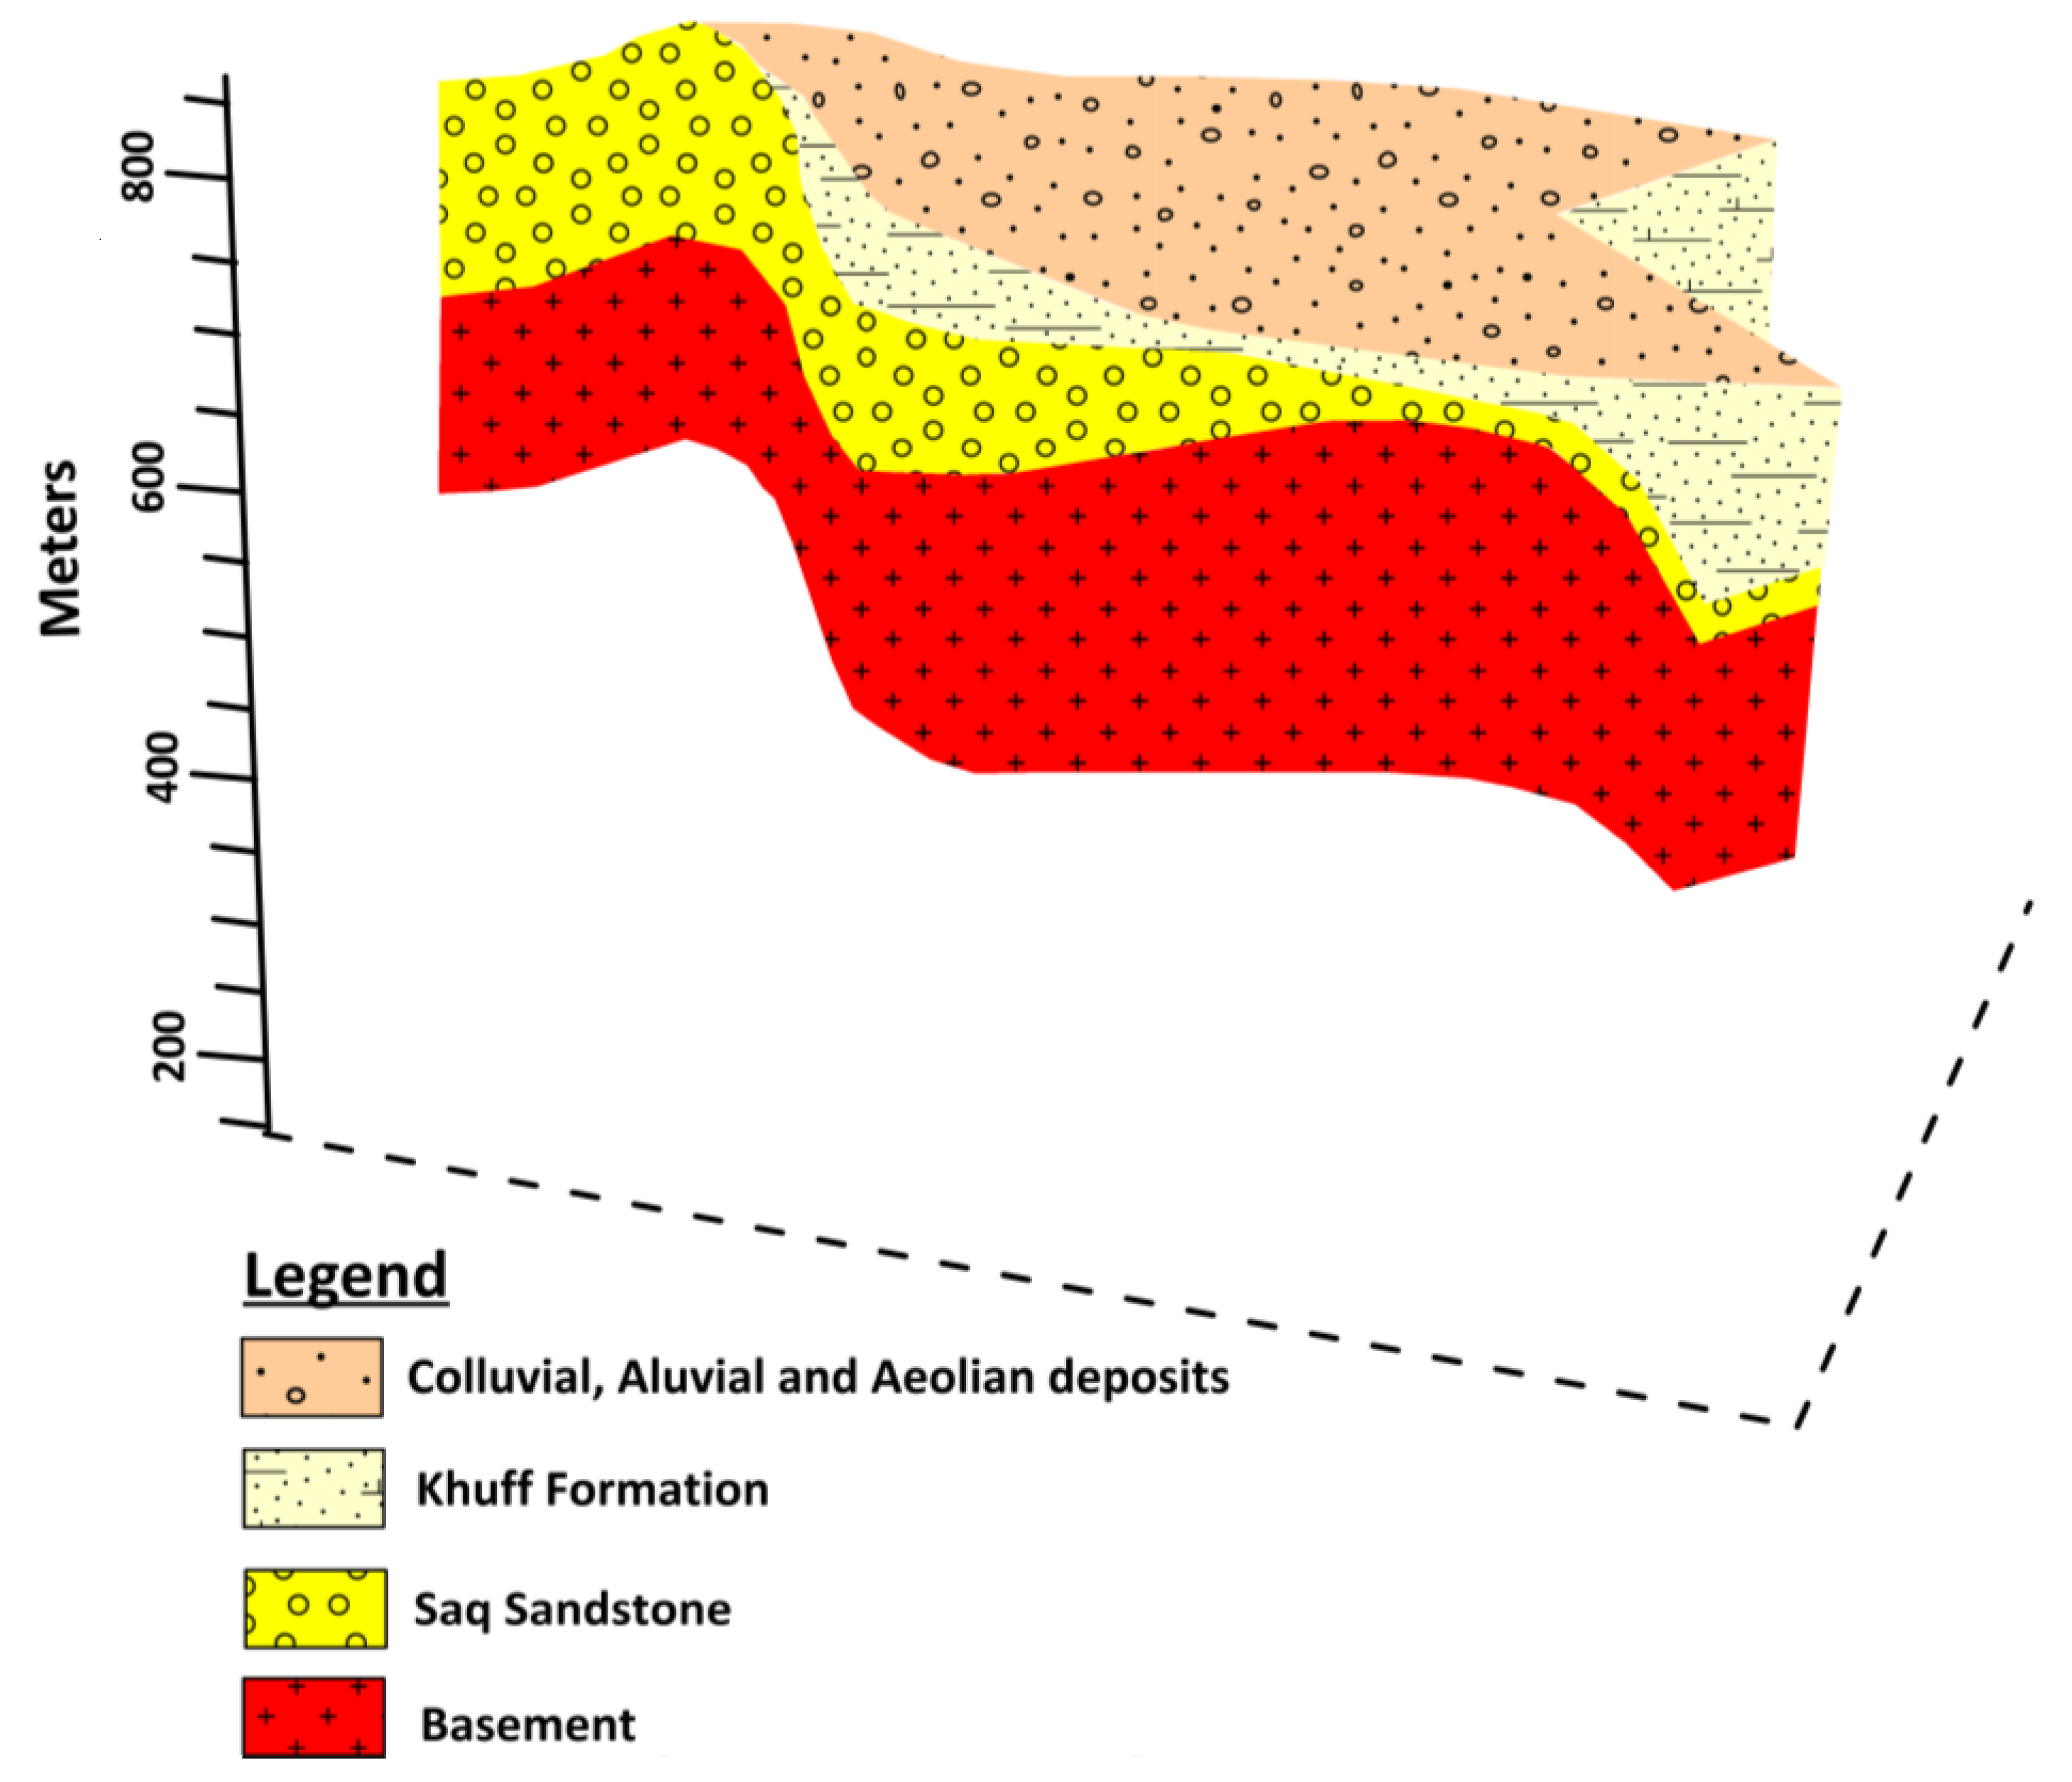
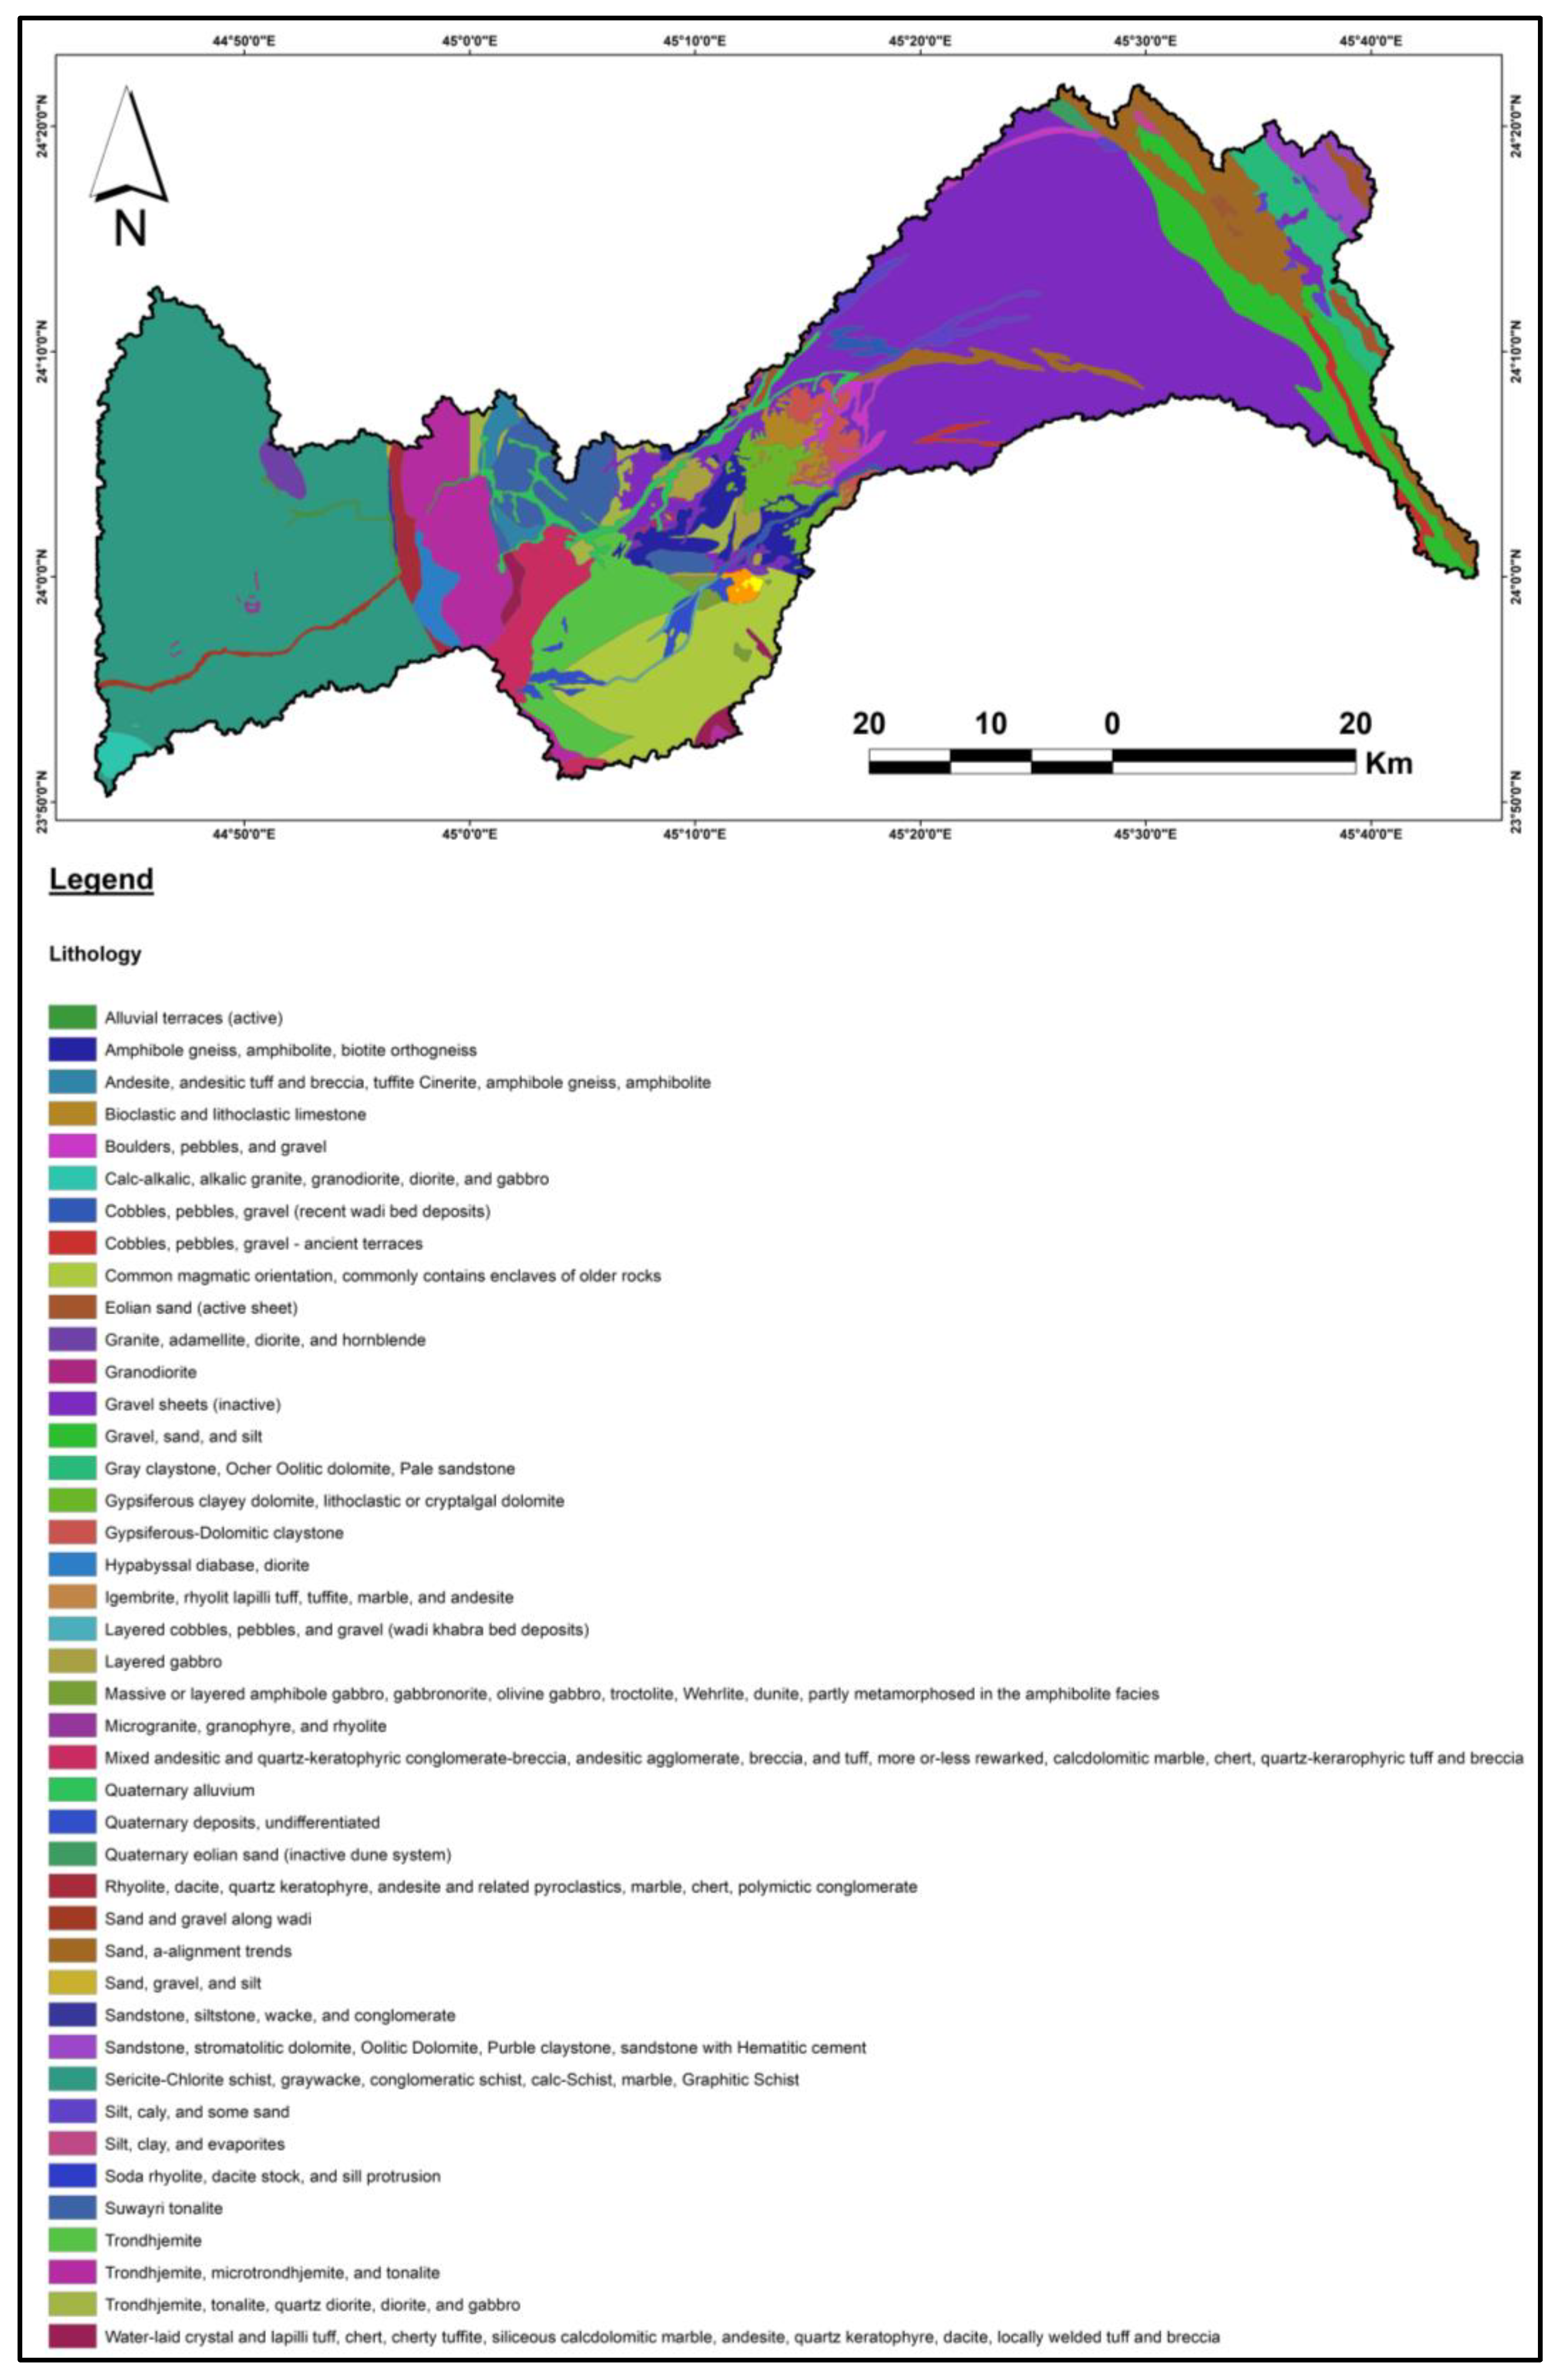
Geological and Hydrogeological Setting
- Rocks that are colluvial, alluvial, aeolian, and superficial. In the western section, quaternary sediments comprise an unconfined aquifer, while in the eastern region, they constitute a confined aquifer.
- The Ash Shiqqah of the Permian Khuff Formation, which is made of shale and large conglomerates. There are fossilized marl, dolomite, sandstone, and gypsum in the upper part. A less significant discontinuous aquifer is the Khuff Formation.
- Saq Sandstone, which is Cambrian to Ordovician in age. It depicts a regional aquifer system. The Saq Sandstone is above and frequently dipping east.
- The Precambrian basement’s Arabian shield complex.
3. Materials and Methods
4. Results and Discussion
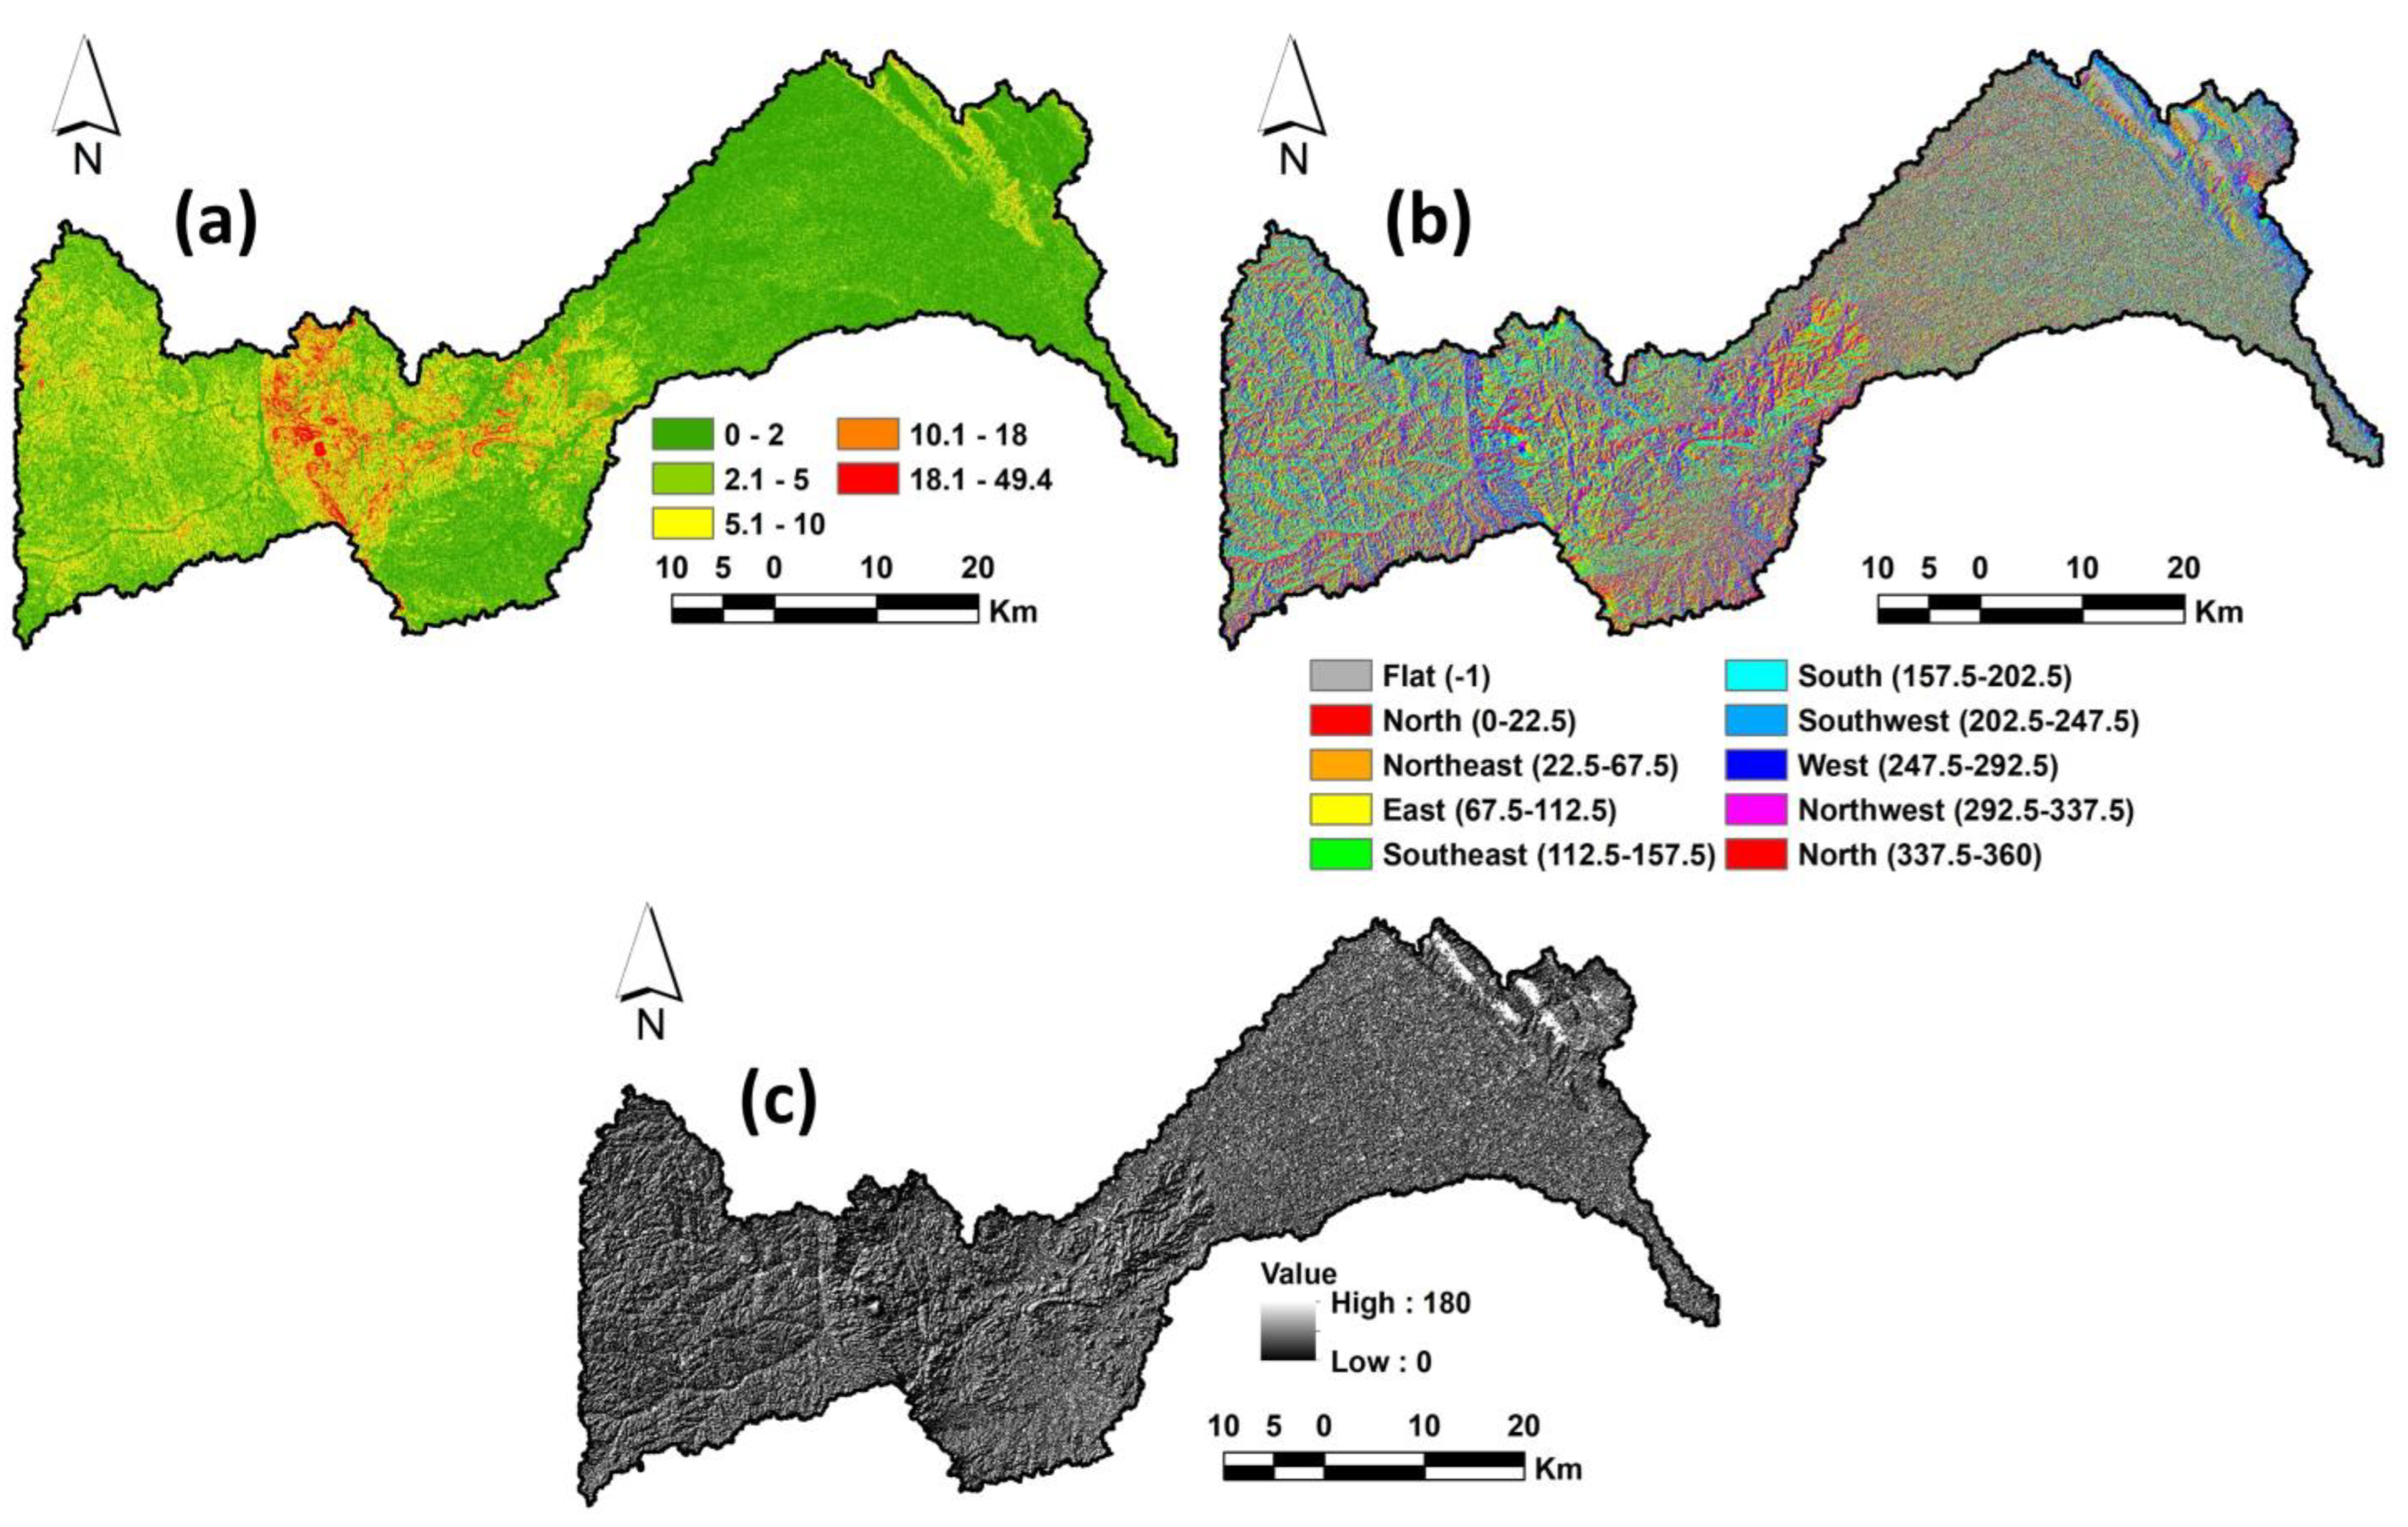
4.1. Topographical Parameters
4.1.1. Slope
4.1.2. Aspect
4.1.3. Hillshade
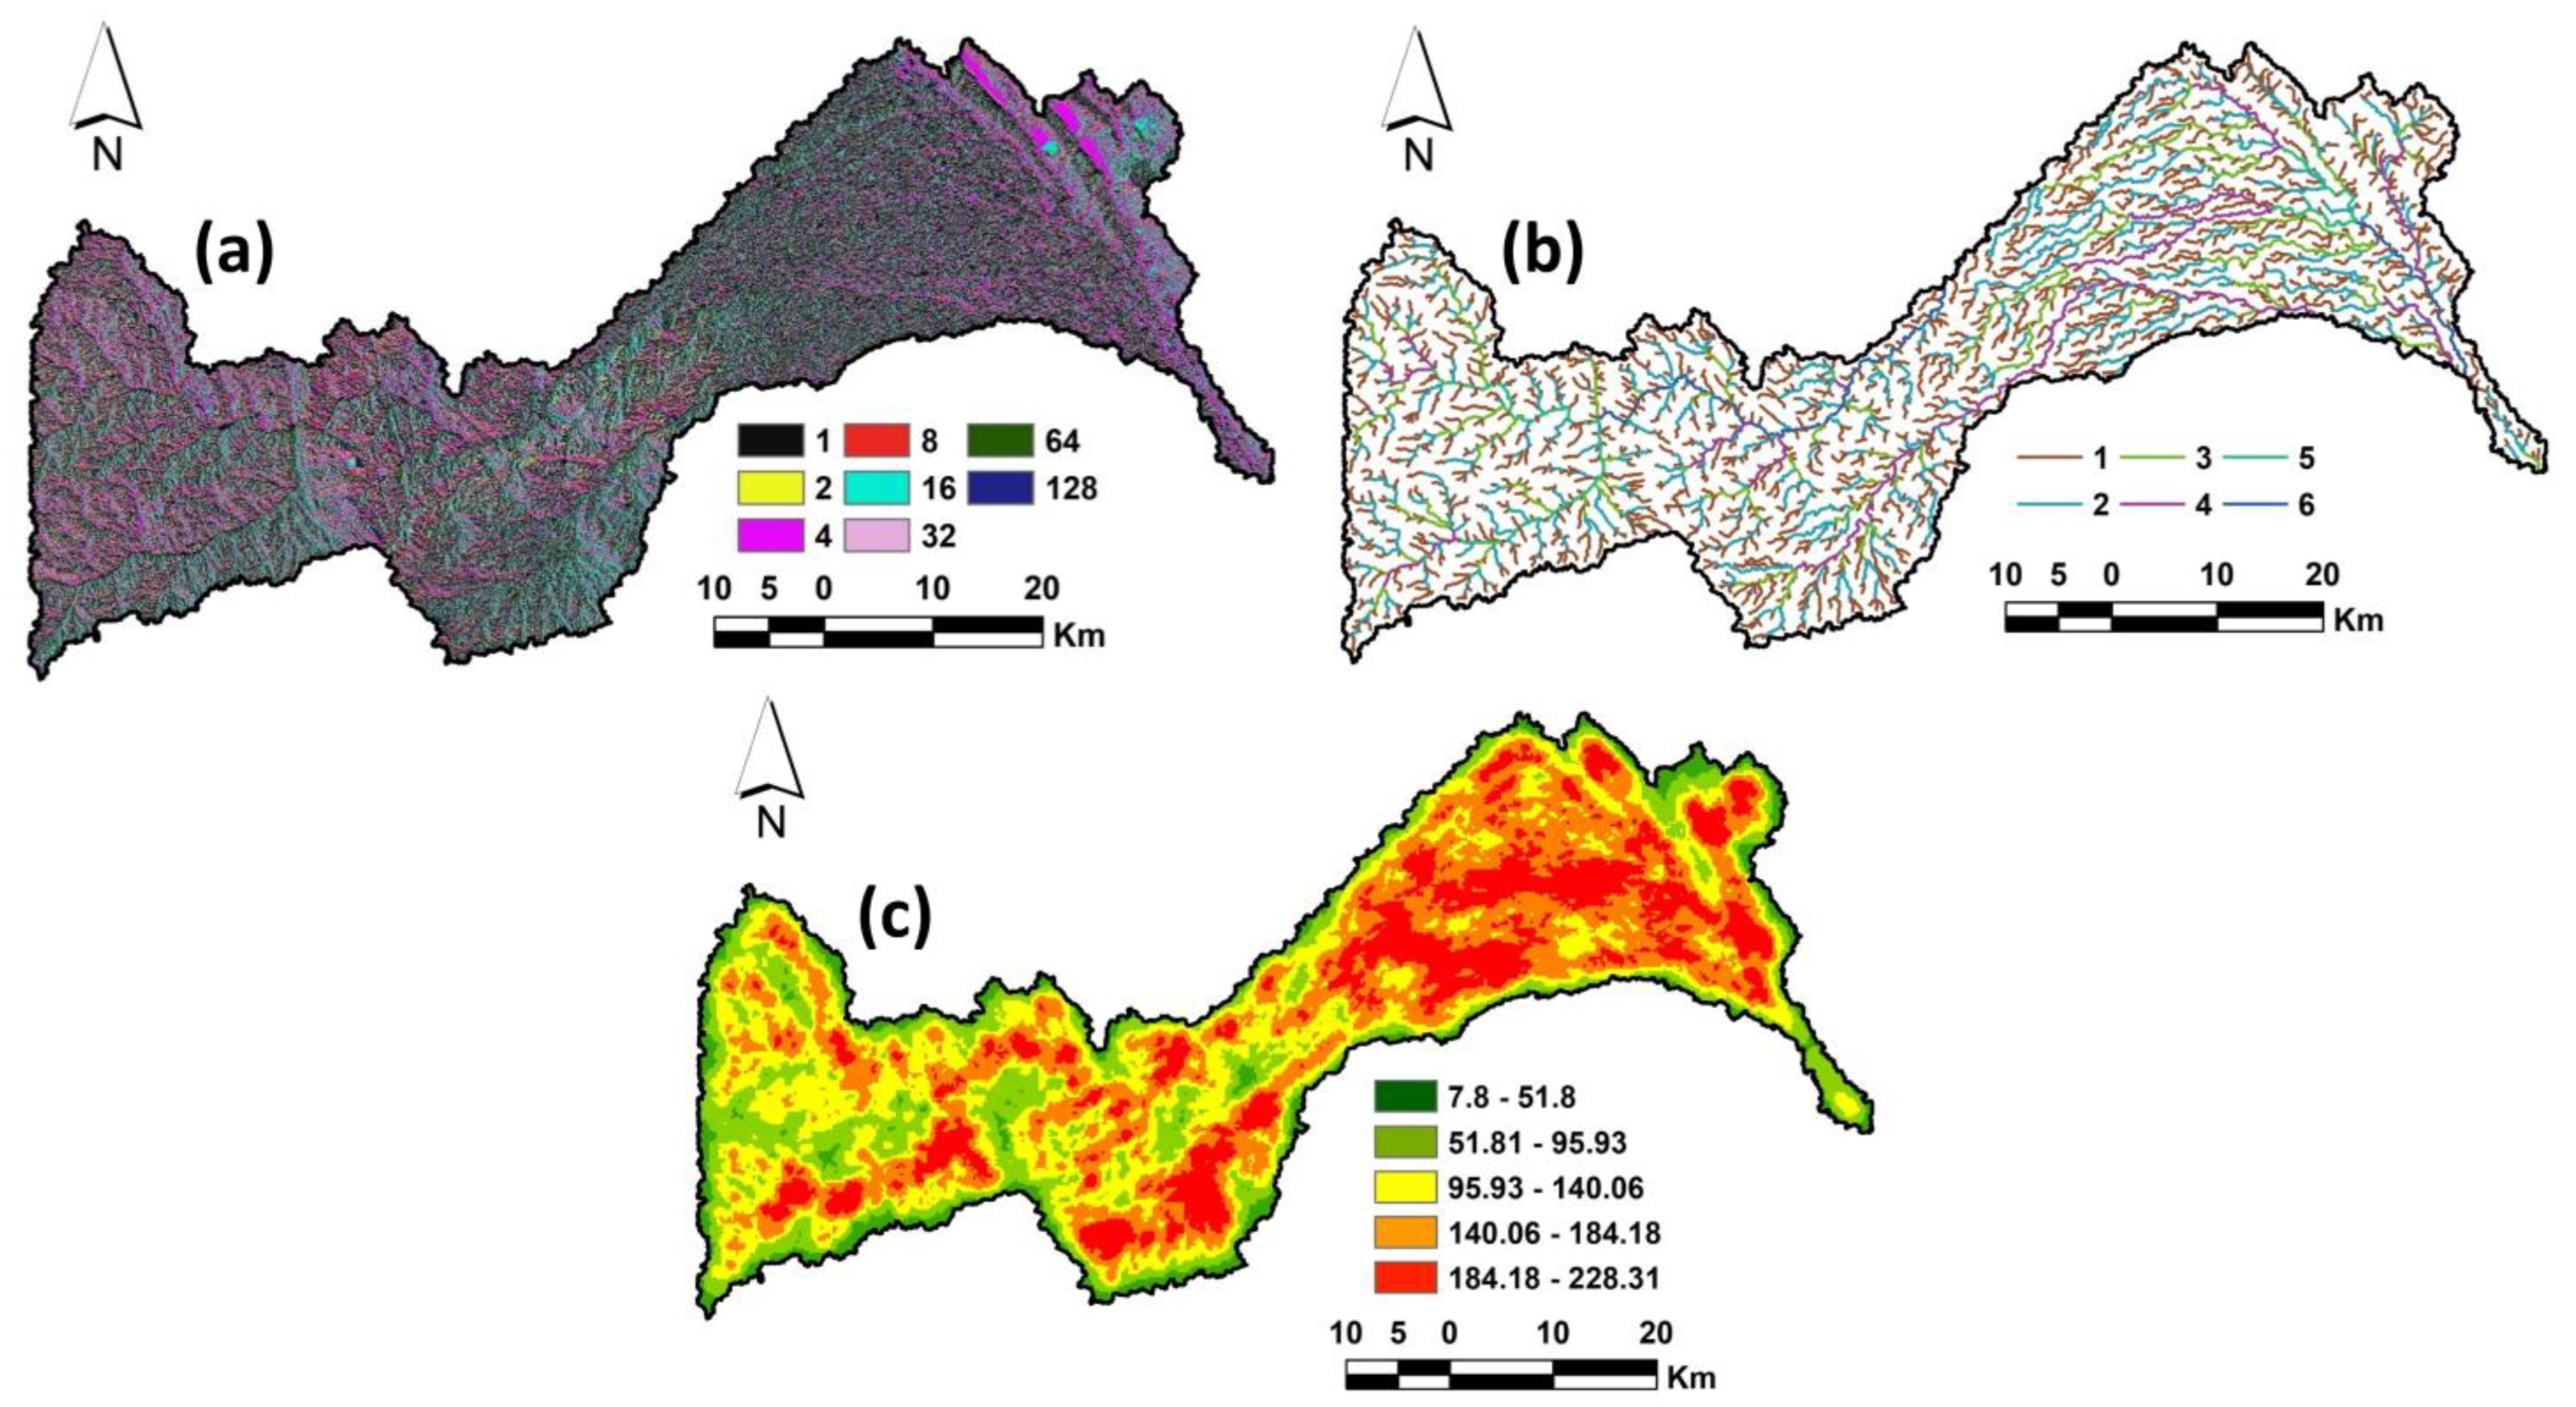
4.2. Hydrological Parameters
4.2.1. Flow Direction
4.2.2. Drainage Density
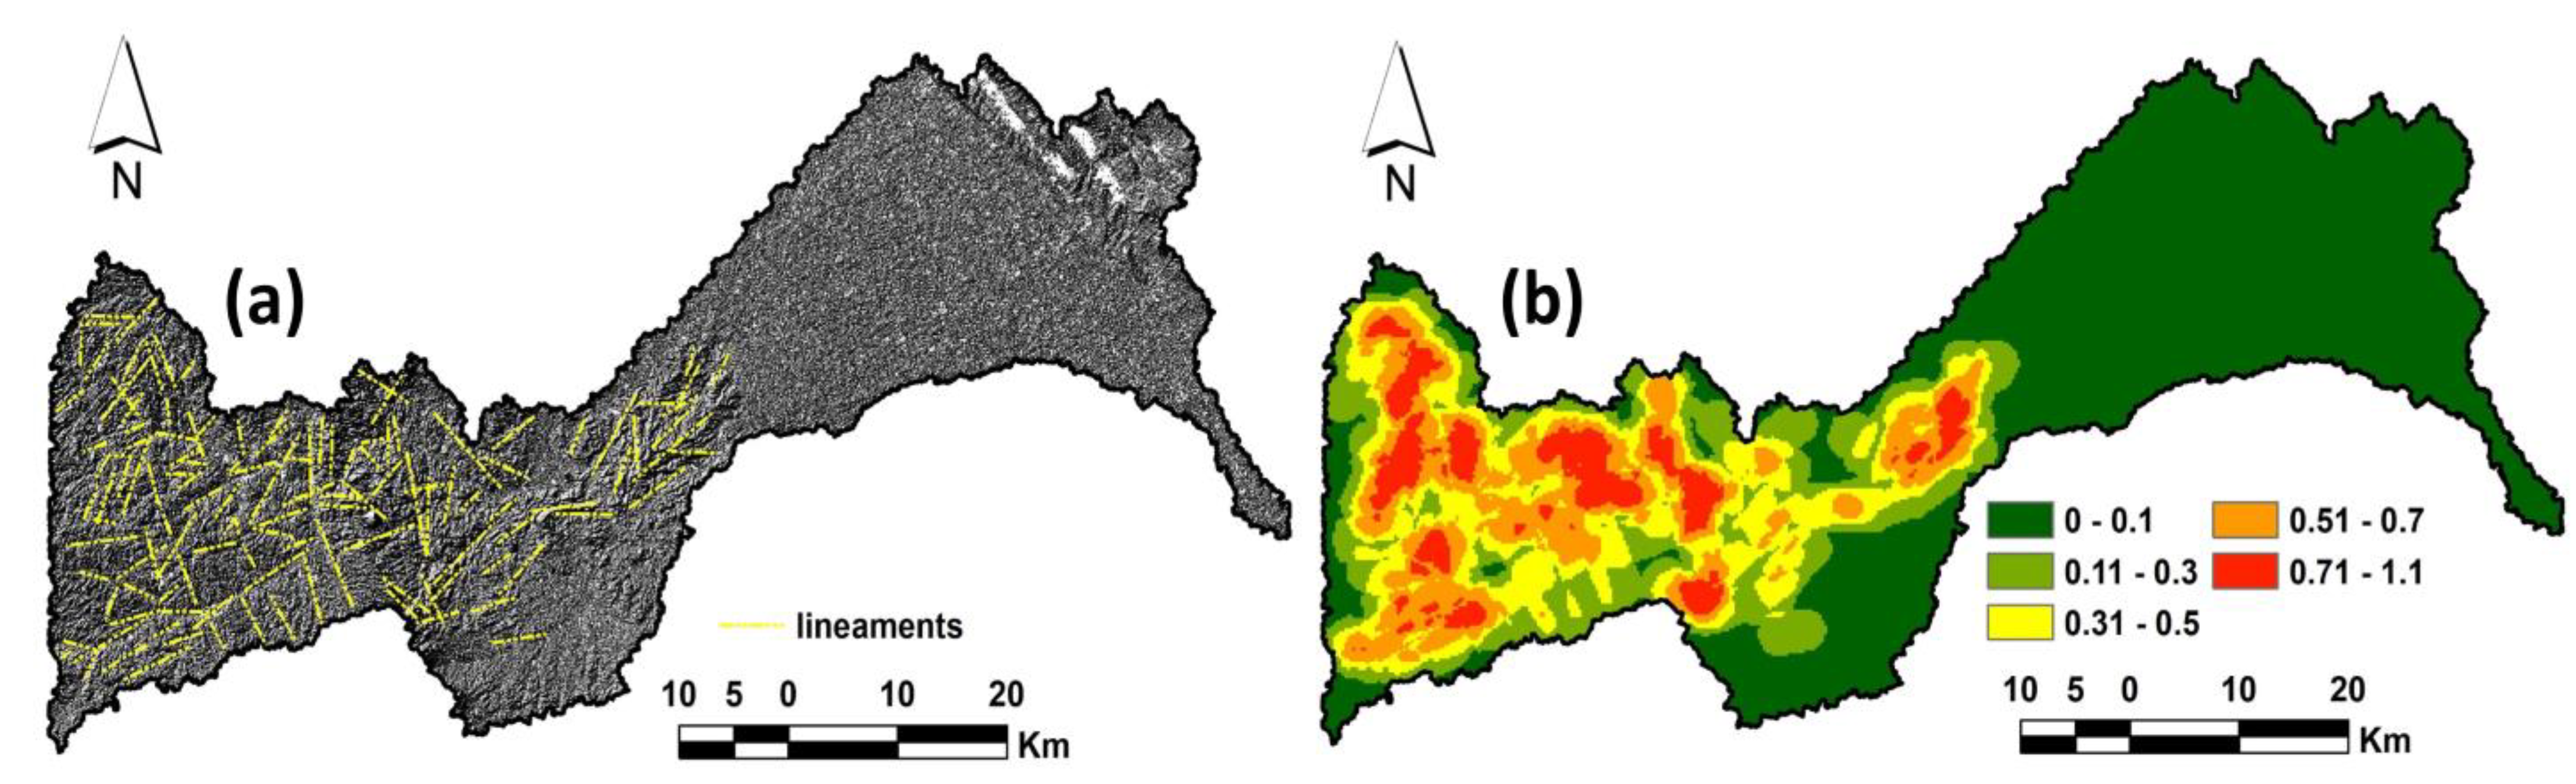
4.2.3. Lineament
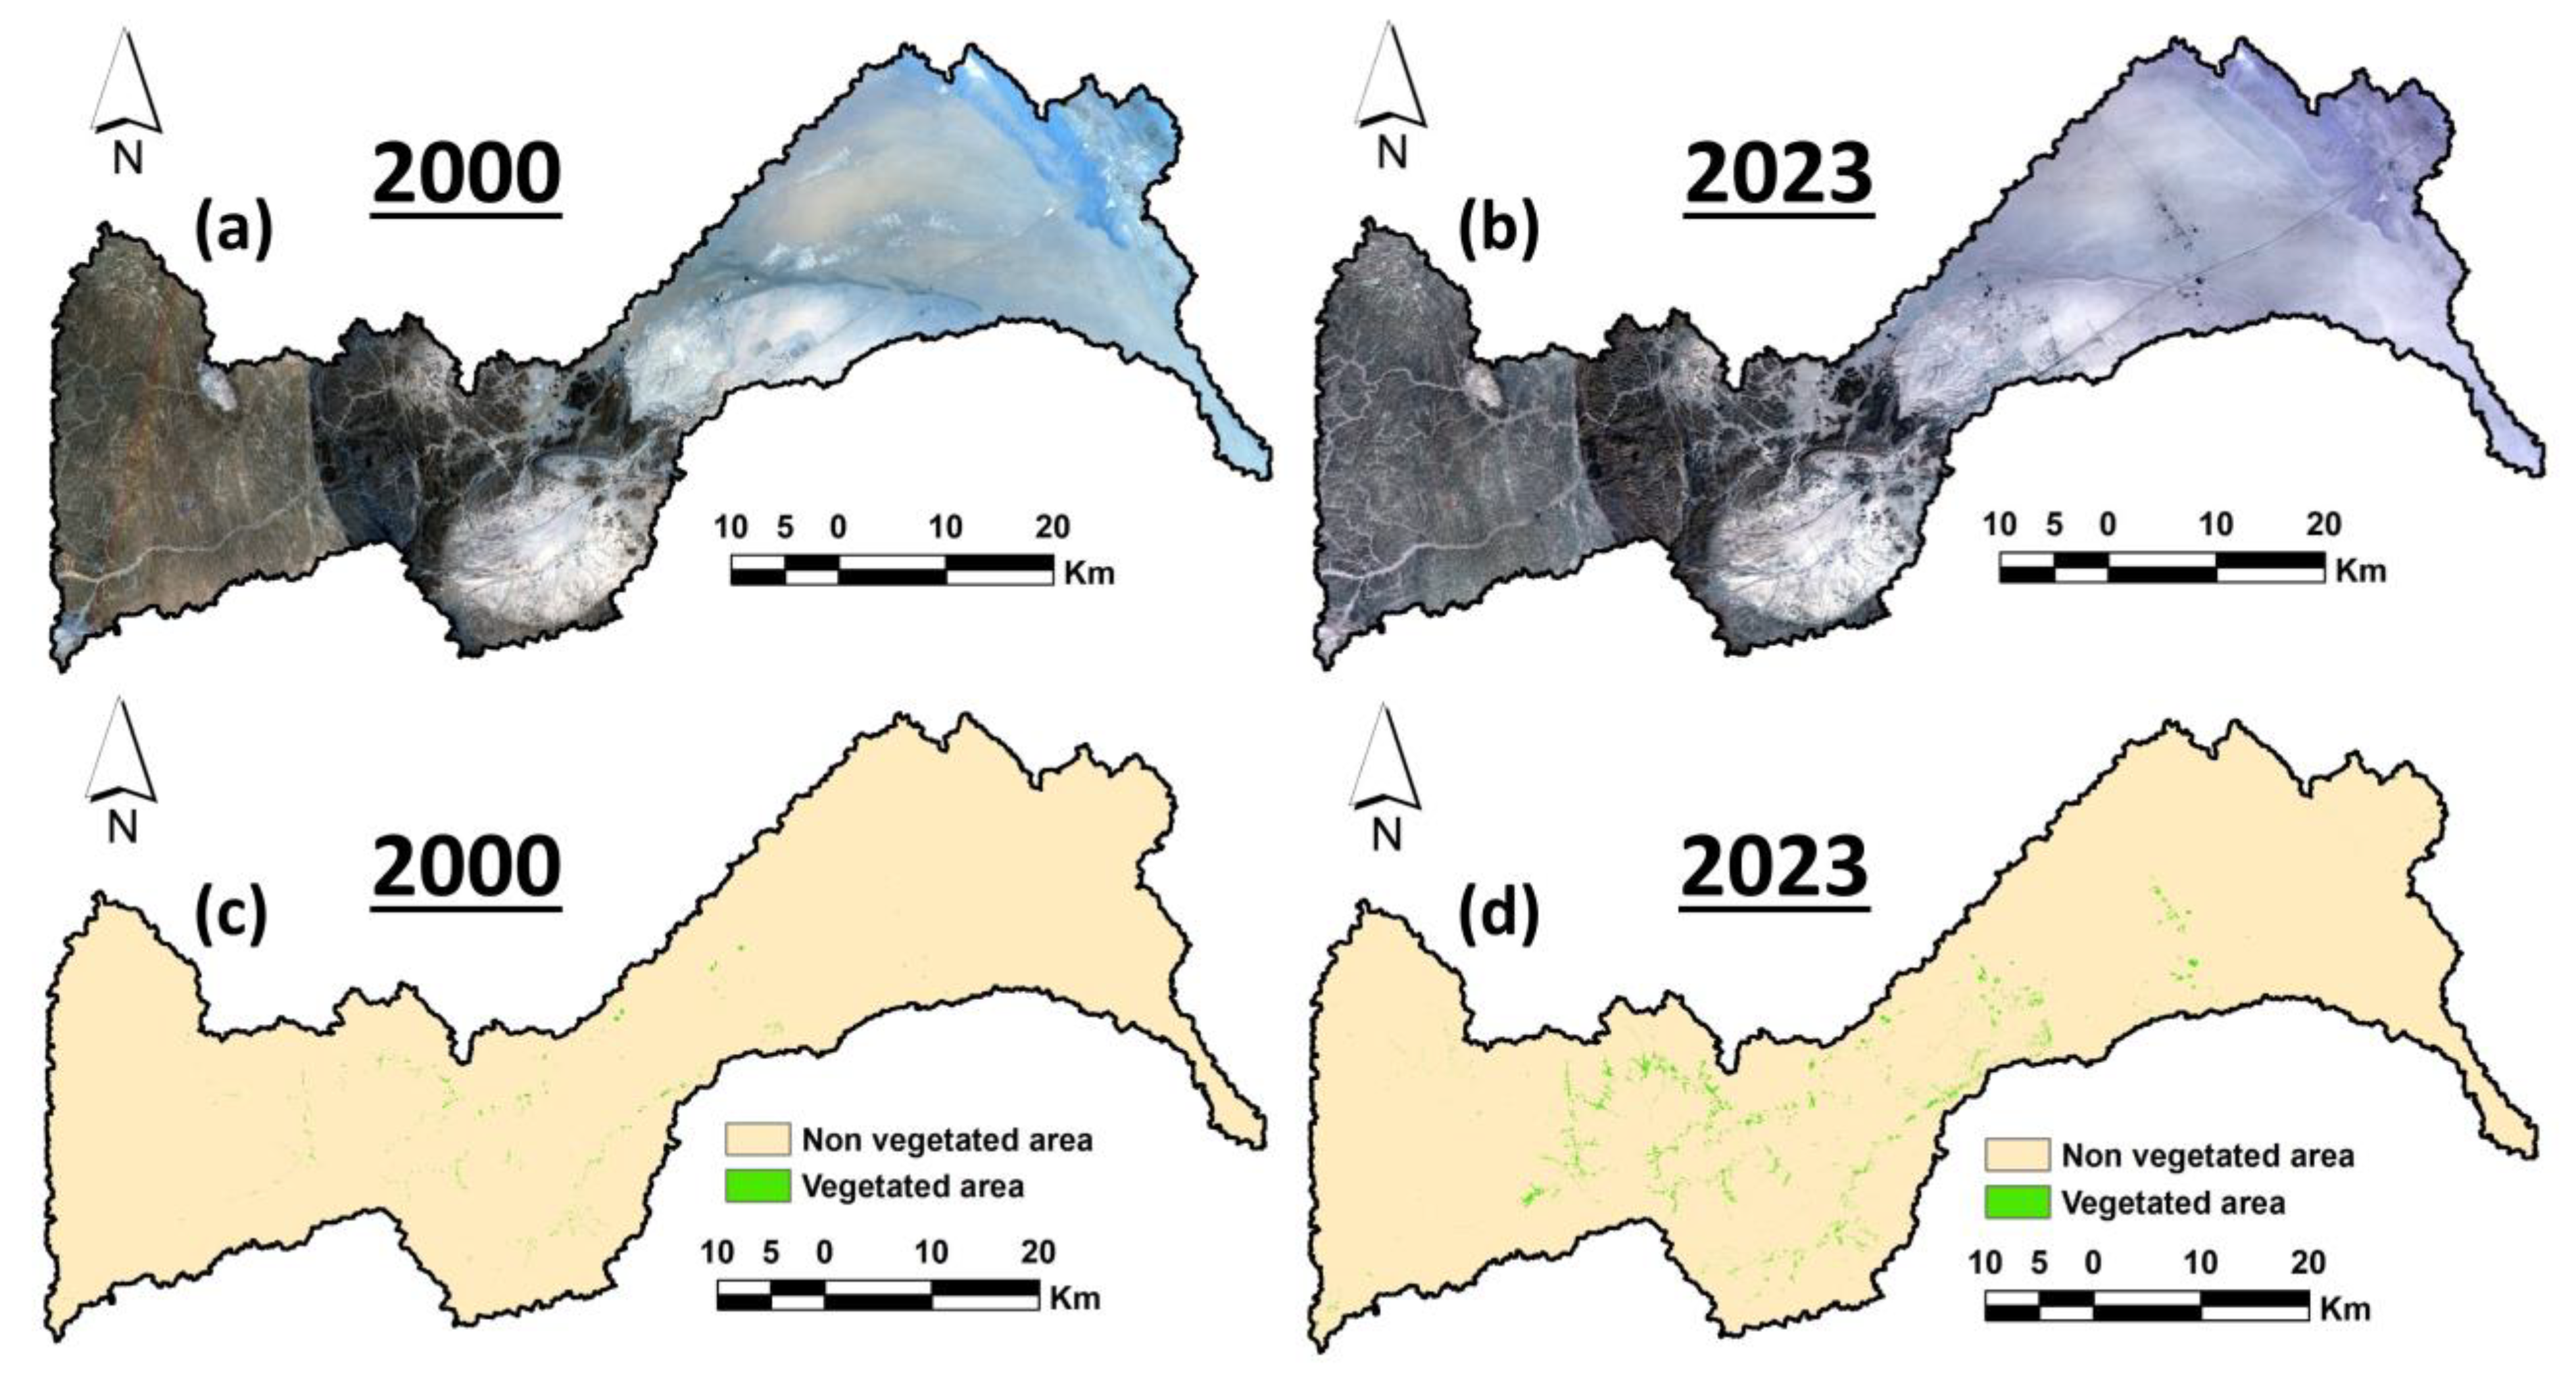
4.3. NDVI
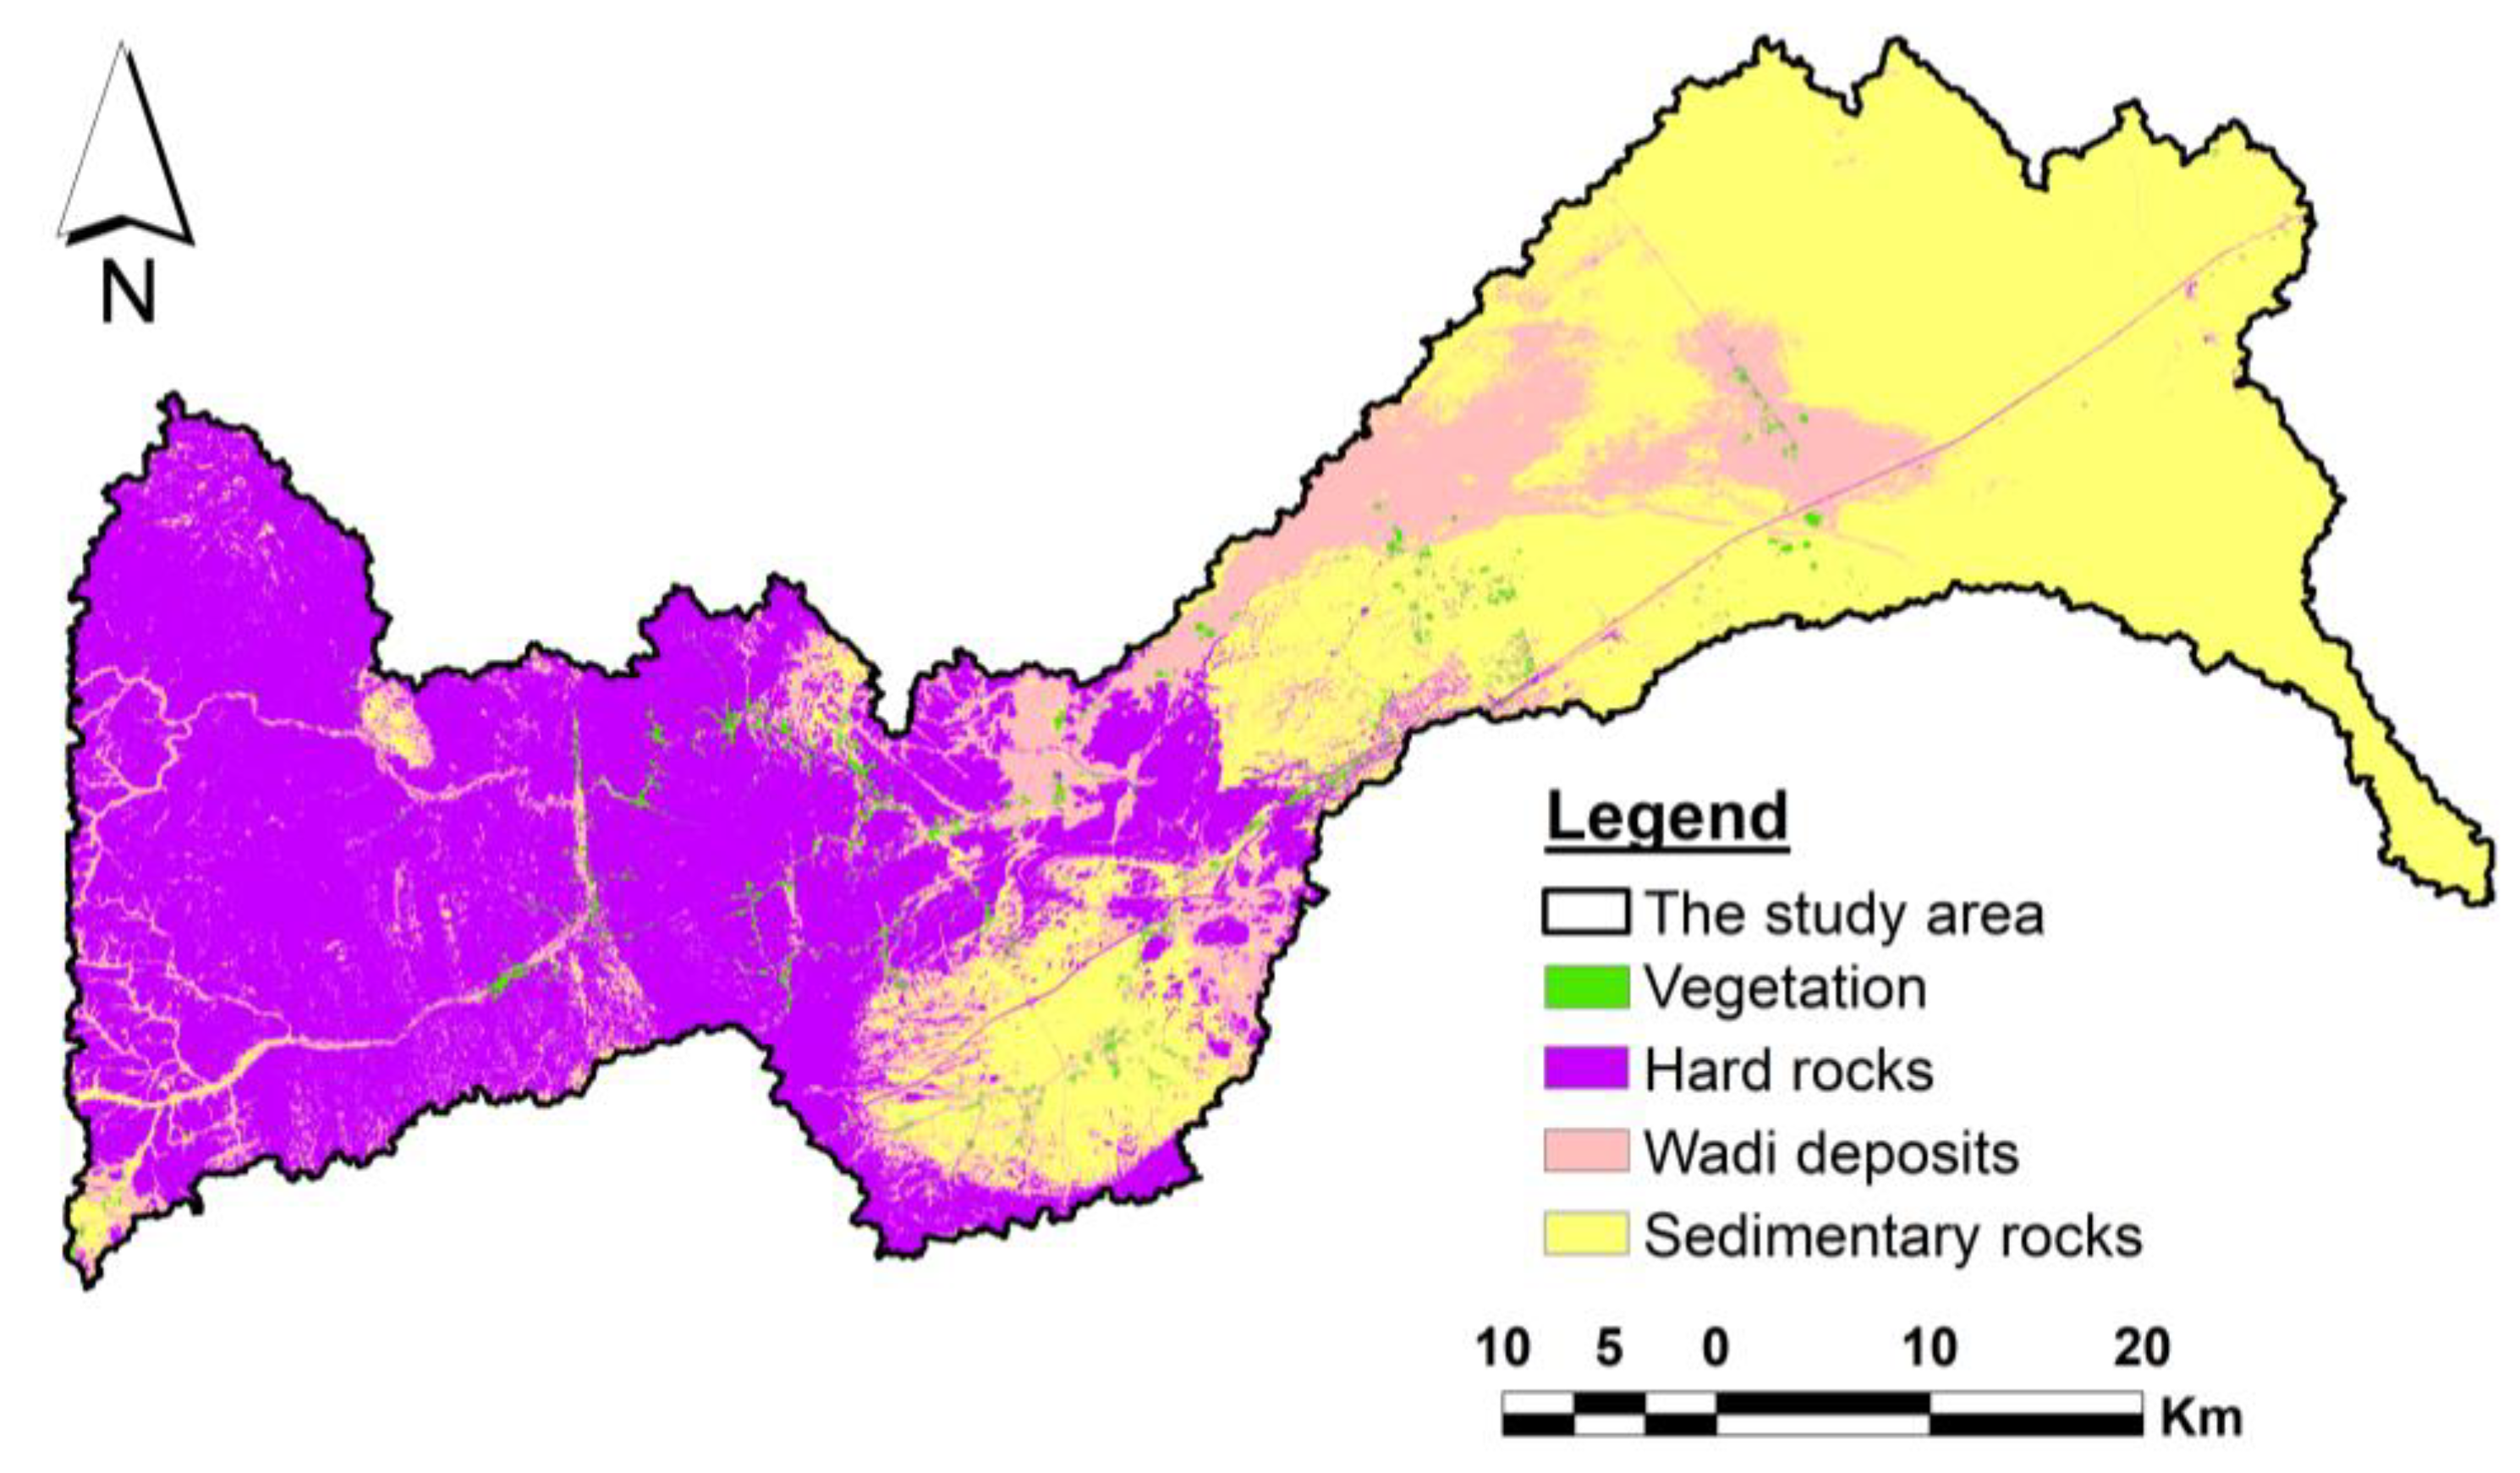
4.4. LULC
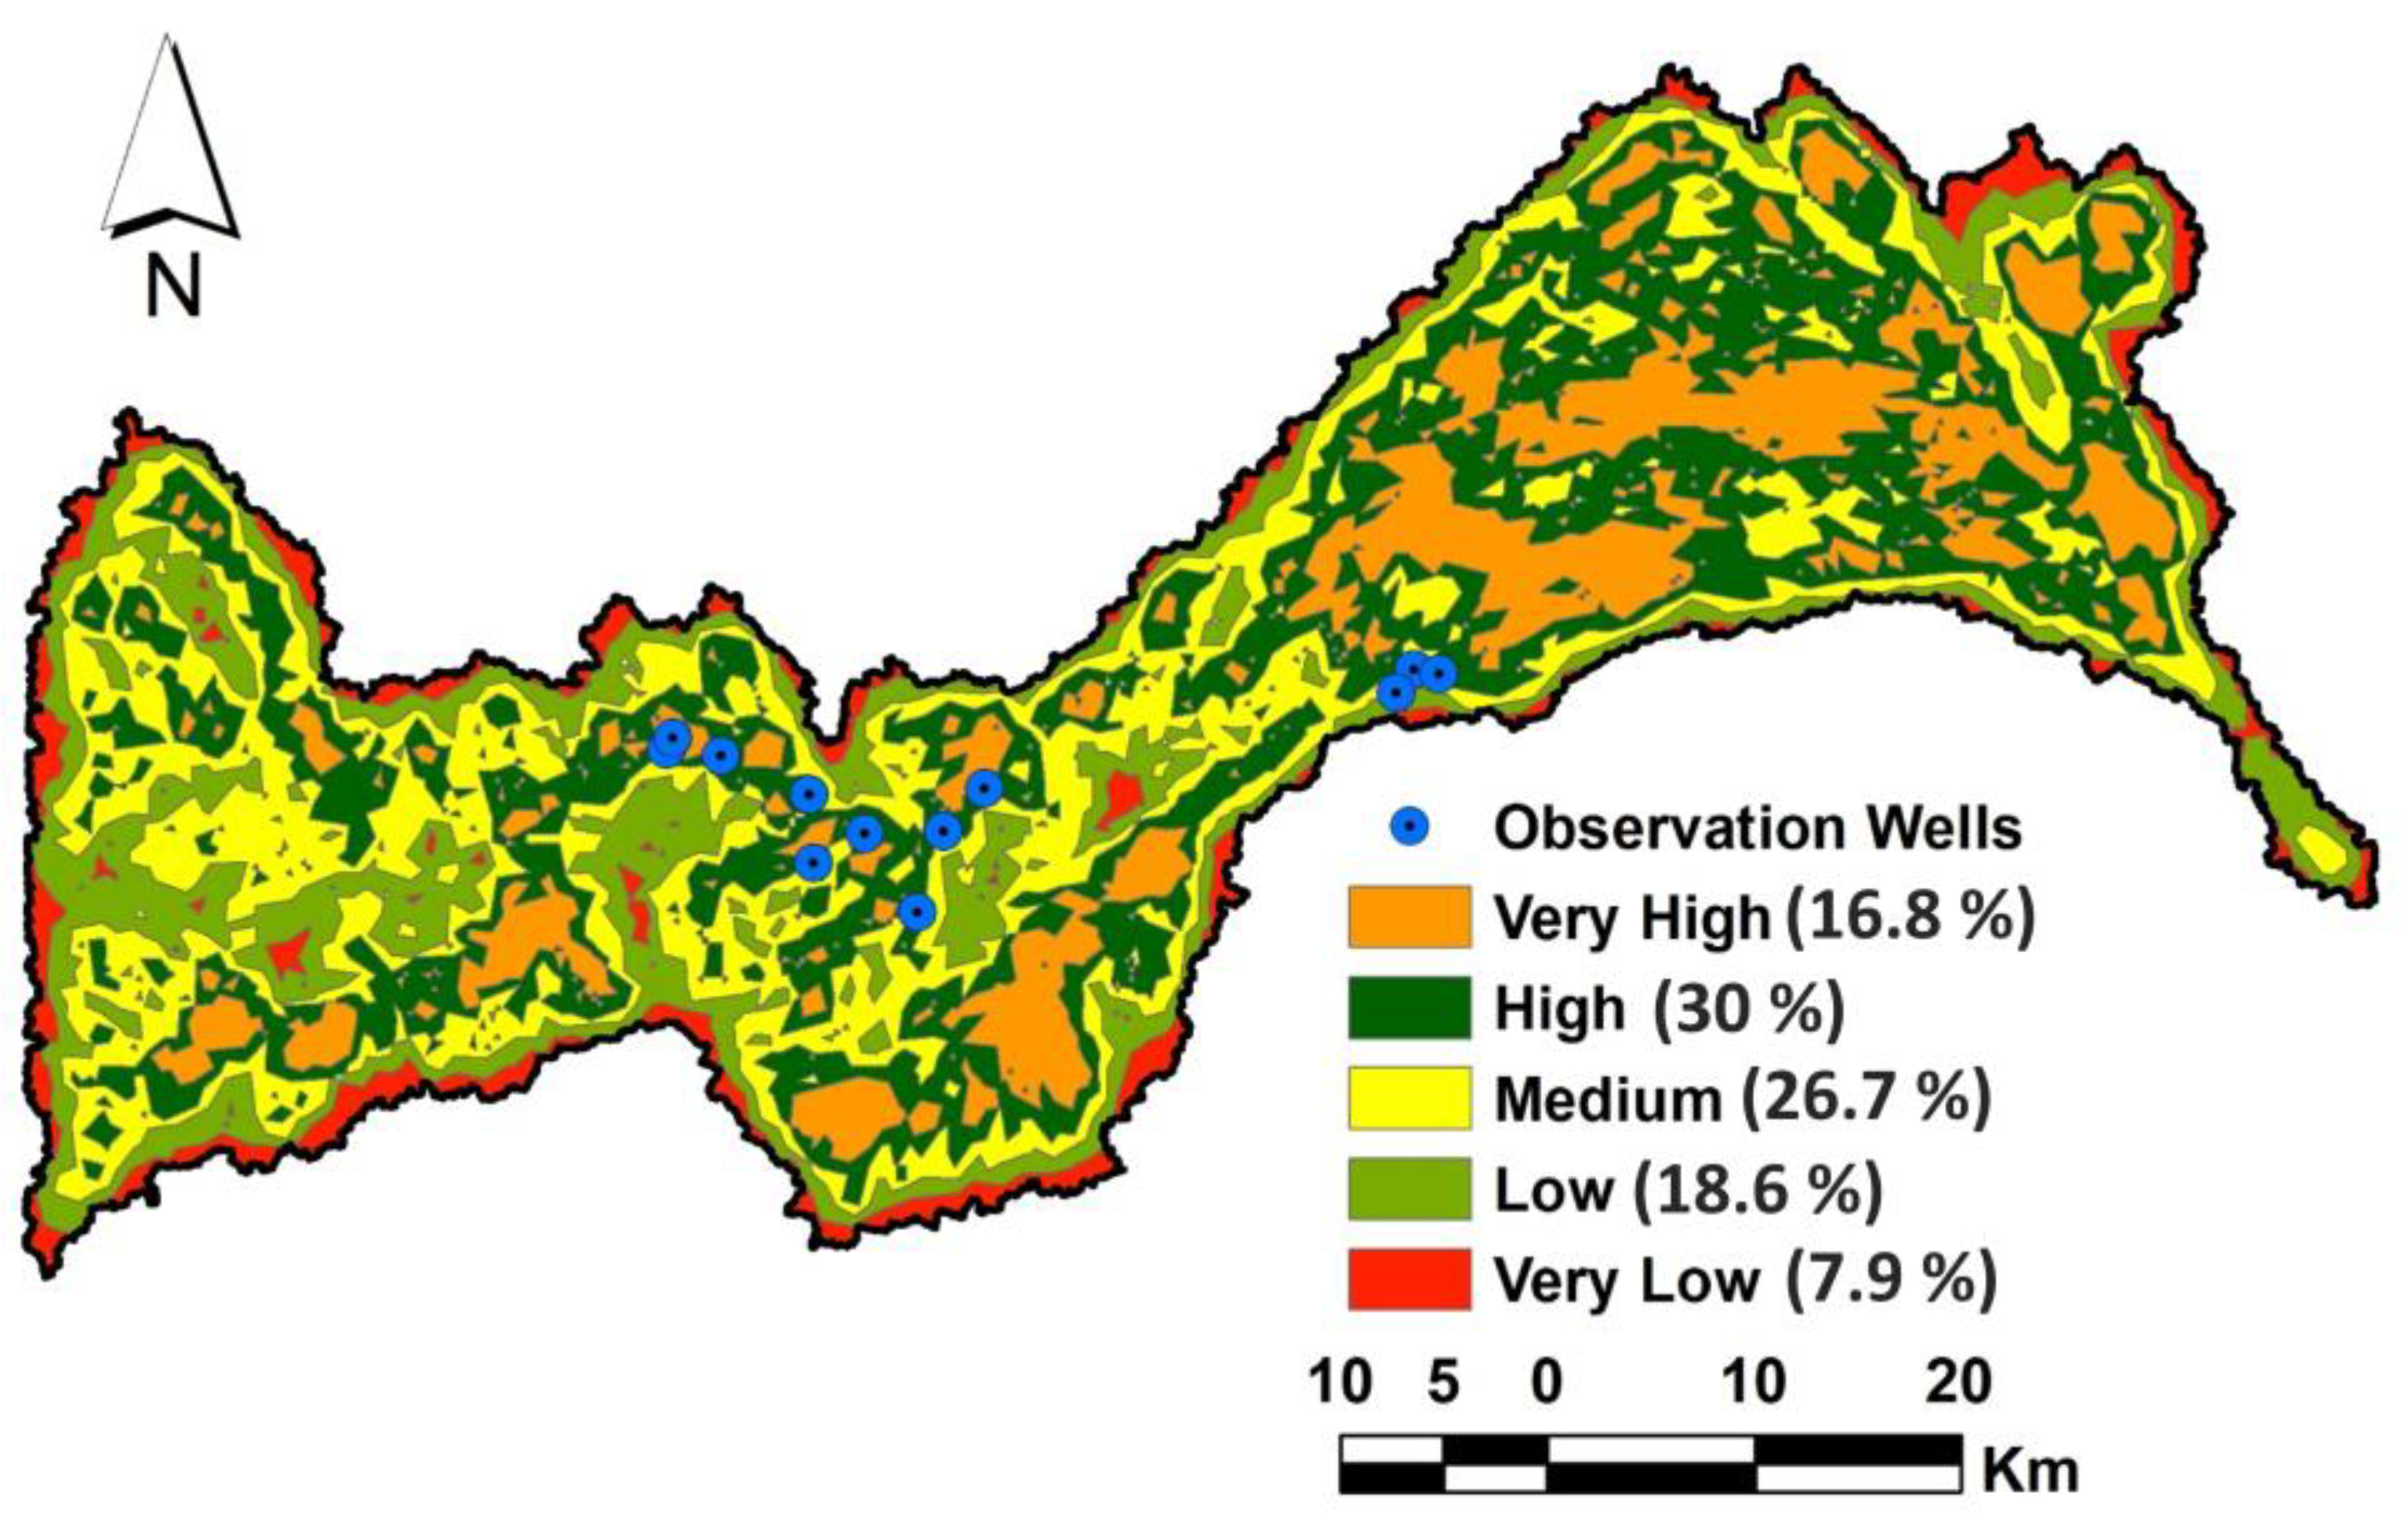
4.5. Groundwater Potential Zones
4.6. Field Validation
5. Conclusions
Author Contributions
Funding
Data Availability Statement
Acknowledgments
Conflicts of Interest
References
- Faramarzi, M.; Abbaspour, K.C.; Vaghefi, S.A.; Farzaneh, M.R.; Zehnder, A.J.B.; Srinivasan, R.; Yang, H. Modeling Impacts of Climate Change on Freshwater Availability in Africa. J. Hydrol. 2013, 480, 85–101. [Google Scholar] [CrossRef]
- Abdelfattah, M.; Abdel-Aziz Abu-Bakr, H.; Aretouyap, Z.; Sheta, M.H.; Hassan, T.M.; Geriesh, M.H.; Shaheen, S.E.-D.; Alogayell, H.M.; M EL-Bana, E.M.; Gaber, A. Mapping the Impacts of the Anthropogenic Activities and Seawater Intrusion on the Shallow Coastal Aquifer of Port Said, Egypt. Front. Earth Sci. 2023, 11, 1204742. [Google Scholar] [CrossRef]
- Shemsanga, C.; Muzuka, A.N.N.; Martz, L.; Komakech, H.; Mcharo, E. Indigenous Knowledge on Development and Management of Shallow Dug Wells of Dodoma Municipality in Tanzania. Appl. Water Sci. 2018, 8, 59. [Google Scholar] [CrossRef]
- Gamal, G.; Hassan, T.M.; Gaber, A.; Abdelfattah, M. Groundwater Quality Assessment along the West of New Damietta Coastal City of Egypt Using an Integrated Geophysical and Hydrochemical Approaches. Environ. Earth Sci. 2023, 82, 107. [Google Scholar] [CrossRef]
- Elbeih, S.F. An Overview of Integrated Remote Sensing and GIS for Groundwater Mapping in Egypt. Ain Shams Eng. J. 2015, 6, 1–15. [Google Scholar]
- Kemper, K.E. Groundwater—From Development to Management. Hydrogeol. J. 2004, 12, 3–5. [Google Scholar] [CrossRef]
- Xiao, R.; He, X.; Zhang, Y.; Ferreira, V.G.; Chang, L. Monitoring Groundwater Variations from Satellite Gravimetry and Hydrological Models: A Comparison with in-Situ Measurements in the Mid-Atlantic Region of the United States. Remote Sens. 2015, 7, 686–703. [Google Scholar] [CrossRef]
- Molden, D. Water Responses to Urbanization. Paddy Water Environ. 2007, 5, 207–209. [Google Scholar] [CrossRef]
- Altchenko, Y.; Villholth, K.G. Transboundary Aquifer Mapping and Management in Africa: A Harmonised Approach. Hydrogeol. J. 2013, 21, 1497–1517. [Google Scholar] [CrossRef]
- Owolabi, S.T.; Madi, K.; Kalumba, A.M.; Alemaw, B.F. Assessment of Recession Flow Variability and the Surficial Lithology Impact: A Case Study of Buffalo River Catchment, Eastern Cape, South Africa. Environ. Earth Sci. 2020, 79, 187. [Google Scholar] [CrossRef]
- Barlow, P.M.; Leake, S.A. Streamflow Depletion by Wells: Understanding and Managing the Effects of Groundwater Pumping on Streamflow; US Geological Survey: Reston, VA, USA, 2012; Volume 1376.
- Barker, J.A. A Generalized Radial Flow Model for Hydraulic Tests in Fractured Rock. Water Resour. Res. 1988, 24, 1796–1804. [Google Scholar]
- Chowdhury, A.; Jha, M.K.; Chowdary, V.M. Delineation of Groundwater Recharge Zones and Identification of Artificial Recharge Sites in West Medinipur District, West Bengal, Using RS, GIS and MCDM Techniques. Environ. Earth Sci. 2010, 59, 1209–1222. [Google Scholar] [CrossRef]
- Meshram, K.S.; Tripathi, M.P.; Mukharjee, A.P. Effect of Artificial Recharge Structures on Ground Water Availability in Semi-Critical Area in Chhattisgarh. Ph.D. Thesis, Indira Gandhi KrishiVishwavidyalaya, Raipur, India, 2010. [Google Scholar]
- Samson, S.; Elangovan, K. Delineation of Groundwater Recharge Potential Zones in Namakkal District, Tamilnadu, India Using Remote Sensing and GIS. J. Indian Soc. Remote Sens. 2015, 43, 769–778. [Google Scholar] [CrossRef]
- Taheri, A.; Zare, M. Groundwater Artificial Recharge Assessment in Kangavar Basin, a Semi-Arid Region in the Western Part of Iran. Afr. J. Agric. Res. 2011, 6, 4370–4384. [Google Scholar]
- Murthy, K.S.R. Ground Water Potential in a Semi-Arid Region of Andhra Pradesh-a Geographical Information System Approach. Int. J. Remote Sens. 2000, 21, 1867–1884. [Google Scholar] [CrossRef]
- Srinivasa Rao, Y.; Reddy, T.; Nayudu, P. Groundwater Targeting in a Hard-Rock Terrain Using Fracture-Pattern Modeling, Niva River Basin, Andhra Pradesh, India. Hydrogeol. J. 2000, 8, 494–502. [Google Scholar]
- Jaiswal, R.K.; Mukherjee, S.; Krishnamurthy, J.; Saxena, R. Role of Remote Sensing and GIS Techniques for Generation of Groundwater Prospect Zones towards Rural Development—An Approach. Int. J. Remote Sens. 2003, 24, 993–1008. [Google Scholar] [CrossRef]
- Srivastava, P.K.; Bhattacharya, A.K. Groundwater Assessment through an Integrated Approach Using Remote Sensing, GIS and Resistivity Techniques: A Case Study from a Hard Rock Terrain. Int. J. Remote Sens. 2006, 27, 4599–4620. [Google Scholar] [CrossRef]
- Dinesh Kumar, P.K.; Gopinath, G.; Seralathan, P. Application of Remote Sensing and GIS for the Demarcation of Groundwater Potential Zones of a River Basin in Kerala, Southwest Coast of India. Int. J. Remote Sens. 2007, 28, 5583–5601. [Google Scholar] [CrossRef]
- Mondal, N.C.; Das, S.N.; Singh, V.S. Integrated Approach for Identification of Potential Groundwater Zones in Seethanagaram Mandal of Vizianagaram District, Andhra Pradesh, India. J. Earth Syst. Sci. 2008, 117, 133–144. [Google Scholar] [CrossRef]
- Chowdhury, A.; Jha, M.K.; Chowdary, V.M.; Mal, B.C. Integrated Remote Sensing and GIS-based Approach for Assessing Groundwater Potential in West Medinipur District, West Bengal, India. Int. J. Remote Sens. 2009, 30, 231–250. [Google Scholar] [CrossRef]
- Dhakate, R.; Chowdhary, D.K.; Gurunadha Rao, V.V.S.; Tiwary, R.K.; Sinha, A. Geophysical and Geomorphological Approach for Locating Groundwater Potential Zones in Sukinda Chromite Mining Area. Environ. Earth Sci. 2012, 66, 2311–2325. [Google Scholar] [CrossRef]
- Nag, S.K.; Ghosh, P. Delineation of Groundwater Potential Zone in Chhatna Block, Bankura District, West Bengal, India Using Remote Sensing and GIS Techniques. Environ. Earth Sci. 2013, 70, 2115–2127. [Google Scholar] [CrossRef]
- Balakrishna; Balaji Shrikant Maury, S.; Narshimulu, G. Ground Water Potential in Fractured Aquifers of Ophiolite Formations, Port Blair, South Andaman Islands Using Electrical Resistivity Tomography (ERT) and Vertical Electrical Sounding (VES). J. Geol. Soc. India 2014, 83, 393–402. [Google Scholar]
- Sonkamble, S.; Satishkumar, V.; Amarender, B.; Sethurama, S. Combined Ground-Penetrating Radar (GPR) and Electrical Resistivity Applications Exploring Groundwater Potential Zones in Granitic Terrain. Arab. J. Geosci. 2014, 7, 3109–3117. [Google Scholar] [CrossRef]
- Al-Abadi, A.M. Groundwater Potential Mapping at Northeastern Wasit and Missan Governorates, Iraq Using a Data-Driven Weights of Evidence Technique in Framework of GIS. Environ. Earth Sci. 2015, 74, 1109–1124. [Google Scholar] [CrossRef]
- Mezni, I.; Chihi, H.; Hammami, M.A.; Gabtni, H.; Baba Sy, M. Regionalization of Natural Recharge Zones Using Analytical Hierarchy Process in an Arid Hydrologic Basin: A Contribution for Managed Aquifer Recharge. Nat. Resour. Res. 2022, 31, 867–895. [Google Scholar] [CrossRef]
- Khan, M.Y.A.; ElKashouty, M.; Tian, F. Mapping Groundwater Potential Zones Using Analytical Hierarchical Process and Multicriteria Evaluation in the Central Eastern Desert, Egypt. Water 2022, 14, 1041. [Google Scholar] [CrossRef]
- Khan, M.Y.A.; ElKashouty, M.; Subyani, A.M.; Tian, F.; Gusti, W. GIS and RS Intelligence in Delineating the Groundwater Potential Zones in Arid Regions: A Case Study of Southern Aseer, Southwestern Saudi Arabia. Appl. Water Sci. 2022, 12, 3. [Google Scholar] [CrossRef]
- Pradhan, R.M.; Guru, B.; Pradhan, B.; Biswal, T.K. Integrated Multi-Criteria Analysis for Groundwater Potential Mapping in Precambrian Hard Rock Terranes (North Gujarat), India. Hydrol. Sci. J. 2021, 66, 961–978. [Google Scholar] [CrossRef]
- Diriba, D.; Karuppannan, S.; Takele, T.; Husein, M. Delineation of Groundwater Potential Zonation Using Geoinformatics and AHP Techniques with Remote Sensing Data. Heliyon 2024, 10, e25532. [Google Scholar] [CrossRef] [PubMed]
- Feujio, D.H.A.; Aretouyap, Z.; Tchato, S.C.; Legrand, C.N.I.I.; Djomdi, E.; Madadjeu, N.N.; Nguimgo, C.N.; Kpoumie, A.N. Application of Analytical Hierarchy Process to Assess Groundwater Potential for a Sustainable Management in the Menoua Division. Heliyon 2024, 10, e24310. [Google Scholar] [CrossRef] [PubMed]
- Arulbalaji, P.; Padmalal, D.; Sreelash, K. GIS and AHP Techniques Based Delineation of Groundwater Potential Zones: A Case Study from Southern Western Ghats, India. Sci. Rep. 2019, 9, 2082. [Google Scholar] [CrossRef] [PubMed]
- Ajay Kumar, V.; Mondal, N.C.; Ahmed, S. Identification of Groundwater Potential Zones Using RS, GIS and AHP Techniques: A Case Study in a Part of Deccan Volcanic Province (DVP), Maharashtra, India. J. Indian Soc. Remote Sens. 2020, 48, 497–511. [Google Scholar] [CrossRef]
- Yariyan, P.; Avand, M.; Omidvar, E.; Pham, Q.B.; Linh, N.T.T.; Tiefenbacher, J.P. Optimization of Statistical and Machine Learning Hybrid Models for Groundwater Potential Mapping. Geocarto Int. 2022, 37, 3877–3911. [Google Scholar] [CrossRef]
- Sun, T.; Cheng, W.; Abdelkareem, M.; Al-Arifi, N. Mapping Prospective Areas of Water Resources and Monitoring Land Use/Land Cover Changes in an Arid Region Using Remote Sensing and GIS Techniques. Water 2022, 14, 2435. [Google Scholar] [CrossRef]
- Abdelkareem, M.; El-Baz, F.; Askalany, M.; Akawy, A.; Ghoneim, E. Groundwater Prospect Map of Egypt’s Qena Valley Using Data Fusion. Int. J. Image Data Fusion 2012, 3, 169–189. [Google Scholar] [CrossRef]
- Melese, T.; Belay, T. Groundwater Potential Zone Mapping Using Analytical Hierarchy Process and GIS in Muga Watershed, Abay Basin, Ethiopia. Glob. Challenges 2022, 6, 2100068. [Google Scholar] [CrossRef]
- Priya, U.; Iqbal, M.A.; Salam, M.A.; Nur-E-Alam, M.; Uddin, M.F.; Islam, A.R.M.T.; Sarkar, S.K.; Imran, S.I.; Rak, A.E. Sustainable Groundwater Potential Zoning with Integrating GIS, Remote Sensing, and AHP Model: A Case from North-Central Bangladesh. Sustainability 2022, 14, 5640. [Google Scholar] [CrossRef]
- Pourtaghi, Z.S.; Pourghasemi, H.R. GIS-Based Groundwater Spring Potential Assessment and Mapping in the Birjand Township, Southern Khorasan Province, Iran. Hydrogeol. J. 2014, 22, 643–662. [Google Scholar] [CrossRef]
- Naghibi, S.A.; Pourghasemi, H.R.; Dixon, B. GIS-Based Groundwater Potential Mapping Using Boosted Regression Tree, Classification and Regression Tree, and Random Forest Machine Learning Models in Iran. Environ. Monit. Assess. 2016, 188, 1–27. [Google Scholar] [CrossRef] [PubMed]
- Guru, B.; Seshan, K.; Bera, S. Frequency Ratio Model for Groundwater Potential Mapping and Its Sustainable Management in Cold Desert, India. J. King Saud Univ. 2017, 29, 333–347. [Google Scholar] [CrossRef]
- Machiwal, D.; Jha, M.K.; Mal, B.C. Assessment of Groundwater Potential in a Semi-Arid Region of India Using Remote Sensing, GIS and MCDM Techniques. Water Resour. Manag. 2011, 25, 1359–1386. [Google Scholar] [CrossRef]
- Ishizaka, A.; Labib, A. Review of the Main Developments in the Analytic Hierarchy Process. Expert Syst. Appl. 2011, 38, 14336–14345. [Google Scholar] [CrossRef]
- Maity, D.K.; Mandal, S. Identification of Groundwater Potential Zones of the Kumari River Basin, India: An RS & GIS Based Semi-Quantitative Approach. Environ. Dev. Sustain. 2019, 21, 1013–1034. [Google Scholar]
- Saaty, T.L. A Scaling Method for Priorities in Hierarchical Structures. J. Math. Psychol. 1977, 15, 234–281. [Google Scholar] [CrossRef]
- Saaty, T.L. The Analytic Hierarchy Process: Planning, Priority Setting, Resource Allocation; McGraw-Hill International: New York, NY, USA, 1980. [Google Scholar]
- Baghel, S.; Tripathi, M.P.; Khalkho, D.; Al-Ansari, N.; Kumar, A.; Elbeltagi, A. Delineation of Suitable Sites for Groundwater Recharge Based on Groundwater Potential with RS, GIS, and AHP Approach for Mand Catchment of Mahanadi Basin. Sci. Rep. 2023, 13, 9860. [Google Scholar] [CrossRef]
- Chenini, I.; Ben, M.A.; El May, M. Groundwater Recharge Zone Mapping Using GIS-Based Multi-Criteria Analysis: A Case Study in Central Tunisia (Maknassy Basin). Water Resour. Manag. 2010, 24, 921–939. [Google Scholar] [CrossRef]
- Gumma, M.K.; Pavelic, P. Mapping of Groundwater Potential Zones across Ghana Using Remote Sensing, Geographic Information Systems, and Spatial Modeling. Environ. Monit. Assess. 2013, 185, 3561–3579. [Google Scholar] [CrossRef]
- Sener, E.; Davraz, A.; Ozcelik, M. An Integration of GIS and Remote Sensing in Groundwater Investigations: A Case Study in Burdur, Turkey. Hydrogeol. J. 2005, 13, 826–834. [Google Scholar] [CrossRef]
- Abdalla, F. Mapping of Groundwater Prospective Zones Using Remote Sensing and GIS Techniques: A Case Study from the Central Eastern Desert, Egypt. J. Afr. Earth Sci. 2012, 70, 8–17. [Google Scholar] [CrossRef]
- Gaber, A.; Mohamed, A.K.; ElGalladi, A.; Abdelkareem, M.; Beshr, A.M.; Koch, M. Mapping the Groundwater Potentiality of West Qena Area, Egypt, Using Integrated Remote Sensing and Hydro-Geophysical Techniques. Remote Sens. 2020, 12, 1559. [Google Scholar] [CrossRef]
- Abdekareem, M.; Abdalla, F.; Al-Arifi, N.; Bamousa, A.O.; El-Baz, F. Using Remote Sensing and GIS-Based Frequency Ratio Technique for Revealing Groundwater Prospective Areas at Wadi Al Hamdh Watershed, Saudi Arabia. Water 2023, 15, 1154. [Google Scholar] [CrossRef]
- Rahmati, O.; Nazari Samani, A.; Mahdavi, M.; Pourghasemi, H.R.; Zeinivand, H. Groundwater Potential Mapping at Kurdistan Region of Iran Using Analytic Hierarchy Process and GIS. Arab. J. Geosci. 2015, 8, 7059–7071. [Google Scholar] [CrossRef]
- Roy, S.; Hazra, S.; Chanda, A.; Das, S. Assessment of Groundwater Potential Zones Using Multi-Criteria Decision-Making Technique: A Micro-Level Case Study from Red and Lateritic Zone (RLZ) of West Bengal, India. Sustain. Water Resour. Manag. 2020, 6, 1–14. [Google Scholar] [CrossRef]
- Solomon, S.; Ghebreab, W. Hard-Rock Hydrotectonics Using Geographic Information Systems in the Central Highlands of Eritrea: Implications for Groundwater Exploration. J. Hydrol. 2008, 349, 147–155. [Google Scholar] [CrossRef]
- Lubang Nobert, J.B.; Mtalo, E.G. Integrated Remote Sensing and GIS Techniques for Groundwater Exploration in Semi-Arid Region: A Case of Karamoja Region-Uganda. Tanzan. J. Eng. Technol. 2008, 2, 31–42. [Google Scholar]
- Kuria, D.N.; Gachari, M.K.; Macharia, M.W.; Mungai, E. Mapping Groundwater Potential in Kitui District, Kenya Using Geospatial Technologies. Int. J. Water Resour. Environ. Eng. 2012, 4, 15–22. [Google Scholar]
- Konkul, J.; Rojborwornwittaya, W.; Chotpantarat, S. Hydrogeologic Characteristics and Groundwater Potentiality Mapping Using Potential Surface Analysis in the Huay Sai Area, Phetchaburi Province, Thailand. Geosci. J. 2014, 18, 89–103. [Google Scholar] [CrossRef]
- Li, Y.; Abdelkareem, M.; Al-Arifi, N. Mapping Potential Water Resource Areas Using GIS-Based Frequency Ratio and Evidential Belief Function. Water 2023, 15, 480. [Google Scholar] [CrossRef]
- Al-Omran, A.M.; Aly, A.A.; Al-Wabel, M.I.; Sallam, A.S.; Al-Shayaa, M.S. Hydrochemical Characterization of Groundwater under Agricultural Land in Arid Environment: A Case Study of Al-Kharj, Saudi Arabia. Arab. J. Geosci. 2016, 9, 68. [Google Scholar] [CrossRef]
- Mahmoud, S.H.; Alazba, A.A. The Potential of in Situ Rainwater Harvesting in Arid Regions: Developing a Methodology to Identify Suitable Areas Using GIS-Based Decision Support System. Arab. J. Geosci. 2015, 8, 5167–5179. [Google Scholar] [CrossRef]
- Mahmoud, S.H.; Alazba, A.A. Identification of Potential Sites for Groundwater Recharge Using a GIS-Based Decision Support System in Jazan Region-Saudi Arabia. Water Resour. Manag. 2014, 28, 3319–3340. [Google Scholar] [CrossRef]
- Al-Rashed, M.F.; Sherif, M.M. Water Resources in the GCC Countries: An Overview. Water Resour. Manag. 2000, 14, 59–75. [Google Scholar] [CrossRef]
- Khouri, J.; Agha, W.; Al-Deroubi, A. Water Resources in the Arab World and Future Perspectives. In Proceedings of the Symposium on Water Resources and Uses in the Arab World, Kuwait, 1986. [Google Scholar]
- Ukayli, M.A.; Husain, T. Comparative Evaluation of Surface Water Availability, Wastewater Reuse and Desalination in Saudi Arabia. Water Int. 1988, 13, 218–225. [Google Scholar] [CrossRef]
- Abdulrazzak, M.J. Water Supplies versus Demand in Countries of Arabian Peninsula. J. Water Resour. Plan. Manag. 1995, 121, 227–234. [Google Scholar] [CrossRef]
- Alghamdi, A.G.; Aly, A.A.; Aldhumri, S.A.; Al-Barakaha, F.N. Hydrochemical and Quality Assessment of Groundwater Resources in Al-Madinah City, Western Saudi Arabia. Sustainability 2020, 12, 3106. [Google Scholar] [CrossRef]
- Saud, A.G.; Abdullah, S.A. Water Resources and Reuse in Al-Madinah. In Proceedings of the International Conference on Water Conservation in Arid Regions (ICWCAR’09), Water Research Center-King Abdulaziz University, Jeddah, Saudi Arabia, 12–14 October 2009; pp. 12–14. [Google Scholar]
- Ali, I.; Hasan, M.A.; Alharbi, O.M.L. Toxic Metal Ions Contamination in the Groundwater, Kingdom of Saudi Arabia. J. Taibah Univ. Sci. 2020, 14, 1571–1579. [Google Scholar] [CrossRef]
- MOEP (The Ministry of Economy and Planning). The Ninth Development Plan (2010–2014); MOEP (The Ministry of Economy and Planning): Riyadh, Saudi Arabia, 2014. [Google Scholar]
- Yihdego, Y.; Drury, L. Mine Water Supply Assessment and Evaluation of the System Response to the Designed Demand in a Desert Region, Central Saudi Arabia. Environ. Monit. Assess. 2016, 188, 619. [Google Scholar] [CrossRef]
- Available online: https://www.worldweatheronline.com/riyadh-weather-averages/ar-riyad/sa.aspx (accessed on 22 November 2023).
- Available online: https://ngp.sgs.gov.sa/ (accessed on 3 December 2023).
- O’Callaghan, J.F.; Mark, D.M. The Extraction of Drainage Networks from Digital Elevation Data. Comput. Vis. Graph. Image Process. 1984, 28, 323–344. [Google Scholar] [CrossRef]
- Zhu, Q.; Abdelkareem, M. Mapping Groundwater Potential Zones Using a Knowledge-Driven Approach and GIS Analysis. Water 2021, 13, 579. [Google Scholar] [CrossRef]
- Abdelkareem, M.; Abdalla, F. Revealing Potential Areas of Water Resources Using Integrated Remote-Sensing Data and GIS-Based Analytical Hierarchy Process. Geocarto Int. 2021, 37, 8672–8696. [Google Scholar] [CrossRef]
- Mogaji, K.A.; Lim, H.S.; Abdullah, K. Regional Prediction of Groundwater Potential Mapping in a Multifaceted Geology Terrain Using GIS-Based Dempster–Shafer Model. Arab. J. Geosci. 2015, 8, 3235–3258. [Google Scholar] [CrossRef]
- Pande, C.B.; Moharir, K.N.; Panneerselvam, B.; Singh, S.K.; Elbeltagi, A.; Pham, Q.B.; Varade, A.M.; Rajesh, J. Delineation of Groundwater Potential Zones for Sustainable Development and Planning Using Analytical Hierarchy Process (AHP), and MIF Techniques. Appl. Water Sci. 2021, 11, 186. [Google Scholar] [CrossRef]
- Megahed, H.A.; Farrag, A.E.-H.A.; Mohamed, A.A.; D’Antonio, P.; Scopa, A.; AbdelRahman, M.A.E. Groundwater Recharge Potentiality Mapping in Wadi Qena, Eastern Desert Basins of Egypt for Sustainable Agriculture Base Using Geomatics Approaches. Hydrology 2023, 10, 237. [Google Scholar] [CrossRef]
- Tolche, A.D. Groundwater Potential Mapping Using Geospatial Techniques: A Case Study of Dhungeta-Ramis Sub-Basin, Ethiopia. Geol. Ecol. Landsc. 2020, 5, 65–80. [Google Scholar] [CrossRef]
- Biswas, S.; Mukhopadhyay, B.P.; Bera, A. Delineating Groundwater Potential Zones of Agriculture Dominated Landscapes Using GIS Based AHP Techniques: A Case Study from Uttar Dinajpur District, West Bengal. Environ. Earth Sci. 2020, 79, 302. [Google Scholar] [CrossRef]
- Magesh, N.S.; Chandrasekar, N.; Soundranayagam, J.P. Delineation of Groundwater Potential Zones in Theni District, Tamil Nadu, Using Remote Sensing, GIS and MIF Techniques. Geosci. Front. 2012, 3, 189–196. [Google Scholar] [CrossRef]
- Mandal, U.; Sahoo, S.; Munusamy, S.B.; Dhar, A.; Panda, S.N.; Kar, A.; Mishra, P.K. Delineation of Groundwater Potential Zones of Coastal Groundwater Basin Using Multi-Criteria Decision Making Technique. Water Resour. Manag. 2016, 30, 4293–4310. [Google Scholar] [CrossRef]
- Abdelkareem, M.; El-Baz, F. Remote Sensing of Paleodrainage Systems West of the Nile River, Egypt. Geocarto Int. 2017, 32, 541–555. [Google Scholar] [CrossRef]
- Reddy, G.P.O.; Mouli, K.C.; Srivastav, S.K.; Srinivas, C.V.; Maji, A.K. Evaluation of Ground Water Potential Zones Using Remote Sensing Data-A Case Study of Gaimukh Watershed, Bhandara District, Maharashtra. J. Indian Soc. Remote Sens. 2000, 28, 19–32. [Google Scholar] [CrossRef]
- Senthilkumar, M.; Gnanasundar, D.; Arumugam, R. Identifying Groundwater Recharge Zones Using Remote Sensing & GIS Techniques in Amaravathi Aquifer System, Tamil Nadu, South India. Sustain. Environ. Res. 2019, 29, 15. [Google Scholar] [CrossRef]
- Algaydi, B.A.M.; Subyani, A.M.; Hamza, M.H.M.M. Investigation of Groundwater Potential Zones in Hard Rock Terrain, Wadi Na’man, Saudi Arabia. Groundwater 2019, 57, 940–950. [Google Scholar] [CrossRef]
- Adeyeye, O.A.; Ikpokonte, E.A.; Arabi, S.A. GIS-Based Groundwater Potential Mapping within Dengi Area, North Central Nigeria. Egypt. J. Remote Sens. Sp. Sci. 2019, 22, 175–181. [Google Scholar] [CrossRef]
- Andualem, T.G.; Demeke, G.G. Groundwater Potential Assessment Using GIS and Remote Sensing: A Case Study of Guna Tana Landscape, Upper Blue Nile Basin, Ethiopia. J. Hydrol. Reg. Stud. 2019, 24, 100610. [Google Scholar] [CrossRef]
- Ahmed, J.B., II; Mansor, S. Overview of the Application of Geospatial Technology to Groundwater Potential Mapping in Nigeria. Arab. J. Geosci. 2018, 11, 504. [Google Scholar] [CrossRef]
- Yang, J.; Zhang, H.; Ren, C.; Nan, Z.; Wei, X.; Li, C. A Cross-Reconstruction Method for Step-Changed Runoff Series to Implement Frequency Analysis under Changing Environment. Int. J. Environ. Res. Public Health 2019, 16, 4345. [Google Scholar] [CrossRef] [PubMed]
- Bhanja, S.N.; Mukherjee, A.; Rangarajan, R.; Scanlon, B.R.; Malakar, P.; Verma, S. Long-Term Groundwater Recharge Rates across India by in Situ Measurements. Hydrol. Earth Syst. Sci. 2019, 23, 711–722. [Google Scholar] [CrossRef]
- Alogayell, H.M.; EL-Bana, E.M.M.; Abdelfattah, M. Groundwater Quality and Suitability Assessment for Irrigation Using Hydrogeochemical Characteristics and Pollution Indices: A Case Study of North Al-Quwayiyah Governorate, Central Saudi Arabia. Water 2023, 15, 3321. [Google Scholar] [CrossRef]


| Factor | Weight | Category | Rank |
|---|---|---|---|
| Lineament Density (km/km2) | |||
| 0–0.01 | 27.6 | Very Low | 1 |
| 0.11–0.3 | Low | 2 | |
| 0.31–0.5 | Moderate | 3 | |
| 0.51–0.7 | High | 4 | |
| 0.71–1.1 | Very High | 5 | |
| Slope | |||
| 0–2 | 12.3 | Very High | 5 |
| 2.1–5 | High | 4 | |
| 5.1–10 | Moderate | 3 | |
| 10.1–18 | Low | 2 | |
| 18.1–49.4 | Very Low | 1 | |
| Topography | |||
| 645–733 | 8.7 | Very High | 5 |
| 733–815 | High | 4 | |
| 815–899 | Moderate | 3 | |
| 899–960 | Low | 2 | |
| 960–1277 | Very Low | 1 | |
| Soil | |||
| Sandy soil and gravel | 8.3 | Very High | 4 |
| Alluvial | High | 3 | |
| Sandstone with limestone | Moderate | 2 | |
| Hard rock | Low | 1 | |
| Flow Direction | |||
| <2 | 5.2 | Very High | 5 |
| 2–8. | High | 4 | |
| 8–32 | Moderate | 3 | |
| 32–64 | Low | 2 | |
| >64 | Very Low | 1 | |
| Flow Accumulation | |||
| <2 | 5.7 | Very High | 5 |
| 2–3 | High | 4 | |
| 3–5 | Moderate | 3 | |
| 5–6 | Low | 2 | |
| >6 | Very Low | 1 | |
| LULC | |||
| Vegetation | 9.6 | Moderate | 2 |
| Hard rocks | Low | 1 | |
| Wadi deposits | Very High | 4 | |
| Sedimentary rocks | High | 3 | |
| Drainage Density (km/km2) | |||
| 7.8–51.8 | 8.9 | Very High | 5 |
| 51.81–95.93 | High | 4 | |
| 95.93–140.06 | Moderate | 3 | |
| 140.06–184.18 | Low | 2 | |
| 184.18–228.31 | Very Low | 1 | |
| Rainfall (mm/Year) | |||
| <20 | 13.6 | Very Low | 1 |
| 20–60 | Low | 2 | |
| 60–90 | Moderate | 3 | |
| 90–130 | High | 4 | |
| >130 | Very High | 5 |
| X | Y | Elevation (m) | TDS | W.L | Well Age |
|---|---|---|---|---|---|
| (mg/L) | (m) | (Years) | |||
| 534,413.00 m E | 2,665,349.00 m N | 770 | 4405 | 110 | 14 |
| 533,274.00 m E | 2,665,531.00 m N | 777 | 4510 | 100 | 13 |
| 532,506.00 m E | 2,664,425.00 m N | 782 | 3720 | 150 | 12–15 |
| 514,308.00 m E | 2,659,802.00 m N | 822.5 | 3620 | 60 | 3 |
| 512,494.00 m E | 2,657,740.00 m N | 832.7 | 3290 | 60 | 3 |
| 511,331.00 m E | 2,653,835.00 m N | 871.8 | 2510 | 60 | 40 |
| 508,984.00 m E | 2,657,588.00 m N | 835.2 | 2520 | 60 | 7 |
| 506,704.00 m E | 2,656,193.00 m N | 862.1 | 5610 | -- | -- |
| 506,528.00 m E | 2,659,460.00 m N | 850.6 | 6180 | 57 | more than 20 |
| 502,644.00 m E | 2,661,355.00 m N | 860.7 | 3370 | 43 | more than 35 |
| 500,481.00 m E | 2,662,234.00 m N | 877.2 | 1970 | 50 | 1 |
| 500,206.00 m E | 2,661,665.00 m N | 878.3 | 6600 | 45 | 25–30 |
Disclaimer/Publisher’s Note: The statements, opinions and data contained in all publications are solely those of the individual author(s) and contributor(s) and not of MDPI and/or the editor(s). MDPI and/or the editor(s) disclaim responsibility for any injury to people or property resulting from any ideas, methods, instructions or products referred to in the content. |
© 2024 by the authors. Licensee MDPI, Basel, Switzerland. This article is an open access article distributed under the terms and conditions of the Creative Commons Attribution (CC BY) license (https://creativecommons.org/licenses/by/4.0/).
Share and Cite
EL-Bana, E.M.M.; Alogayell, H.M.; Sheta, M.H.; Abdelfattah, M. An Integrated Remote Sensing and GIS-Based Technique for Mapping Groundwater Recharge Zones: A Case Study of SW Riyadh, Central Saudi Arabia. Hydrology 2024, 11, 38. https://0-doi-org.brum.beds.ac.uk/10.3390/hydrology11030038
EL-Bana EMM, Alogayell HM, Sheta MH, Abdelfattah M. An Integrated Remote Sensing and GIS-Based Technique for Mapping Groundwater Recharge Zones: A Case Study of SW Riyadh, Central Saudi Arabia. Hydrology. 2024; 11(3):38. https://0-doi-org.brum.beds.ac.uk/10.3390/hydrology11030038
Chicago/Turabian StyleEL-Bana, Eman Mohamed M., Haya M. Alogayell, Mariam Hassan Sheta, and Mohamed Abdelfattah. 2024. "An Integrated Remote Sensing and GIS-Based Technique for Mapping Groundwater Recharge Zones: A Case Study of SW Riyadh, Central Saudi Arabia" Hydrology 11, no. 3: 38. https://0-doi-org.brum.beds.ac.uk/10.3390/hydrology11030038