
Development of Green Disaster Management Toolkit to Achieve Carbon Neutrality Goals in Flood Risk Management
1
National Disaster Management Institute, Ministry of Interior and Safety, Ulsan 44538, Republic of Korea
2
Korea Institute of Disaster & Safety, Seoul 07308, Republic of Korea
*
Author to whom correspondence should be addressed.
Hydrology 2024, 11(4), 44; https://0-doi-org.brum.beds.ac.uk/10.3390/hydrology11040044
Submission received: 18 February 2024
/
Revised: 21 March 2024
/
Accepted: 23 March 2024
/
Published: 26 March 2024
(This article belongs to the Special Issue Editorial Board Members’ Collection Series: The Flood Estimation and Forecasting Chain: Meteorological–Hydrological–Hydraulic Forecasts and Predictive Uncertainty towards Operational Decisions)
Abstract
:Current flood risk management projects have been criticized for their high carbon emissions, raising the need for carbon emission reduction and carbon absorption efforts to mitigate environmental impacts and achieve carbon neutrality goals. The research develops a comprehensive green disaster risk management toolkit to calculate the carbon emissions and absorption quantitatively based on the unit volume of materials and processes employed in a flood risk management project. As a result of applying the developed toolkit to a about 22,300 small stream restoration projects in Korea, the total carbon emissions were estimated to be 1,158,840.7 tons of CO2, of which 89.4% of the total carbon emissions originated from concrete-related construction activities, such as cement and ready-mixed concrete pouring. As a result of evaluating the nationwide carbon absorption results of all small stream restoration projects, total absorption by 2030 is expected to be 3.0 to 10.2 times higher than carbon emissions. The comprehensive toolkits are expected to support the selection of customized processes, materials, and methods by providing a systematic approach to calculate and minimize carbon emissions, ultimately contributing to the achievement of carbon neutrality goals in flood risk management projects.
1. Introduction
The construction sector, including flood risk management projects, especially restoration, is known to contribute significantly to greenhouse gas emissions [1]. Notably, the Korean construction industry constitutes approximately 48% of the nation’s total material consumption and 40% of its energy consumption [2,3]. Among the various administrative projects in the field of flood risk management in Korea, the small stream restoration project, the disaster prevention and recovery projects and the establishment of storm-water runoff reduction facilities are representative major projects. According to the United Nations Framework Convention on Climate Change (UNFCCC), industrialized countries must reduce their greenhouse gas (GHG) emissions [4]. Korea also announced a voluntary action plan to reduce greenhouse gas emissions by 37% from the business-as-usual level of 851 million by 2030 [5]. It is necessary to make efforts to transition to eco-friendly and low-carbon flood risk management projects to reduce carbon emissions and increase carbon absorption.
Accurate quantification of emissions and absorption is required to promote the transition to an environmentally sustainable low-carbon flood risk management project to mitigate greenhouse gas emissions. Consequently, it becomes crucial to advocate for the integration of nature-based solutions within local policies pertaining to flood risk management initiatives. This not only serves the purpose of fostering sustainable practices in the management of land, water, and biodiversity but also plays a pivotal role in diminishing vulnerability to natural disasters [6]. The establishment of a standardized framework for quantifying both emissions and absorption becomes essential for a comprehensive understanding of current greenhouse gas dynamics associated with various measures implemented for flood risk management. Additionally, careful consideration must be given to the energy footprint incurred during the transportation, construction, and maintenance of public facilities and infrastructure designed for prevention and recovery efforts. Moreover, the energy expended in the demolition and disposal of facilities and materials necessitates detailed assessment [7].
Scientific insights, policy frameworks, and pilot applications for nature-based solutions can support the effective implementation of measures for sustainable development [8]. In other words, a tool that can explain the environmental and disaster reduction effects of the installation of green and blue infrastructure can be used also as a tool to support the sustainable development of local communities. This research develops a Green Disaster Management Toolkit (GDMT) designed to assess carbon reduction efficacy, including greenhouse gas emission and the absorption status of each disaster risk management project, and supports selection of customized processes, materials, and methods suitable for carbon neutrality. The methodology for quantifying greenhouse gas emissions and absorption for each project is based on existing technologies and comprehensive literature surveys. The life cycle of a flood risk management project includes several phases, each contributing to greenhouse gas emissions, and these encompass materials production, construction, utilization, maintenance, and end-of-life considerations [9,10]. As materials production and construction phases are intricately linked to the construction process itself [11], this research focuses on the initial two phases for calculating carbon emissions, with a primary emphasis on greenhouse gas emissions stemming from primary materials and equipment.
A noteworthy feature of the GDMT is its capability to swiftly provide pertinent information on materials and components formulated during the planning phase. In the context of flood risk management, a substantial portion of carbon emissions emanates from sectors associated with small stream restoration, encompassing transportation, cement and steel manufacturing, and commercial energy consumption [12]. This research focuses on small stream restoration as a case study and utilizes the GDMT to quantify CO2 emissions throughout the construction process of public facilities for flood risk management. This encompasses CO2 emissions attributed to materials and the activities involved in small stream restoration projects. Furthermore, the research derives advanced low-carbon green infrastructure alternatives tailored for flood risk management projects, aligning with domestic regional and environmental conditions by drawing insights from existing case studies. The developed GDMT serves as a valuable resource for supporting the selection of adaptive flood management projects based on low-carbon green infrastructure. Additionally, it aids in identifying improvement opportunities and exploring environmentally friendly alternatives [13,14]. The devised processes and methodologies are applicable for assessing whether planned prevention and recovery projects might yield negative impacts and for devising strategies to mitigate unintended consequences.
2. Literature Review
2.1. Toolkit for Calculating Carbon Emission
The Ministry of Land, Infrastructure and Maritime Affairs (MOLIMA), Korea, established the Carbon Emission Calculation Program for Facilities (CECPF) to assess greenhouse gas emissions by considering material usage and energy consumption according to the established guidelines for facility-specific carbon emission calculations [15]. This program has the advantage of being highly practical and adaptable due to its capability to accommodate diverse input values, including specifications, units, quantities, and materials for each intricate process. The Greenhouse Gas Emission Calculation Subsidy Program (GECSP), developed by the Korea Environment Institute (KEI), was designed to compute carbon emissions, incorporating the country’s distinct emission factors and the energy calorific conversion factor [16]. However, a limitation of this program was its constrained diversity, as it did not permit the verification of energy consumption and CO2 emissions based on specific types. The Korea Environment Corporation (KEC) developed the Waste Sector Greenhouse Gas Emission and Energy Consumption Calculation Tool (WSGEECT) to calculate greenhouse gas emissions according to energy, external supply, landfill, biological treatment, incineration, sewage, and wastewater [17]. However, it did not provide the capability to scrutinize emissions concerning specific processes and construction materials associated with construction activities.
The Eco-DM Program was conceived for facilitating environmental assessments through the Life Cycle Analysis (LCA) method, integrating both individualized calculation methods and industry-specific approaches. A notable advantage of this program lies in its ability to compute carbon emissions using fundamental data elements, such as construction name, period, location, scale, and project overview. LCA is a methodology employed to evaluate the environmental impacts associated with all stages of a product’s life cycle, encompassing raw material extraction, materials processing, manufacturing, distribution, use, repair and maintenance, and disposal or recycling [3,18]. The application of LCA extends across diverse projects, ranging from construction and damming to wastewater treatment and general flood risk management [19,20,21,22,23,24,25,26]. However, in the various applications of LCA for estimating the environmental impact of engineering projects, research often focused on a specific product or a static function, which can be defined as a functional unit. These may include a static number of booths, the footprint of venues, or an entire event consisting of a specific configuration of settings [27,28]. The researchers in [29] divided the entire construction process of Prefabricated Floor Slabs (PFS) into three stages: production, transportation, and construction, and carbon emissions were calculated using the LCA method.
The Sacramento Metropolitan Air Quality Management District (SMAQMD) introduced the Road Construction Emission Model (RCEM) for estimating greenhouse gas emissions based on equipment usage. The SimaPro was developed for calculating carbon emissions through the LCA, offering a comprehensive set of results encompassing 17 modules related to buildings, serving as a decision-making tool during the design stage. Meanwhile, Building for Environmental and Economic Sustainability (BEES) facilitated the selection of cost-effective and environmentally friendly building products by assessing environmental performance, including carbon emissions, across various stages, such as materials, manufacturing, transportation, installation, and use. However, BEES had drawbacks, such as being limited to a domestic language and lacking a unique emission factor.
Existing programs were primarily dedicated to calculating carbon emissions based on facility, process and building materials. However, a common deficiency across most of these programs was the absence of visualization data corresponding to the calculated carbon emissions. Additionally, the universal listing of installed coefficients or building grades in Table 1 was lacking, introducing a notable limitation to the comprehensiveness of the available tools. This underscores the need for more advanced and inclusive solutions in the domain of carbon emissions assessment. Recognizing these gaps, a novel program was deemed essential, particularly for application in Korean flood risk management projects. In response, the research introduced the GDMT, designed to address these shortcomings and support carbon neutrality initiatives within the framework of flood risk management.
2.2. Carbon Absorption Quantification Technology
The researchers in [30] introduced a method for quantifying carbon absorption by multiplying the amount of wood stored in forests by a coefficient. Numerous studies have indicated substantial carbon content in soils [31,32,33,34]. While there was no universally recognized methodology for precisely measuring or validating carbon storage in soil [35], several studies have undertaken calculations for this. The National Institute of Forest Sciences (NIFS) and [36] assessed soil carbon storage by categorizing it into forests, rice fields, fields, and grasslands. The U.S. Department of Agriculture (USDA) Natural Resources Conservancy (NRCS) utilized the Soil SURvey GeOgraphic (SSURGO) DB and the National Cooperative Soil Survey (NCSS) to estimate soil carbon storage up to a depth of 1 m below the surface across the entire United States. The authors of [37,38,39] conducted diverse studies to compute the quantity of carbon stored in soil based on land use status. It was recognized that the decomposition of carbon in soil, stored in an inhomogeneous form, occurred over a span ranging from a few days to hundreds of years [40]. While the method for assessing carbon absorption according to land use was suitable for large-scale evaluations, such as the assessment of carbon emissions or absorption, it was deemed inappropriate for evaluating carbon absorption in small-scale flood risk management projects.
The predominant focus of research on traditional wetlands had historically centered on enhancing water quality. However, more recent studies have shifted towards investigating the role of wetlands in mitigating global warming gases [41,42,43,44]. In accordance with the National Greenhouse Gas Inventory’s definition, small streams could be categorized as wetlands, with self-wetlands, encompassing small streams and periodically flooded areas like retention ponds, classified as artificial wetlands [45]. In Korea, most small streams were characterized by dry springs, or the runoff area was significantly small compared to the total width of the streams. In this case, absorption assessment was conducted by categorizing excluded areas of small streams into ground cover plants and inland areas into trees and ground cover plants. However, it was noteworthy that the amount of carbon stored in water in flood management projects, such as for small streams and reservoirs, was minimal. Flood risk management facilities often remain inadequately filled with water throughout the year, and the cultivation of algae for carbon absorption was challenging. Consequently, the research did not account for the amount of carbon absorption in the water component of these projects.
In Korea, the Rural Development Administration (RDA) conducted an evaluation of the annual carbon absorption of 30 major ground cover plants commonly used for landscape creation [46]. Consequently, the research adopted the methodology developed by the RDA to assess the amounts of carbon emissions absorbed by individual trees and surface plants, excluding consideration of carbon absorption in the soil and water surface. Within the GDMT, users had the ability to select ground cover plants for planting. In cases where the specific vegetation was unknown, the average value derived from the 30 specified species was utilized. The estimation of long-term carbon absorption post-construction was conducted by taking into account the photosynthesis of plants and aquatic microorganisms, as well as storage within green infra components, including soil, wetlands, and storage facilities.
2.3. Green Infra
The primary objective of traditional flood risk management facilities had traditionally been to mitigate peak runoff during heavy rainfall events and extend the peak discharge time. To fulfill this purpose, these facilities exhibit storage and infiltration functions, which share commonalities with Low Impact Development (LID) and Green Infra (GI) facilities, incorporating certain overlapping features. The research classified and outlined significant green infra facilities based on key functions, including vegetation filtration, infiltration, retention, rainwater utilization, and flow control based on the results of K-water [47], and conceptually explained the disaster and environmental performance level of each facility, as detailed in Table 2, which comprehensively classifies functions for determining performance levels, such as reducing runoff, protecting water resources and improving water quality, which includes all detailed items commonly used in the field of disaster risk management.
As a result of the analysis, the applicable carbon absorption facilities at the level of flood risk management were vegetation buffer zones, waterside buffer zones, infiltration reservoirs, rainwater ponds, pond-type reservoirs, and artificial wetlands among the 20 LID and GI facilities. Specifically, in the context of a small stream restoration project, there was potential to implement vegetation filtration zones and waterside buffer zones. Moreover, in the storm water runoff reduction project, the utilization of infiltration retention ponds and artificial wetlands was considered viable for achieving the intended goals.
3. Evaluation Method for Carbon Emissions and Absorption
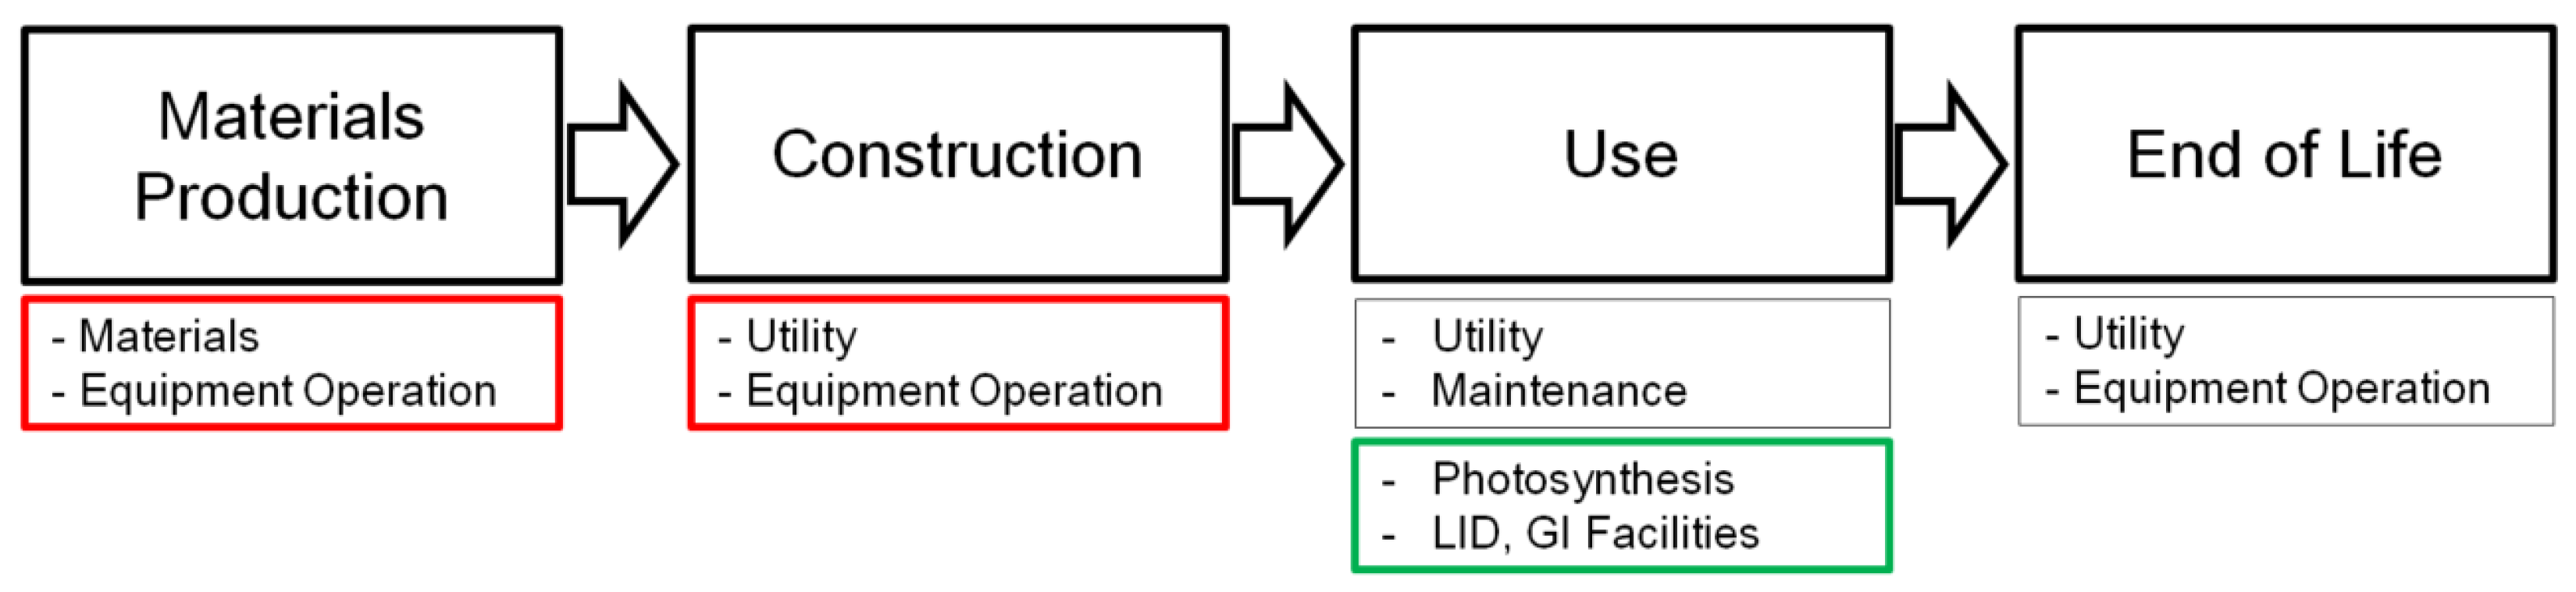
In conducting the Life Cycle Assessment (LCA) for CO2 emissions in the flood risk management project, the research delineated the life cycle into three principal phases: raw material production, raw material transportation, and on-site construction, as illustrated in Figure 1. The research focused on phase 1 and phase 2 as the scope of investigation, as these directly pertained to the construction process.
In the material production phase, CO2 emissions occurred during the collection and production of raw materials, including boulders and metal pieces used in the small stream restoration project. Operational time for machinery and the specifications of all engineering materials employed on-site were documented in the construction plans accessible through the Korea Online E-Procurement system (KONEPS) of the Public Procurement Service (PPS). The research scrutinized public documents for various flood risk management projects, such as the small stream restoration project, landslides protection project, and storm water runoff reduction facility installation project, within the KONEPS platform for the years 2019 to 2022. All significant equipment, such as excavators, tractors, and skidders, were rented from different vendors. The research estimated fuel consumption and the associated emissions resulting from transporting heavy machinery.
The on-site construction phase comprised five major activities: site preparation, installing off-channel features, installing block features, conducting erosion control, and re-vegetating disturbed areas. Erosion control and re-vegetation predominantly utilized hand tools and small trucks for staff and material movement around the site. Site preparation mainly employed small-engine equipment to establish access corridors for heavy equipment along riparian areas. Installing off-channel features and block features necessitated the use of various heavy equipment, including excavators, skid steers, and dump trucks.
Flood risk management projects were systematically divided into detailed processes, wherein the duration of equipment operation and the quantity of raw materials used for construction work were delineated using standardized construction work production measures. The CO2 emissions and absorption resulting from equipment operation and material usage were computed based on standards provided by the Korea Institute of Civil Engineering and Building Technology (KICEBT). Ultimately, the research estimated the amount of CO2 emissions and absorptions for each construction phase in the following steps. First, information on materials and the main engineering equipment used in each part of the construction process was collected from the KONEPS. Then, this collected information was inputted into the GDMT, where CO2 emissions per unit for detailed processes, equipment operation duration, and raw material quantity were set. Utilizing the functionality of the GDMT, the research derived the quantity of each component in the flood risk management project and automatically calculated the associated CO2 emissions (CE) using the following equation:
in which represents the carbon emissions per unit for the detailed process, length of equipment operation and amount of raw material, denotes the total amounts for the detailed process, length of equipment operation and amount of raw material related to CO2 emissions, represents the number of detailed processes and represents the total number of processes related to CO2 emissions. The research also calculated the associated CO2 absorptions () using the following equation:
in which represents the carbon absorptions per unit for the detailed process, length of equipment operation and amount of raw material, denotes the total amounts for the detailed process, length of equipment operation and amount of raw material related to CO2 absorptions, and represents the total number of processes related to CO2 absorptions. This approach facilitated a comprehensive assessment of the carbon footprint associated with each part of the flood risk management project. Regarding the quantities derived from the GDMT and referencing the national standard estimating reference provided by the KICEBT, the research computed the fuel consumption for the primary construction equipment. This value was then multiplied by the corresponding CO2 emission factors to determine the CO2 emissions associated with the main equipment used in the flood risk management project. The research conducted a comprehensive analysis of CO2 emissions throughout the flood risk management project process, encompassing emissions from materials and those produced by the primary equipment used in construction. Furthermore, using the LID and GI, the research performed an analysis of the CO2 absorption and emission effects related to the selection and establishment of their facilities.
4. Results and Discussion
4.1. Determination of the Quantifiable Functional Unit
The GDMT developed here can evaluate quantitative CO2 emission and absorption to improve habitat biodiversity, as higher biodiversity correlates with an enhanced ecosystem service [48]. A functional unit was established to evaluate the project results by utilizing the comparison of significance results between alternative designs. The functional unit was determined based on the carbon footprint analysis, reflecting the improvement of the function and service of the restored small stream habitat. To assess the effectiveness of implanting the vegetation shelter block and the vegetation retaining wall block and large plant structures, topographic surveys were conducted for the Ha-gok stream in Geochang-Gun, Korea. The survey results and construction information collected from the KONEPS were adapted to assess major changes in habitat types and develop an approach that integrates the LCA results for quantifying the environmental performance of a restoration project. To support the selection of customized processes, materials and methods via comparison of carbon emissions and reduction effects by alternative projects, the research made these comparisons, and analyzed carbon contents through three scenarios, S-I, S-II and S-III as shown in Table 3. In Table 3, S-I used the general small stream restoration method, S-II used an alternative method employing vegetation shelter blocks and vegetation retaining wall blocks, and S-III used the alternative method and a GI facility-like construction of waterfront green areas.
For calculating CO2 emission, no separate materials were used for the earth works, but equipment was only used to conduct the small stream restoration project. Referring to the national standard estimating reference by the KICEBT, the research calculated the fuel consumption for excavator, by Equation (3):
The values of the coefficients, such as and f, and factor and efficiency, E, were determined by using the national standard estimating reference from KICEBT. The equipment CO2 emission of mixer-trucks and dump trucks for the small stream restoration project was calculated by using the national standard estimating reference from KICEBT. Table 4 shows the CO2 emission and absorption factor per unit results for detailed equipment operation and materials used. The research calculated the related CO2 emission and absorption automatically by using the GDMT.
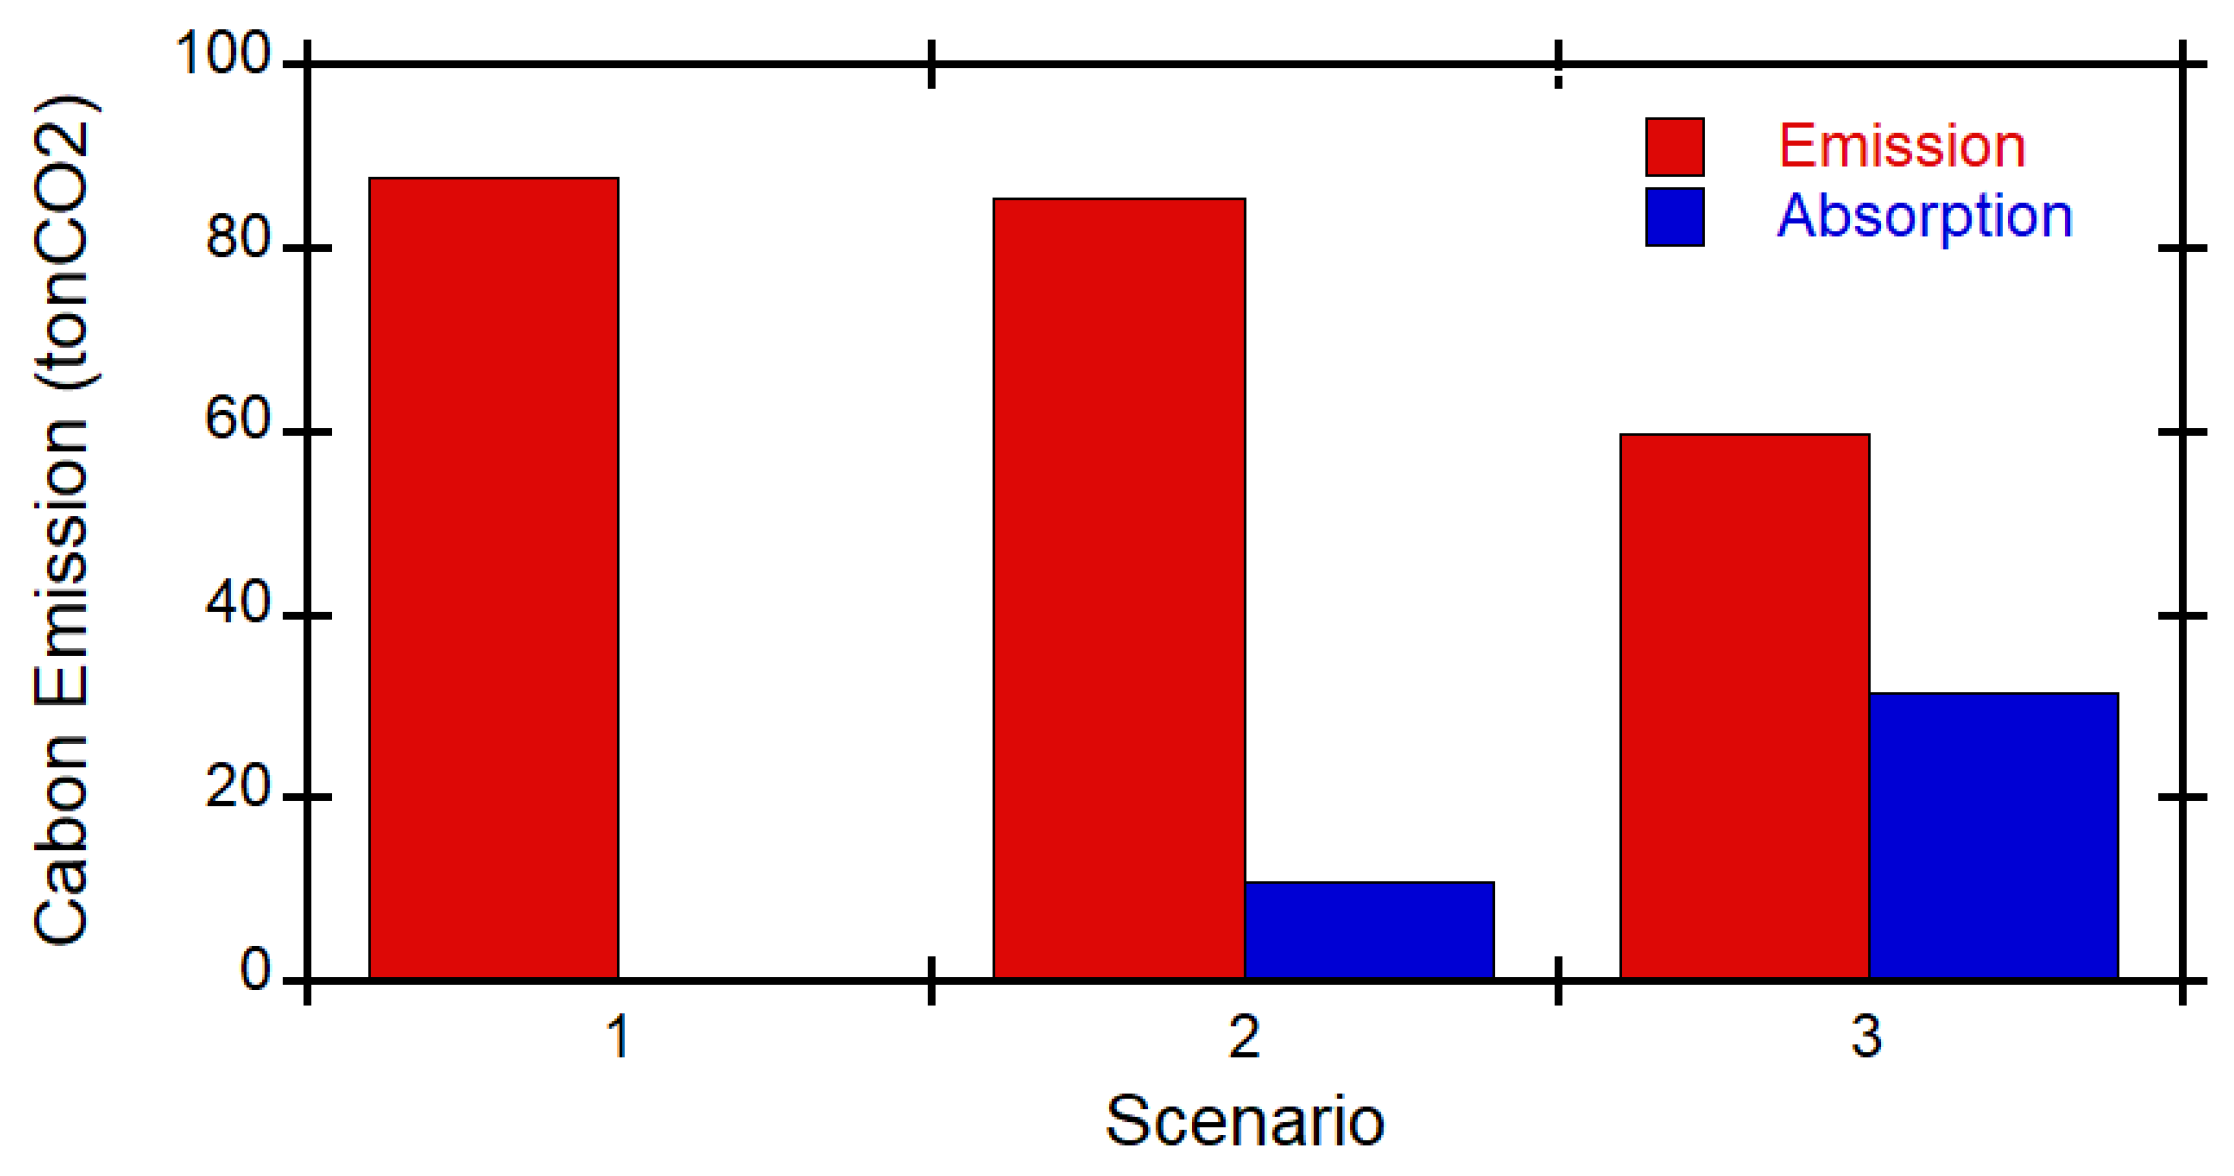
The calculation results showed that the small stream restoration project could lead to CO2 emissions ranging from 59.6 to 86.7 tonCO2. In the case of the Ha-gok stream baseline scenario (S-I), the small stream restoration emitted 86.7 tons CO2 to restore a total of 42 m of stream. In the case of alternative (S-II), the amount of CO2 emission was 85.3 tonCO2 and in the case of S-III the amount of CO2 emission was 59.6 tonCO2. As a result of the analysis of carbon contents by scenarios, since only absorption was considered for vegetation shelter block and green infra, the amount of carbon generated in all scenarios immediately after the project was the same. In terms of absorption, when the vegetation shelter block was used as an alternative method for embankment work in S-II, about 12.66% of carbon emissions could be absorbed. As can be seen in Figure 2, the S-III scenario absorbed 52.85% of carbon emissions, showing that the carbon absorption rate was higher than that of S-I and S-II. In terms of sustainable development, green infra facilities are believed to be able to support carbon neutrality.
4.2. Evaluation of Effectiveness of Small Stream Restoration Projects
In order to calculate the carbon generated by the implementation of the small stream restoration project, the GDMT was employed to assess CO2 emissions from a total of 63 small streams located in Yong-in City, Korea. The average CO2 emissions for small streams restoration projects in Yong-in were determined to be 242.1 tons of CO2. Among these streams, the Suyouk stream had the highest carbon emissions at 1965 tons of CO2, while the Jinae stream had the least at 33.4 tons of CO2. It was reported that 48 small streams, which account for 38.7% of all small streams, emitted 93.9% of all CO2 emissions, and the top 11 small streams emitted 50.8% of all emissions.
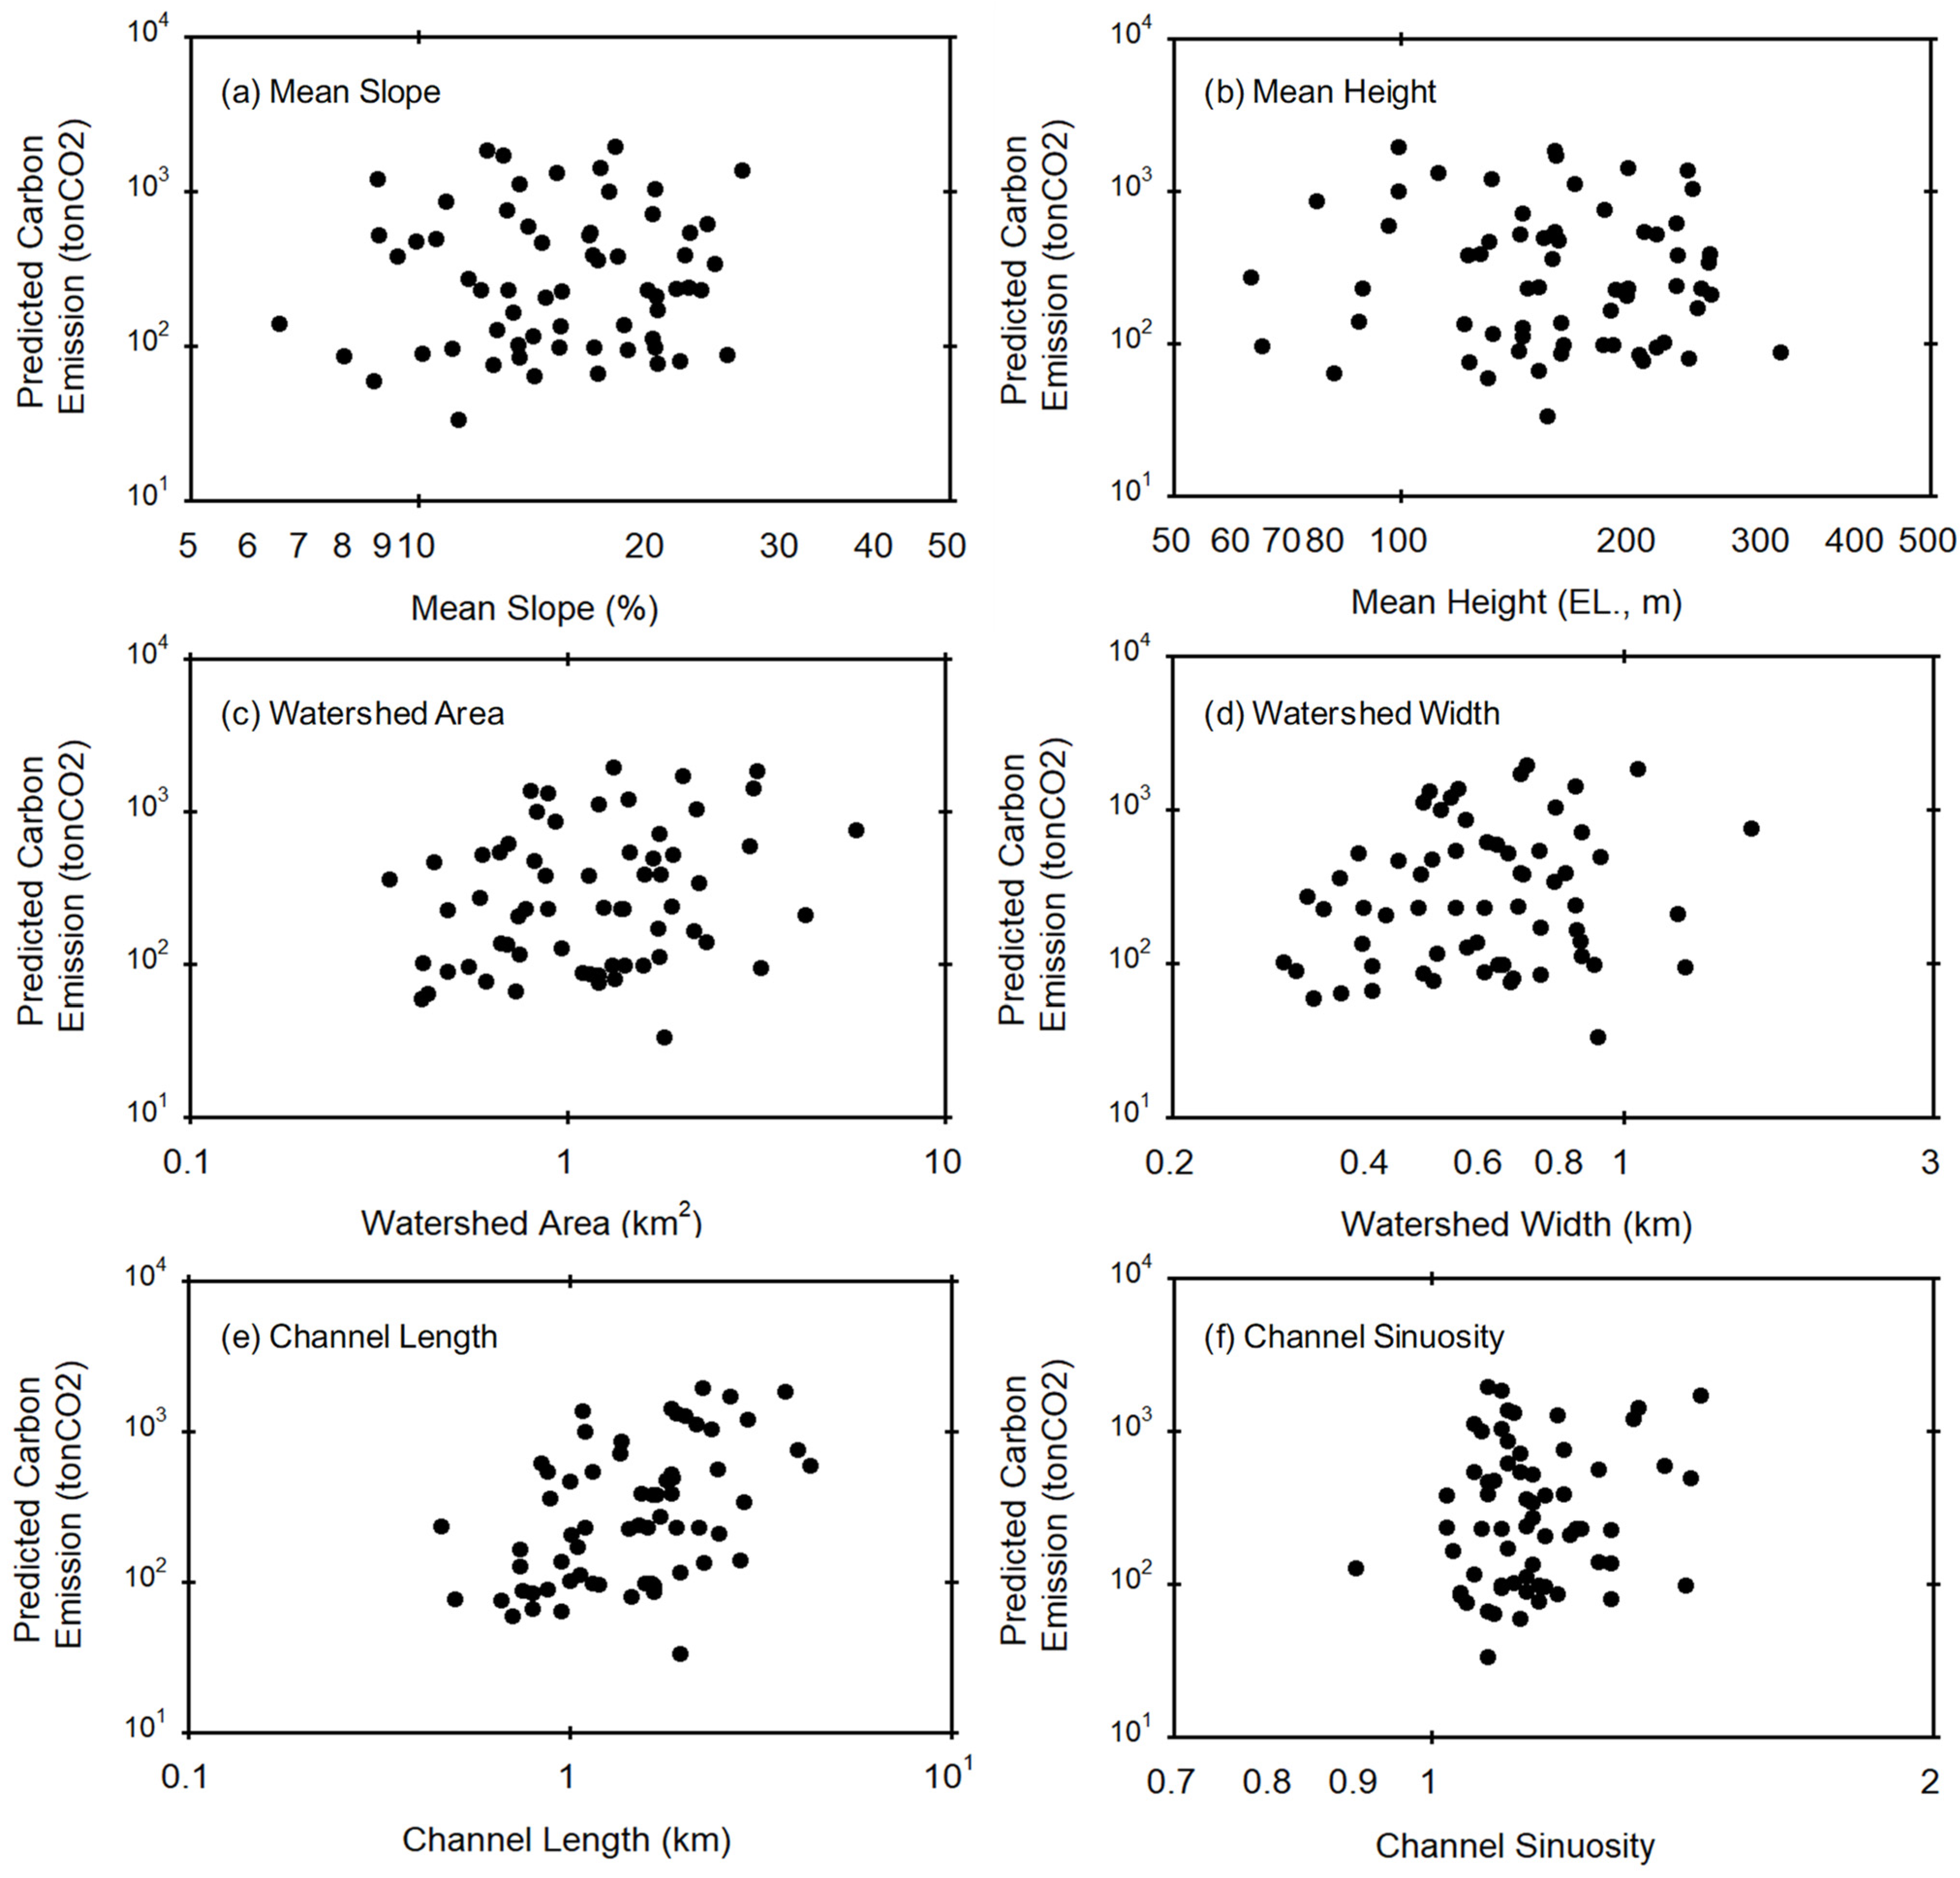
By work type, the weir and drop structure works exhibited the highest carbon emissions, releasing 28,034,976 tons of CO2 and representing 94.89% of the total emissions, as shown in Table 5. Following closely was the erosion control and re-vegetation, contributing the second-highest carbon emissions at 904,235 tons of CO2, accounting for 3.1% of the total emissions. Subsequently, earth works generated 547,332 tons of CO2, ranking as the third-largest contributor and constituting 1.9% of the total emissions. As a result, it was found that most of the carbon was generated in the use of concrete, and not much carbon was generated in the soil. To estimate the total carbon emission amount of small stream restoration projects nationwide, the research analyzed the correlation between the carbon emissions and characteristic information such as mean slope, mean height, watershed area, watershed width, channel length and channel sinuosity of the small stream in the project, as shown in Figure 3.
In order to quantitatively compare the correlation between characteristic information and the predicted CO2 emission, the research calculated the correlation coefficient and compared the results. The results show that the value of the correlation coefficient of the channel length was the largest at 0.453, followed by the watershed area, the channel sinuosity, the watershed width, the mean height and the mean slope, and each of these correlation coefficient values was calculated as 0.220, 0.164, 0.144, −0.129, and 0.010. The longer the length of the small stream restoration project, the higher the carbon emissions from the restoration project as shown in Figure 3e. However, it was difficult to find an appropriate correlation and homogeneity of variance due to the large variation in carbon emissions by small stream restoration project, as all small streams across the country have different watershed characteristics and project conditions, such as the amount of materials and equipment required for each.
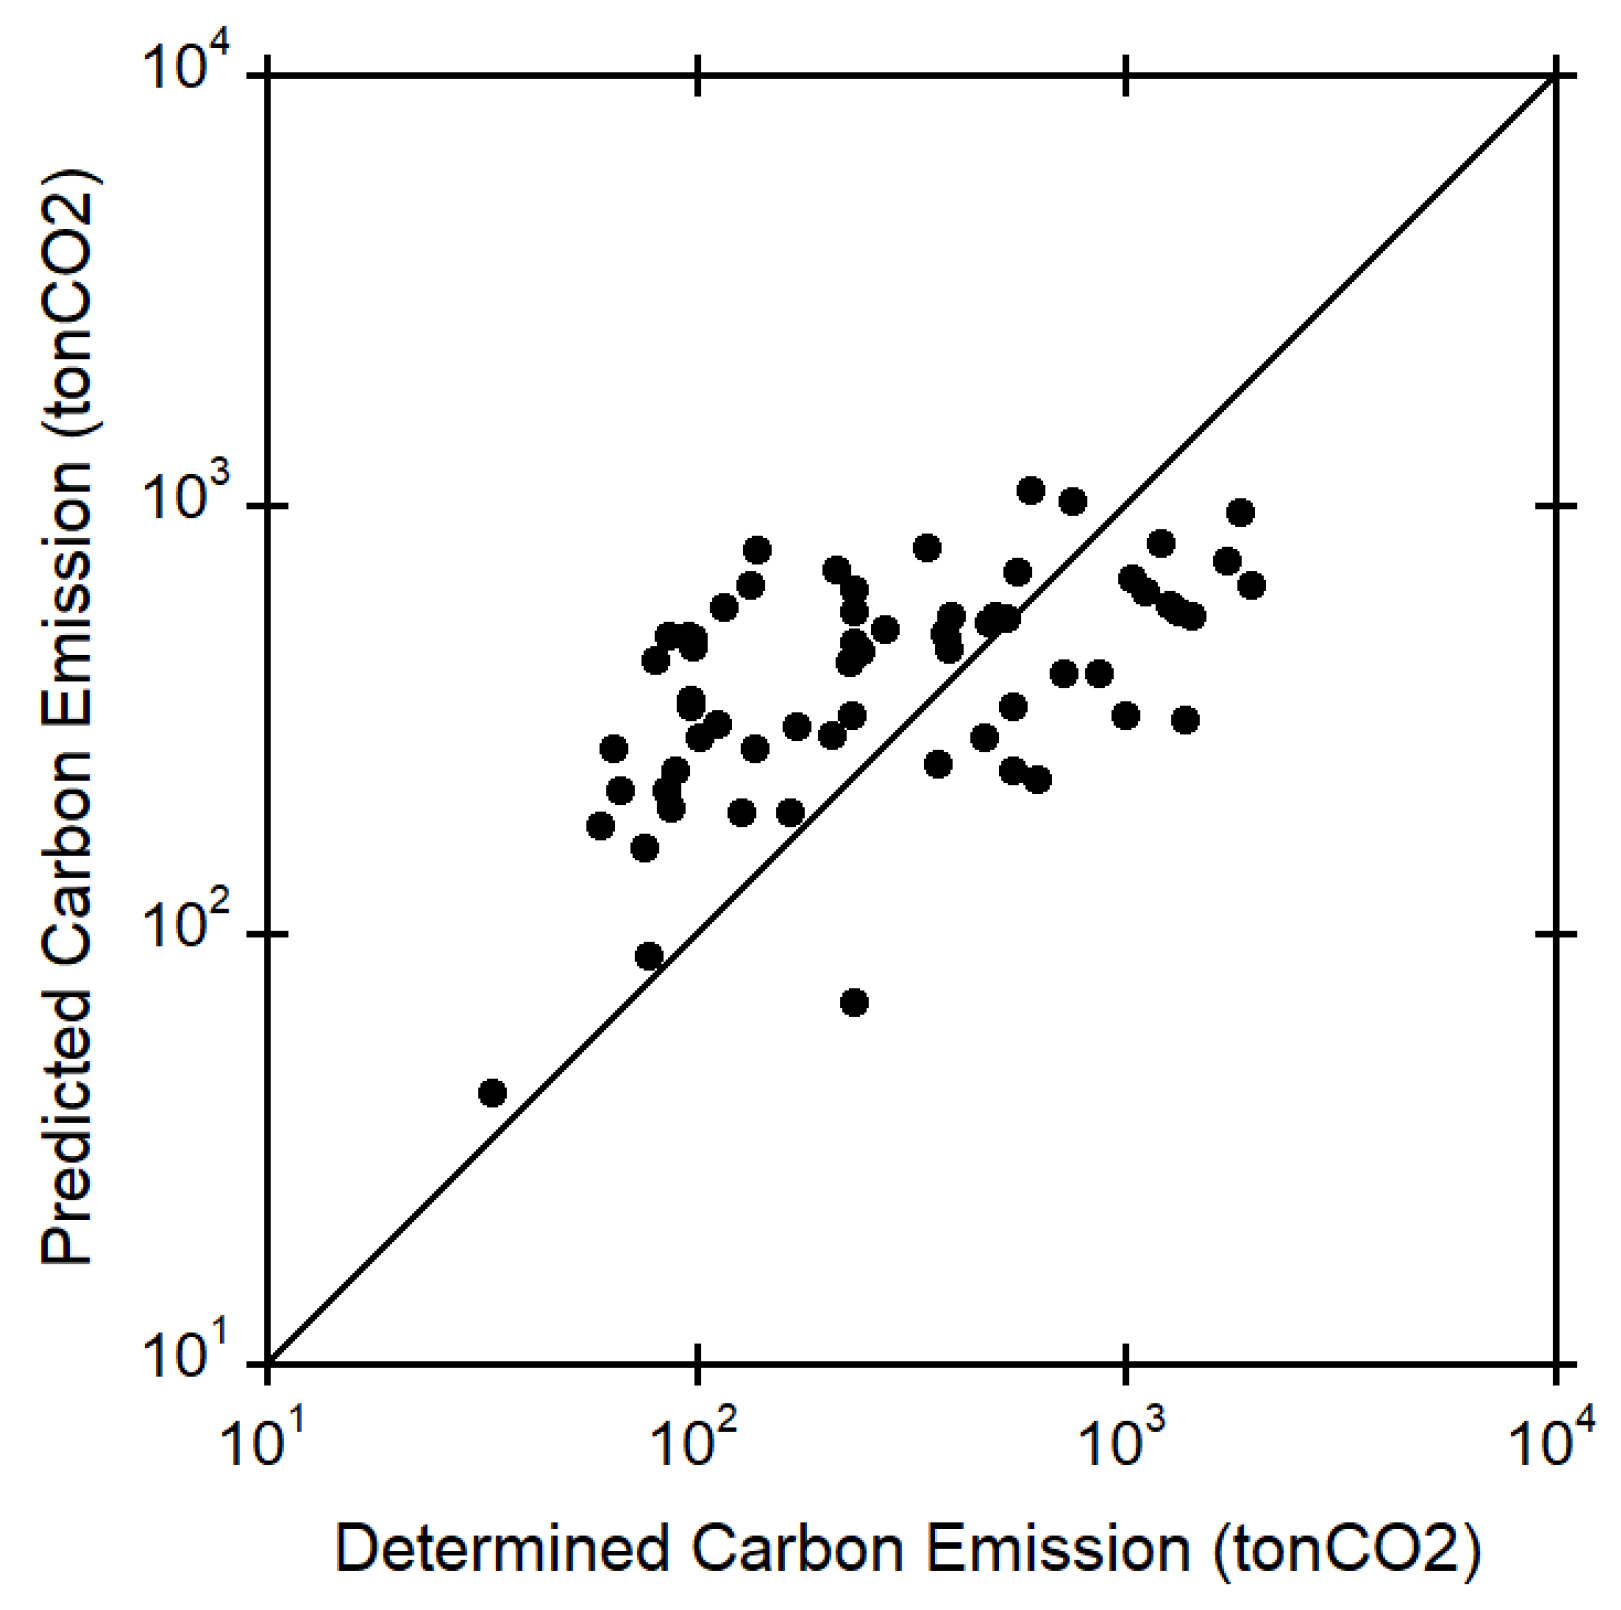
The research developed a non-linear multi-regression equation for predicting the carbon emission equation as a function of the length of small stream restoration project, derived by using the robust minimum covariance determinant regression method [49,50]. The data sets used in the development of the new carbon emission equation were collected from 63 small streams located in Yong-in City, Korea in which the CO2 emission amount for each small stream restoration project was determined by using the GDMT. The new regression equation derived by using the robust minimum covariance determinant regression method was given as
in which represents the predicted carbon emission and represents the length of the small stream restoration project. Sixty-three measured data sets were used to verify the proposed equation for predicting carbon emission, in which the determinant coefficient was 0.546. For the verification of the proposed equation, carbon emissions predicted by the proposed equation were compared with determined carbon emission amounts. The comparisons of predicted carbon emissions by Equation (4), with determined data using the GDMT, are shown in Figure 4. This figure shows that the proposed equation predicted well the represented determined data. The research conducted a comprehensive analysis of the environmental impact of entire small stream restoration projects, focusing on CO2 emissions and absorption. Assuming that small stream restoration projects would be completed, the derived regression equation was applied to 22,093 small stream restoration projects nationwide to predict carbon emissions. Predicted results showed that a total of 1,158,840.7 tonCO2 would be emitted during the entire small stream restoration projects. As of 2022, about 40% of all stream restoration projects have been completed, and it would be expected that an additional 695,304.4 tonCO2 would be emitted when the small stream restoration projects are completed in the future.
To evaluate the overall environmental consequences, the research predicted the total carbon absorption resulting from small stream restoration projects nationwide. The prediction revealed a promising trend, indicating that, by the year 2030, carbon absorption is expected to be approximately 3.0 to 10.2 times higher than the total carbon emissions of 1,158,840.7 tonCO2 from the entire small stream restoration projects. Looking further into the future, by 2050, vegetation is anticipated to absorb up to 32 times the amount of carbon emissions attributable to the projects. These findings emphasize the significant carbon mitigation benefits associated with stream restoration projects. The results suggested positive effects in CO2 absorption that substantially outweighs emissions, highlighting the environmental sustainability of these initiatives over the long term. As progress towards the future, it would be expected that these insights provide valuable information for policymakers and stakeholders to enhance the effectiveness and ecological impact of stream restoration projects.
5. Conclusions
Most disaster risk management measures, such as construction projects and small stream restoration projects, were mostly focused on material production and equipment use, which was expected to contribute significantly to CO2 emissions. Therefore, efforts were needed to convert disaster risk management measures into eco-friendly and low-carbon projects to achieve the carbon neutrality goal for climate change mitigation and adaptation. To support this conversion, the research developed GDMT, a novel toolkit that could calculate CO2 emissions and absorption by using only the generalized project plan information provided by KONEPS. In the GDMT, the user could easily change the work type, such as processes, materials, and methods, by simply selecting from already established measures, and could directly compare the CO2 emissions and absorption of each small stream restoration project by using the visualized results function, so it would be possible to establish customized measures, including LID and GI, at the planning stage to achieve the carbon neutrality goal and reduce disaster risk.
To efficiently provide calculation results, the study evaluated existing CO2 emissions and absorption calculation programs and toolkits to identify and improve the limitations of diversity and visualization capabilities. The biggest difference between the GDMT developed in the research and the existing toolkit was that CO2 emissions and absorption could be quantified in the GDMT. The standardized framework established to quantify both emissions and absorption was essential for a comprehensive understanding of greenhouse gas dynamics related to various disaster risk management measures. The research developed a comprehensive calculation analysis of CO2 emissions, considering factors such as energy utilization and project scale by focusing on the initial stages of materials production and construction. The research also developed a CO2 absorption calculation method for certain green-based elements, such as surface plants and artificial wetlands, which are mainly used in disaster risk management projects to quantify CO2 absorption for vegetation, land, and water surface area, major factors affecting CO2 absorption.
The development of toolkits was also important for sustainable disaster risk management, but it was also very important to select measures to support the achievement of carbon neutrality goals. The research attempted to help select appropriate measures to reduce CO2 emissions and increase CO2 absorption by introducing LID and GI-related measures through literature reviews. The research quantified CO2 emissions and absorption by alternatives, applying GDMT to find alternative low-carbon green infrastructure solutions that fit local and environmental conditions during the construction process through case studies related to small stream restoration projects. Carbon emissions and absorption for small stream restoration projects in three scenarios, S-I, S-II, and S-III, using methods such as vegetation shelter blocks, retaining wall blocks, and green infrastructure, constructed in Ha-gok small stream located in Geochang-Gun, Korea were evaluated. The evaluation results indicated that the CO2 emissions by small stream restoration project ranged from 59.6 to 86.7 tons of CO2. The alternative scenarios, such as S-II and S-III, showed varying levels of CO2 emissions, and the S-III scenario demonstrated the lowest emissions with 59.6 tons of CO2. The comparative analysis results revealed that the vegetation shelter blocks and green infrastructure contributed to carbon absorption and the S-III scenario absorbed 52.85% of the emitted CO2.
The research aimed to show that it was difficult to achieve the carbon neutrality goal when the small stream restoration project was completed with the current work type. To calculate the total CO2 emissions of the small river maintenance project, CO2 emissions by project scales and work types were first calculated and analyzed for 63 small stream restoration projects in Yong-in City, Korea. The results demonstrated that the weir and drop structure works contributed significantly to CO2 emissions by accounting for 93.41% of total CO2 emissions, followed by erosion control and re-vegetation work accounting for 3.01% of total CO2 emissions, and earthwork accounting for 2.01% of total CO2 emissions. As a result of analyzing the amount of carbon emissions generated by the small stream restoration projects and the amount of carbon emissions by work type, it was found that the amount of carbon emissions was significantly related to the scale of the small stream restoration project.
A non-linear multiple regression equation was developed to predict CO2 emissions based on the length of the small stream restoration project by analyzing the correlation coefficients between the amounts of CO2 emissions obtained in the research and the characteristic information of 63 small rivers in Yong-in City, Korea. The regression method presented in the research was not perfect, but it could be used to predict future carbon emissions when the entire nationwide small stream restoration project proceeds in the current work types. The results showed that approximately 1,158,840.7 tons of CO2 were emitted from previous small stream restoration projects, and an additional 695,304.4 tons of CO2 would be emitted when all small stream restoration projects distributed nationwide were completed. In addition, the research also highlighted that CO2 absorption could increase by 3.0 to 10.2 times of total emissions by 2030. If the small stream restoration project proceeds in the direction of considering sustainability and carbon reduction effects from a long-term perspective, vegetation is expected to absorb up to 32 times carbon emissions by 2050.
These findings provided valuable insights for policymakers and stakeholders into the potential positive environmental effects of small stream restoration initiatives by suggesting the possibility that the ecological impact of the project could lead to significant CO2 uptake benefits in the long term beyond the initial CO2 emissions. The GDMT, a practice tool developed in the research, might be used to help decision makers choose environmentally sustainable small stream restoration measures at the planning stage by comparing the calculated CO2 emissions and absorption results for each alternative. The GDMT, a practice tool developed in the research, is expected to be used by decision makers to calculate CO2 emissions and absorption for each alternative at the planning stage and compare the results in order to select environmentally sustainable disaster risk management measures.
Author Contributions
Conceptualization, T.S.C.; methodology, T.S.C.; software, T.S.C.; validation, T.S.C. and S.J.; formal analysis, T.S.C.; investigation, T.S.C. and S.J.; resources, T.S.C.; data curation, T.S.C. and S.J.; writing—original draft preparation, T.S.C.; writing—review and editing, T.S.C. and S.J.; visualization, T.S.C. and S.J.; supervision, T.S.C.; project administration, T.S.C. and S.J.; funding acquisition, T.S.C. and S.J. All authors have read and agreed to the published version of the manuscript.
Funding
This research received no external funding.
Data Availability Statement
Datasets that are partially restricted and not publicly available.
Conflicts of Interest
The authors declare that they have no known competing financial interests or personal relationships that could have appeared to influence the work reported in this paper.
References
- Kim, B.; Lee, H.; Park, H.; Kim, H. Greenhouse gas emissions from onsite equipment usage in road construction. J. Constr. Eng. Manag. 2012, 138, 982–990. [Google Scholar] [CrossRef]
- Cho, S.H.; Chae, C.U. The comparative study on the environmental impact assessment of construction material through the application of carbon reducing element-focused on global warming potential of concrete products. Korea Inst. Ecol. Archit. Environ. 2015, 33, 149–156. [Google Scholar]
- Cho, S.; Chae, C. A study on life cycle CO2 emissions of low-carbon building in South Korea. Sustainability 2016, 8, 579. [Google Scholar] [CrossRef]
- EPA (Environmental Protection Agency). Greenhouse Gas (GHG) Emissions; United States Environmental Protection Agency: Washington, DC, USA, 2020. Available online: https://www.epa.gov/ghgemissions (accessed on 22 May 2020).
- MOFA (Ministry of Foreign Affairs). Korea’s Efforts to Address Climate Change. Available online: http://www.mofa.go.kr/eng/wpge/m_5655/contents.do (accessed on 22 May 2020).
- Miralles-Wilhelm, F. Nature-Based Solutions in Agriculture: Sustainable Management and Conservation of Land, Water and Biodiversity; FAO and The Nature Conservancy: Rome, Italy, 2021. [Google Scholar]
- Röck, M.; Saade, M.; Balouktsi, M.; Rasmussen, F.; Birgisdottir, H.; Frischknecht, R.; Habert, G.; Lützkendorf, T.; Passer, A. Embodied GHG emissions of buildings: The hidden challenge for effective climate change mitigation. Appl. Energy 2020, 258, 107–114. [Google Scholar] [CrossRef]
- Nesshöver, C.; Assmuth, T.; Irvine, K.N.; Rusch, G.M.; Waylen, K.A.; Delbaere, B.; Haase, D.; Jones-Walters, L.; Keune, H.; Kovacs, E. The science, policy and practice of nature-based solutions: An interdisciplinary perspective. Sci. Total. Environ. 2017, 579, 1215–1227. [Google Scholar] [CrossRef] [PubMed]
- Sudmeier-Rieux, K.; Ash, N.; Murti, R. Environmental Guidance Note for Disaster Risk Reduction: Healthy Ecosystems for Human Security and Climate Change Adaptation, 2013th ed.; First printed in 2009 as Environmental Guidance Note for Disaster Risk Reduction: Healthy Ecosystems for Human Security; IUCN: Gland, Switzerland, 2013; pp. iii + 34. [Google Scholar]
- Lewthwaite, G.R. Environmentalism and determinism: A search for clarification. Ann. Assoc. Am. Geogr. 1966, 56, 1–23. [Google Scholar] [CrossRef]
- Sun, H.; Park, Y. CO2 Emission Calculation Method during Construction Process for Developing BIM-Based Performance Evaluation System. Appl. Sci. 2020, 10, 5587. [Google Scholar] [CrossRef]
- NDMI (National Disaster Management Institute). Disaster Impact Assessment Strategy for Carbon Neutral Projects in Disaster Management Area; Ministry of Interior and Safety: Sejong, Republic of Korea, 2021.
- Ameli, M.; Mansour, S.; Ahmadi-Javid, A. A sustainable method for optimizing product design with trade-off between life cycle cost and environmental impact. Environ. Dev. Sustain. 2017, 19, 2443–2456. [Google Scholar] [CrossRef]
- Yang, Y. Two sides of the same coin: Consequential life cycle assessment based on the attributional framework. J. Clean. Prod. 2016, 127, 274–281. [Google Scholar] [CrossRef]
- MOLIMA (Ministry of Land, Infrastructure and Maritime Affairs). Carbon Emissions Assessment Program by Facility Ver. 1.2 (IPCC 1996); Ministry of Land, Infrastructure and Maritime Affairs: Sejong, Republic of Korea, 2011.
- KEI (Korea Environment Institute). Development of Model of Integrated Impact and Vulnerability Evaluation (MOTIVE) of Climate Change Impact and Vulnerability by Sector; Korea Adaptation Center for Climate Change (KACCC): Sejong, Republic of Korea, 2020. [Google Scholar]
- KEC (Korea Environment Corporation). Guidelines for Management of Greenhouse Gas and Energy Targets; Korea Environment Corporation: Incheon, Republic of Korea, 2011. [Google Scholar]
- Krishna, I.M.; Manickam, V.; Shah, A.; Davergave, N. Chapter Five—Life Cycle Assessment. In Environmental Management: Science and Engineering for Industry; Butterworth-Heinemann: Oxford, UK, 2017. [Google Scholar]
- Barandica, J.M.; Fernandez-Sanchez, G.; Berzosa, A.; Delgado, J.A.; Acosta, F.J. Applying life cycle thinking to reduce greenhouse gas emissions from road projects. J. Clean. Prod. 2013, 57, 79–91. [Google Scholar] [CrossRef]
- Brondani, M.; de Oliveira, J.S.; Mayer, F.D.; Hoffmann, R. Life cycle assessment of distillation columns manufacturing. Environ. Dev. Sustain. 2020, 22, 5925–5945. [Google Scholar] [CrossRef]
- Cambria, D.; Pierangeli, D. Application of a life cycle assessment to walnut tree (Juglans regia L.) high quality wood production: A case study in southern Italy. J. Clean. Prod. 2012, 23, 37–46. [Google Scholar] [CrossRef]
- de Fatima Castro, M.; Mateus, R.; Braganca, L. A critical analysis of building sustainability assessment methods for healthcare buildings. Environ. Dev. Sustain. 2015, 17, 1381–1412. [Google Scholar] [CrossRef]
- Dias, A.C.; Arroja, L. Environmental impacts of eucalypt and maritime pine wood production in Portugal. J. Clean. Prod. 2012, 37, 368–376. [Google Scholar] [CrossRef]
- Gonzalez-Garcia, S.; Krowas, I.; Becker, G.; Feijoo, G.; Moreira, M.T. Cradle-to-gate life cycle inventory and environmental performance of Douglas-fir roundwood production in Germany. J. Clean. Prod. 2013, 54, 244–252. [Google Scholar] [CrossRef]
- Han, H.S.; Oneil, E.; Bergman, R.D.; Eastin, I.L.; Johnson, L.R. Cradle-to-gate life cycle impacts of redwood forest resource harvesting in northern California. J. Clean. Prod. 2015, 99, 217–229. [Google Scholar] [CrossRef]
- Zhang, S.; Pang, B.; Zhang, Z. Carbon footprint analysis of two different types of hydropower schemes: Comparing earth-rockfill dams and concrete gravity dams using hybrid life cycle assessment. J. Clean. Prod. 2015, 103, 854–862. [Google Scholar] [CrossRef]
- Hischier, R.; Hilty, L. Environmental impacts of an international conference. Environ. Impact Assess. Rev. 2002, 22, 543–557. [Google Scholar] [CrossRef]
- Toniolo, S.; Mazzi, A.; Fedele, A.; Aguiari, F.; Scipioni, A. Life Cycle Assessment to support the quantification of the environmental impacts of an event. Environ. Impact Assess. Rev. 2017, 63, 12–22. [Google Scholar] [CrossRef]
- Kong, A.; Kang, H.; He, S.; Li, N.; Wang, W. Study on the Carbon Emissions in the Whole Construction Process of Prefabricated Floor Slab. Appl. Sci. 2020, 10, 2326. [Google Scholar] [CrossRef]
- IPCC (Intergovernmental Panel on Climate Change). Guidelines for National Greenhouse Gas Inventory; IPCC/IGES: Hayama, Japan, 2006. [Google Scholar]
- Whittaker, A.G. Carbon: A New View of Its High-Temperature Behavior. Science 1978, 200, 763–764. [Google Scholar] [CrossRef] [PubMed]
- Dorney, J.R.; Guntenspergen, G.R.; Keough, J.R.; Stearns, F. Composition and structure of an urban woody plant community. Urban Ecol. 1984, 8, 69–90. [Google Scholar] [CrossRef]
- Rowntree, R.; Nowak, D. Quantifying the role of urban forests in removing atmospheric carbon dioxide. J. Arboric. 1991, 17, 269–275. [Google Scholar] [CrossRef]
- Nowak, D.J.; Crane, D.E. Carbon storage and sequestration by urban trees in the USA. Environ. Pollut. 2002, 116, 381–389. [Google Scholar] [CrossRef]
- KEI (Korea Environment Institute). A Plan for Low Carbon Land Use Considering the Roles of Vegetation and Soil I; Korea Adaptation Center for Climate Change(KACCC): Sejong, Republic of Korea, 2009. [Google Scholar]
- Hong, S.Y.; Zhang, Y.S.; Kim, Y.H.; Kim, M.S. A study on estimating soil carbon storage in Asian countries and Korea. Korean J. Soil Sci. Fertil. 2010, 42, 148–149. [Google Scholar]
- Won, H.; Gu, K.; Jeong, J.; Lee, C.; Lee, Y.; Kim, C. Effects of Forest Disaster Occurrence and Changes in Land Use in Forest on Soil Oxygen Storage. In Proceedings of the Spring Joint Academic Conference and Symposium, Korean Society of Environmental Biology, Seoul, Republic of Korea, April 2002. [Google Scholar]
- Lee, K. Development of Green Space Sustainability Indicators in Apartment Complex. Ph.D. Thesis, Seoul National University, Seoul, Republic of Korea, 2003. [Google Scholar]
- Moon, H.; Lee, G. A Study on the Distribution of Organic Carbon in Water and Forest. J. Korean Ecol. Soc. 2005, 28, 265–270. [Google Scholar]
- Parton, W.J.; Schimel, D.S.; Cole, C.V.; Ojima, D.S. Analysis of Factors Controlling Soil Organic Matter Levels in Great Plains Grasslands. Soil Sci. Soc. Am. J. 1987, 51, 1173–1179. [Google Scholar] [CrossRef]
- Choi, Y.; Wang, Y. Dynamics of carbon sequestration in a coastal wetland using radiocarbon measurements. Glob. Biogeochem. Cycles 2004, 18, 1–12. [Google Scholar] [CrossRef]
- Thom, R.M.; Borde, A.B.; Richter, K.O.; Hibler, L.F. Influence of Urbanization on Ecological Processes in Wetlands. Conference in Land Use and Watersheds: Human Influence on Hydrology and Geomorphology in Urban and Forest Areas; Pacific Northwest National Lab. (PNNL): Richland, WA, USA, 2001; Volume 2, pp. 5–16.
- Whiting, G.J.; Chanton, J.P. Greenhouse carbon balance of wetlands: Methane emission versus carbon sequestration. Tellus Ser. B-Chem. Phys. Meteorol. 2001, 53, 521–528. [Google Scholar] [CrossRef]
- Choi, H.A.; Lee, W.K.; Jeon, S.W.; Kim, J.S.; Kwak, H.B.; Kim, M.N.; Kim, J.U.; Kim, J.T. Quantifying climate change regulating service of forest ecosystem—Focus on quantifying carbon storage and sequestration. Korean Soc. Clim. Chang. Res. 2014, 5, 21–36. [Google Scholar] [CrossRef]
- MOE (Ministry of Environment). Carbon Neutrality Implementation Plan; Ministry of Environment: Sejong, Republic of Korea, 2021.
- RDA (Rural Development Administration). Agricultural and Rural Carbon Neutrality and Adaptation to Climate Change; Ministry of Agriculture, Food and Rural Affairs: Sejong, Republic of Korea, 2021.
- Korea Water. A Report on the Establishment of a Master Plan for LID Application in the Waterfront; Korea Water: Deajeon, Republic of Korea, 2012. [Google Scholar]
- Benayas, J.M.R.; Newton, A.C.; Diaz, A.; Bullock, J.M. Enhancement of biodiversity and ecosystem services by ecological restoration: A meta-analysis. Science 2009, 325, 1121–1124. [Google Scholar] [CrossRef]
- Croux, C.; Gelper, S.; Haesbroeck, G. Regularized Minimum Covariance Determinant Estimator; Mimeo: New York, NY, USA, 2012. [Google Scholar]
- Hubert, M.; Rousseeuw, P.; Verdonck, T. A deterministic algorithm for robust location and scatter. J. Comput. Graph. Stat. 2012, 21, 618–637. [Google Scholar] [CrossRef]
Figure 1.
Four phase conceptual flowchart explaining CO2 emissions plotted as red box and absorptions plotted as green box that may occur in flood risk management projects.
Figure 1.
Four phase conceptual flowchart explaining CO2 emissions plotted as red box and absorptions plotted as green box that may occur in flood risk management projects.

Figure 2.
Comparison results of carbon emissions and absorptions results by scenario.

Figure 3.
Comparisons of the correlation between carbon emissions and characteristic information, such as mean slope, mean height, watershed area, watershed width, channel length and channel sinuosity of the small stream restoration project performed in Young-in City, Republic of Korea.
Figure 3.
Comparisons of the correlation between carbon emissions and characteristic information, such as mean slope, mean height, watershed area, watershed width, channel length and channel sinuosity of the small stream restoration project performed in Young-in City, Republic of Korea.

Figure 4.
Comparisons of predicted CO2 emissions by regression equation developed here with determined values using the GDMT for small stream restoration projects performed in Young-in City, Republic of Korea.
Figure 4.
Comparisons of predicted CO2 emissions by regression equation developed here with determined values using the GDMT for small stream restoration projects performed in Young-in City, Republic of Korea.


Table 1.
Comparisons of the existing toolkit performance levels (O: High, △: Low).
| Toolkits | Accessibility | Compatibility | Program Type | Visualization | Support Area | Since |
|---|---|---|---|---|---|---|
| CECPF | O | O | Excel VBA | △ | Facility | 2006 |
| GECSP | O | O | Excel VBA | △ | Road | 2022 |
| WSGEECT | O | △ | Excel VBA | △ | Energy | 2011 |
| Eco-DM | △ | O | Excel VBA | O | Environmental | 2012 |
| RCEM | O | O | Excel VBA | △ | Road | 2007 |
| SimaPro | △ | △ | Standalone | O | Building | 2021 |
| BEES | O | O | Standalone | O | Building | 2020 |
Table 2.
Classification of LID and GI facilities by function, and disaster and environmental performance level of each facility such as ◎: Very High, O: High, △: Low.
Table 2.
Classification of LID and GI facilities by function, and disaster and environmental performance level of each facility such as ◎: Very High, O: High, △: Low.
| Target | LID and GI Facilities | Performance Level | ||
|---|---|---|---|---|
| Runoff Reduction | Water Resources Protection | Water Quality Enhancement | ||
| Vegetation Filtration | Vegetation filtration zone | O | ◎ | ◎ |
| Rainwater garden | O | ◎ | ◎ | |
| Waterside buffer zone | O | ◎ | ◎ | |
| Vegetation channel | O | ◎ | ◎ | |
| Curb vegetation area | O | ◎ | ◎ | |
| Roof greening | O | △ | O | |
| Pathway flower bed | O | ◎ | ◎ | |
| Tree filtration box | O | ◎ | ◎ | |
| Infiltration | Infiltration reservoir | ◎ | ◎ | O |
| Permeability assurance | ◎ | ◎ | O | |
| Perforated pipe | ◎ | ◎ | O | |
| Infiltration sidewalk | ◎ | ◎ | O | |
| Infiltration ditch | ◎ | ◎ | O | |
| Infiltration barrel | ◎ | ◎ | O | |
| Infiltration pot | ◎ | O | O | |
| Water retention pavement | O | ◎ | O | |
| Retention | Rainwater ponds | O | ◎ | ◎ |
| Artificial wetlands | O | ◎ | ◎ | |
| Reservoirs | O | ◎ | ◎ | |
| Underground storage tanks | ◎ | O | O | |
| Rainwater Utilization | Rainwater utilization facility | ◎ | ◎ | O |
| Multi-source water supply system | ◎ | ◎ | O | |
| Flood Control | Flow distribution device | ◎ | ◎ | O |
| Large-diameter storm-water pipe | ◎ | O | O | |
| Temporary storage embankment | ◎ | O | ◎ |
Table 3.
Summary of total quantities of used materials and equipment corresponding to the restoration project for the Ha-gok small stream located in Geochang-Gun, Korea, based on three scenarios: S-I, S-II and S-III.
Table 3.
Summary of total quantities of used materials and equipment corresponding to the restoration project for the Ha-gok small stream located in Geochang-Gun, Korea, based on three scenarios: S-I, S-II and S-III.
| Work Type | Processes | Unit | Total Quantity | ||
|---|---|---|---|---|---|
| S-I | S-II | S-III | |||
| Earth Works | Cutting Soil | m3 | 412 | 412 | 412 |
| Digging Soil | m3 | 120 | 120 | 120 | |
| Backfilling (Soil) | m3 | 118 | 118 | 136 | |
| Cleaning up Soil | m3 | 354 | 354 | 354 | |
| Breaking Groundless Concrete | m3 | 9.8 | 9.8 | 9.8 | |
| Loading Waste | m3 | 9.8 | 9.8 | 9.8 | |
| Embankment Works | Installing Retaining Wall Block | m2 | 300 | 300 | 300 |
| Block Stuffing (Soil) | m3 | 42 | 75 | 75 | |
| Block Stuffing (Stone) | m3 | 18 | 36 | 36 | |
| Nonwoven Fabric | m2 | 300 | 300 | 300 | |
| Backfilling (Stone) | m3 | 114 | 90 | 90 | |
| Concrete treated base | m3 | 66.1 | 60 | 60 | |
| Euro form | m2 | 183.2 | 180 | 180 | |
| Vegetation shelter block | m2 | - | 120 | 120 | |
| Drainage Works Structure Works | Waterproofing Sheet (PE) | m | 9 | 9 | 9 |
| Concrete treated base | m3 | 9.1 | 9.1 | 9.1 | |
| Euro form | m2 | 32.4 | 32.4 | 32.4 | |
| Reinforcement Assembling | ton | 0.324 | 0.324 | 0.324 | |
| Transportation Works | Heavy Machinery | Number | 1 | 1 | 1 |
| Retaining Wall Block | Number | 936 | 936 | 936 | |
| Stone | m3 | 137 | 137 | 137 | |
| Ready-mixed Concrete | m3 | 72 | 72 | 72 | |
| Rebar | ton | 0.324 | 0.324 | 0.324 | |
| Polyethylene (PE) Pipe | m | 9 | 9 | 9 | |
| Grass | m2 | - | 120 | 120 | |
| Planting Works | Tulip Tree | Tree | - | - | 150 |
| Cherry | Tree | - | - | 150 | |
| Ginkgo | Tree | - | - | 150 | |
| Sheep’s principal Tree | Tree | - | - | 2700 | |
| Zoysia Tenifolia | m2 | - | - | 265 | |
Table 4.
Summary of the CO2 emission and absorption factors per unit results for detailed equipment operation and materials used corresponding to the restoration project for the Ha-gok small stream located in Geochang-Gun, Republic of Korea, based on three scenarios: S-I, S-II and S-III.
Table 4.
Summary of the CO2 emission and absorption factors per unit results for detailed equipment operation and materials used corresponding to the restoration project for the Ha-gok small stream located in Geochang-Gun, Republic of Korea, based on three scenarios: S-I, S-II and S-III.
| Work Type | Processes | CO2 Emission Factor | CO2 Absorption Factor | ||
|---|---|---|---|---|---|
| Materials (kgCO2/Unit) | Equipment (kgCO2/Unit) | Tree (kgCO2/m2/yr) | Plants (kgCO2/m2/yr) | ||
| Earth Works | Cutting Soil | 0.36 | |||
| Digging Soil | 0.36 | ||||
| Backfilling (Soil) | 0.36 | ||||
| Cleaning up Soil | 0.36 | ||||
| Breaking Groundless Concrete | 26.56 | ||||
| Loading Waste | 0.36 | ||||
| Embankment Works | Installing Retaining Wall Block | 346.00 | 13.41 | ||
| Block Stuffing (Soil) | 0.82 | ||||
| Block Stuffing (Stone) | 0.91 | ||||
| Nonwoven Fabric | 346.00 | 13.41 | |||
| Backfilling (Stone) | 0.91 | ||||
| Concrete treated base | 346.00 | 1.83 | |||
| Euro form | 183.2 | ||||
| Vegetation shelter block | 6.64 | ||||
| Drainage Works | Waterproofing Sheet (PE) | 2.37 | 9.06 | ||
| Structure Works | Concrete treated base | 346.00 | 1.83 | ||
| Euro form | 183.2 | ||||
| Reinforcement Assembling | 2340.00 | 0.324 | |||
| Planting Works | Tulip Tree | 101.9 | |||
| Cherry | 26.9 | ||||
| Ginkgo | 35.4 | ||||
| Sheep’s principal Tree | 55.6 | ||||
| Zoysia Tenifolia | 1.80 | ||||
Table 5.
Comparison of carbon emissions by work type for a small stream restoration project.
| Work Type | Total Carbon Emission (tonCO2) | Mean Carbon Emission per Small Stream (tonCO2/Stream) | Ratio (%) |
|---|---|---|---|
| Soil Removal | 147,592 | 1180.7 | 0.5 |
| Embankment | 56,773 | 454.2 | 0.2 |
| Backfilling (Soil) | 40,026 | 320.2 | 0.1 |
| Cleaning up Soil | 359,714 | 2877.7 | 1.2 |
| Erosion control and re-vegetation | 904,235 | 7233.9 | 3.1 |
| Weir and Drop Structure | 28,034,976 | 224,279.8 | 94.9 |
Disclaimer/Publisher’s Note: The statements, opinions and data contained in all publications are solely those of the individual author(s) and contributor(s) and not of MDPI and/or the editor(s). MDPI and/or the editor(s) disclaim responsibility for any injury to people or property resulting from any ideas, methods, instructions or products referred to in the content. |
© 2024 by the authors. Licensee MDPI, Basel, Switzerland. This article is an open access article distributed under the terms and conditions of the Creative Commons Attribution (CC BY) license (https://creativecommons.org/licenses/by/4.0/).
Share and Cite
MDPI and ACS Style
Cheong, T.S.; Jeong, S. Development of Green Disaster Management Toolkit to Achieve Carbon Neutrality Goals in Flood Risk Management. Hydrology 2024, 11, 44. https://0-doi-org.brum.beds.ac.uk/10.3390/hydrology11040044
AMA Style
Cheong TS, Jeong S. Development of Green Disaster Management Toolkit to Achieve Carbon Neutrality Goals in Flood Risk Management. Hydrology. 2024; 11(4):44. https://0-doi-org.brum.beds.ac.uk/10.3390/hydrology11040044
Chicago/Turabian StyleCheong, Tae Sung, and Sangman Jeong. 2024. "Development of Green Disaster Management Toolkit to Achieve Carbon Neutrality Goals in Flood Risk Management" Hydrology 11, no. 4: 44. https://0-doi-org.brum.beds.ac.uk/10.3390/hydrology11040044
Note that from the first issue of 2016, this journal uses article numbers instead of page numbers. See further details here.