Article

Analysis of the Impact of Hydraulic Gates on a Stabilized Tidal Inlet Structure: Mathematical Model and Data Measurements

by
Alfonso Arrieta-Pastrana
1,
Oscar E. Coronado-Hernández
1 and
Vicente S. Fuertes-Miquel
2,*
1
Instituto de Hidráulica y Saneamiento Ambiental, Universidad de Cartagena, Cartagena 130001, Colombia
2
Departamento de Ingeniería Hidráulica y Medio Ambiente, Universitat Politècnica de València, 46022 Valencia, Spain
*
Author to whom correspondence should be addressed.
Submission received: 23 February 2024 / Revised: 25 March 2024 / Accepted: 28 March 2024 / Published: 29 March 2024

Abstract

:
Tidal inlet structures are engineering projects with associated benefits related to flood control, water quality enhancement, and coastal protection. This study analyzes the performance of hydraulic gates on a stabilized inlet in estuarine systems by developing a simplified hydraulic model that considers inlet and outlet water levels. The proposed model was applied to the stabilized tidal inlet structure in Cartagena de Indias, Colombia. This model offers a practical tool for engineers and designers operating estuarine systems. The analysis focuses on the coastal lagoon of Ciénaga de la Virgen. The proposed model was successfully calibrated using two water sensors, with extreme input and outlet flow rates of approximately 260 m3/s and 110 m3/s, respectively. The average daily output volume in the system is 3,361,000 m3, while the average daily input volume is 3,200,000 m3. Consequently, the manipulation of the opening gates results in a decrease in the estuarine water level, potentially by as much as 25 cm, which local authorities can use to make decisions to reduce extreme water levels during flooding events.

1. Introduction

Stabilized tidal inlet structures (STIS) installed at the discharge points of estuarine systems have piqued the authorities’ interest due to their potential environmental, flood control, and coastal protection benefits [1]. The hydrodynamic behavior within an estuarine system is complicated to analyze, given the interactions of various water bodies such as seas or oceans, urban channels, lagoons, creeks, and bays [2]. One-dimensional hydrodynamic models have been developed based on tidally averaged data [2]. More advanced models involve the numerical resolution of the Navier–Stokes equations in two dimensions [3]. For instance, the Coastal Modeling System calculates hydrodynamic circulation based on depth-averaged two-dimensional models, which have been employed to simulate the hydrodynamic processes of tidal inlet structures [4]. Over the last few decades, the implementation of three-dimensional models has been on the rise, fueled by the availability of more robust computational resources.
Consequently, complex interactions, such as those found in wetland–estuarine–shelf systems, have been analyzed using three-dimensional models [5]. The modeling and design of coastal systems can be facilitated by tools such as the Coastal Modeling System (SMC), developed by the Universidad de Cantabria in Spain [6,7], as well as the Hydrodynamic module of MIKE 3 powered by DHI, which offers applications for hydraulic issues in coastal and estuarine systems [8]. The numerical resolution of 2D and 3D mathematical models has primarily employed finite difference methods. An alternative solution is applying water balance in estuarine systems considering boundary conditions [9,10], through which coastal lagoons have been successfully validated. More intricate models entail a more significant number of parameters, as occurs in 2D and 3D hydrodynamics models [11,12,13], rendering the implementation of a suitable simulation for an estuarine water system more costly compared to simpler models (water balance), especially in developing countries where in some cases the budget for licenses for commercial software for local authorities can be limited.
The STIS located at the coastal lagoon of Ciénaga de la Virgen (also known as “Ciénaga de Tesca shallow lagoon”) has attracted the interest of many researchers since it holds paramount significance for the city of Cartagena, as it has provided hydraulic, environmental, and social services for the past 50 years [14,15]. The STIS is also known as “bocana de marea estabilizada” in Spanish. The STIS was planned when the local authorities found water quality issues in this water body because of the rising population trend [14]. Subsequently, they built an STIS, aiming to enhance the estuarine system. This initiative stemmed from an agreement between the Colombian and Dutch governments between 1994 and 2000. The operation of the STIS commenced at the onset of 2001. The circulation and dynamics of the estuarine system have undergone analysis through various studies to verify the effectiveness of water quality treatment from its inception to the present day. Before 2000, during rainy seasons, the coastal lagoon of Ciénaga de la Virgen was interconnected with the Caribbean Sea via several natural channels, with the branch channel towards La Boquilla being the most significant. However, since 2000, the operation of the STIS has intermittently resulted in the closure of the branch channel towards La Boquilla during rainy seasons. Currently, water discharge primarily occurs through the hydraulic gates of the STIS outlet. The coastal lagoon of Ciénaga de la Virgen serves as the primary hydraulic downstream control for numerous channels within Cartagena. Typically, the environmental authority in Cartagena, known as Establecimiento Público Ambiental, operates the outlet gates of the STIS to mitigate flooding in neighborhoods surrounding the coastal lagoon of Ciénaga de la Virgen. For example, this action was notably taken on 18 October 2011, and 14 November 2020, when flooding in the city affected many people [16].
The modeling of STIS has been studied as an integral part of estuarine systems, considering the mathematical behavior of hydraulic devices [1,17], which is of utmost importance since its operation also plays an essential role in treating issues related to water quality in estuarine systems [18,19,20].
This research presents the development of a mathematical model tailored to simulate an STIS system for an estuarine system. The proposed model is grounded in the continuity equation for estuarine systems and the hydraulic behavior of sluice gates. The implementation of the proposed model requires combining it with water level measurements for calibration. The model accounts for the operation of inlet and outlet hydraulic gates, considering that flow rate can occur in two directions: from the estuarine system to the sea or ocean, and vice versa. The primary advantage of the proposed model is its reliance solely on the discharge coefficients of sluice gates as calibration parameters, as opposed to employing complex hydrodynamic models. The proposed model is general and can be implemented in estuarine systems with STIS.
Moreover, the proposed model was also applied to the STIS located at the coastal lagoon of Ciénaga de la Virgen. Two water-level sensors were installed to calibrate the proposed model. The results demonstrate the model’s effectiveness in simulating flow rate interactions and establishing operational programs to mitigate flooding water levels in the analyzed water body.

2. Materials and Methods

This study introduces a simplified hydraulic model predicated on inlet and outlet water flows of an STIS, with the discharge coefficients of gates being the sole calibration parameter. The authors first present the proposed mathematical model, followed by a demonstration of its application through a case study.

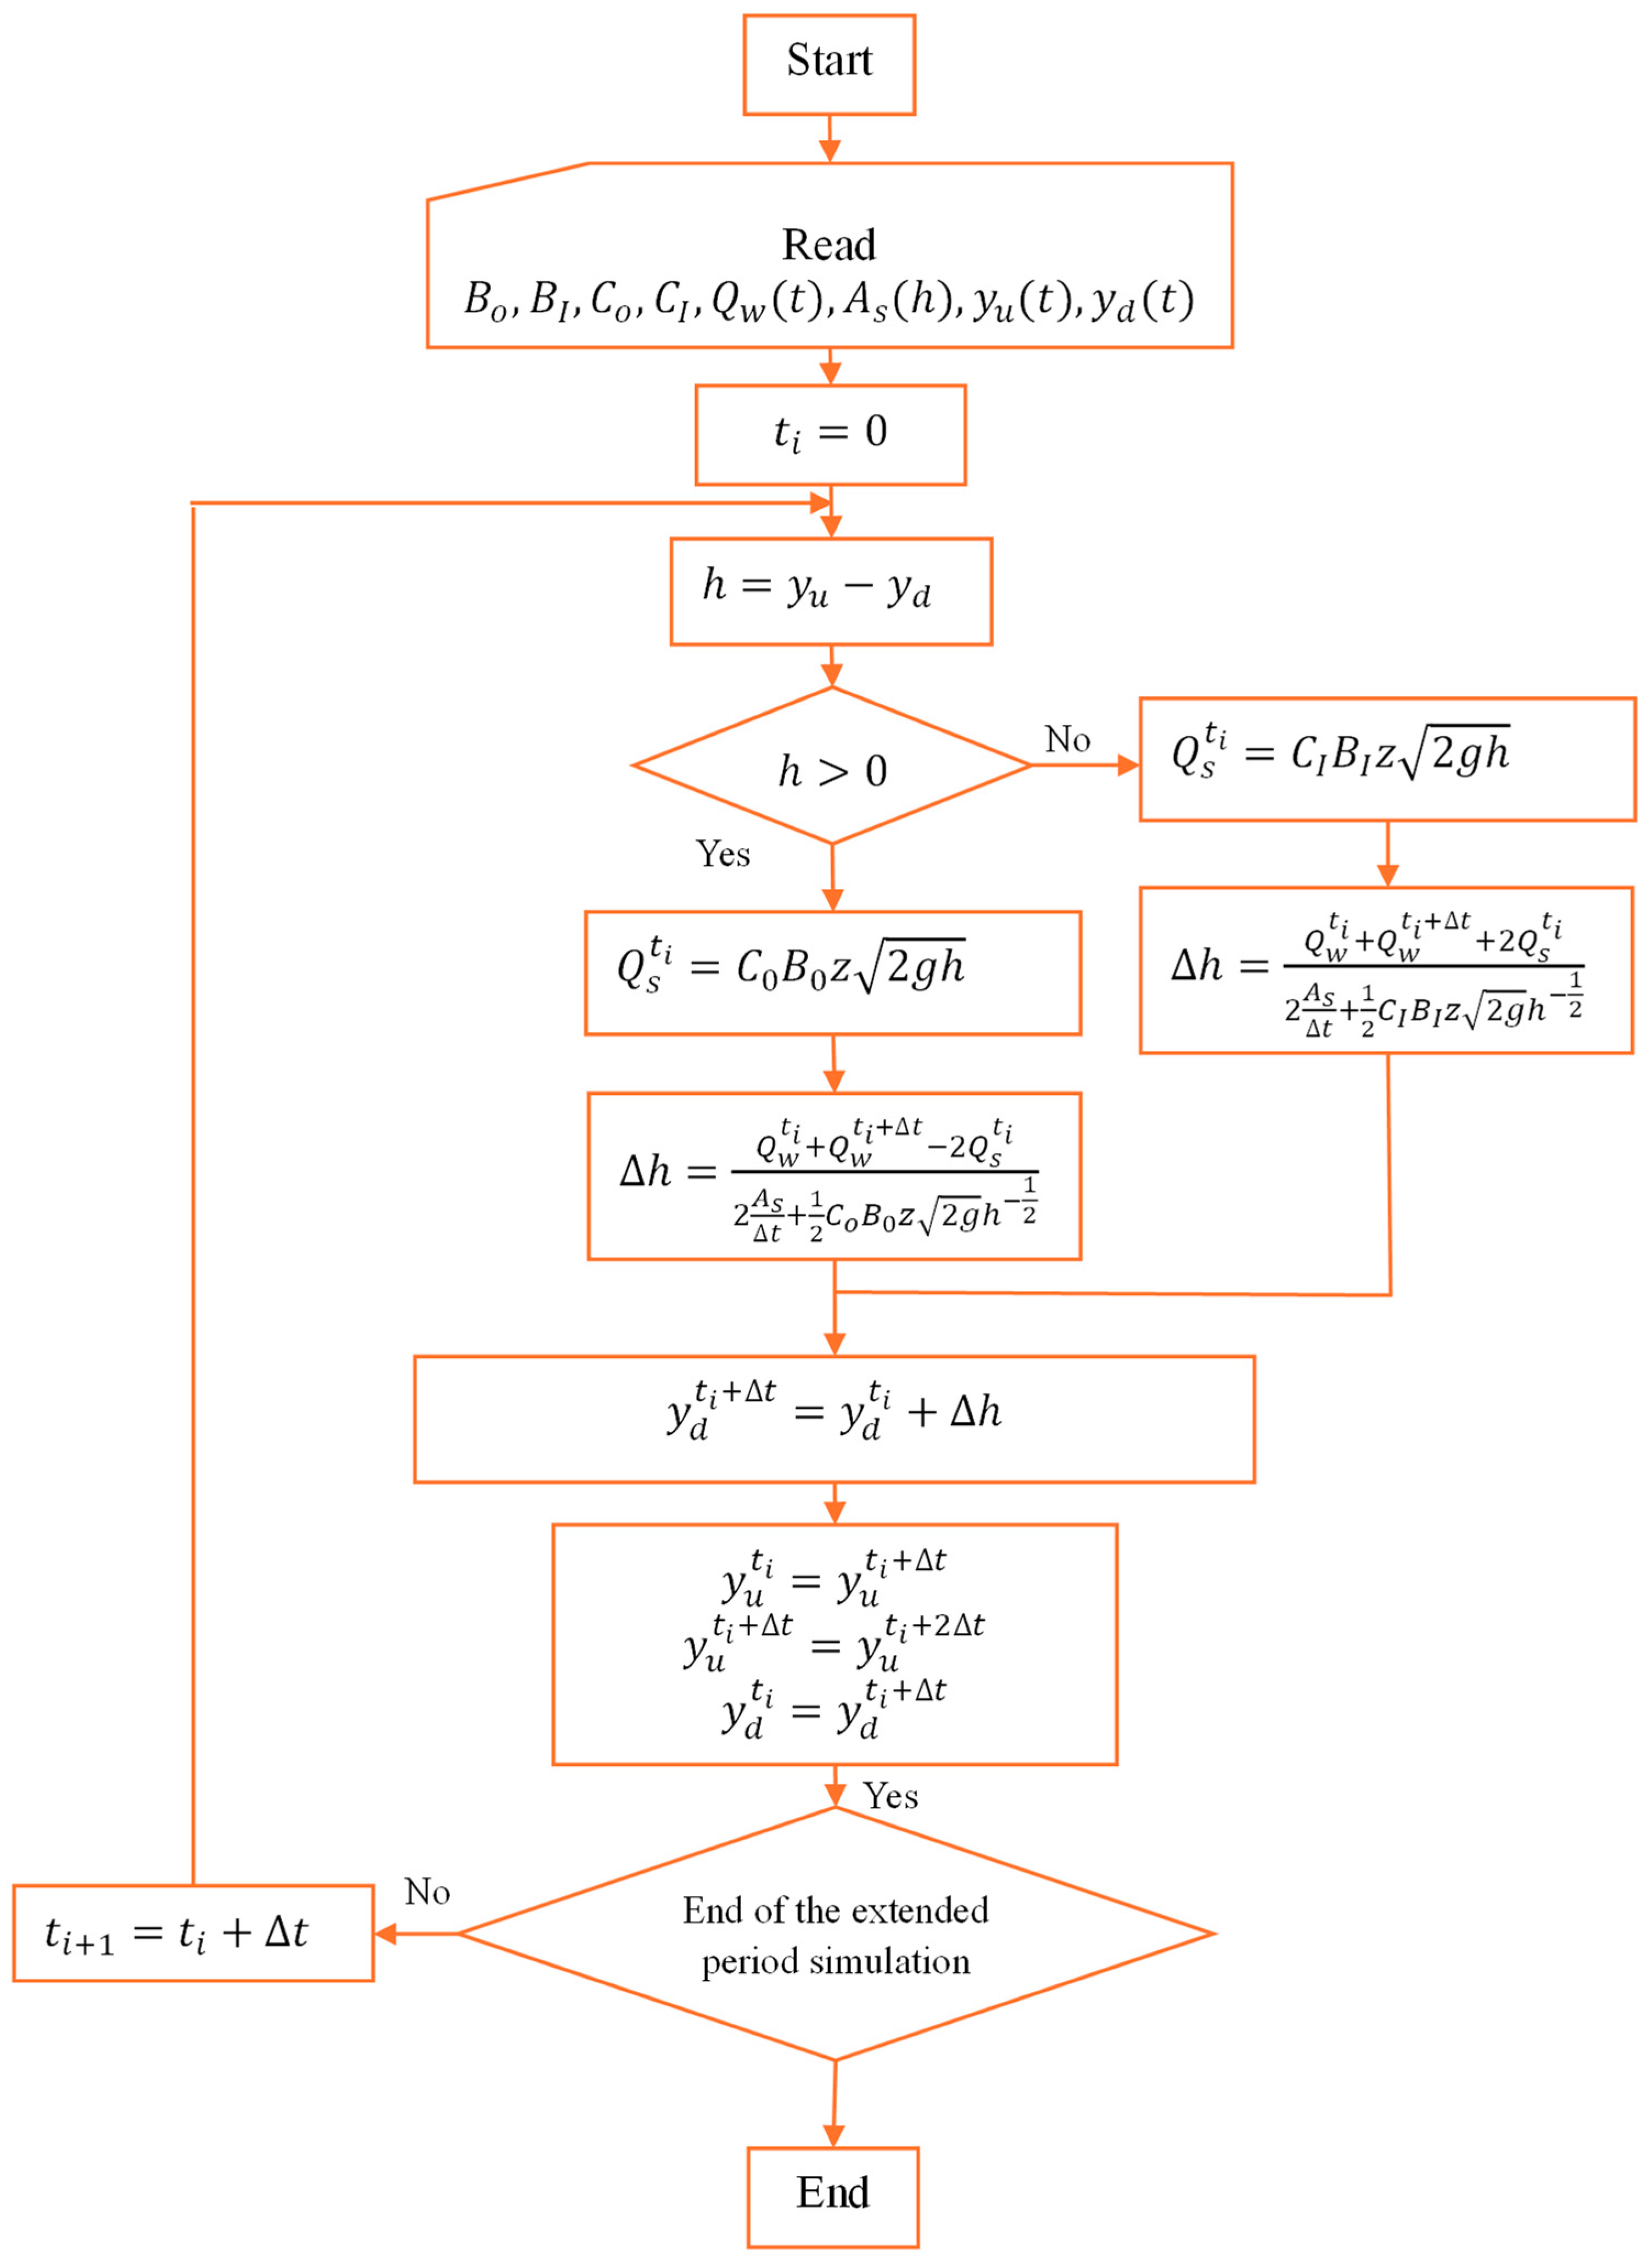
2.1. Mathematical Model

Figure 1 presents a cross-sectional view of the behavior of water levels moving through a gate with a width B and height z. y u and y d represent upstream and downstream water levels (m) in two directions (from the estuarine system to the sea or ocean, or vice versa), h is the hydraulic head (m), and h is the variation of h over time. The STIS is ideally a short, narrow infrastructure that should provide a suitable flow rate in both directions.
The representation of an estuarine system in combination with an STIS is shown in Figure 2. Inlet and outlet gates are in an STIS, where an outlet hydrograph ( Q s ) is generated over time. If the flow comes out of an estuarine system, then a positive value of Q s is obtained; otherwise, Q s takes a negative value. Surface area ( A s ) varies over time, considering inlet and outlet flows in a water body. The hydrograph generated by run-off in all watersheds is represented as Q w . For calculation, a time step ( t ) must be defined depending on time concentrations of associated watersheds.
The proposed model has the following assumptions:
  • A water balance suffices to depict the key variables within an estuarine system.
  • Evaporation and infiltration processes are neglected during simulations, which is a valid approach, particularly since these present low water volumes compared to the outlet or inlet water volumes of seas or oceans. The water density remains constant, as the numerical value of seawater density fluctuates only after the third decimal point.
Applying the conservation of mass considering intermediate storage values for a time step ( t ) , thus:
= ( Q w ± Q s ) t
where = variation of stored volume of an estuarine system (m3).
The energy losses in hydraulic gates can be computed as a function of head velocity (see Figure 3), and then the flow rate is given by
Q = C B z 2 g h
where Q = flow rate through a gate (m3/s), C = discharge coefficient, z = average height of the gate measured in a vertical direction (m), B = net width of gates (m), h = hydraulic head (m), and g = gravitational acceleration (m/s2). Equation (2) is applicable for a submerged rectangular orifice with constant pressure. The hydraulic head is computed as the difference between upstream ( y u ) and downstream ( y d ) water levels.
The inflow and outflow volumes of an STIS are computed based on the hydrographs depicted in Figure 2 for a time step t . Thus, the computation of stored volume is conducted assuming a constant surface area ( A s ) of an estuarine system over an interval h :
Q w t + Q w t + t 2 t Q s t + Q s t + t 2 t = A s h
The outlet flow rate through hydraulic gates for time t is
Q s t = C 0 B 0 z 2 g h
where the subscript 0 refers to outlet gates (water rate flowing from an estuarine system to the sea).
In addition, for a time t + t , the flow rate is Q s t + t = C o B 0 z 2 g ( h + h ) where h = difference of water levels between time t and t + t .
Applying the binomial theorem for a second order approximation, then
( h + h ) 1 / 2 h 1 / 2 + 1 2 h 1 / 2 h
Therefore, the outlet flow rate at a STIS at time t + t is computed as
Q s t + t = C o B 0 z 2 g h 1 / 2 + 1 2 C o B 0 z 2 g h 1 / 2 h
Upon substituting Equation (6) into Equation (3) and reorganizing terms, then
Q w t + Q w t + t Q s t = h 2 A s t + 1 2 C 0 B 0 z 2 g h 1 2 + C 0 B 0 z 2 g h 1 / 2
Finally, the h value is calculated as follows:
h = Q w t + Q w t + t Q s t C o B 0 z 2 g h 1 / 2 2 A s t + 1 2 C o B 0 z 2 g h 1 2 = Q w t + Q w t + t 2 Q s t 2 A s t + 1 2 C o B 0 z 2 g h 1 2
Equation (8) is employed for low tidal values when the water flow moves from an estuarine system to the sea.
Likewise, for an ascending tidal trend, the influx of flow from the sea to the estuarine system can be calculated as follows:
h = Q w t + Q w t + t + 2 Q s t 2 A s t + 1 2 C I B I z 2 g h 1 2
The subscript I refers to inlet gates (representing the water rate from the sea to an estuarine system). Equation (9) is based on an explicit finite difference discretization method.
Figure 3 presents a flowchart for computing outlet water levels for each time step t through a numerical resolution of the mathematical model. The analysis continues until the end of the extended period simulation.

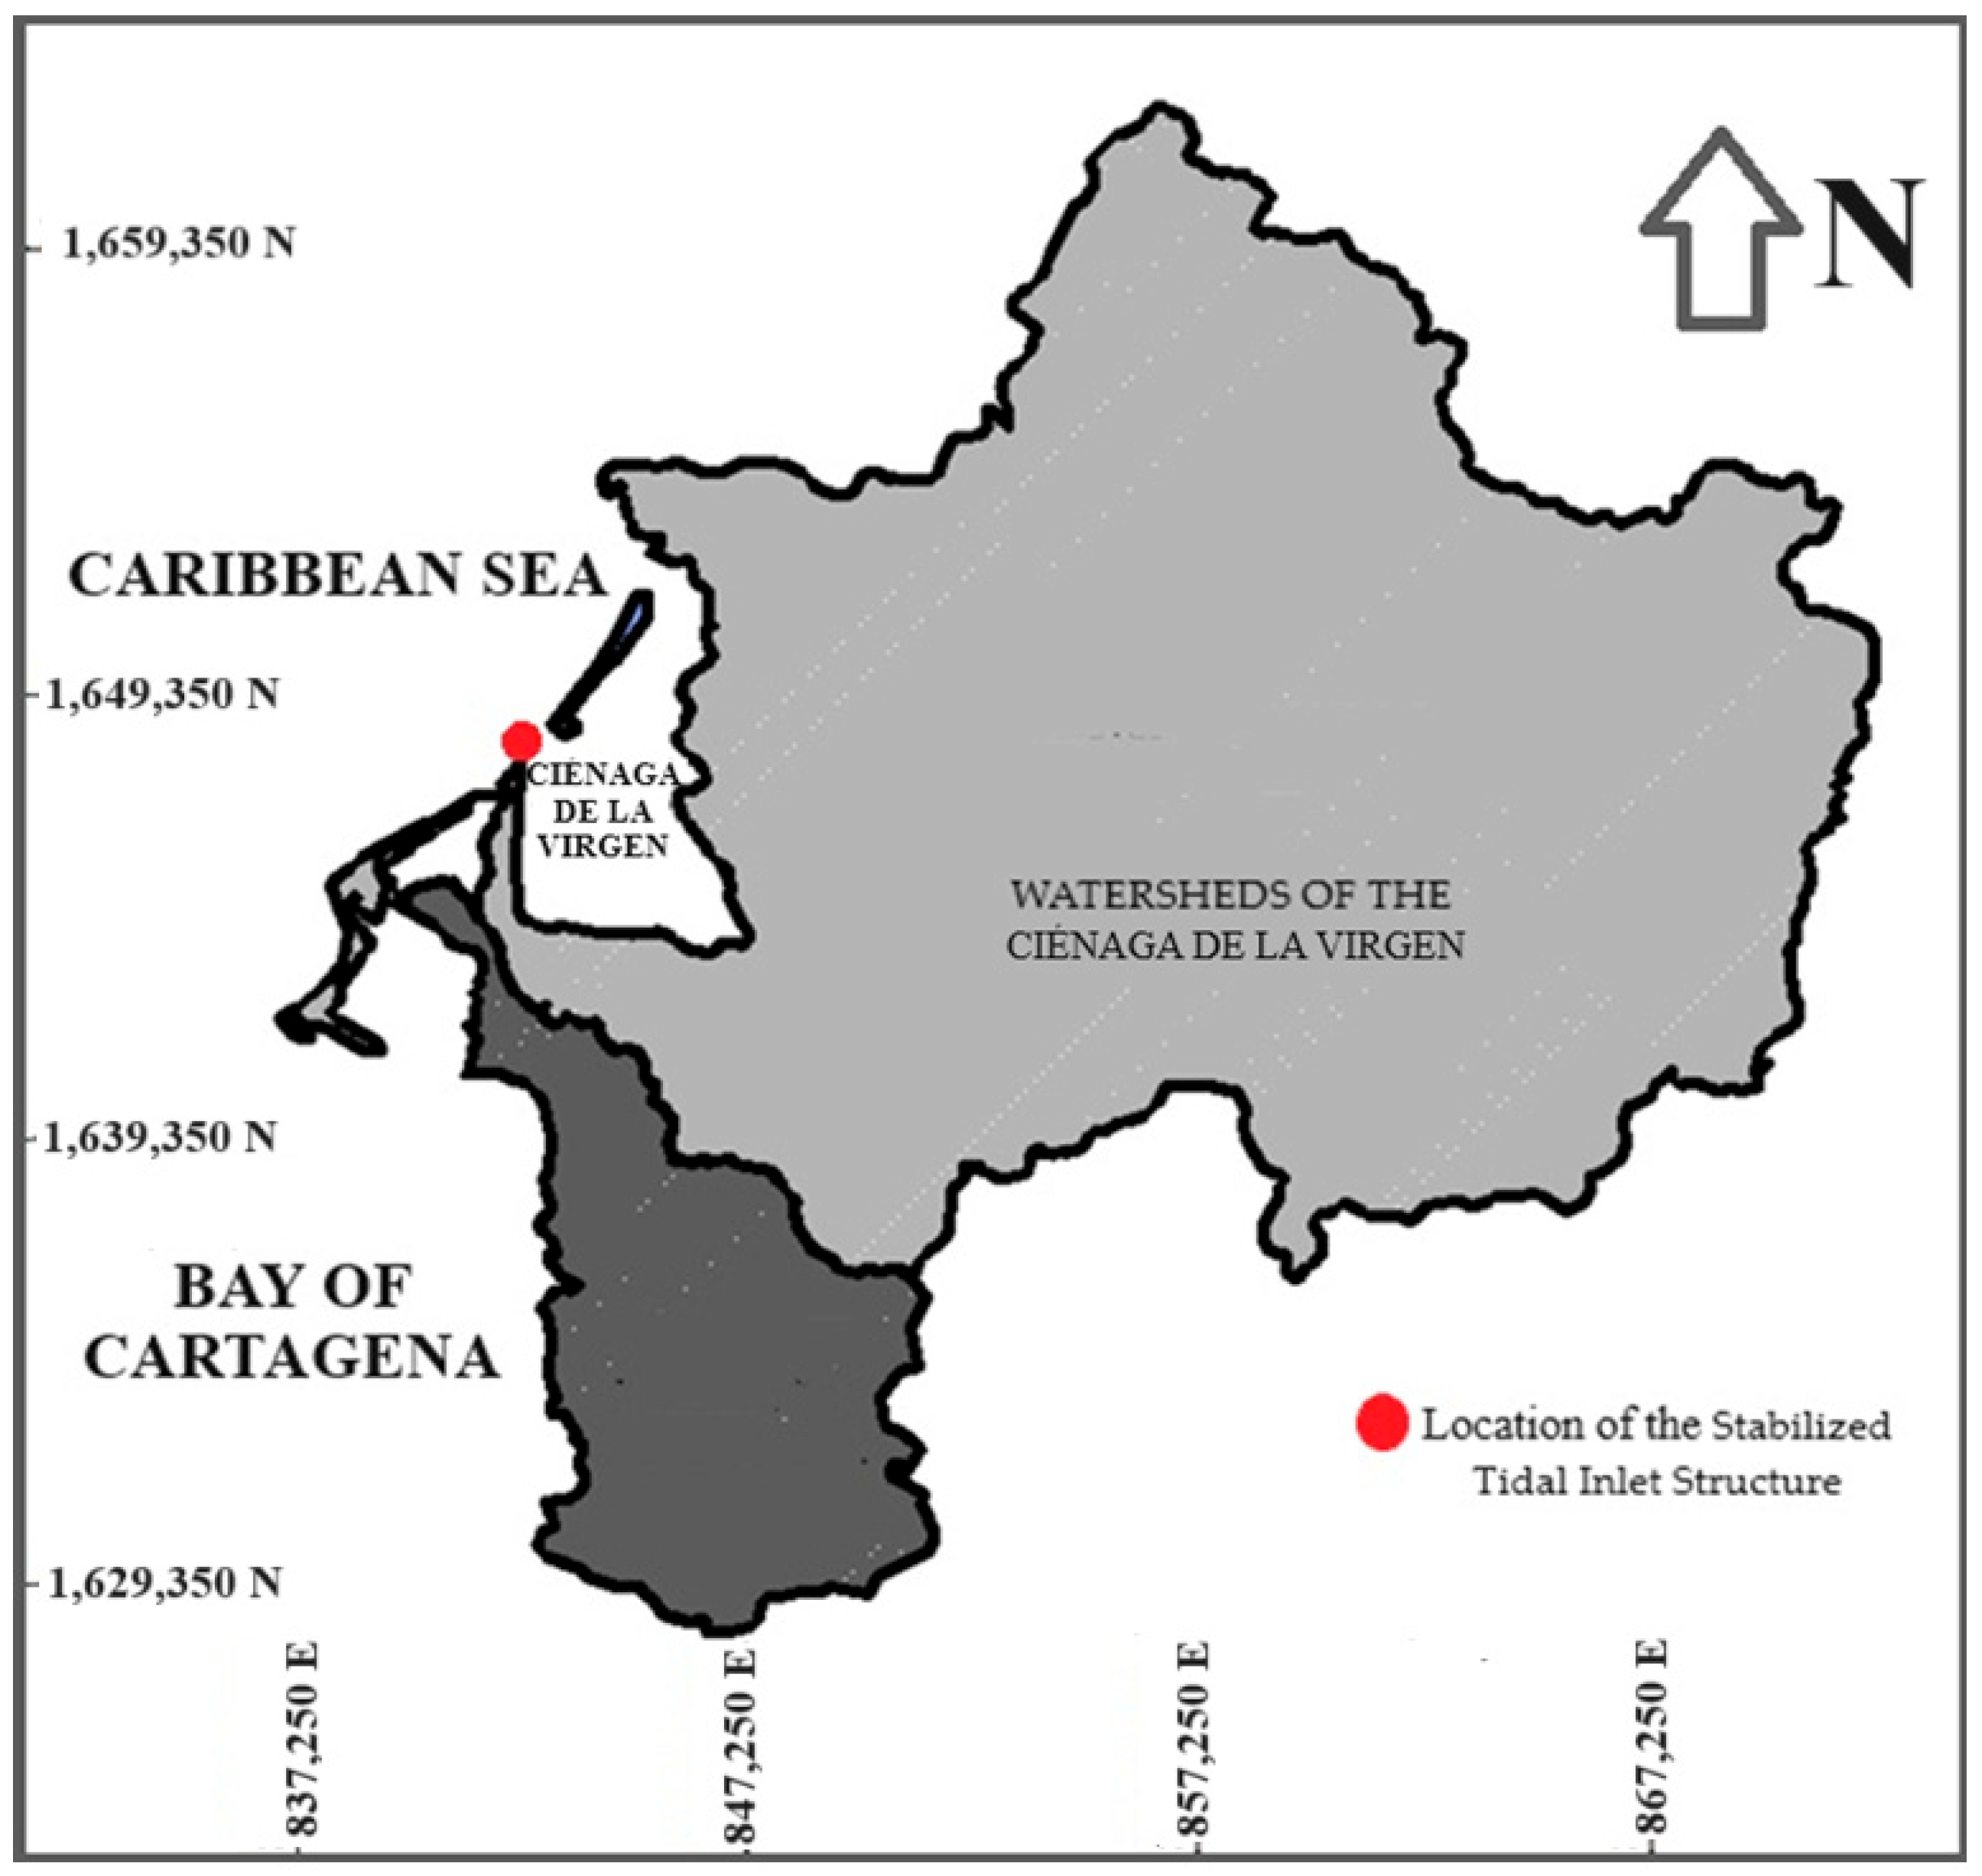
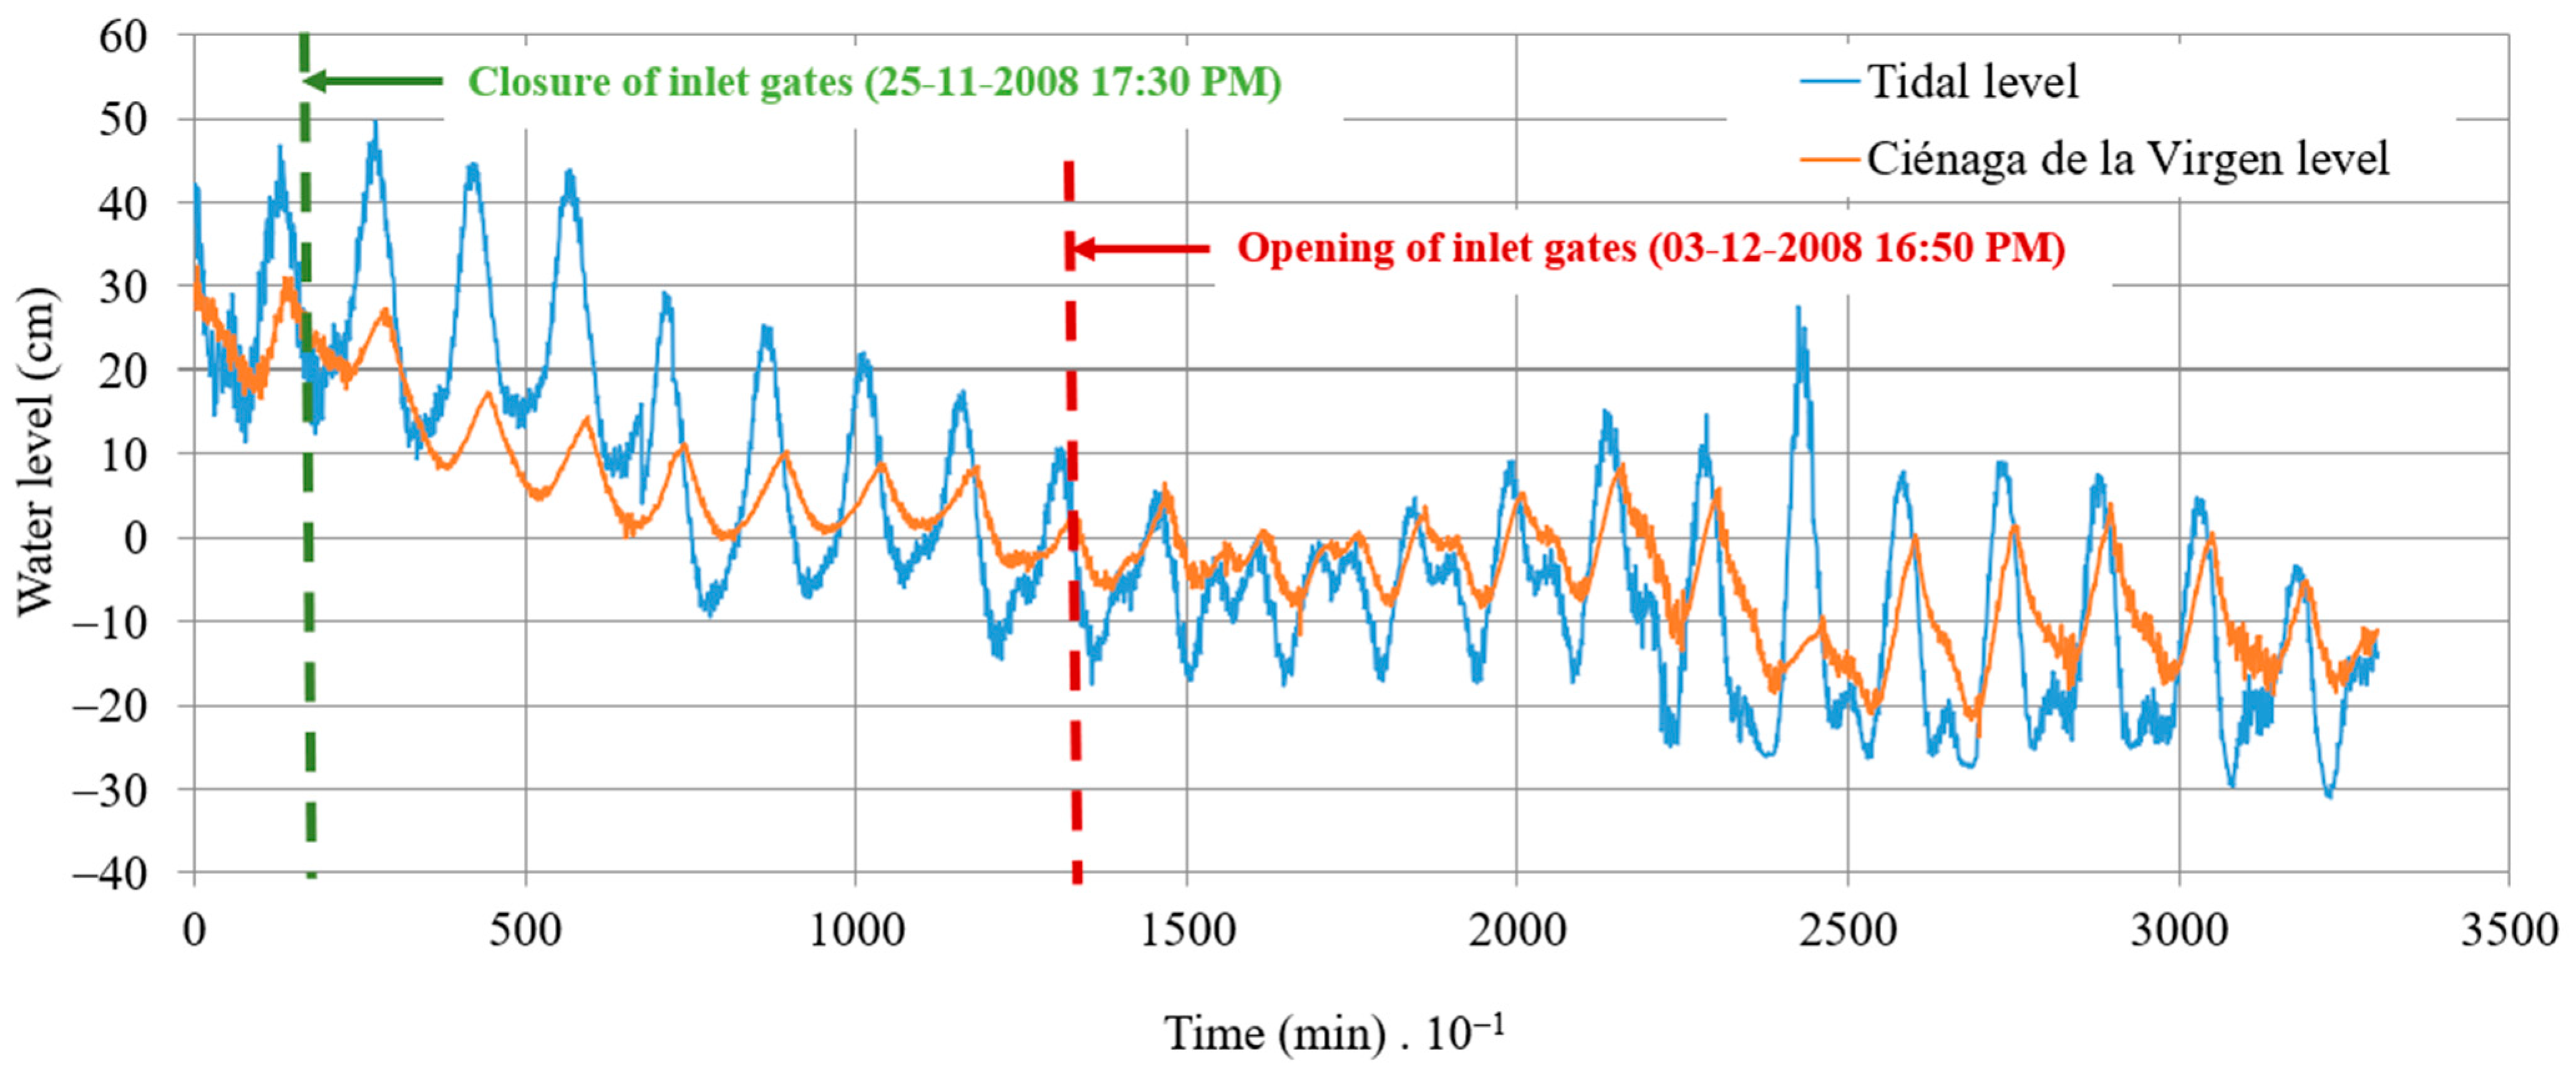
2.2. Case Study and Data

The coastal lagoon of Ciénaga de la Virgen is located at the northernmost part of Cartagena, with coordinates 10° N and 75° W. This water body is separated from the Caribbean Sea by a ridge of gathered sand at La Boquila, which has a wide range from 400 to 800 m. It has a morphodynamical triangle shape with a total width of 4.5 km and a length of 7.0 km. The coastal lagoon of Ciénaga de la Virgen links to the bay of Cartagena through a lagoon and channel system covering an area of around 100 ha, composed of the swamp of Las Quintas, the El Bazurto channel, the lagoons of San Lazaro, Chambacú, and Cabrero, and the Juan Angola channel. The watershed of the Ciénaga de la Virgen ranges from 0 to 10 m.a.s.l, the hill of La Popa’s highest point. The predominant vegetation of this coastal lagoon is mangrove, which has been affected mainly by the population located around this body of water [21]. Figure 4 presents the location of the analyzed estuarine system. It is an estuary system with a total surface area ( A s ) of 22 km2. It drains numerous watersheds, covering a total area of around 500 km2. It is classified as a micro-mareal estuary, as its tidal range is less than 2 m.
The STIS comprises two sets of horizontal gates: the first comprises six (6) units designed to control the flow from the Caribbean Sea into the coastal lagoon of Ciénaga de la Virgen. In contrast, the second group consists of four (4) units configured to regulate the flow from the lagoon to the Caribbean Sea, as illustrated in Figure 5. All hydraulic gates have a width of 6 m and operate at an average height of 3 m. The total net widths for the inlet and outlet gates are 36 and 24 m, respectively. A sheet pile was built to separate the two flow directions. The total widths of inlet and outlet gates are 44.94 and 30.74 m, respectively, which include lengths of piers and the abutment of the STIS.
Two water level sensors, with a recording interval of 10 min, have been installed in the approach channel and within the small internal dock of the coastal lagoon of Ciénaga de la Virgen (refer to Figure 5). The WL16 water level logger sensors [22], comprising a datalogger and pressure transducer, were installed as a reference to collect data for this research. The measurement devices operate at a frequency of 10 times per second and can accommodate depths ranging from 0.9 to 152 m. Water levels were monitored from 24 November to 17 December 2008. According to the data, from 24 November (at 13:10) to 25 November (at 17:20), the STIS was affected by tidal levels, and the ten gates were operating, as shown in Figure 6, from 0 to 1700 min. Subsequently, the six hydraulic gates directing flow towards the coastal lagoon of Ciénaga de la Virgen were manually closed, causing the water surface to shift from this water body to the Caribbean Sea from 1710 to 13,190 min (Figure 6). On 3 December, the operation of the STIS was restored by reopening the six hydraulic gates until the end of the recording period (from 13,200 to 32,990 min). Figure 6 displays the measured water levels in the approach channel (solid line) and the dock of the coastal lagoon of Ciénaga de la Virgen (dashed line), referred to as measured tidal and coastal lagoon levels, respectively.

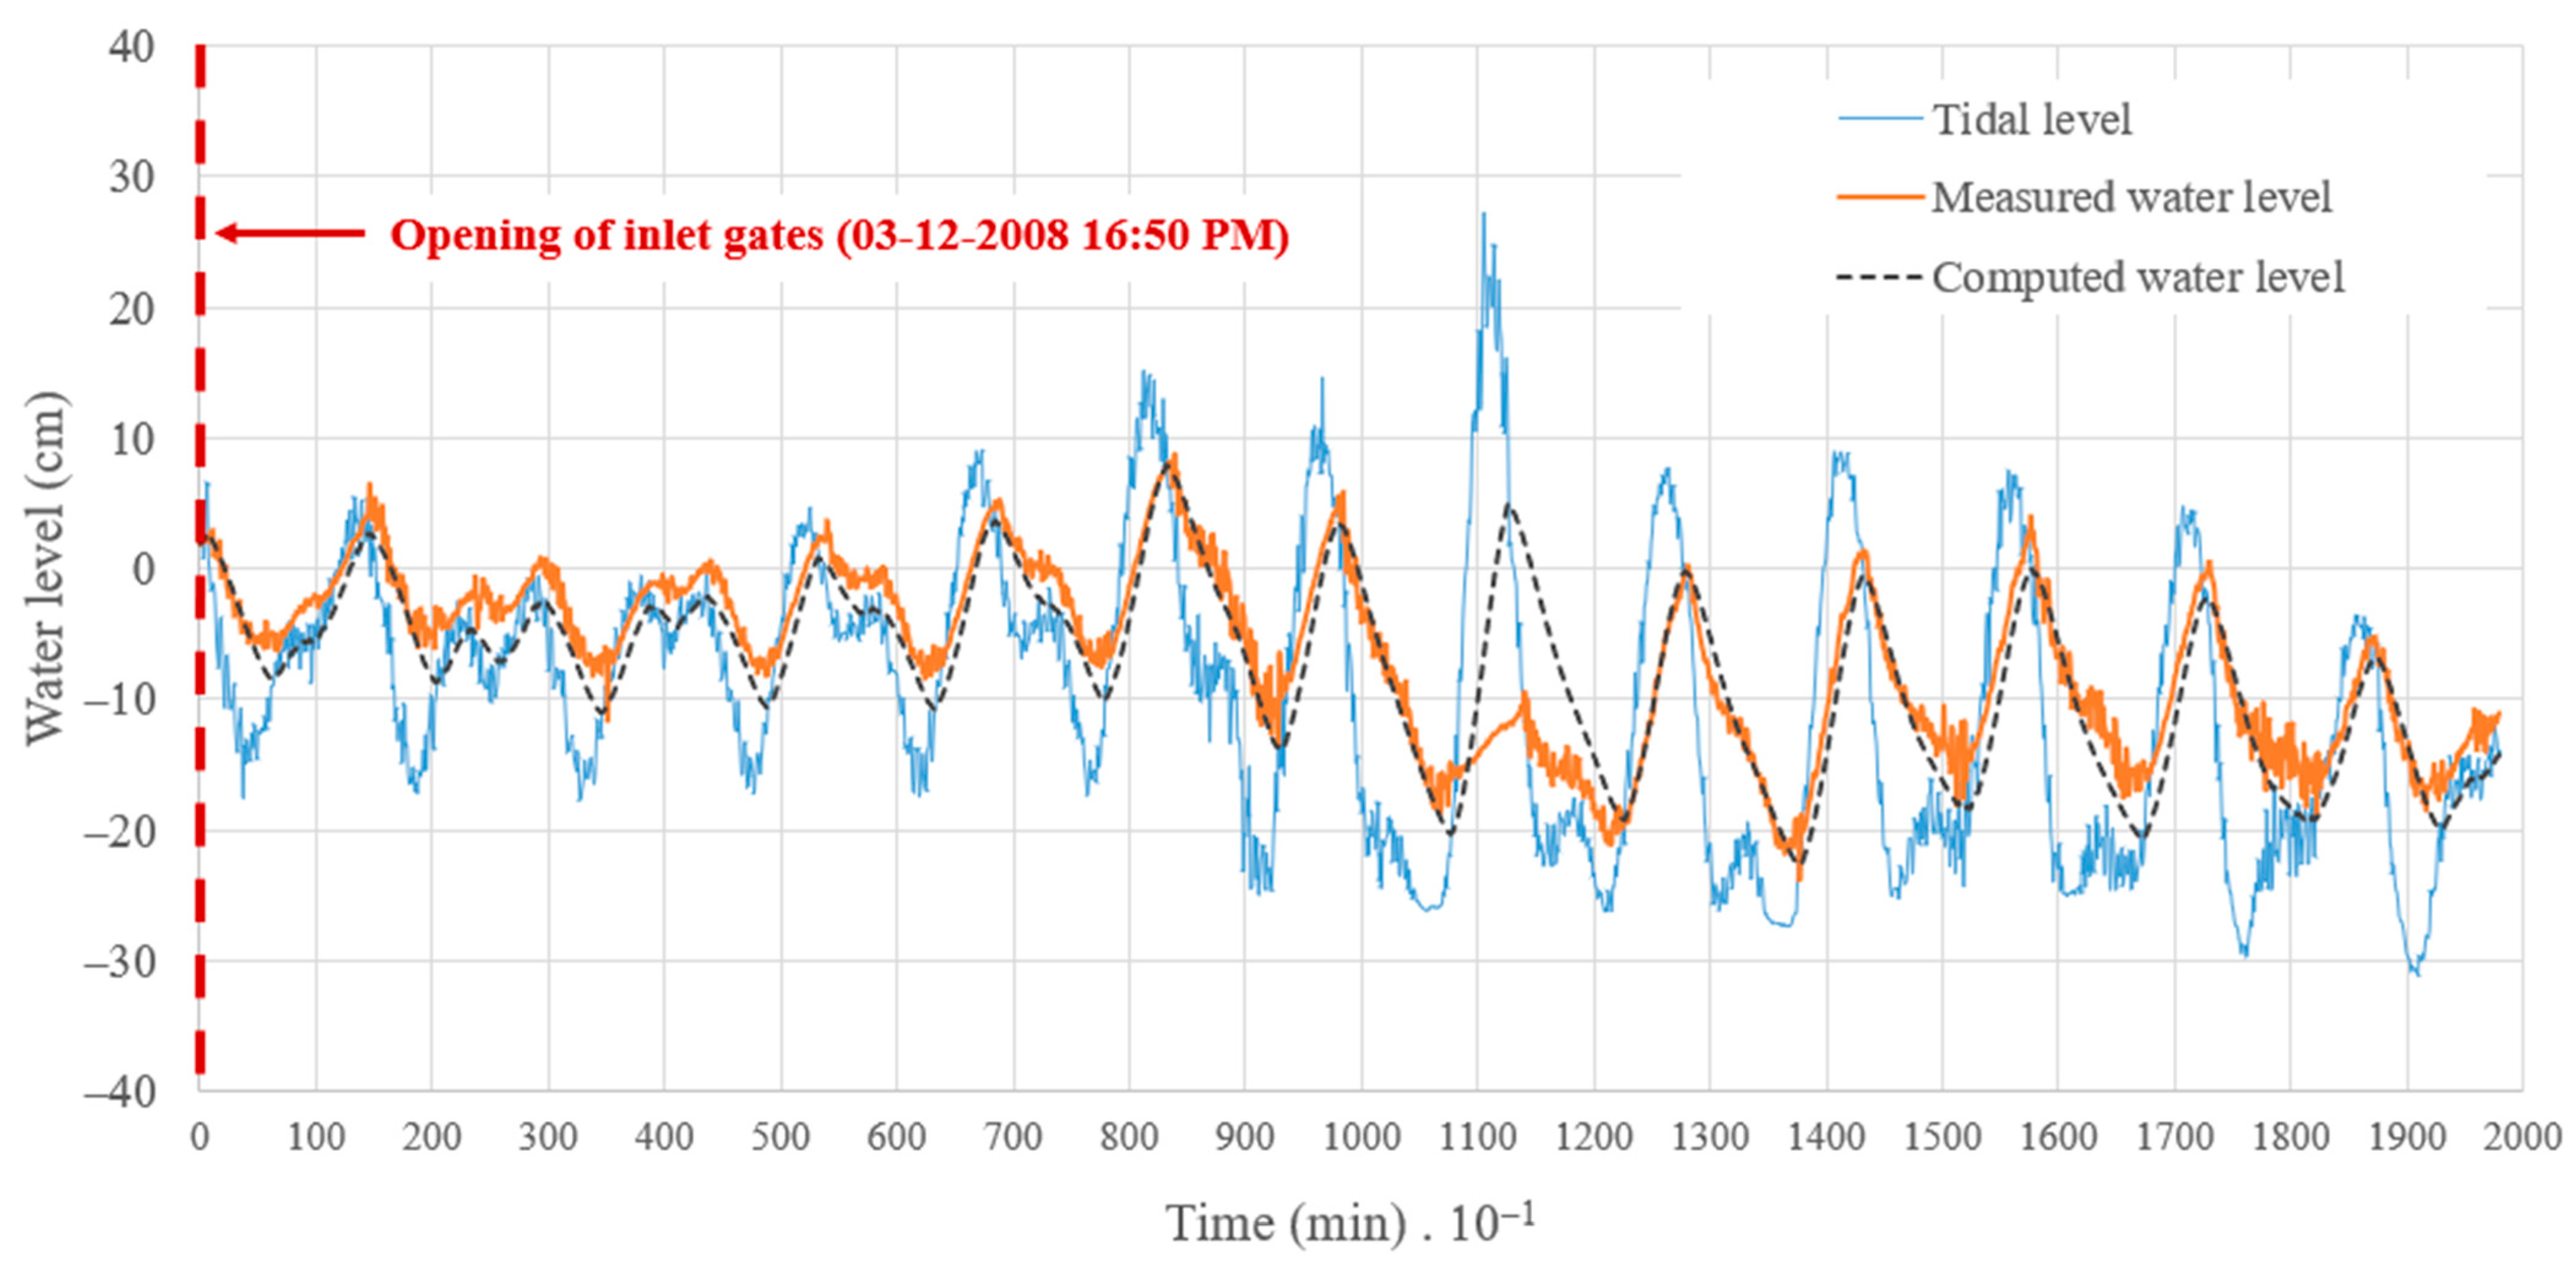
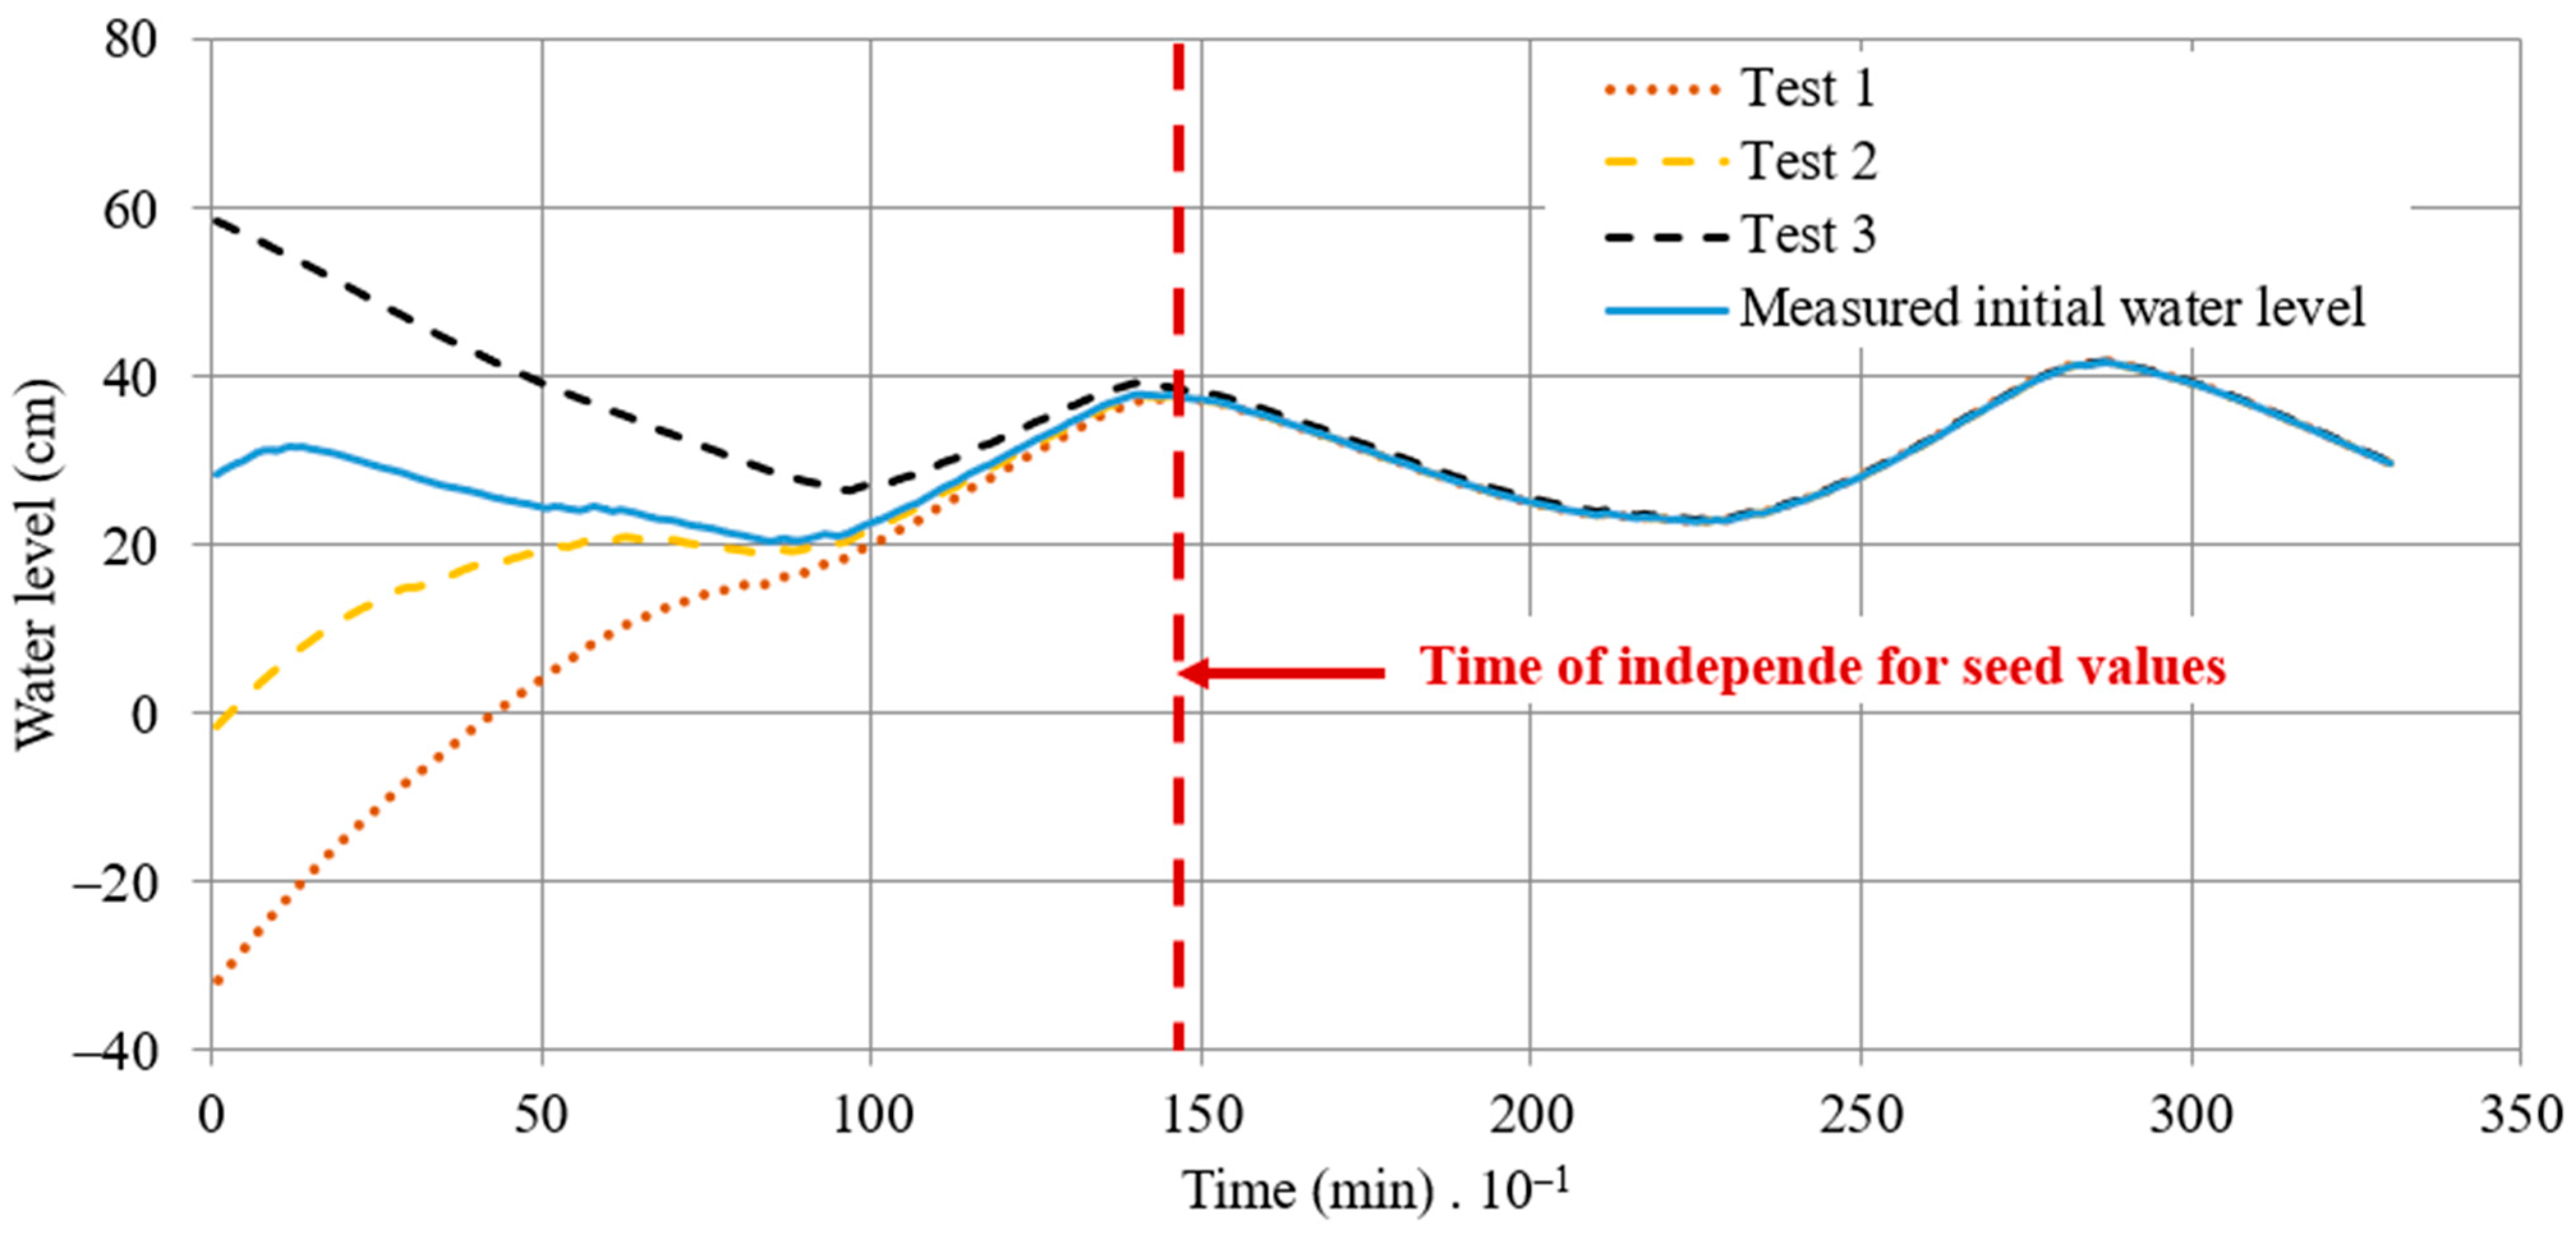
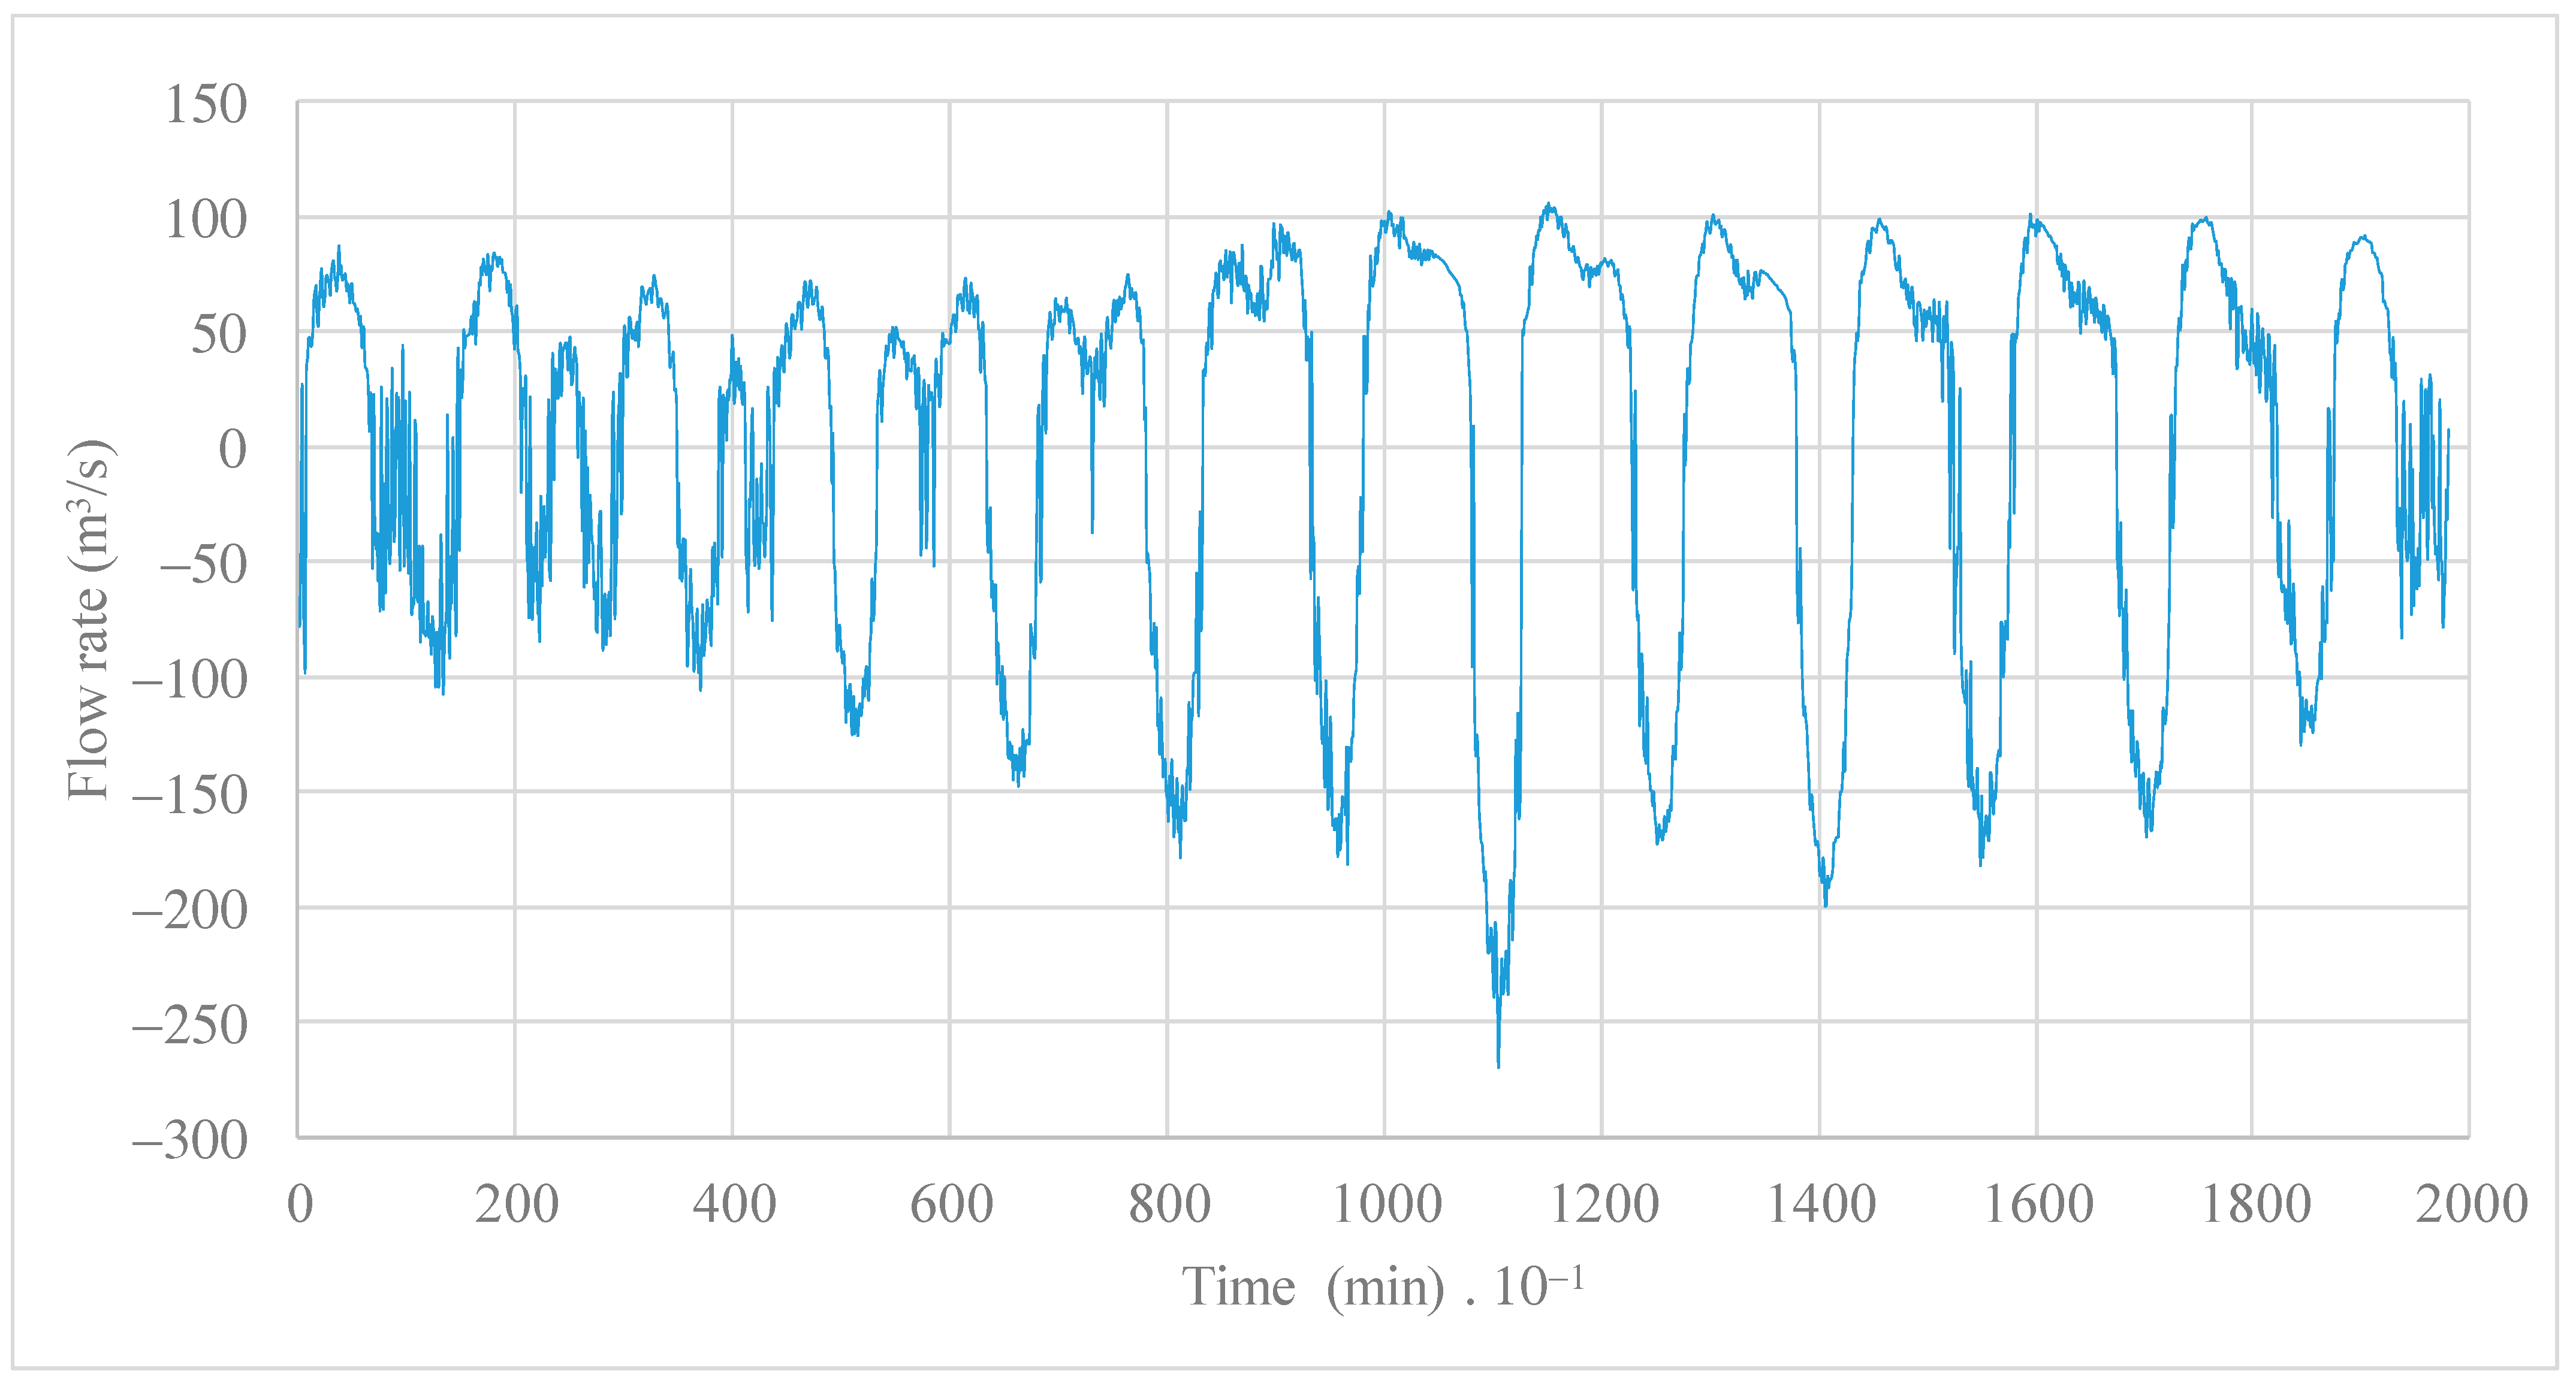
3. Analysis of Results

For the case study, the authors calibrated the hydraulic gates’ discharge coefficients at the STIS (see Figure 5) by considering both measured and calculated water levels. This mathematical procedure was performed from 3 to 17 December, a period during which no rainfall records were reported by pluviometry and pluviographic stations situated close to the surface area of the coastal lagoon of Ciénaga de la Virgen, and the hydraulic gates were in operation. Simulations were performed using a time step of 10 min. The root mean square error (RMSE) was used for calibration purposes, as follows:
R M S E = 1 N i = 0 N ( y u , m , i y u , c , i ) 2
where y u , m measured the water level in the coastal lagoon of Ciénaga de la Virgen, y u , c calculated the water level in the coastal lagoon of Ciénaga de la Virgen, and N = total observations in the dataset.
During the calibration process, values of 0.76 and 0.81 were obtained for C 0 and C I , respectively. An R M S E of 3.3 cm was attained in the calculations, indicating the mathematical model’s suitability for predicting extreme values and water-level pulses for the condition of opening the inlet gates. A maximum difference of 16.7 cm was found in this period. Figure 7 compares measured and calculated water levels in the coastal lagoon of Ciénaga de la Virgen.
During simulations, the initial water level of the coastal lagoon of Ciénaga de la Virgen is necessary as input data to calculate water level variations over time. Figure 8 illustrates a range of seed values, labeled from Tests No. 1 to 3, alongside the initial measured water level in the coastal lagoon of Ciénaga de la Virgen. The results demonstrate that after 1440 min (1 day), the simulated water levels become independent of the assumed seed values. This underscores the suitability of the proposed model for simulating estuarine systems, as the water levels computed by the model align closely with the measured values. This demonstrates the robustness of the mathematical model, as seed values do not influence the results of water simulations.
The calculation of inlet and outlet flow rates in the STIS is illustrated in Figure 9 during the period from 3rd to 17th December 2008, with peak values reaching approximately 270 and 118 m3/s, respectively. The average daily water volumes for inlet and outlet are 3,590,000 m3 and 3,310,000 m3, respectively. Many fluctuations are presented with Q s ( + ) and Q s ( ) over time, showing how the flow rates are moving bi-directionally from the coastal lagoon of Ciénaga de la Virgen towards the Caribbean Sea, and vice versa.
The water levels were simulated based on the calibrated model from 24 November to 17 December 2008, utilizing the discharge coefficients. The hydraulic gates remained open throughout the initial 1700 min of this timeframe, coinciding with recorded rainfall events. Subsequently, the inlet gates were fully closed, and no rainfall events were recorded during this interval. Figure 10 illustrates the outcomes of the three analyzed series:
  • The measured tidal level from water level sensor #2 (refer to Figure 5);
  • The measured water level in the coastal lagoon of Ciénaga de la Virgen (referencing water level sensor #1 in Figure 5);
  • The calculated water level in the coastal lagoon of Ciénaga de la Virgen.
The impact of hydraulic gate closure is discernible through the declining trend observed in the measured water levels within the coastal lagoon of Ciénaga de la Virgen.
Figure 10. Computed and measured water levels in the outlet gates in the coastal lagoon of Ciénaga de la Virgen.
Hydrology 11 00046 g010
The disparity between the computed and measured water levels for the coastal lagoon of Ciénaga de la Virgen is illustrated in Figure 11. This graph demonstrates the impact of partially or fully closing the inlet gates on the water levels within the coastal lagoon of Ciénaga de la Virgen. It highlights a minimum decrease of 25 cm attributed to gate operations, which should draw the attention of local authorities to mitigate high water levels that control a significant number of hydraulic urban drainage channels in Cartagena.

4. Discussion

To evaluate the influence of extreme rainfall events on the water levels of the coastal lagoon of Ciénaga de la Virgen, a rainfall hydrograph was simulated in the model input ( Q w ), sourced from the findings of the Master Plan for Storm Drainage of the City of Cartagena [23]. Two scenarios with return periods of 2 and 100 years were examined to assess their interactions with tidal patterns regarding increasing or decreasing levels. The frequency analysis of the record of maximum daily precipitations at Rafael Núñez Airport station (code number 14015020) revealed values of 148.1 and 222.4 mm for 10- and 100-year return periods, respectively. The Rafael Núñez Airport station is the only one that contains rainfall data in the city of Cartagena for the analyzed period. No evidence of climate change effects were found in the rainfall values recorded at the analyzed station [24]. It is worth noting that on the 14 November 2020, a rainfall event commenced at 2:40 h and concluded at 17:30 h, accumulating a total daily precipitation of 142.55 mm. This event was instigated by the Iota storm, which caused flooding affecting approximately 70% of the city of Cartagena on that day [25]. The Iota storm had a return period compared to the 10-year return period. As illustrated in Figure 12, a maximum water level of 73 cm was attained for a 100-year return period, whereas 34 cm was calculated for a 10-year return period. Four peak values were detected for the estuarine system’s 10- and 100-year return periods.
Discounting the water level for a no rainfall event, the water level reached was associated with return periods of 10 and 100 years, as depicted in Figure 13. A maximum elevation in water level of 82 cm was observed for a 100-year return period, and a computed difference of 40 cm was observed for a return period of 10 years.
The results indicate that the peak flow rate, reaching approximately 1400 m3/s for a 100-year return period, was reduced to around 400 m3/s, demonstrating that the coastal lagoon of Ciénaga de la Virgen is suitable for reducing peak values by more than 70%. For the 10-year return period (with a peak value of 690 m3/s), a maximum discharge of 320 m3/s was found at the STIS, providing a regulation of 50%. The results are presented in Figure 14.
It is of paramount importance to note that, as per reports, a population of approximately 155,000 individuals was impacted by flooding on the 14 November 2020. Implementing effective operational policies within the STIS can mitigate maximum water levels, particularly during storms with significant return periods, by lowering water levels in the coastal lagoon of Ciénaga de la Virgen, especially considering that the more critical watersheds of the city of Cartagena drain to this water body and an analysis of risk is required to understand the behavior of extreme events [26,27].

5. Conclusions

Hydrodynamic models in 2D and 3D have been developed in recent decades to study the water behavior in estuarine systems, considering their complex interactions with oceans and seas. Water balance continues to be an excellent tool for modeling estuarine systems, measuring water levels of both tidal and coastal lagoons. In this research, the authors proposed a simplified hydraulic model of a stabilized tidal inlet structure located at the outlet of an estuarine system, which is easy to calibrate since it has only the discharge coefficients of gates as calibration parameters. The proposed model requires the measured series of tidal and coastal lagoon water levels as input data. In addition, the proposed model can be used to evaluate the input hydrograph of watersheds associated with various return periods with discharge towards an analyzed coastal lagoon.
The proposed model was applied to the case study of the stabilized tidal inlet structures located at the coastal lagoon of Ciénaga de la Virgen. The operation of the inlet gates can reduce water levels in this estuarine system by approximately 25 cm. This approach could serve as a viable measure for urban planners and local authorities aiming to lower the hydraulic control level in the water channels draining into the estuarine system of Cartagena. Such measures would enhance the overall storage capacity of the water body. Rainfall events with a return period of 100 years tend to elevate water levels in the coastal lagoon of Ciénaga de la Virgen by approximately 80 cm. In contrast, for return periods of 10 years, the increase is around 40 cm. The coastal lagoon of Ciénaga de la Virgen demonstrates a capacity to regulate peak flow rates, with an approximate regulation of 70% for extreme rainfall events with a return period of 100 years and 50% regulation for events with a return period of 10 years.

Author Contributions

Conceptualization, A.A.-P.; methodology, A.A.-P. and O.E.C.-H.; validation, A.A.-P.; formal analysis, A.A.-P., O.E.C.-H. and V.S.F.-M.; writing—original draft preparation, A.A.-P. and O.E.C.-H.; supervision, V.S.F.-M. All authors have read and agreed to the published version of the manuscript.

Funding

This research project did not receive external or internal funding.

Institutional Review Board Statement

Not applicable.

Informed Consent Statement

Not applicable.

Data Availability Statement

Data may be acquired by contacting the corresponding author (A.A-P.).

Conflicts of Interest

The authors declare no conflicts of interest.

Nomenclature

The following abbreviations were used in this manuscript:
A s 
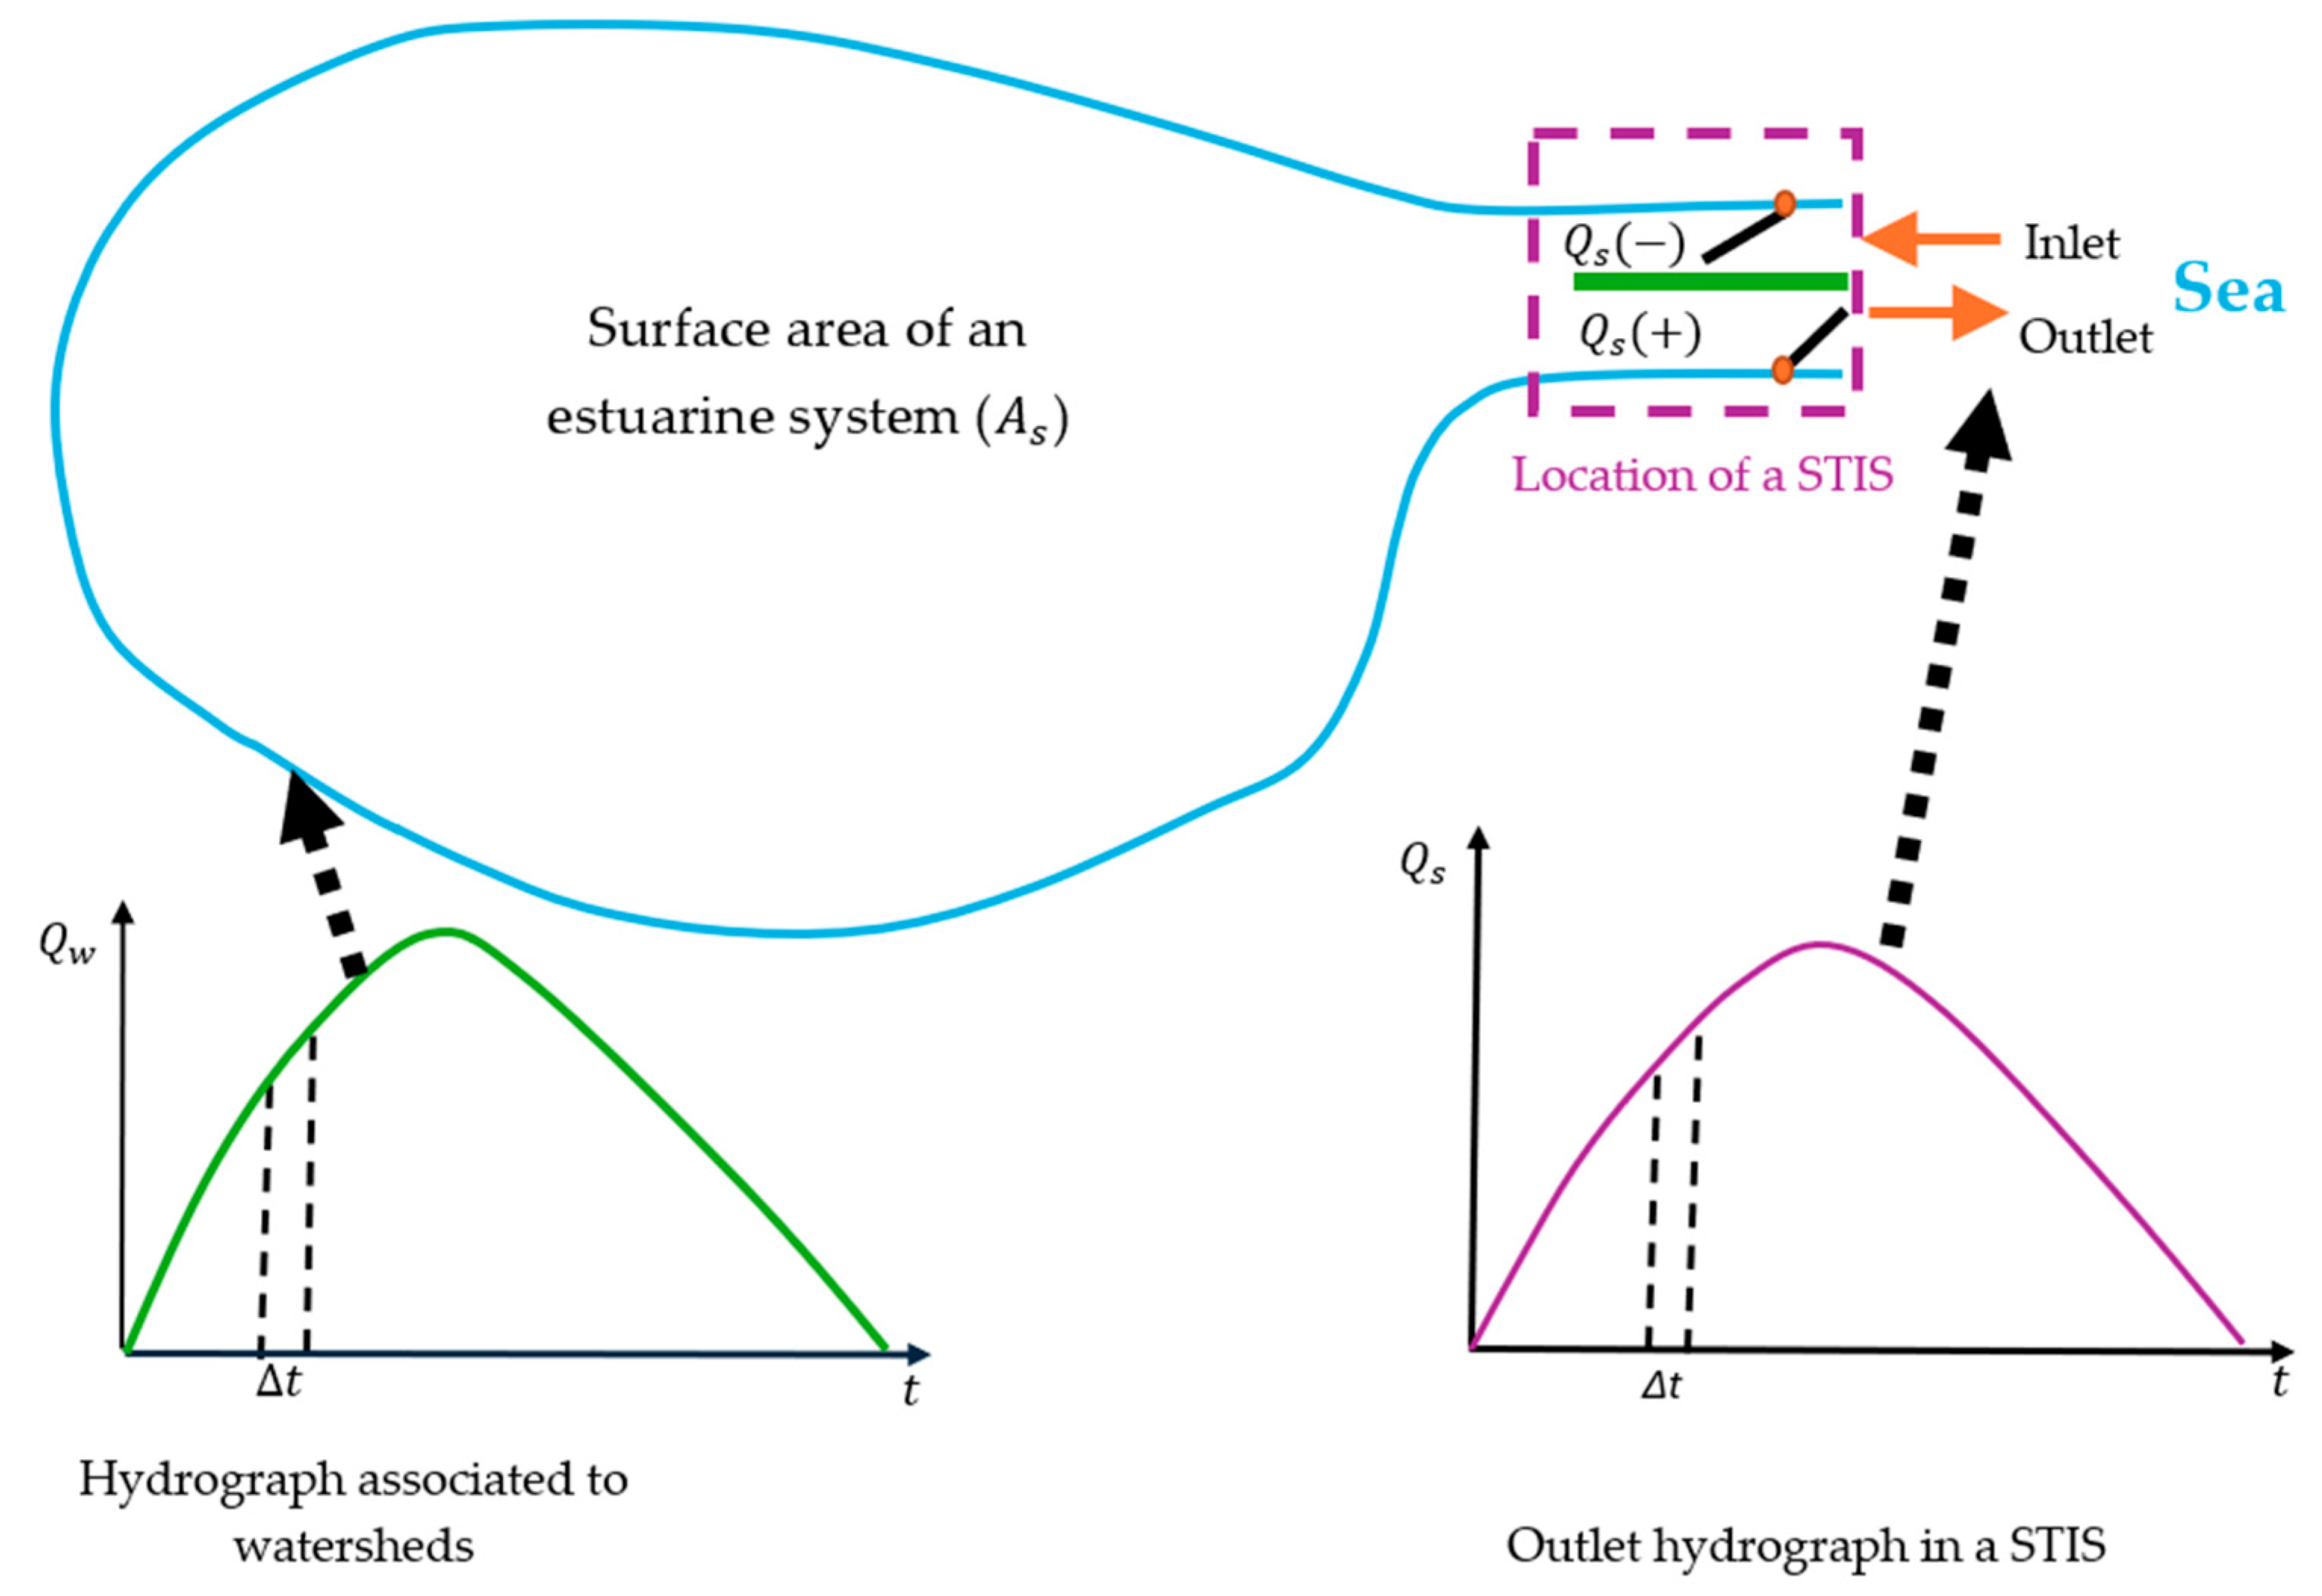
surface area of an estuarine system (m2)
Bnet width of gates (m)
C discharge coefficient of a gate (-)
g gravitational acceleration (m/s2)
h 
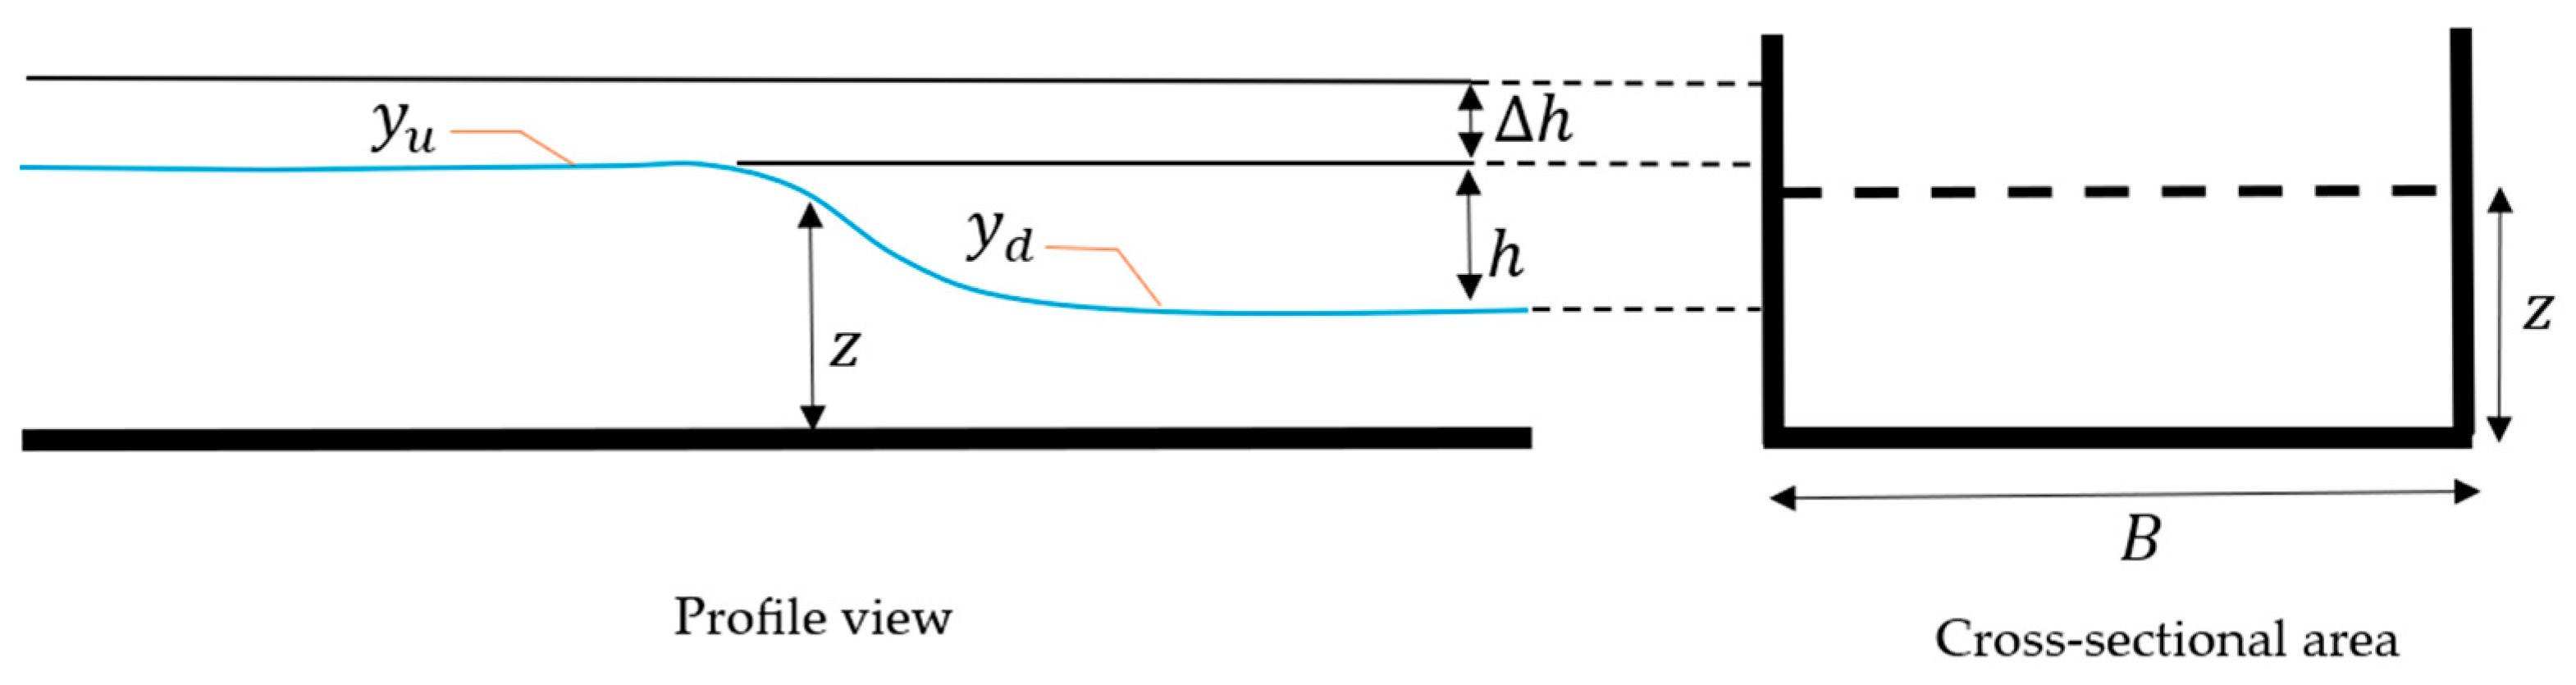
hydraulic head of a gate (m)
Q flow rate through of a gate (m3/s)
Q s outlet hydrograph in a STIS (m3/s)
Q w hydrograph generated in a watershed of an estuarine system (m3/s)
t time (s)
y d downstream water level (m.a.s.l.)
y u upstream water level (m.a.s.l.)
z average depth of a gate (m)
h variation of h (m)
t time step (s)
variation of stored volume of an estuarine system (m3)
Subscript
0refers to conditions in outlet gates (from an estuarine system towards a sea or ocean)
I refers to conditions in inlet gates from a sea or ocean towards an estuarine system)

References

  1. Mehta, A.J.; Joshi, P.B. Tidal inlet hydraulics. J. Hydraul. Eng. 1988, 114, 1321–1338. [Google Scholar] [CrossRef]
  2. Hansen, D.V.; Rattray, M. Gravitational circulation in straits and estuaries. J. Mar. Res. 1965, 23, 104–122. [Google Scholar] [CrossRef]
  3. Buttolph, A.M.; Reed, C.W.; Kraus, N.C.; Ono, N.; Larson, M.; Camenen, B.; Hanson, H.; Wamsley, T.; Zundel, A.K. Two-Dimensional Depth-Averaged Circulation Model CMS-M2D: Version 3.0, Report 2: Sediment Transport and Morphology Change; ERDC/CHL TR-06, 9; U.S. Army Corps of Engineers: Washington, DC, USA, 2006.
  4. Provan, M.; Logan, S.; Nistor, I.; Cornett, A.; Drouin, A. Field and numerical investigations of the morpho-hydrodynamic processes of the tidal inlet at Shippagan Gully, New Brunswick, Canada. Coast. Eng. J. 2018, 60, 400–422. [Google Scholar] [CrossRef]
  5. Zhao, L.; Chen, C.; Vallino, J.; Hopkinson, C.; Beardsley, R.C.; Lin, H.; Lerczak, J. Wetland-estuarine-shelf interactions in the Plum Island Sound and Merrimack River in the Massachusetts coast. J. Geophys. Res. Ocean. 2010, 115, C10. [Google Scholar] [CrossRef]
  6. Quetzalcóatl, O.; González, M.; Cánovas, V.; Medina, R.; Espejo, A.; Klein, A.; Tessler, M.G.; Almeida, L.R.; Jaramillo, C.; Garnier, R.; et al. SMCε, a coastal modeling system for assessing beach processes and coastal interventions: Application to the Brazilian coast. Environ. Model. Softw. 2019, 116, 131–152. [Google Scholar] [CrossRef]
  7. Gonzalez, M.; Gutiérrez, O.Q.; Canovas, V.; Kakeh, N.; Medina, R.; Espejo, A.; Méndez, F.; Abascal, A.; Castanedo, S.; Martínez, C.; et al. The new coastal modelling system SMC-BRASIL and its application to the erosional problem in the massaguaçu beach (Sao Paulo, Brazil). Coast. Eng. Proc. 2014, 34, 49. [Google Scholar] [CrossRef]
  8. Safavi, S.; Saghafian, B.; Hosseini, S.A. Characterizing flow pattern and salinity using the 3D MIKE 3 model: Urmia Lake case study. Arab. J. Geosci. 2020, 13, 115. [Google Scholar] [CrossRef]
  9. Sivakumar, B.; Puente, C.E.; Maskey, M.L. Complex networks and hydrologic applications. In Advances in Nonlinear Geosciences; Springer: Berlin/Heidelberg, Germany, 2018; pp. 565–586. [Google Scholar] [CrossRef]
  10. Arrieta, A.; Rejtman, P.; Escorcia, E. Validación de una Nueva Metodología de Simulación Hidrodinamica de Estuarios y Bahías en la Ciénaga de la Virgen de la Ciudad de Cartagena. In Proceedings of the Seminario Internacional La Hidroinformática en la Gestión Integrada de los Recursos Hídricos, Cartagena, Colombia; 2003; pp. 1–4. [Google Scholar]
  11. Novikov, A.; Bagtzoglou, A.C. Hydrodynamic Model of the Lower Hudson River Estuarine System and its Application for Water Quality Management. Water Resour Manag. 2006, 20, 257–276. [Google Scholar] [CrossRef]
  12. Hsu, M.; Kuo, A.; Kou, J.; Liu, W. Procedure to calibrate and verify numerical models of estuarine hydrodynamics. J. Hydraul. Eng. 2000, 125, 166–182. [Google Scholar] [CrossRef]
  13. Levasseur, A.; Shi, L.; Wells, N.; Purdie, D.; Kelly-Gerreyn, B. A three-dimensional hydrodynamic model of estuarine circulation with an application to Southampton Water, UK. Estuar. Coast. Shef Sci. 2007, 73, 753–767. [Google Scholar] [CrossRef]
  14. Royal Haskoning. Technical Report: Proyecto Bocana Estabilizada en la Ciénaga de la Virgen. Memoria Técnica, Modelación Bidimencional; Royal Haskoning: Cartagena, Colombia, 1996. [Google Scholar]
  15. Lonin, S.; Yus, T. Water quality model of ecosystem of Cienaga de Tesca coastal lagoon. Ecol. Model. 2001, 144, 279–293. [Google Scholar] [CrossRef]
  16. El Universal. Emergencias por ‘Iota’ Dejan 155 mil Damnificados en Cartagena. Available online: https://www.eluniversal.com.co/cartagena/emergencias-por-iota-dejan-155-mil-damnificados-en-cartagena-XH3797635 (accessed on 23 February 2024).
  17. Daneshfaraz, R.; Norouzi, R.; Ebadzadeh, P.; Di Francesco, S.; Abraham, J.P. Experimental Study of Geometric Shape and Size of Sill Effects on the Hydraulic Performance of Sluice Gates. Water 2023, 15, 314. [Google Scholar] [CrossRef]
  18. Lima, M.J.; Barbosa, A.B.; Correia, C.; Matos, A.; Cravo, A. Patterns and Predictors of Phytoplankton Assemblage Structure in a Coastal Lagoon: Species-Specific Analysis Needed to Disentangle Anthropogenic Pressures from Ocean Processes. Water 2023, 15, 4238. [Google Scholar] [CrossRef]
  19. Weithoff, G.; Beisner, B.E. Measures and Approaches in Trait-Based Phytoplankton Community Ecology—From Freshwater to Marine Ecosystems. Front. Mar. Sci. 2019, 6, 40. [Google Scholar] [CrossRef]
  20. Law, I.K.; Hii, K.S.; Lau, W.L.S.; Leaw, C.P.; Lim, P.T. Coastal Micro-Phytoplankton Community Changes during the Toxigenic Alexandrium Minutum Blooms in a Semi-Enclosed Tropical Coastal Lagoon (Malaysia, South China Sea). Reg. Stud. Mar. Sci. 2023, 57, 102733. [Google Scholar] [CrossRef]
  21. Establecimiento Público Ambiental, Distrito de Cartagena de Indias, Colombia. Observatorio Ambiental de Cartagena de Indias. Proyecto Ciénaga de la Virgen. Available online: https://observatorio.epacartagena.gov.co/gestion-ambiental/ecosistemas/proyecto-cienaga-de-la-virgen/cienaga-de-la-virgen/ (accessed on 23 February 2024).
  22. Global Water. WL16 Water Level Logger. Available online: https://www.ysi.com/wl16 (accessed on 23 February 2024).
  23. Consorcio Consultores Cartageneros, Alcaldía de Cartagena. Plan Maestro de Drenajes Pluviales de la Ciudad de Cartagena; Distrito de Cartagena de Indias: Cartagena, Colombia, 2008.
  24. Arrieta-Pastrana, A.; Saba, M.; Alcázar, A.P. Analysis of Climate Variability in a Time Series of Precipitation and Temperature Data: A Case Study in Cartagena de Indias, Colombia. Water 2022, 14, 1378. [Google Scholar] [CrossRef]
  25. El Universal. Cartagena Sufre por el Paso de la Tormenta Iota por el Caribe. Available online: https://www.eluniversal.com.co/cartagena/cartagena-sufre-por-el-paso-de-la-tormenta-iota-por-el-caribe-HH3797687 (accessed on 23 February 2024).
  26. Sierra-Sánchez, A.; Coronado-Hernandez, O.E.; Paternina-Verona, D.A.; Gatica, G.; Ramos, H.M. Statistical Analysis to Quantify the Impact of Map Type on Estimating Peak Discharge in Non-Instrumented Basins. Trans. Energy Syst. Eng. Appl. 2023, 4, 1–17. [Google Scholar] [CrossRef]
  27. Mitu, M.F.; Sofia, G.; Shen, X.; Anagnostou, E.N. Assessing the compound flood risk in coastal areas: Framework formulation and demonstration. J. Hydrol. 2023, 626, 130278. [Google Scholar] [CrossRef]
Figure 1. Diagram illustrating the flow through a sluice gate.
Hydrology 11 00046 g001
Figure 2. Plan scheme of an estuarine system with an STIS.
Hydrology 11 00046 g002
Figure 3. Flowchart for the numerical resolution.
Hydrology 11 00046 g003
Figure 4. Location of the coastal lagoon of Ciénaga de la Virgen in the city of Cartagena.
Hydrology 11 00046 g004
Figure 5. Scheme of the STIS and location of water level sensors: (a) plan view and (b) details of inlet and outlet gates.
Hydrology 11 00046 g005
Figure 6. Data measurements of water levels in the approach channel (tidal levels) and within the dock of the coastal lagoon of Ciénaga de la Virgen.
Hydrology 11 00046 g006
Figure 7. Comparison between measured and calculated water levels in the coastal lagoon of Ciénaga de la Virgen.
Hydrology 11 00046 g007
Figure 8. Influence of seed values in the calculated water level series of the coastal lagoon of Ciénaga de la Virgen.
Hydrology 11 00046 g008
Figure 9. Estimated inlet and outlet flow rates in the STIS during the period from 3 to 17 December (13.75 days).
Hydrology 11 00046 g009
Figure 11. Difference between measured and computed water levels in the coastal lagoon of Ciénaga de la Virgen.
Hydrology 11 00046 g011
Figure 12. Calculated water levels for return periods of 10 and 100 years in the coastal lagoon of Ciénaga de la Virgen.
Hydrology 11 00046 g012
Figure 13. Water levels calculated for return periods of 10 and 100 years, discounting the effects of no rainfall events.
Hydrology 11 00046 g013
Figure 14. Computed flow rates in the outlet of the STIS for return periods of 10 and 100 years.
Hydrology 11 00046 g014
Disclaimer/Publisher’s Note: The statements, opinions and data contained in all publications are solely those of the individual author(s) and contributor(s) and not of MDPI and/or the editor(s). MDPI and/or the editor(s) disclaim responsibility for any injury to people or property resulting from any ideas, methods, instructions or products referred to in the content.

