Article

Comparing One-Way and Two-Way Coupled Hydrometeorological Forecasting Systems for Flood Forecasting in the Mediterranean Region

1
Israeli Hydrological Service, Water Authority, Jerusalem 91360, Israel
2
National Center for Atmospheric Research, Boulder, CO 80307, USA
3
Department of Geography, University of Augsburg, Augsburg 86135, Germany
4
Karlsruhe Institute of Technology, Karlsruhe 82467, Germany
*
Author to whom correspondence should be addressed.
Submission received: 19 January 2016 / Revised: 3 April 2016 / Accepted: 25 April 2016 / Published: 7 May 2016

Abstract

:
A pair of hydro-meteorological modeling systems were calibrated and evaluated for the Ayalon basin in central Israel to assess the advantages and limitations of one-way versus two-way coupled modeling systems for flood prediction. The models used included the Hydrological Engineering Center-Hydrological Modeling System (HEC-HMS) model and the Weather Research and Forecasting (WRF) Hydro modeling system. The models were forced by observed, interpolated precipitation from rain-gauges within the basin, and with modeled precipitation from the WRF atmospheric model. Detailed calibration and evaluation was carried out for two major winter storms in January and December 2013. Then, both modeling systems were executed and evaluated in an operational mode for the full 2014/2015 rainy season. Outputs from these simulations were compared to observed measurements from the hydrometric station at the Ayalon basin outlet. Various statistical metrics were employed to quantify and analyze the results: correlation, Root Mean Square Error (RMSE) and the Nash–Sutcliffe (NS) efficiency coefficient. Foremost, the results presented in this study highlight the sensitivity of hydrological responses to different sources of simulated and observed precipitation data, and demonstrate improvement, although not significant, at the Hydrological response, like simulated hydrographs. With observed precipitation data both calibrated models closely simulated the observed hydrographs. The two-way coupled WRF/WRF-Hydro modeling system produced improved both the precipitation and hydrological simulations as compared to the one-way WRF simulations. Findings from this study, as well as previous studies, suggest that the use of two-way atmospheric-hydrological coupling has the potential to improve precipitation and, therefore, hydrological forecasts for early flood warning applications. However, more research needed in order to better understand the land-atmosphere coupling mechanisms driving hydrometeorological processes on a wider variety precipitation and terrestrial hydrologic systems.

1. Introduction

Several studies have indicated that floods and droughts are dangerous hazards in the Mediterranean region due both to the number of people affected and the relatively high frequency by which human activities and goods suffer damages and losses (Llasat-Botija et al. 2007 [1]). This is especially true for semi-arid regions such as the Middle East. Additionally, it is widely expected that climate change will increase the frequency of severe rain events in many regions around the world (Milly et al. 2001 [2]; Wagener et al. 2010 [3]; Kundzewicz et al. 2010 [4]; Trenberth, 2011 [5]; Zwiers et al. 2013 [6]; Andersen et al. 2013 [7]). In the Mediterranean basin, these effects could lead to increasing droughts on one hand (Törnros and Menzel, 2014 [8]; Hoerling et al. 2012 [9]; Dai, 2011 [10]; Smiatek et al. 2011 [11]; 2013 [12]; 2014 [13]) and intensified flood events on the other (Yosef et al. 2009 [14]; Samuels et al. 2011 [15]). Land use changes and increasing urbanization are also factors that may enhance flood intensity and frequency (e.g., Bronstert et al. 2002 [16]; Chang et al. 2008 [17]; Githui et al. 2010 [18]; Delgado et al. 2010 [19]; Kalantari, 2014 [20]. Given the aforementioned non-stationarity in both climate forcing and terrestrial hydrologic conditions, operational flood prediction methods should be able to rapidly incorporate dynamically evolving atmospheric and land surface conditions and the feedbacks between them without a prolonged calibration period.
Advanced warning systems for floods can be very beneficial in reducing flood risk and providing emergency response personnel time to prepare for and mitigate damages. The accuracy of flood forecasts depends strongly on the skill of quantitative precipitation forecasts and their spatial distribution (Younis et al. 2008 [21]; Cloke and Pappenberger, 2009 [22]; Sin Shiha et al. 2014 [23]. Most modern hydrological models can use precipitation input from various sources: rain gauges, radar, remote sensing or simulated precipitation from numerical weather models. Operational global weather forecast centers routinely provide relatively coarse precipitation forecasts with resolutions of 16–27 km (at least for the Eastern Mediterranean region). These forecasts cannot typically resolve the necessary details of complex, intense precipitation structures that are forced by mesoscale orography, land-surface heterogeneities, and land-water contrasts (Fiori et al. 2014 [24]. In the Eastern Mediterranean region, strong air-sea interaction and orographic forcing can combine to produce precipitation with very strong spatial and temporal gradients that are generally missed by coarse resolution operational models. In Israel, the precipitation patterns are particularly complex, and large precipitation gradients occur over a relatively small geographical distance of 2–10 km. Large climatological precipitation gradients in Israel are caused by the preferred tracks of extra-tropical cyclones, the complex orography and the shape of the coastline (Saaroni et al. 2010 [25]).
To address these problems, Givati et al. (2012 [26]) used the WRF model to provide high resolution precipitation forecasts covering Israel and the surrounding region where complex terrain dominates. They showed that by using high-resolution grids of 1.3–4 km, the WRF model was capable of forecasting precipitation, both in terms of quantity and in spatial distribution, reasonably well. Based on these results the Israeli Hydrological Service performed streamflow simulations and forecasts using the Hydrological Model for Karst Environment (HYMKE) for the upper Jordan River basin (Givati et al. 2012 [26]) and the HEC-HMS model for the Ayalon basin (Givati and Sapir, 2014 [27]). Similarly, Rahimi et al. (2010 [28]) used the HEC-HMS model driven by precipitation input from the WRF model for flood forecasting in semi-arid areas in western Iran (1200 km2) and found relatively good agreement between the observed and the simulated hydrographs with correlation ranging between 0.60 and 0.80 for three selected sub-basins. Yucel and Keskin (2011 [29]) tested the HEC-HMS model for flood forecasting in North-West Turkey (Ayamama basin) using precipitation input from rain gauges, remote sensing, radar, and WRF 4 km model. They found that rainfall estimates from the WRF model underestimated the magnitude of the heavy precipitation events in comparison with rain gauges, and so the surface runoff hydrograph determined from WRF-derived precipitation was also underestimated. Similar underestimation for heavy rainfall results was found also by Ratnayake et al. (2010 [30]) for the Nilwala river basin at Sri Lanka.
Several studies have shown the advantages of using coupled atmospheric-land surface models for temperature and precipitation in different areas and for different seasons, mostly during summer convective precipitation (Chen et al. 2001 [31]; Jasper et al. 2002 [32]; Seuffert et al. 2002 [33]; Yanhong et al. 2006 [34]; Bouilloud et al. 2010 [35]; Wang et al. 2012 [36]; Marty et al. 2013 [37]; Zabel and Mauser [38], 2013 and Moreno et al. 2013 [39]). Wagner et al. (2015 [40]) validated resulted from a fully coupled atmospheric-hydrological model (WRF-HMS) vs. uncoupled mode for several meteorological variables and found a better performance for the fully coupled mode vs. uncoupled.
Senatore et al. (2015 [41]) compared one-way forced implementation of the WRF-Hydro system to a fully, 2-way coupled instance of WRF/WRF-Hydro in a center Mediterranean catchment in order to evaluate the impact of 2-way coupling on simulated precipitation and streamflow. They found that for the 2002/2003 rainy season there was generally good agreement between the accumulated simulated precipitation from the fully coupled mode: annual simulated precipitation of 948 mm at the WRF two way, 945 mm the WRF one way and 947 mm observed from rain gauges for the Crati basin in southern Italy (1281 km2). The correlation in precipitation from the two-way coupled WRF/WRF-Hydro simulation was higher than the one-way WRF model compared to the observed data, while the RMSE was also lower. They concluded from preliminary results that fully coupled modeling tended to provide better rainfall estimates for convective events.
This study seeks to extend the findings of Senatore et al. (2015 [41]) to assess the accuracy of operational hydrologic forecasts when using different sources of precipitation data as input, including one-way versus two-way coupled modeling systems. The synoptic conditions in this study are different from other studies that simulated summer convective precipitation, while here we simulated various winter storms with convective (at the lower parts of the basin) and orographic precipitation (in it upper parts). This study is the first that simulate flash floods for extreme winter storms at Eastern Mediterranean catchment comparing various precipitation as stand-alone one way simulation vs. two way simulations.
Hence, this study we explored two basic research questions:
  • What is the impact of one-way versus two-way coupled land-atmosphere modeling on the skill of the precipitation forecasts produced for the Mediterranean region?
  • Does any difference in precipitation forecast skill translate into improvements in streamflow forecasting skill from uncoupled versus coupled hydrologic modeling systems?
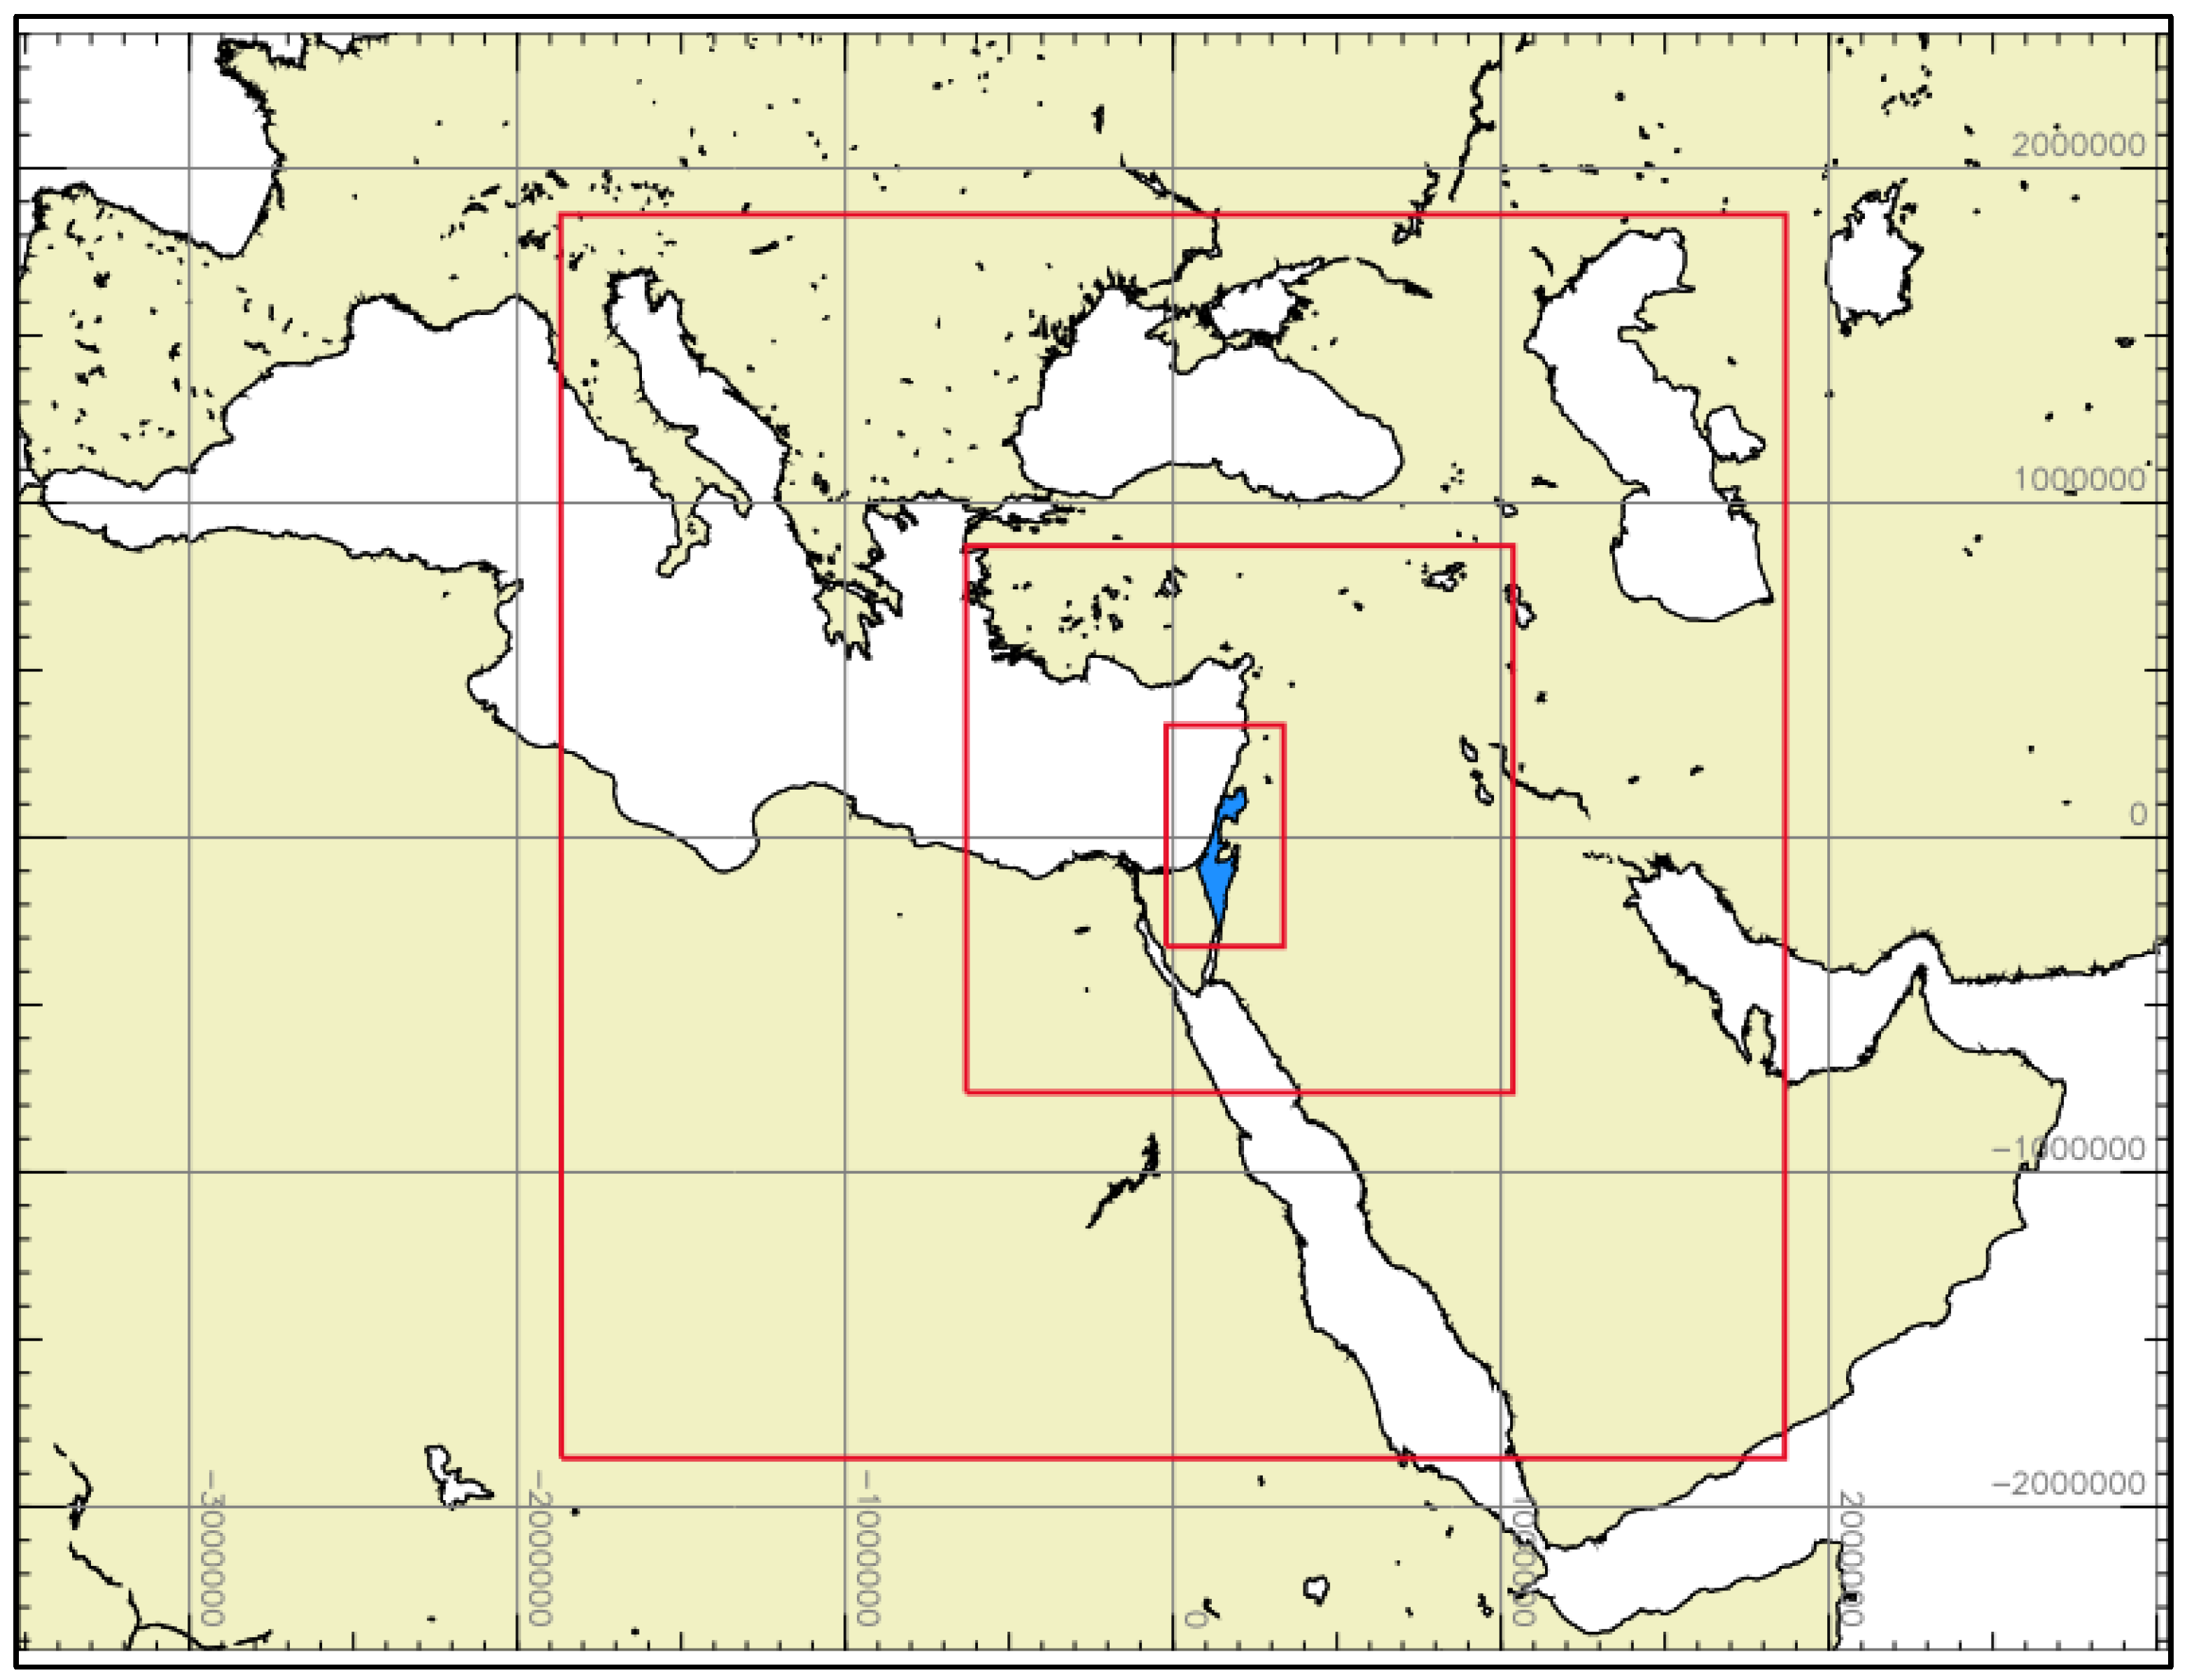
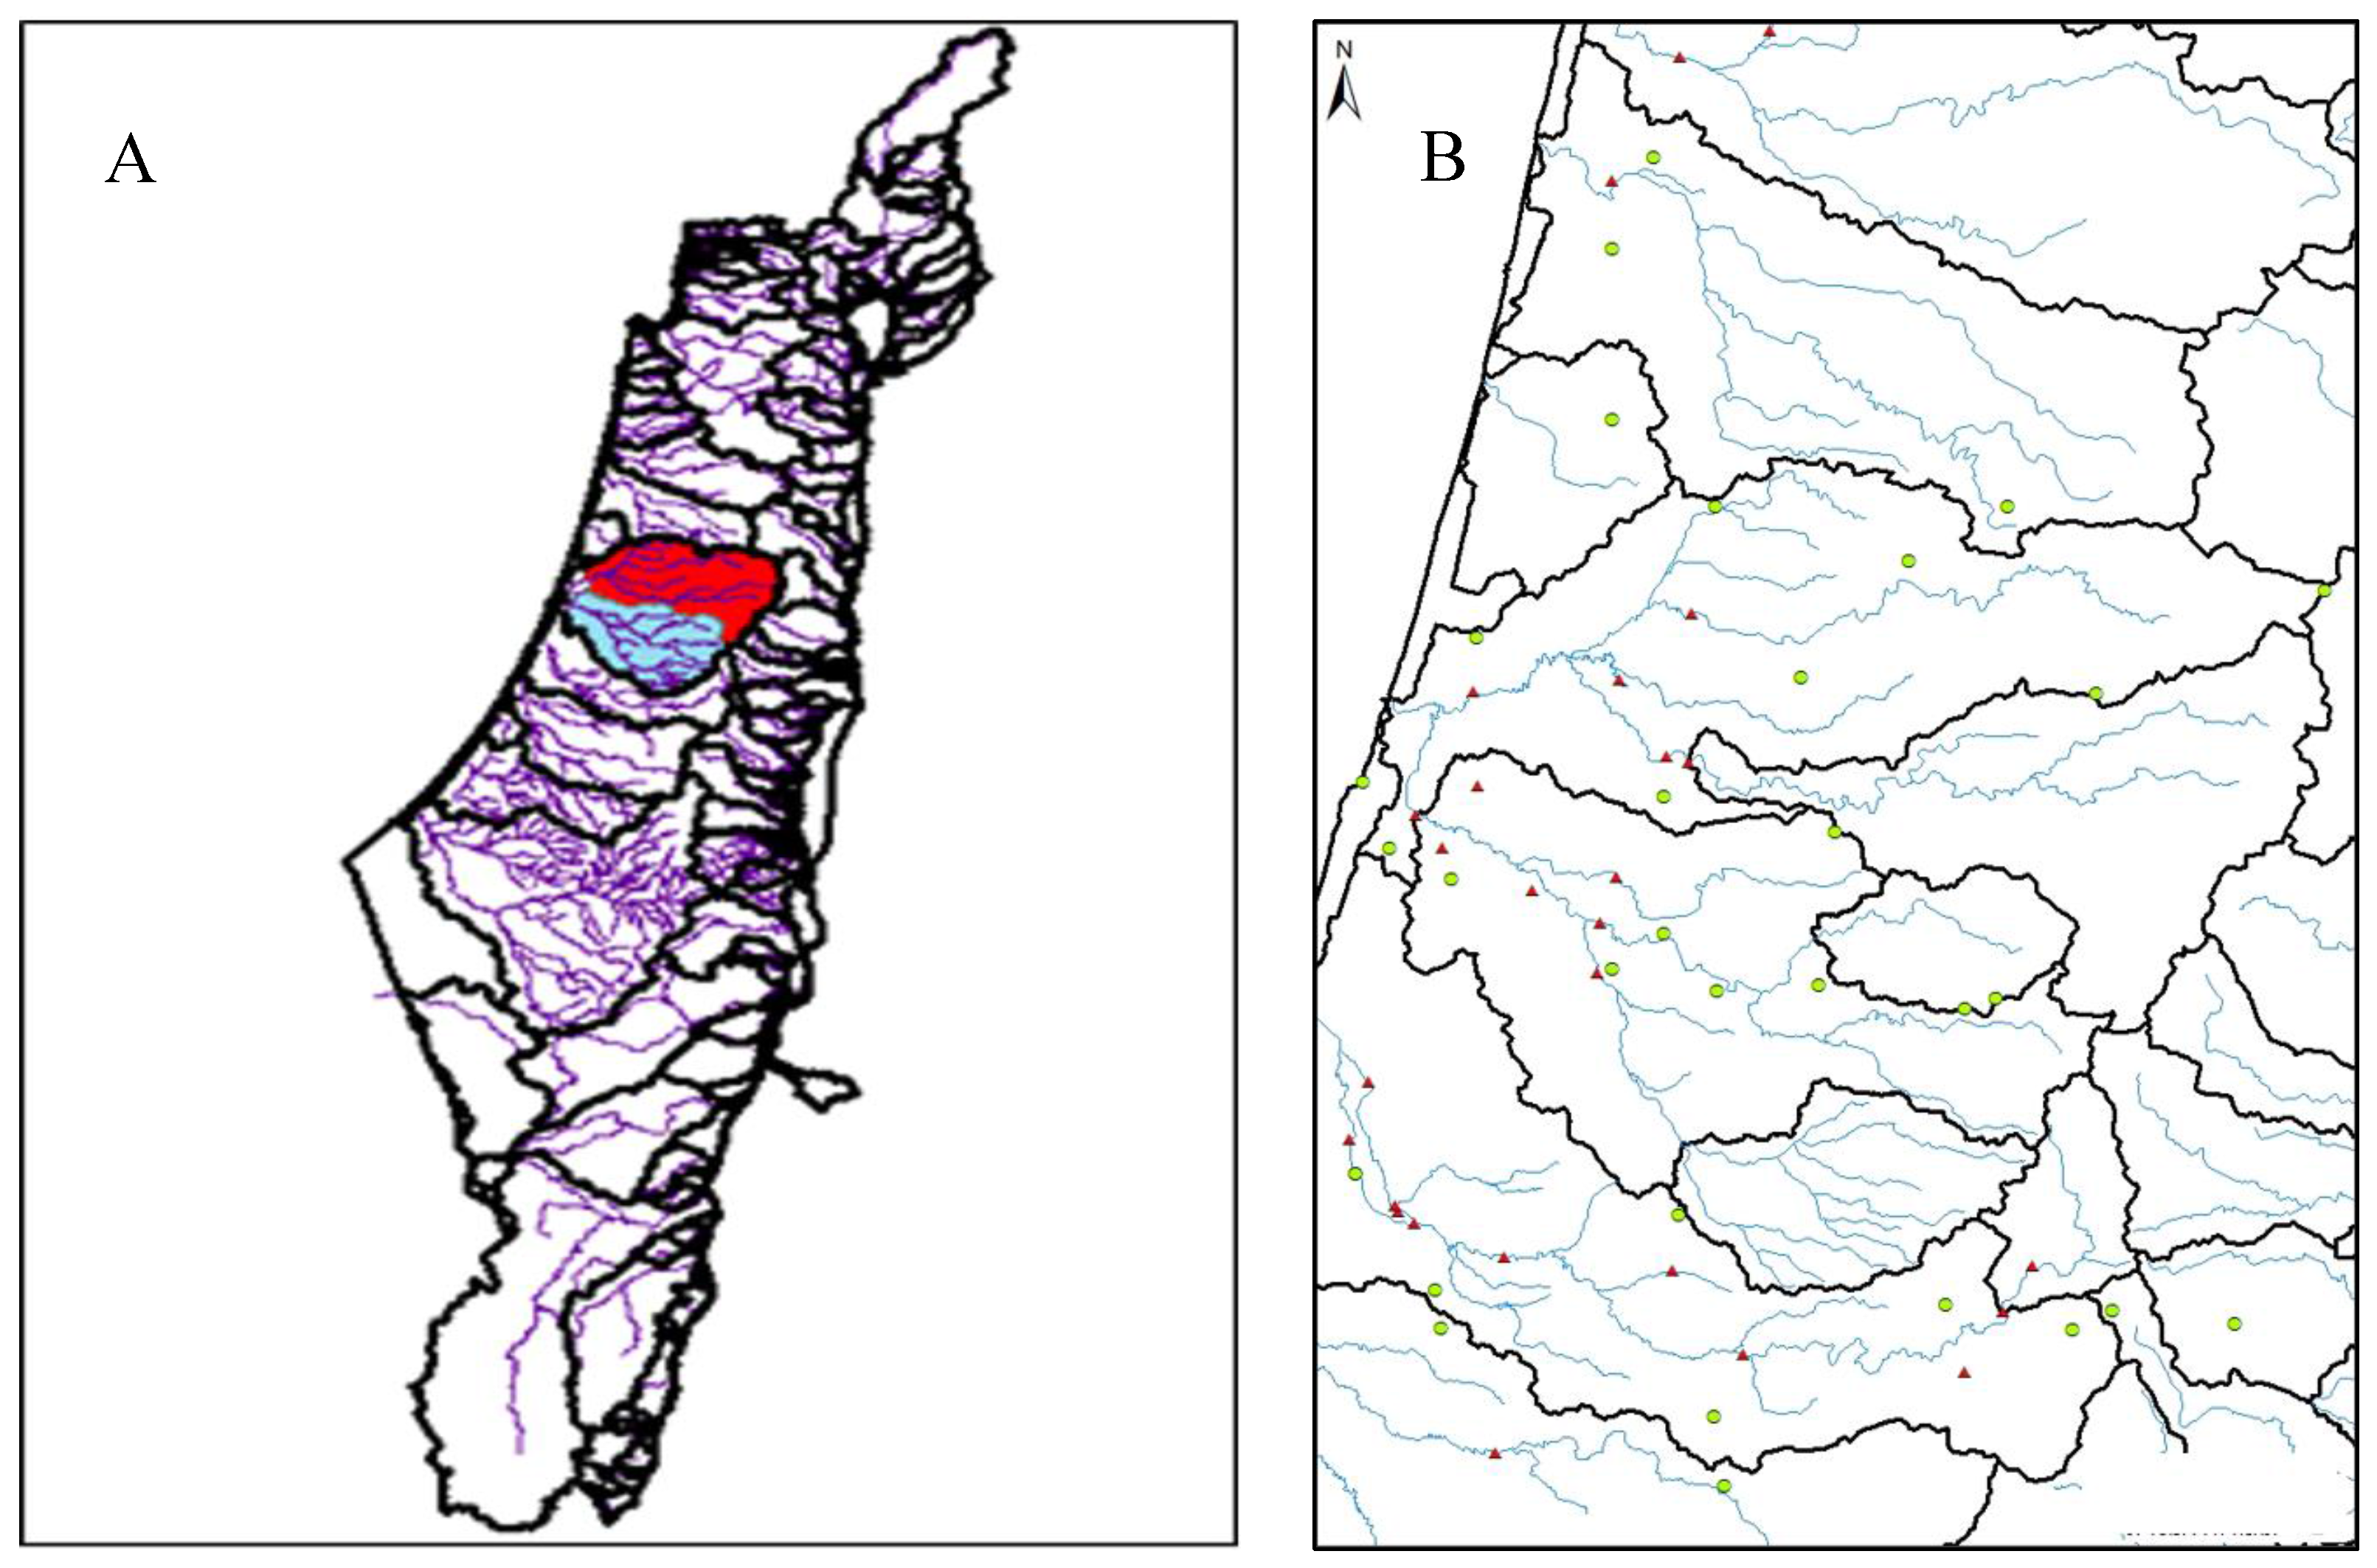
To this end the hydrological simulations were run with different sources of precipitation as input: observed rain gauge data, offline simulated precipitation from the WRF model (WRF one way) and online simulated precipitation from the fully-coupled atmosphere-land-hydrology WRF/WRF-hydro model (WRF two way). In addition to use of the experimental WRF-Hydro model, all precipitation scenarios were also evaluated within the currently operational HEC-HMS modeling system within the Israeli Hydrologic Service.
The modeling tools presented in this study are used to support operational hydro-meteorological forecasting in this region.

2. The Study Area

The domain in this study covers areas in southern Lebanon, Israel, West Jordan and Eastern Sinai. Figure 1 and Figure 2 show the WRF and WRF-Hydro modeling domains, respectively. For the two-way coupled model experiments, the distributed hydrological routing functions contained within the WRF-Hydro extension package were activated only on the innermost WRF domain (D03, see below).
Israel, located in the eastern Mediterranean between 29° and 33° latitude, is characterized by varied climate and hydrological regimes. Mediterranean Sea, which includes Israel, is located at the border between the Mediterranean and arid climatic regimes. The precipitation season extends from September to May. The most significant amounts are observed during the cold season, i.e., December-January-February (DJF), and are associated with Mediterranean cyclones, for which there are several climatological descriptions (e.g., Alpert et al. 1990 [42]). There are strong north-to-south and west-to-east differences in observed precipitation, which have significant hydrologic consequences. These differences are mostly due to the preferred tracks followed by the cyclones, their intensity, and their interaction with the local topography and complex coastlines (Saaroni et al. 2010 [25]). Furthermore, the spatial distribution of the precipitation varies from year to year due to the inter-annual variability of the frequency of the various types of cyclones (Goldreich, 2003 [43]). The main hydrological basins in Israel are characterized by complex topography, various land uses, and coast lines, are not properly resolved in the coarse models. Accurate and useful forecasts require physical based finer spatial high resolution on the scale of a few kilometers. The Mediterranean coastal areas in the center of the country experience rapid land use changes in the recent decades. Ohana-Levi et al. (2015 [44]) calculated using remote sensing the land use changes in the Aylon basin and found significant decrease in the forest and natural areas in the basin while increase in the urban areas for the period 1989–2009. Using a hydrological model they found an increase in runoff volume and peak discharge between the time periods as a result of land use change. A strong relationship was detected between vegetation cover and the runoff volume. The land use with most pronounced effects on runoff volume were related to urbanization and vegetation removal Ohana-Levi et al. (2015 [44]).
We chose the Ayalon basin as a case study for the hydrometeorological simulations. This 800 km2 basin (around 20 km width and 40 km long), located in central Israel, is largely unregulated and drains into the Mediterranean after crossing through the city of Tel Aviv. During extreme flood events, the Ayalon River rising waters cause flooding in neighborhoods, roads and railways in the southern part of Tel Aviv. The Headwaters Mountains of the Ayalon River are typically composed of karstic limestone while the lower parts of the basin are characterized by heavy soils and urban areas with low infiltration rates, leading to a short concentration time and rapid runoff. Figure 3A,B displays the location of the Ayalon basin in central Israel (A) and the rain gauges (in circles) and hydrometric stations (in triangular) located in the basin (B). Due to rapid land development in the watershed it can be challenging for operational agencies to rely on highly calibrated models that require long calibration periods and the need to operate and test other hydro meteorological tools is growing.

3. Methodology

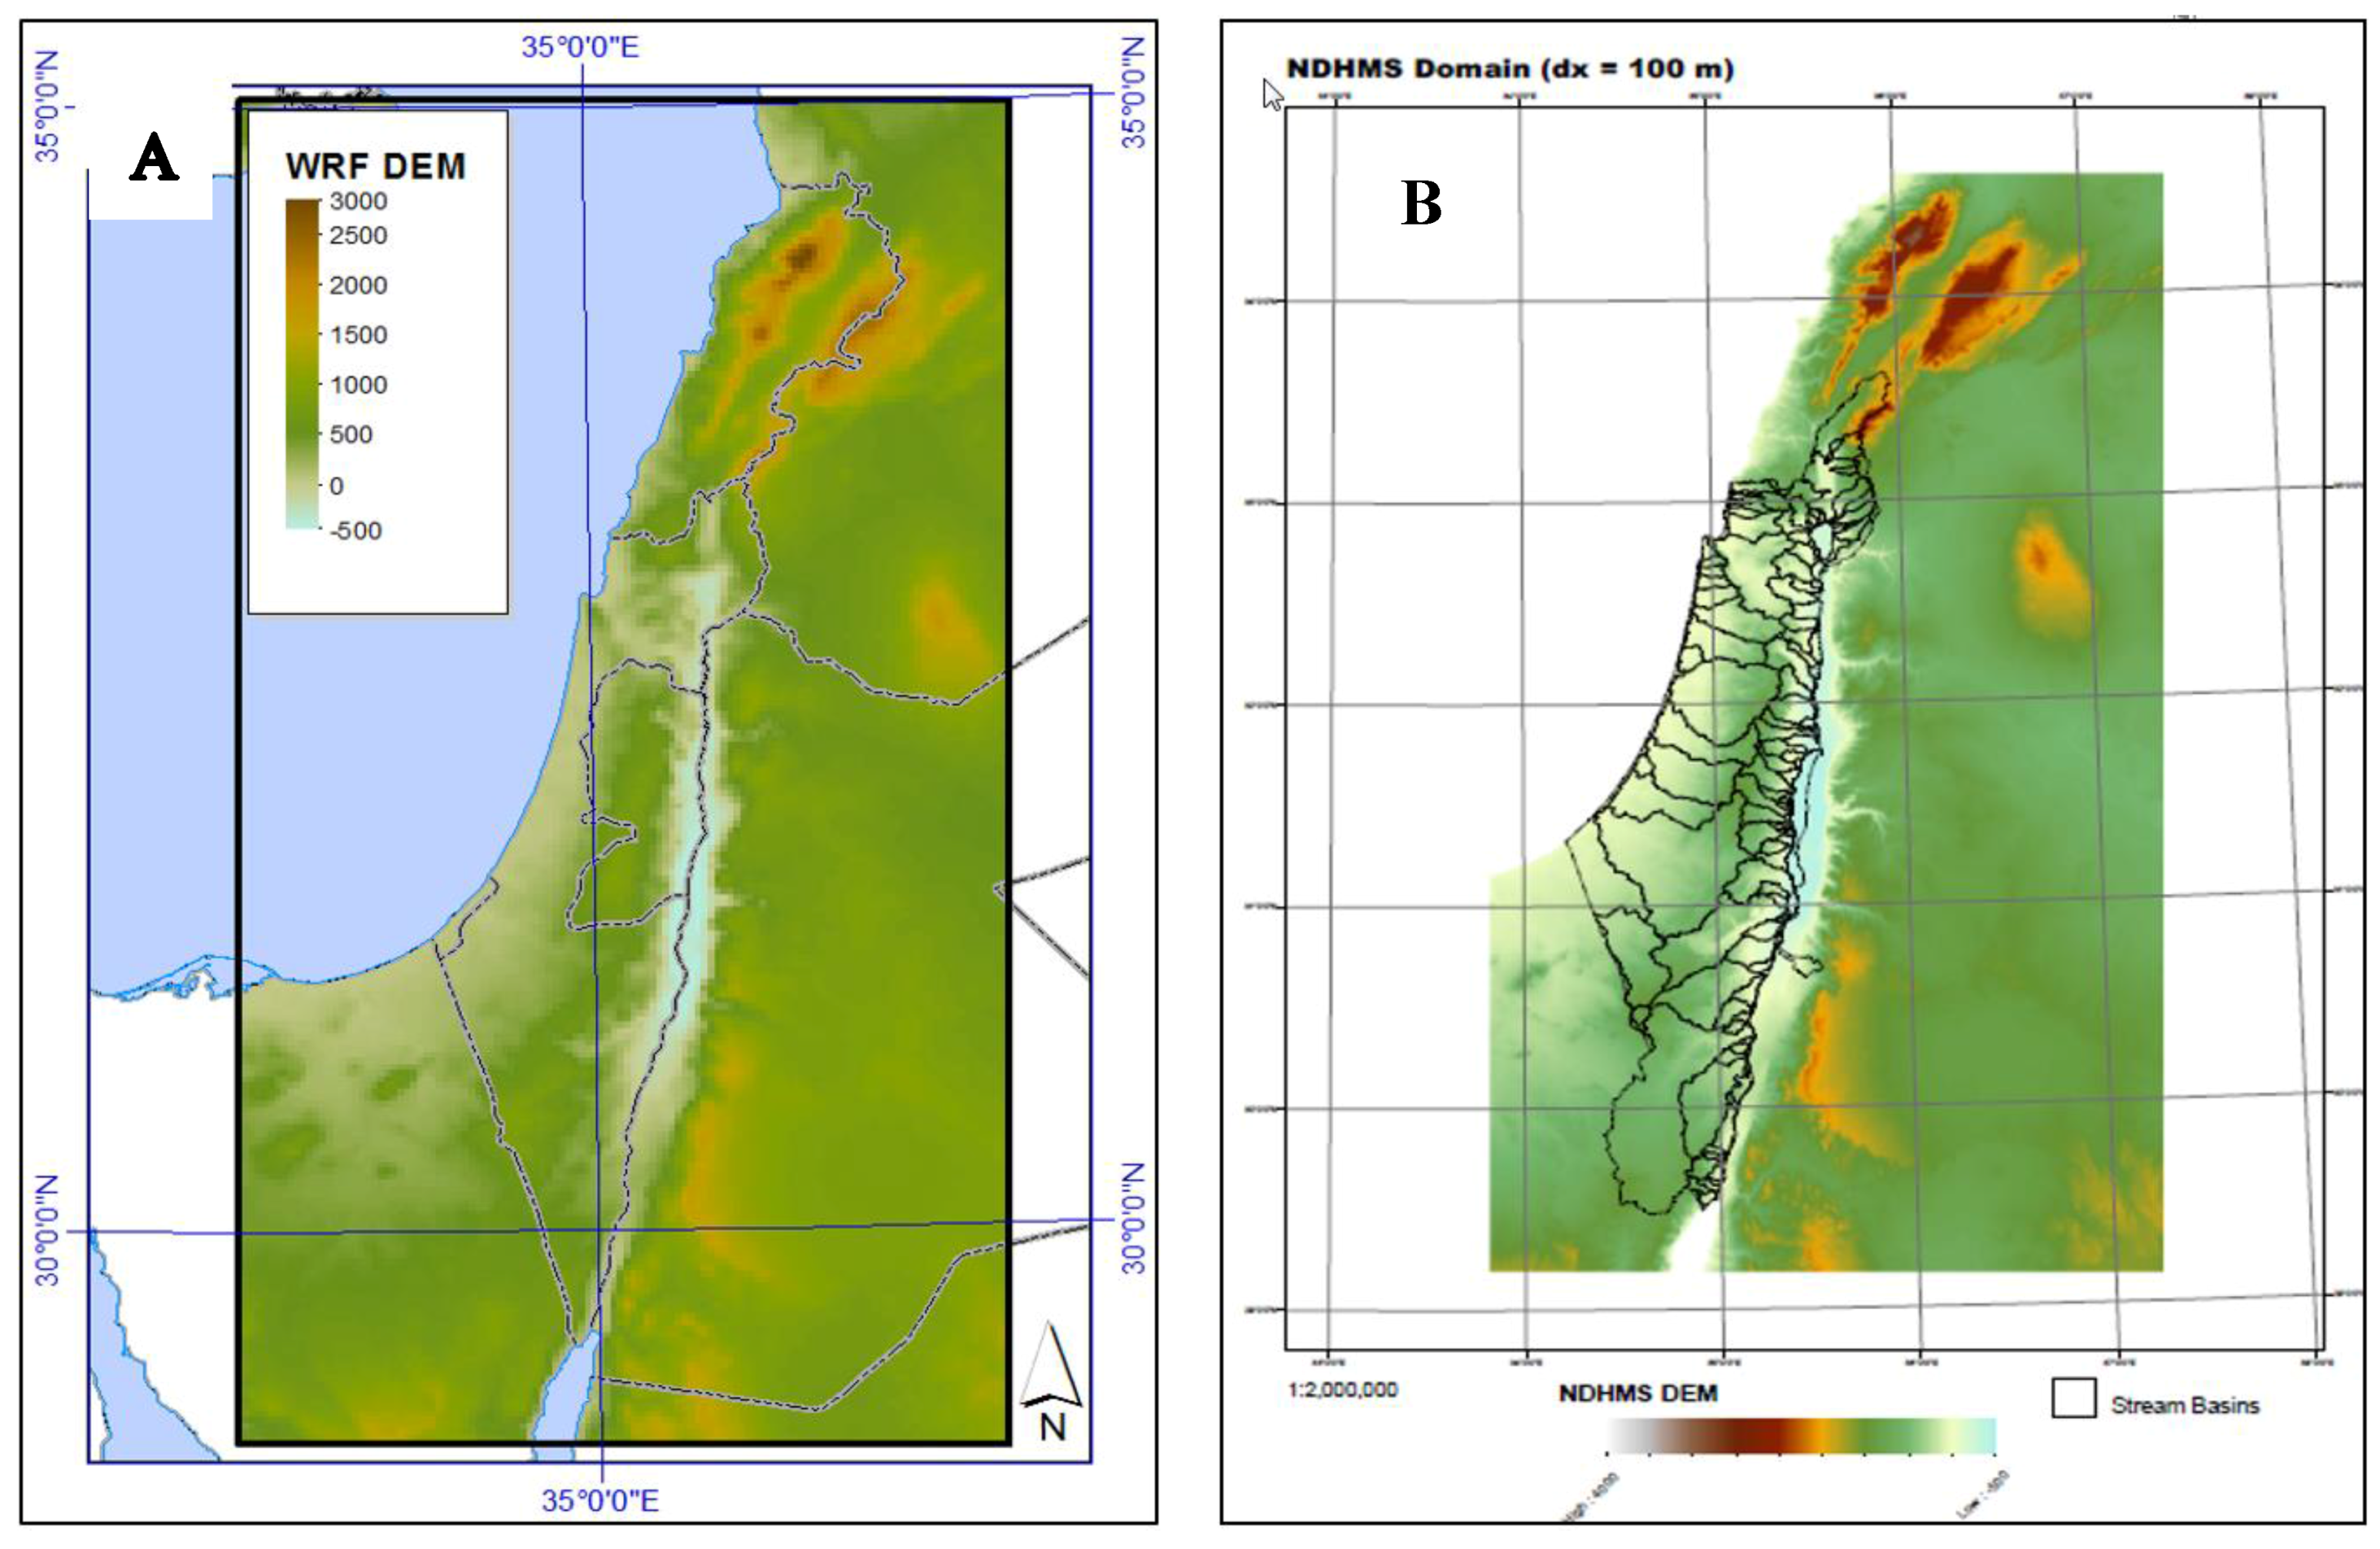
3.1. The WRF Model Configuration in This Study

The WRF model simulations were initialized with 0.25 degree NOAA/NCEP GFS model data driven from re-analysis cycles. The model consisted of three domains: D01 with a 140 × 140 grid of 27 km. cell size, D02 with a 187 × 184 grid outer domain of 9 km resolution, and the third D03 inner grid with 120 × 222 cells at 3 km spacing (see Figure 1). The model resolution was chosen based on Givati et al. (2012 [26]) who carried out many simulations individually by dropping the fine-mesh domains in sequence in order to study the impact of model resolution and the different micro-physical schemes on different type of precipitation in Israel. The WRF modeling system allows for several choices of physics parameterizations, the selection of which must be carefully considered for specific forecasting applications. Givati et al. (2012 [26]) tested a variety of WRF microphysical schemes and different horizontal resolutions for a subset of weather events in Israel, including:
  • “mp2” and “mp6” (MP means Micro Physics options, WRF Single-Moment 6-class scheme (Hong and Lim, 2006, 2010 [45,46])
  • “mp7”, the Goddard microphysics scheme
  • “mp8”, the Thompson scheme
  • “mp10”, the Morrison double-moment scheme.
In light of the finding of Givati et al., 2012 [26] the following physics scheme was chosen for this study:
Land-Surface: Noah, Surface Layer: Monin–Obukhov, PBL: YSU (non-local mixing), Shortwave Radiation: Dudhia, Longwave Radiation: RRTM, Cloud Microphysics: mp_physics = 6; WSM 6 = class scheme, Cumulus scheme (domains 1 and 2): Kain-Fritsch.

3.2. The Hydrological Models: WRF-Hydro and HEC-HMS

Two hydrological models were used in this study to assess the performance of simulated hydrographs driven by various precipitation sources: the National Center for Atmospheric Research (NCAR) WRF-Hydro model and the HEC-HMS model. The WRF-Hydro is a fully distributed model that capable of capturing the spatial distribution of input metrological variables and physical parameters (land use, soil, elevation, etc.). The precipitation The Hec-HMS works with lumped approach, using only rainfall as an input (the discharge at the watershed outlet is described based on concept like the unit hydrogram, UH) without feedback between the land surface to the atmosphere. Using both models and approaches for operational flood forecasting system can show the differences in the simulated hydrographs in respect to the observed.
The WRF-Hydro model coupling extension package provides a means to couple various hydrological model components to atmospheric and other earth system modeling architectures. The extension package has been developed to improve representation of terrestrial hydrologic processes related to the spatial redistribution of surface, shallow subsurface and channel waters across the terrain. A suite of terrestrial hydrologic routing physics is contained within version 2.0 of WRF-Hydro (Gochis et al. 2013 [47]). The model configuration used here constitutes a fully distributed, 3-dimensional, variably-saturated surface and subsurface flow model. The coupling of terrain routing, channel and reservoir routing functions into the one-dimensional Noah land surface model was motivated by the need to account for increased complexity in land surface states and fluxes. The aim of these added process representations is to provide a more physically-realistic conceptualization of terrestrial hydrologic processes compared to the simple vertical column models used in the Noah land surface model within WRF.
The implementation of the two-dimensional and one-dimensional diffusive wave surface overland flow modules and the Boussinesq subsurface saturated flow module into the Noah land surface model were described by Gochis and Chen (2003 [48]). The main runoff calibration parameters in the model relate to partitioning the amount of water that infiltrates into the soil column versus the portion that moves laterally via overland flow to determine the water movement, both surface and subsurface, into channels. Initial soil moisture values are provided to WRF-Hydro from the WRF model pre-processing (WPS) system. The overland flow routing parameters determine how fast water moves across the landscape and along the channels. The rougher the surface, the longer it takes for water to reach the channels and, therefore, the higher the chance that water will infiltrate into the soil prior to reaching channel elements. So the roughness parameter affects both the timing and amount of streamflow. Default soil hydraulic parameters for the Noah land surface model are specified in Ek et al. (2003 [49]) and are provided in a table of parameters as functions of soil type. These tables are then modified as part of the model calibration. The model contains a default table of Manning roughness coefficients for overland flow that vary depending on the USGS vegetation types as those vegetation types are defined in the Noah land surface model. Default values of roughness parameters were obtained from Vieux et al. (2003 [50]). Additionally, the roughness coefficients in WRF-Hydro can be adjusted by using a scaling factor on grid parameter values which can be specified along with the input data grids. Channel routing parameters in the model are linked to stream order values. The Manning roughness coefficients, whose default values are assigned for each channel pixel and vary as functions of stream order in the domain. In general, as the stream order increases toward the basin outlet, the Manning roughness coefficients decrease as channels transition from small, higher gradient reaches with more coarse material to wider, low gradient, sedimentary reaches. Stream geometry also is specified to vary as a function of stream order with higher order streams having wider bottom widths and shallower side slopes. This stream order indexing method offers an approximation for determining channel flow speed, which simplifies model configuration, even though it does not strictly match the true channel structure or roughness.
The Hydrologic Modeling System (HEC-HMS) was developed by the U.S army. The model is designed to simulate the precipitation-runoff processes of dendritic drainage basins. A model of the watershed is constructed by separating the water cycle into lumped sub-catchments and constructing boundaries around the watershed of interest. Mass and energy fluxes are represented within the system in addition to basic rainfall-runoff processes (USACE, 2007 [51]). The model is widely used and accepted for many official purposes, such as floodway determinations for the Federal Emergency Management Agency in the United States.

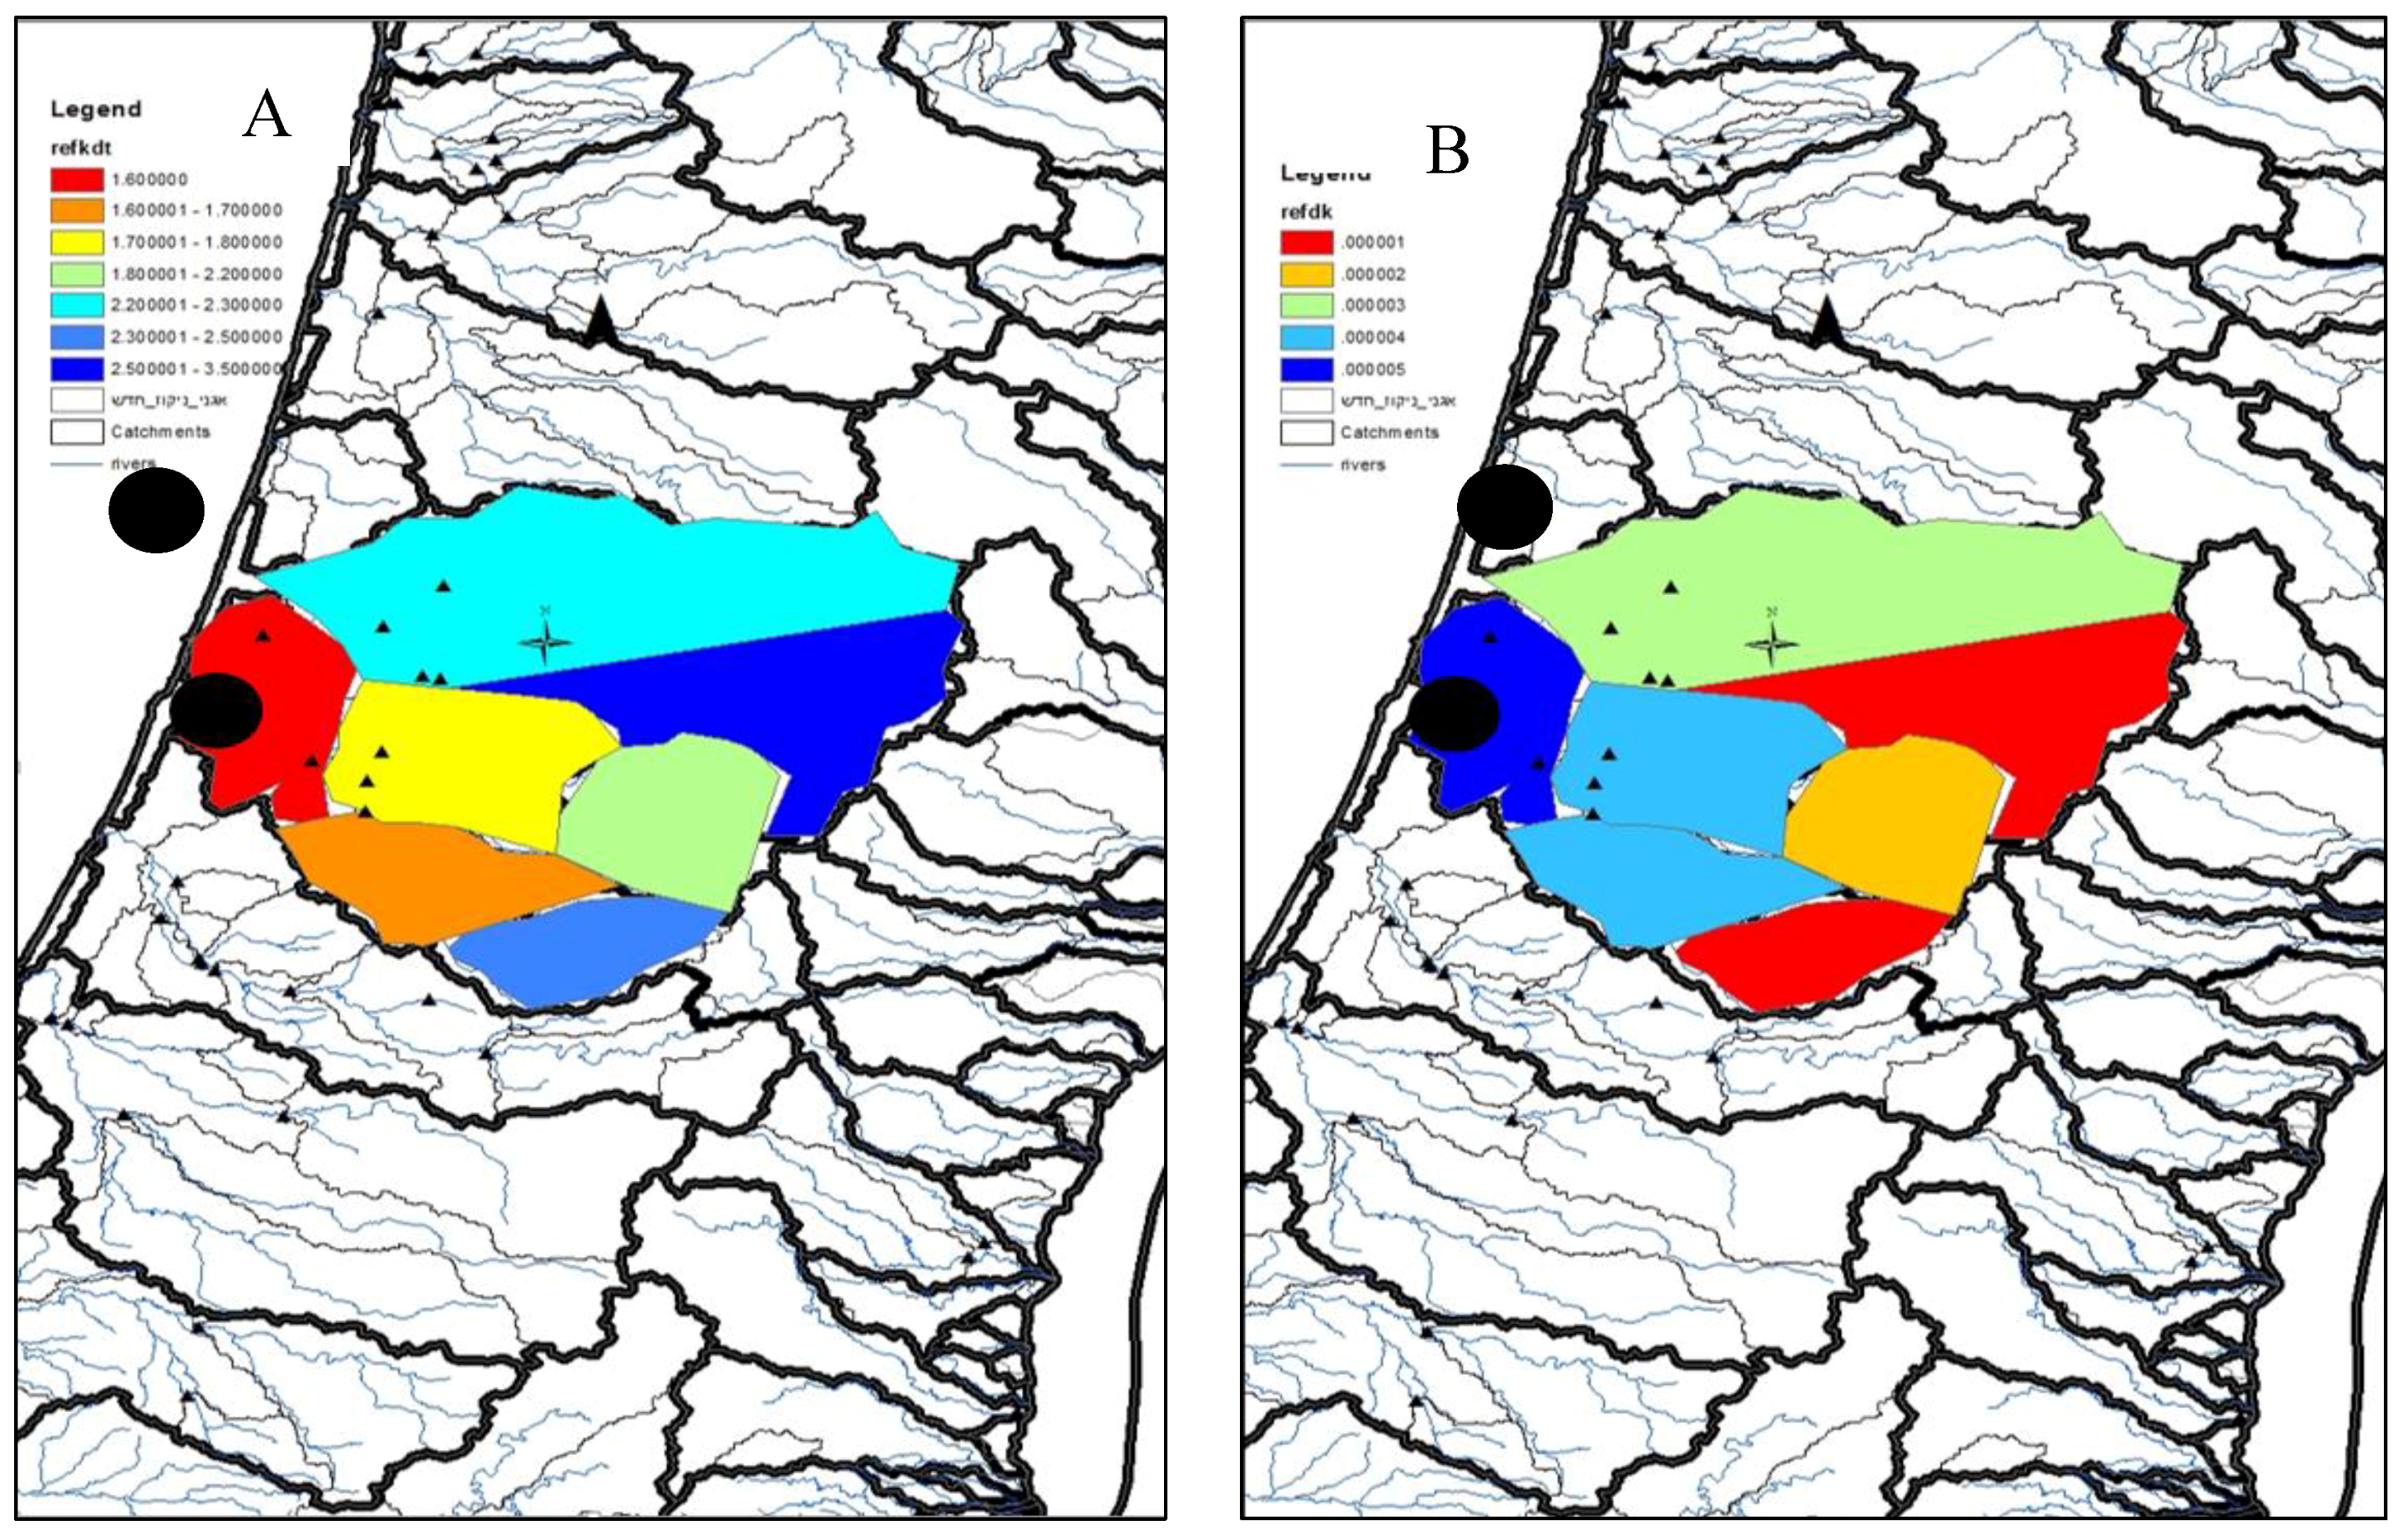
3.3. WRF-Hydro and HEC-HMS Calibration and Validation Process

Both hydrological models were calibrated based on observed hourly precipitation data from rain gauges in and around the Ayalon basin that were interpolated using the same methodology. Data from 20 IMS (Israeli Meteorological Service) rain gauges were used for calculating hyetographs within the Ayalon River basin. The rain gauge data were interpolated to the 3 km WRF grid using the Inverse Distance Weighted (IDW2) methodology (Lu and Wong, 2008 [52]) in ArcGIS.
The models were implemented, calibrated and evaluated for the following storm events: 4–10 January 2013, 10–14 December 2013 and 6–17 Januanry 2015 at hourly time steps. To provide an operationally-relevant assessment the models were then run for the full 2014/2015 rainy season (November 2014–March 2015) for validation. The HEC-HMS model was driven by WRF atmospheric model forecasts. The WRF-Hydro modeling systems was then run in both a one-way coupled mode using WRF-only atmospheric model forecasts and then the two-way coupled WRF/WRF-Hydro system was also run.
Model hourly time steps outputs were verified against observed stream flow measurements from the Israeli Hydrological Service at the Ayalon basin. The January 2013 case study represents a rare storm event when several parts of Tel Aviv were flooded. The return probability for this flood was calculated to be 2%, a once in 50 year occurrence. The December 2013 event was a significant event with a near flooding stage at the Ayalon Highway, and with a return probability of 5%. The simulation for January 2015 represents two weeks of flow with several peaks along the Ayalon River.

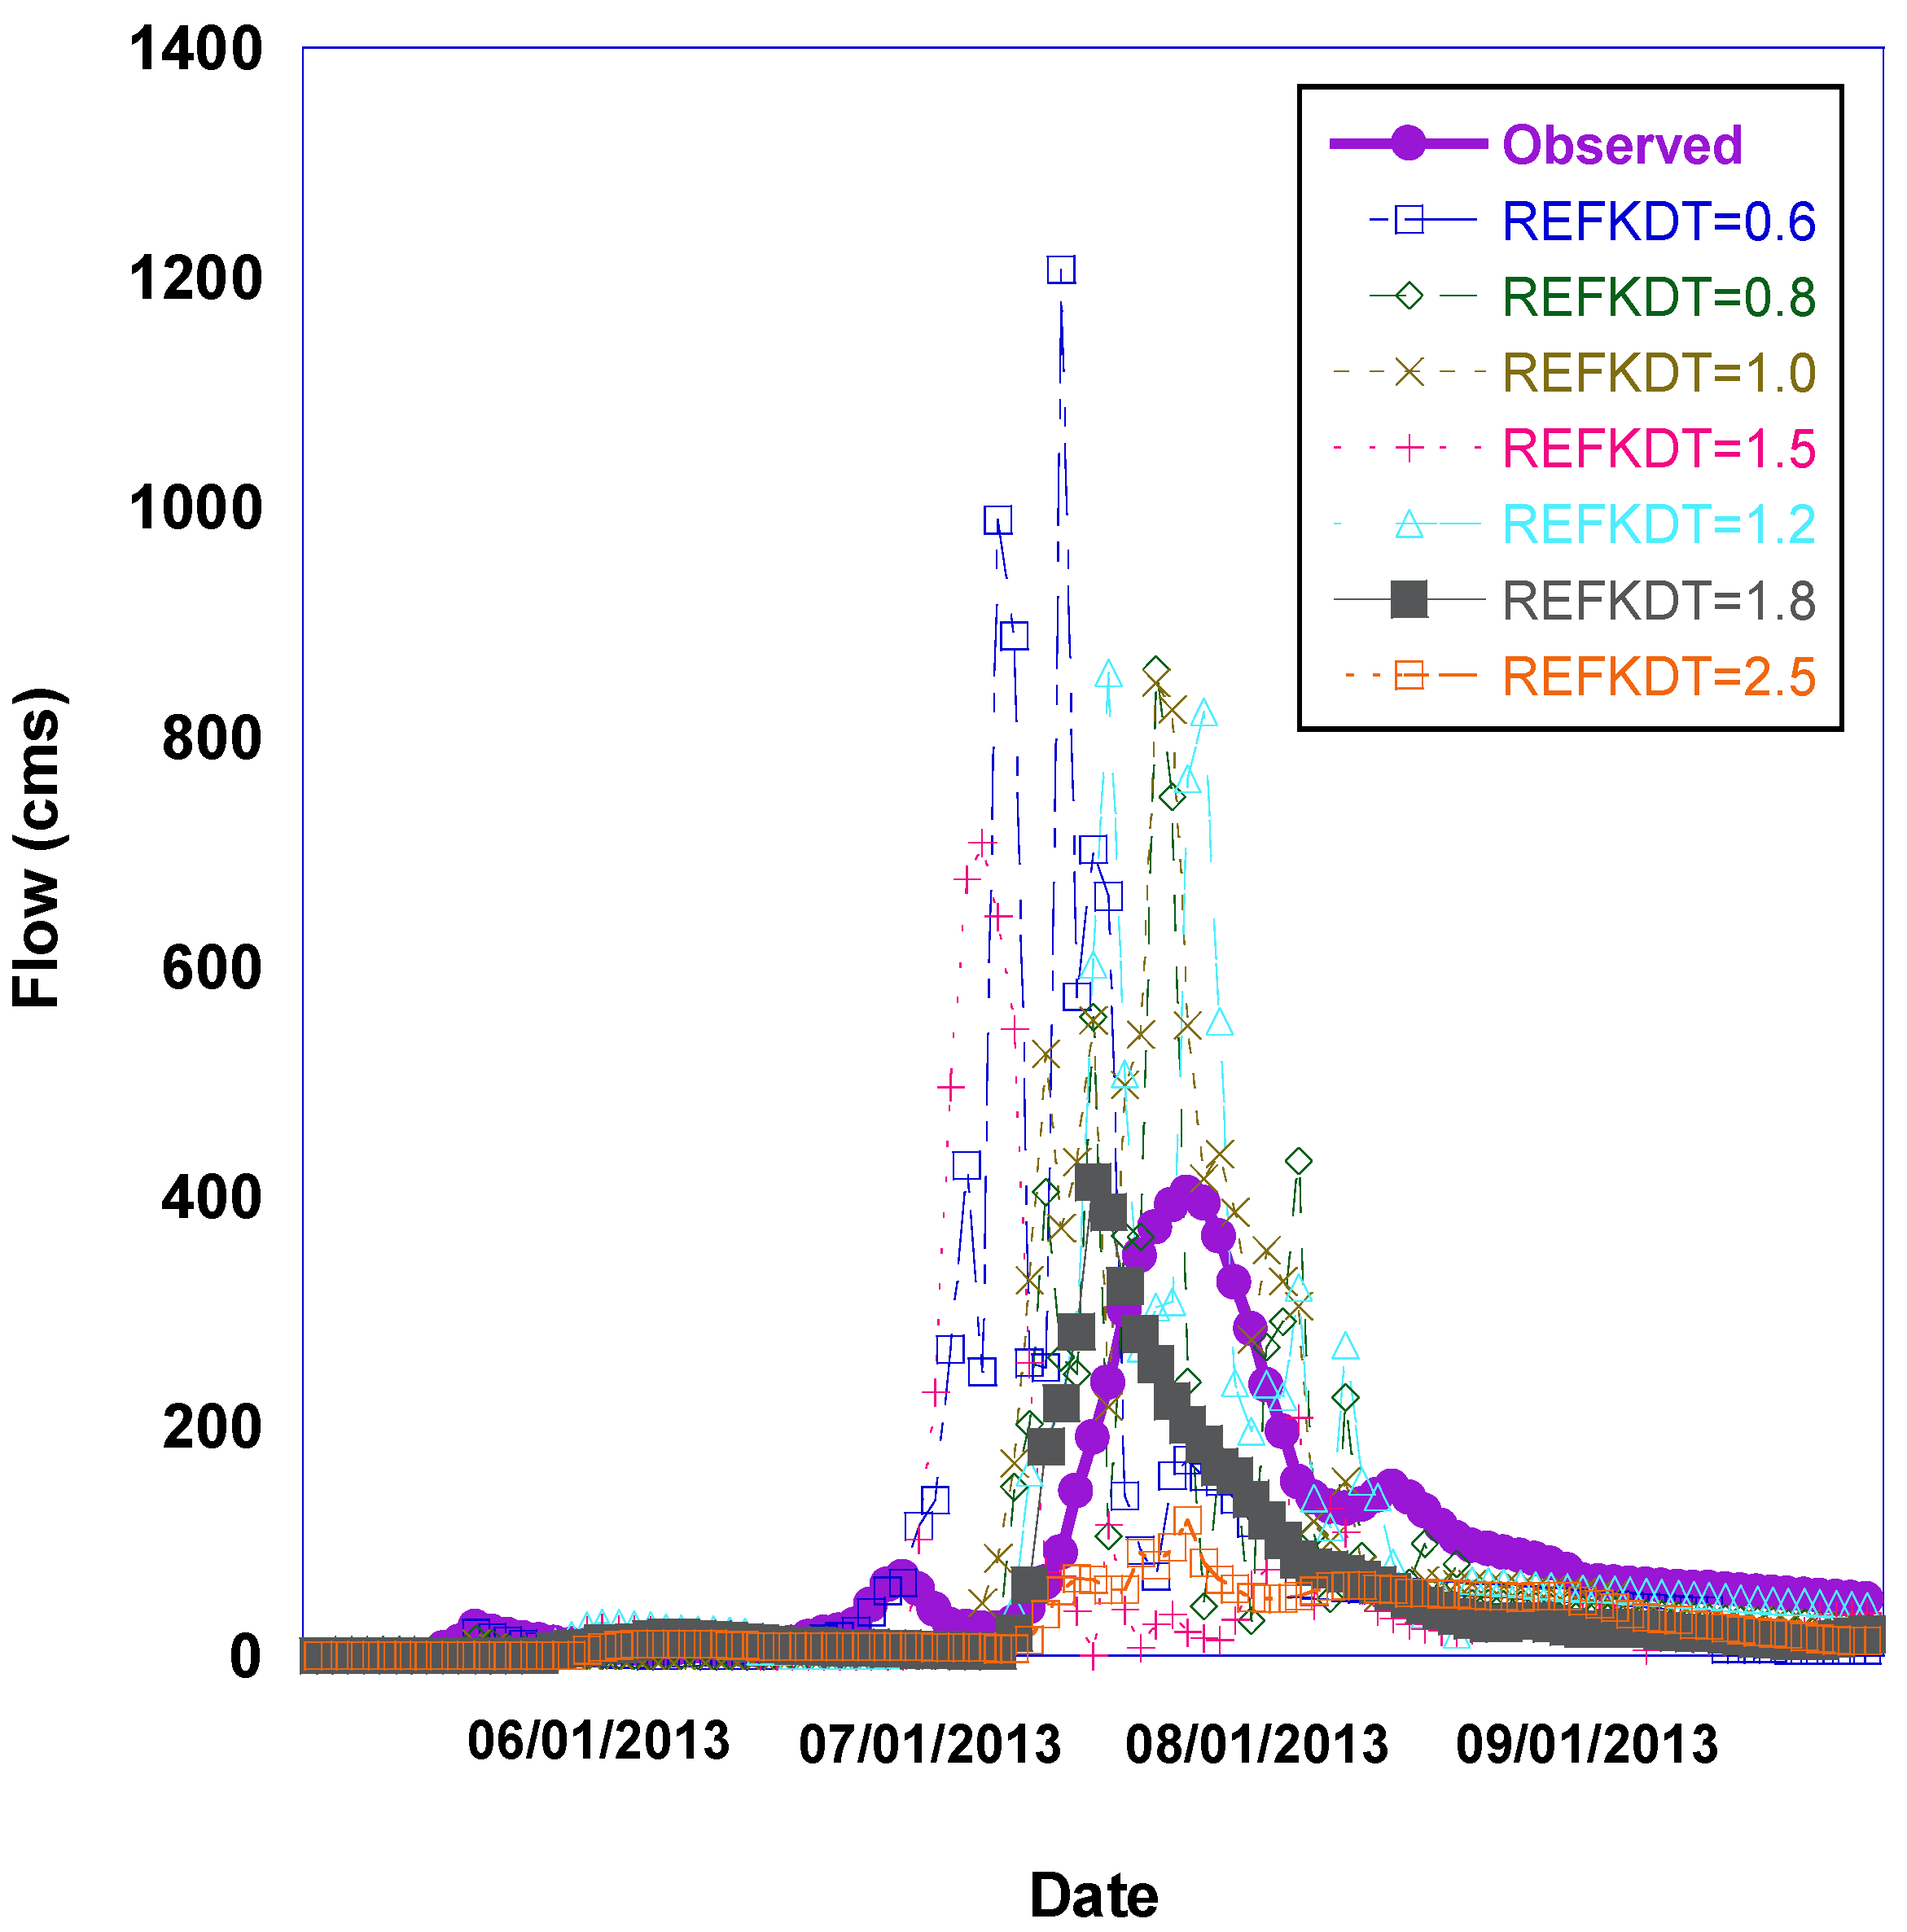
3.3.1. WRF-Hydro Calibration

A priori parameter sensitivity tests were conducted in order to choose the best roughness parameter values (Manning roughness coefficients, and overland roughness scaling factor-OVROUGHRTFAC within the WRF-Hydro model) that control the overland flow were adjusted. We used the default values set by the Israeli Hydrological Service calculated discharge at the Ayalon basin (using velocity and channel dimensions). The Manning coefficients that were set to the Aylon Basin were 0.06 for stream order 5, 0.14 for stream order 4 and 0.20 for stream order 3, 0.25 for stream order 2, 0.50 for stream order 1.
The soil hydraulic parameter that corresponds to the scaling of saturated hydraulic conductivity for silty clay loam (REFDK in WRF-Hydro) and the Infiltration/runoff generation parameter (REFKDT) were manually calibrated over multiple simulations. REFDK and REFKDT both are scaling parameters for surface runoff within the Noah_LSM model to control the amount of runoff produced for a given volume of precipitation. In particular, the REFKDT parameter significantly impacts surface infiltration and hence the partitioning of total runoff into surface and subsurface runoff (Schaake et al. 1996 [53]).
Recently, Yucel et al. (2015 [54]) performed a similar calibration to WRF-Hydro simulations with different REFKDT, REFDK, OVROUGHRTFAC values in order to find the optimum values for their basin in western Turkey. They found that the REFKDT is the most sensitive parameter in controlling runoff responses to heavy rainfall events and that increased values of REFKDT causes a decrease in discharge. In this study we performed a total of 37 different simulations for different REFDK and REFKDT combinations. These parameters were then further adjusted along the length of the basin according to known basin physical characteristics: high infiltration rates at the karstic, upper part of the basin, and lower infiltration downstream (Figure 4A,B). Figure 5 shows the observed (in purple) and simulated vBarious WRF-Hydro hydrographs at the Ayalon–Ezra hydrometric stations for the January 2013 storm (04-10/01/2013) using various REFKDT values. It can be seen in the figure that the model is very sensitive to the infiltration parameter (the peak discharge ranges from 1200 m3/s with REFKDT = 0.6 to 50 m3/s with REFKDT = 2.5).

3.3.2. HEC-HMS Calibration

The HEC-HMS model has been previously implemented and calibrated for the Ayalon basin and was described at Givati and Sapir (2014 [27]). The modules that were chosen in this study for the Ayalon basin were Green and Ampt to describe the infiltration, SCS UH for unit hydrograph, Muskingum for routing and storage-discharge relationships, Recession Curve for secondary runoff and Simple Canopy for water capture at leafs (Givati and Sapir, 2014 [27]). The HEC-HMS model allows for a good representation of land cover and hydraulic installations, i.e., dimensions as well as inflow and outflow rates of reservoirs, channel diversions, bridges, and so forth.

4. Model Experiments

Detailed spatial and temporal patterns of precipitation are often difficult to predict and thus Numerical Weather Prediction (NWP) models (Nielsen-Gammon et al. 2005 [55]) often have significant sources of error. Errors arise from several sources such as resolution, spatial boundary conditions of global models and uncertainty in the model physics. Skillful forecasts of precipitation timing and magnitude are strongly linked to the ability of the NWP model to accurately depict the size and evolution of larger scale atmospheric disturbances (Fiori et al. 2014 [24]) in addition to local forcing mechanisms. Lack of precipitation forecast skill presents significant challenges in operational hydrological forecast models. The effectiveness of flood warnings also depends upon accuracy of certain physical parameters, such as the peak magnitude of the flood, its timing, location and duration. In basins with a short concentration time, where the lag between rainfall and runoff is up to a few hours (90 to 120 min), forecasted precipitation data are crucial to hydrological modeling in order to get some warning in advance.
The WRF-Hydro and HEC-HMS models were run with these different sources of precipitation as input:
-
Observed hourly rain gauge data as was described in Section 3.3.
-
Simulated 3 km hourly WRF-only precipitation in uncoupled mode based on initial conditions from GFS reanalysis data (FNL). The NCEP Final Operational Global Analysis meteorological data at 0.25 and 0.5 degrees based on GFS reanalysis are available at: http://rda.ucar.edu/datasets/ds083.2/.
-
Simulated hourly precipitation from the fully coupled WRF/WRF-Hydro at 3 km resolution (HEC-HMS has not been coupled to the WRF atmospheric model). In the coupled WRF/WRF-Hydro modeling system, the fluxes from the land surface feed back to the atmosphere and may evolve to impact the precipitation fields in the model.

5. Results

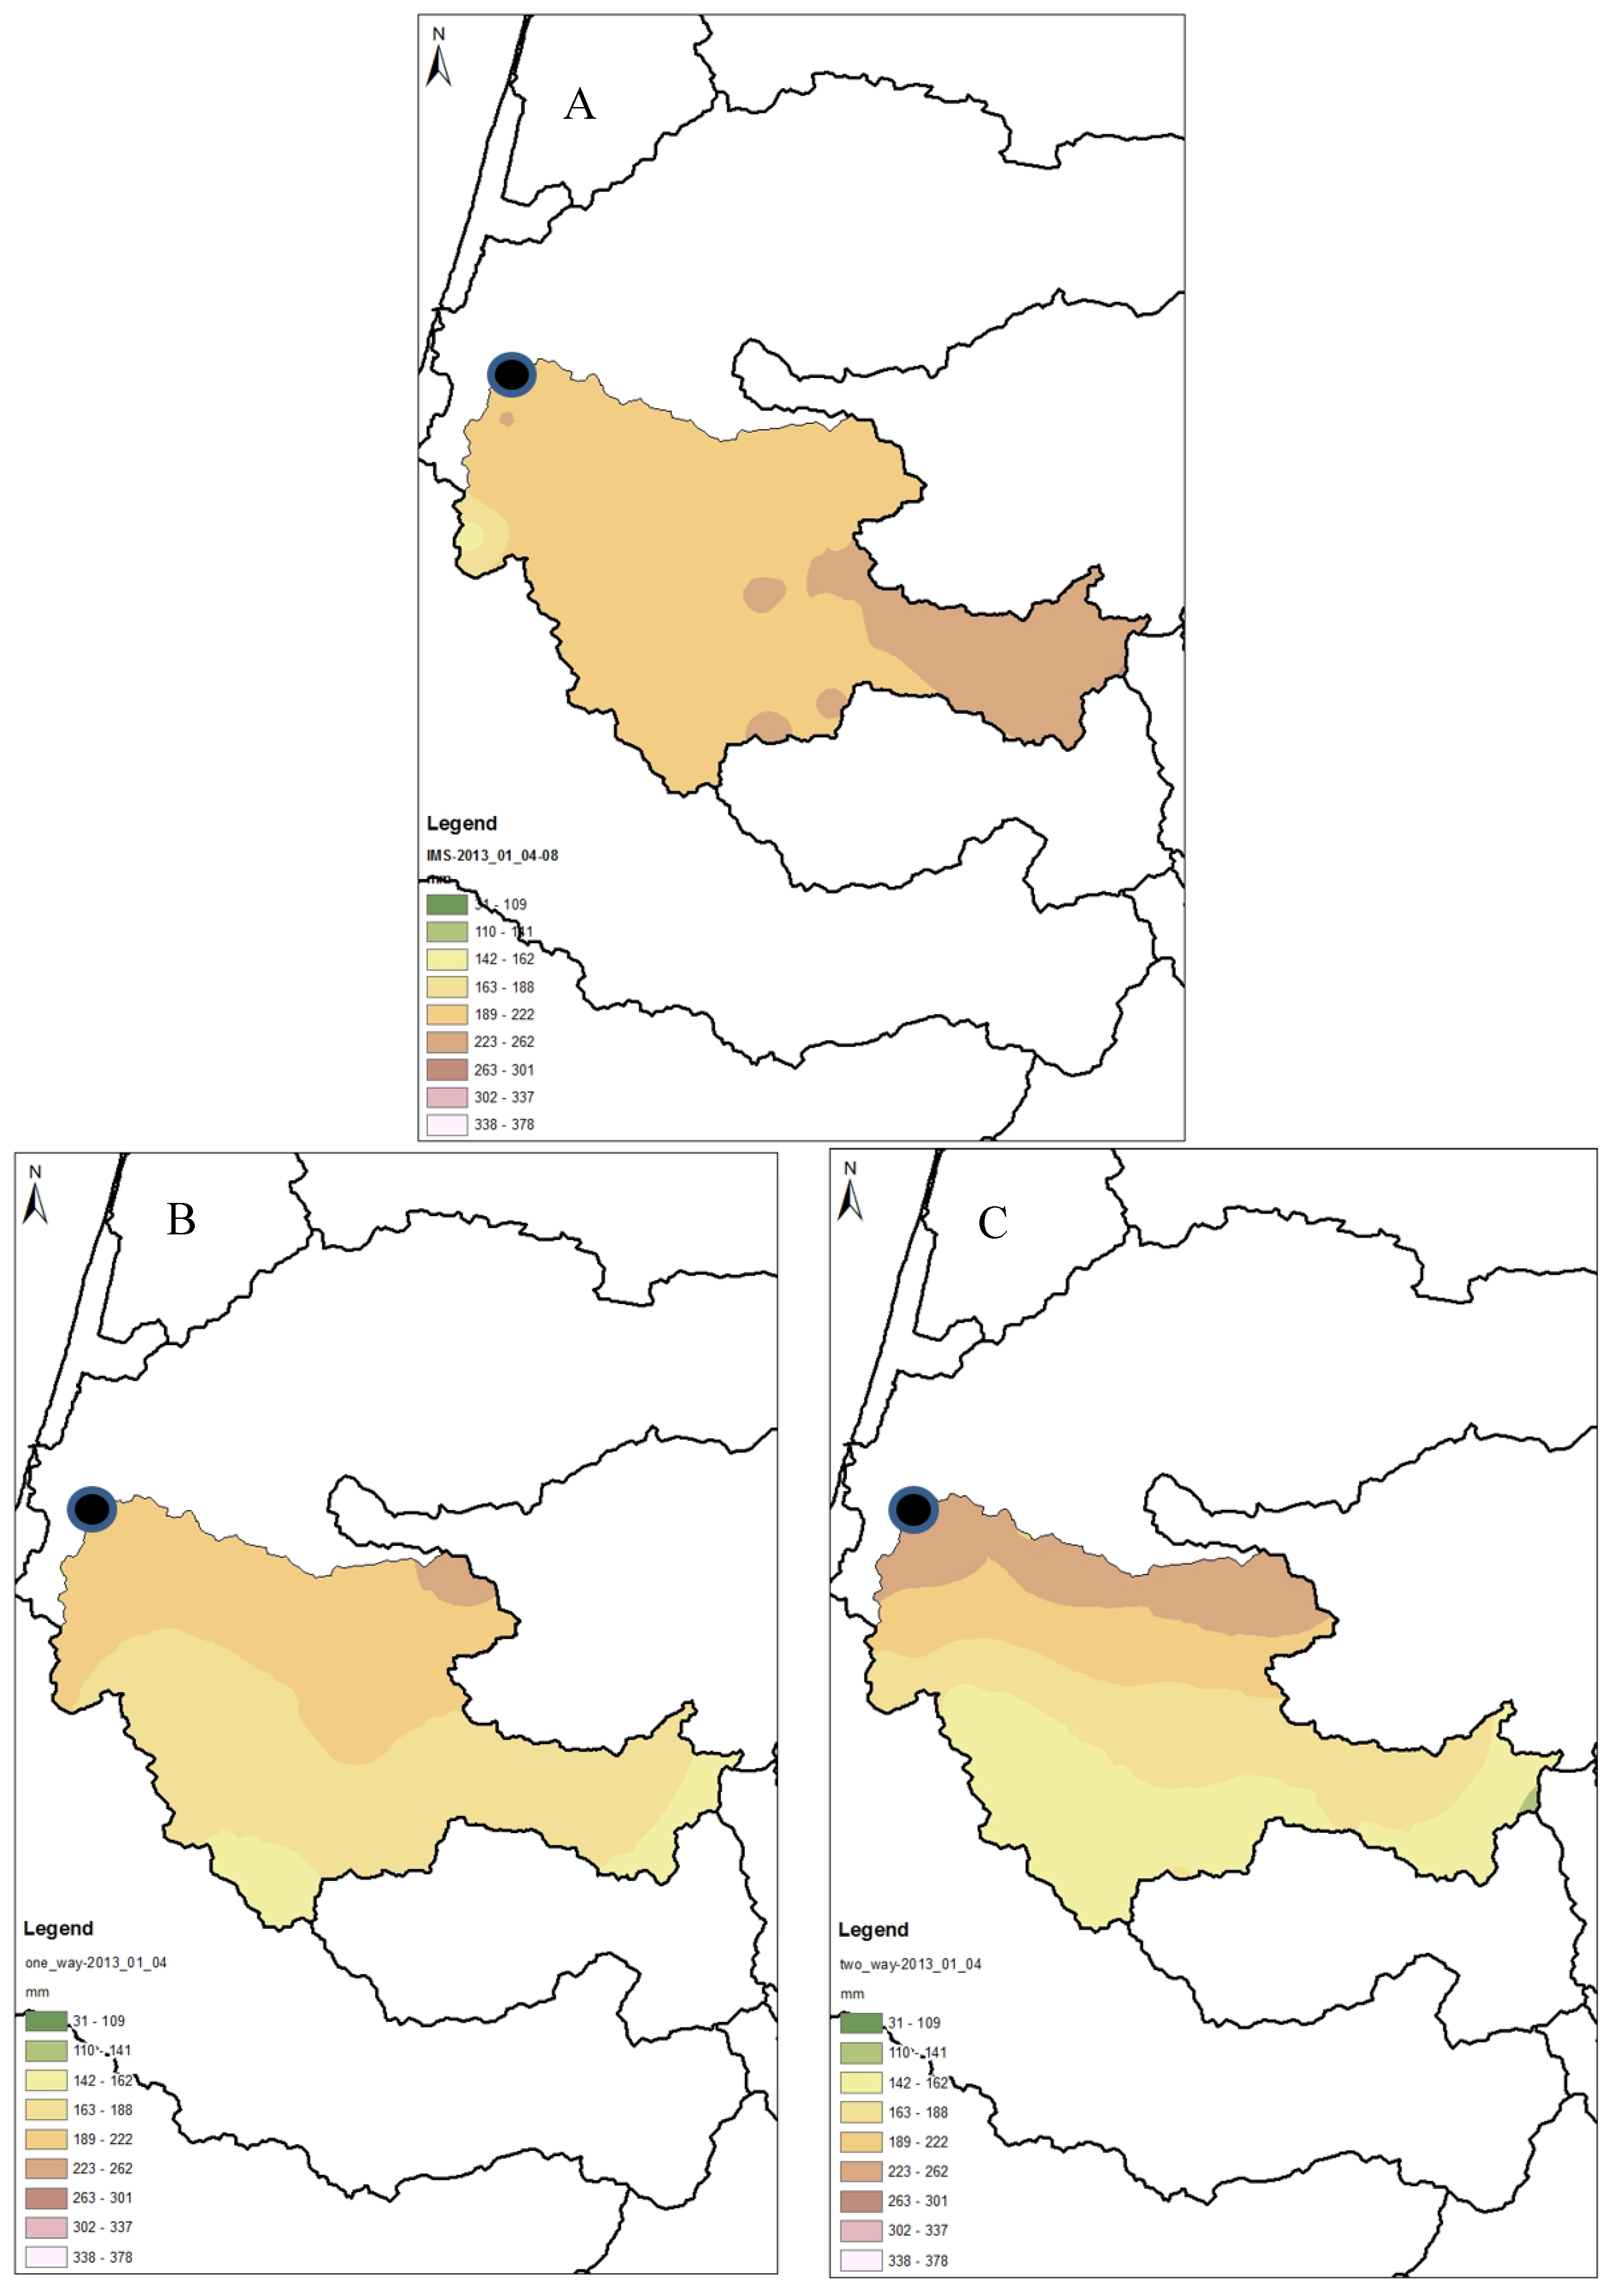
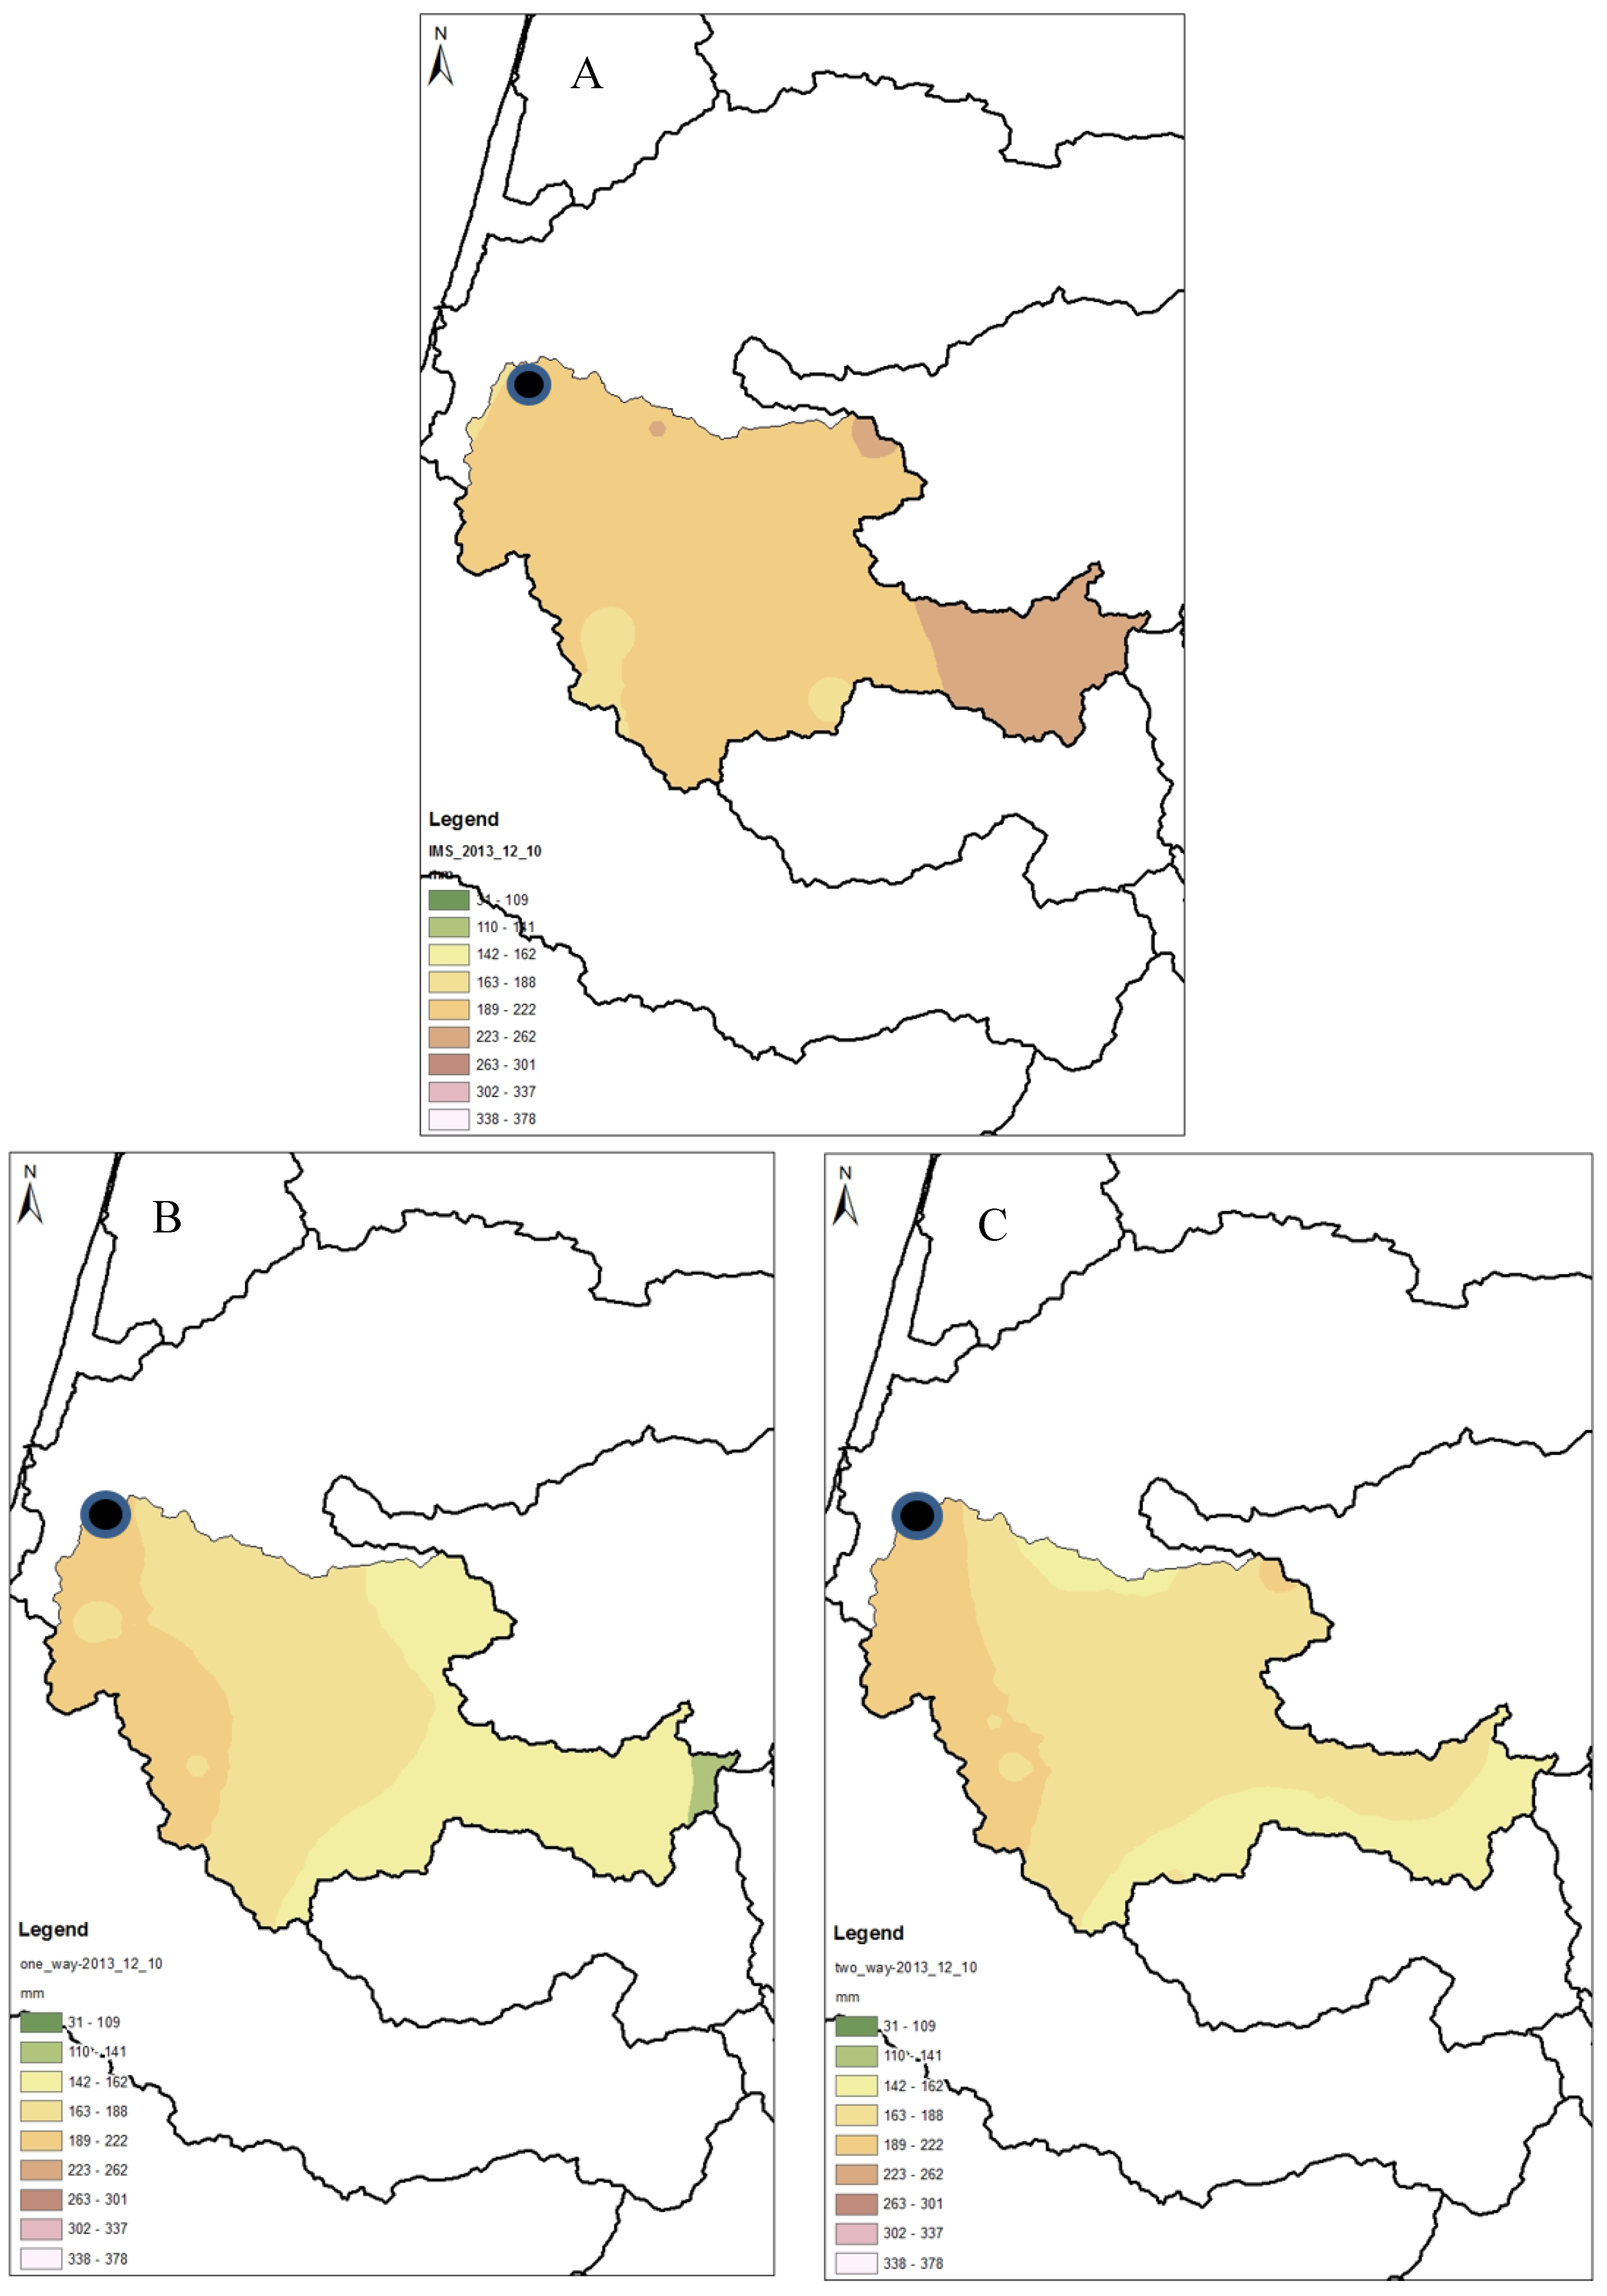
5.1. Observed Verses Simulated Precipitation

Figure 6A displays the total accumulated observed IMS interpolated precipitation for the Ayalon basin for the January storm (from the 4 January 2013 00:00 to 8 January 2013 23:00), while Figure 6B-C show the WRF one way (Figure 6B) and WRF/WRF-Hydro two way (Figure 6C) simulated precipitation (the black dot in the figure is the Ayalon-Ezra hydrometric station at the outlet of the basin). Figure 7A–C shows the same but for the December storm: Total accumulated (from the 12 December 2013 00:00 to 15 December 2013 23:00) observed precipitation (Figure 7A), WRF-only (Figure 7B) and WRF/WRF-Hydro (Figure 7C) simulated precipitation. Differences between the simulated WRF-only and WRF/WRF-Hydro can be seen in the figures. Both models underestimated the total observed precipitation in the basin at both storms between about 10%–15%, especially at the upper, eastern part of the basin.
Table 1 summarizes the precipitation simulation results on an averages basin values for the January and December storms. It displays the total storm precipitation, mean, minimum, maximum range, correlation and the RMSE for the observed precipitation, WRF-only and WRF/WRF-Hydro modes simulated precipitation. It can be seen in the table that the mean precipitation from WRF/WRF-Hydro is closer to the observed than the WRF-only model for both storms, as well as the maximum is higher than the WRF-only model. The correlation between the observed and simulated precipitation is higher for the WRF/WRF-Hydro(R = 0.89 and 0.85 compared to 0.85 and 0.80 for WRF-only). Most important, the RMSE is lower for the WRF/WRF-Hydro system compared to the WRF-only: 24 mm and 12 mm vs. 30 mm and 16 mm for both storms respectively.

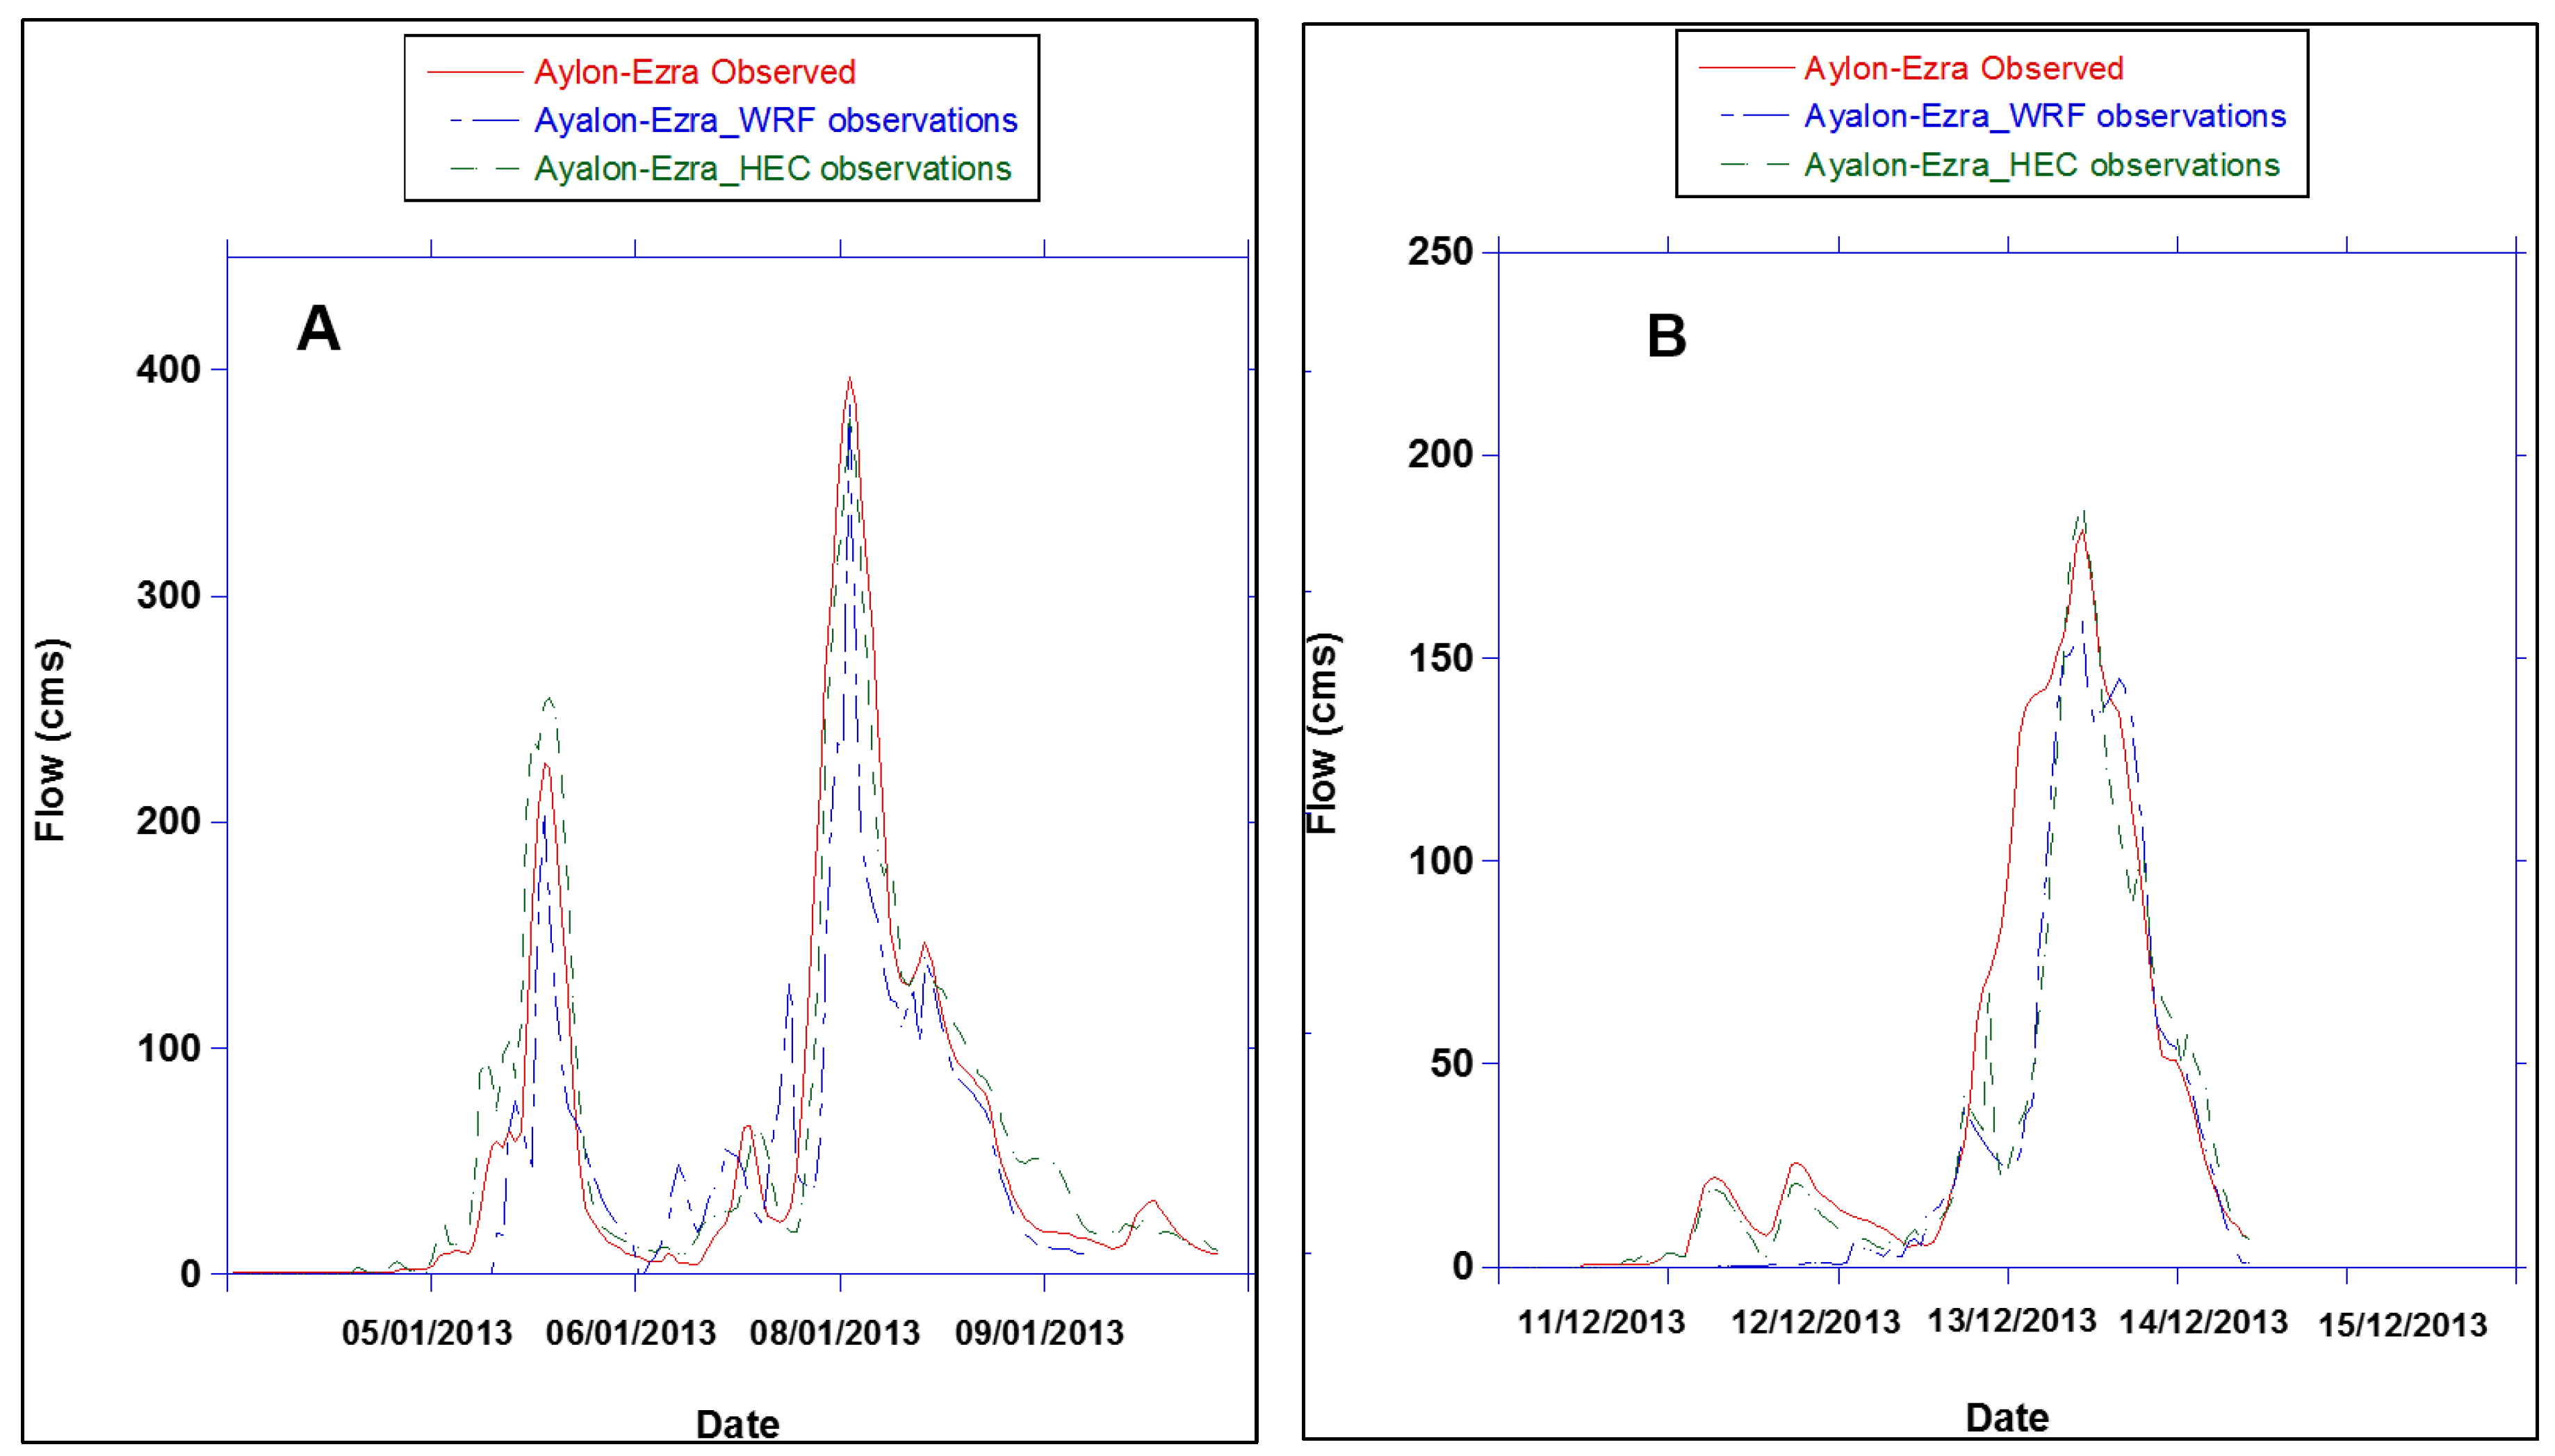
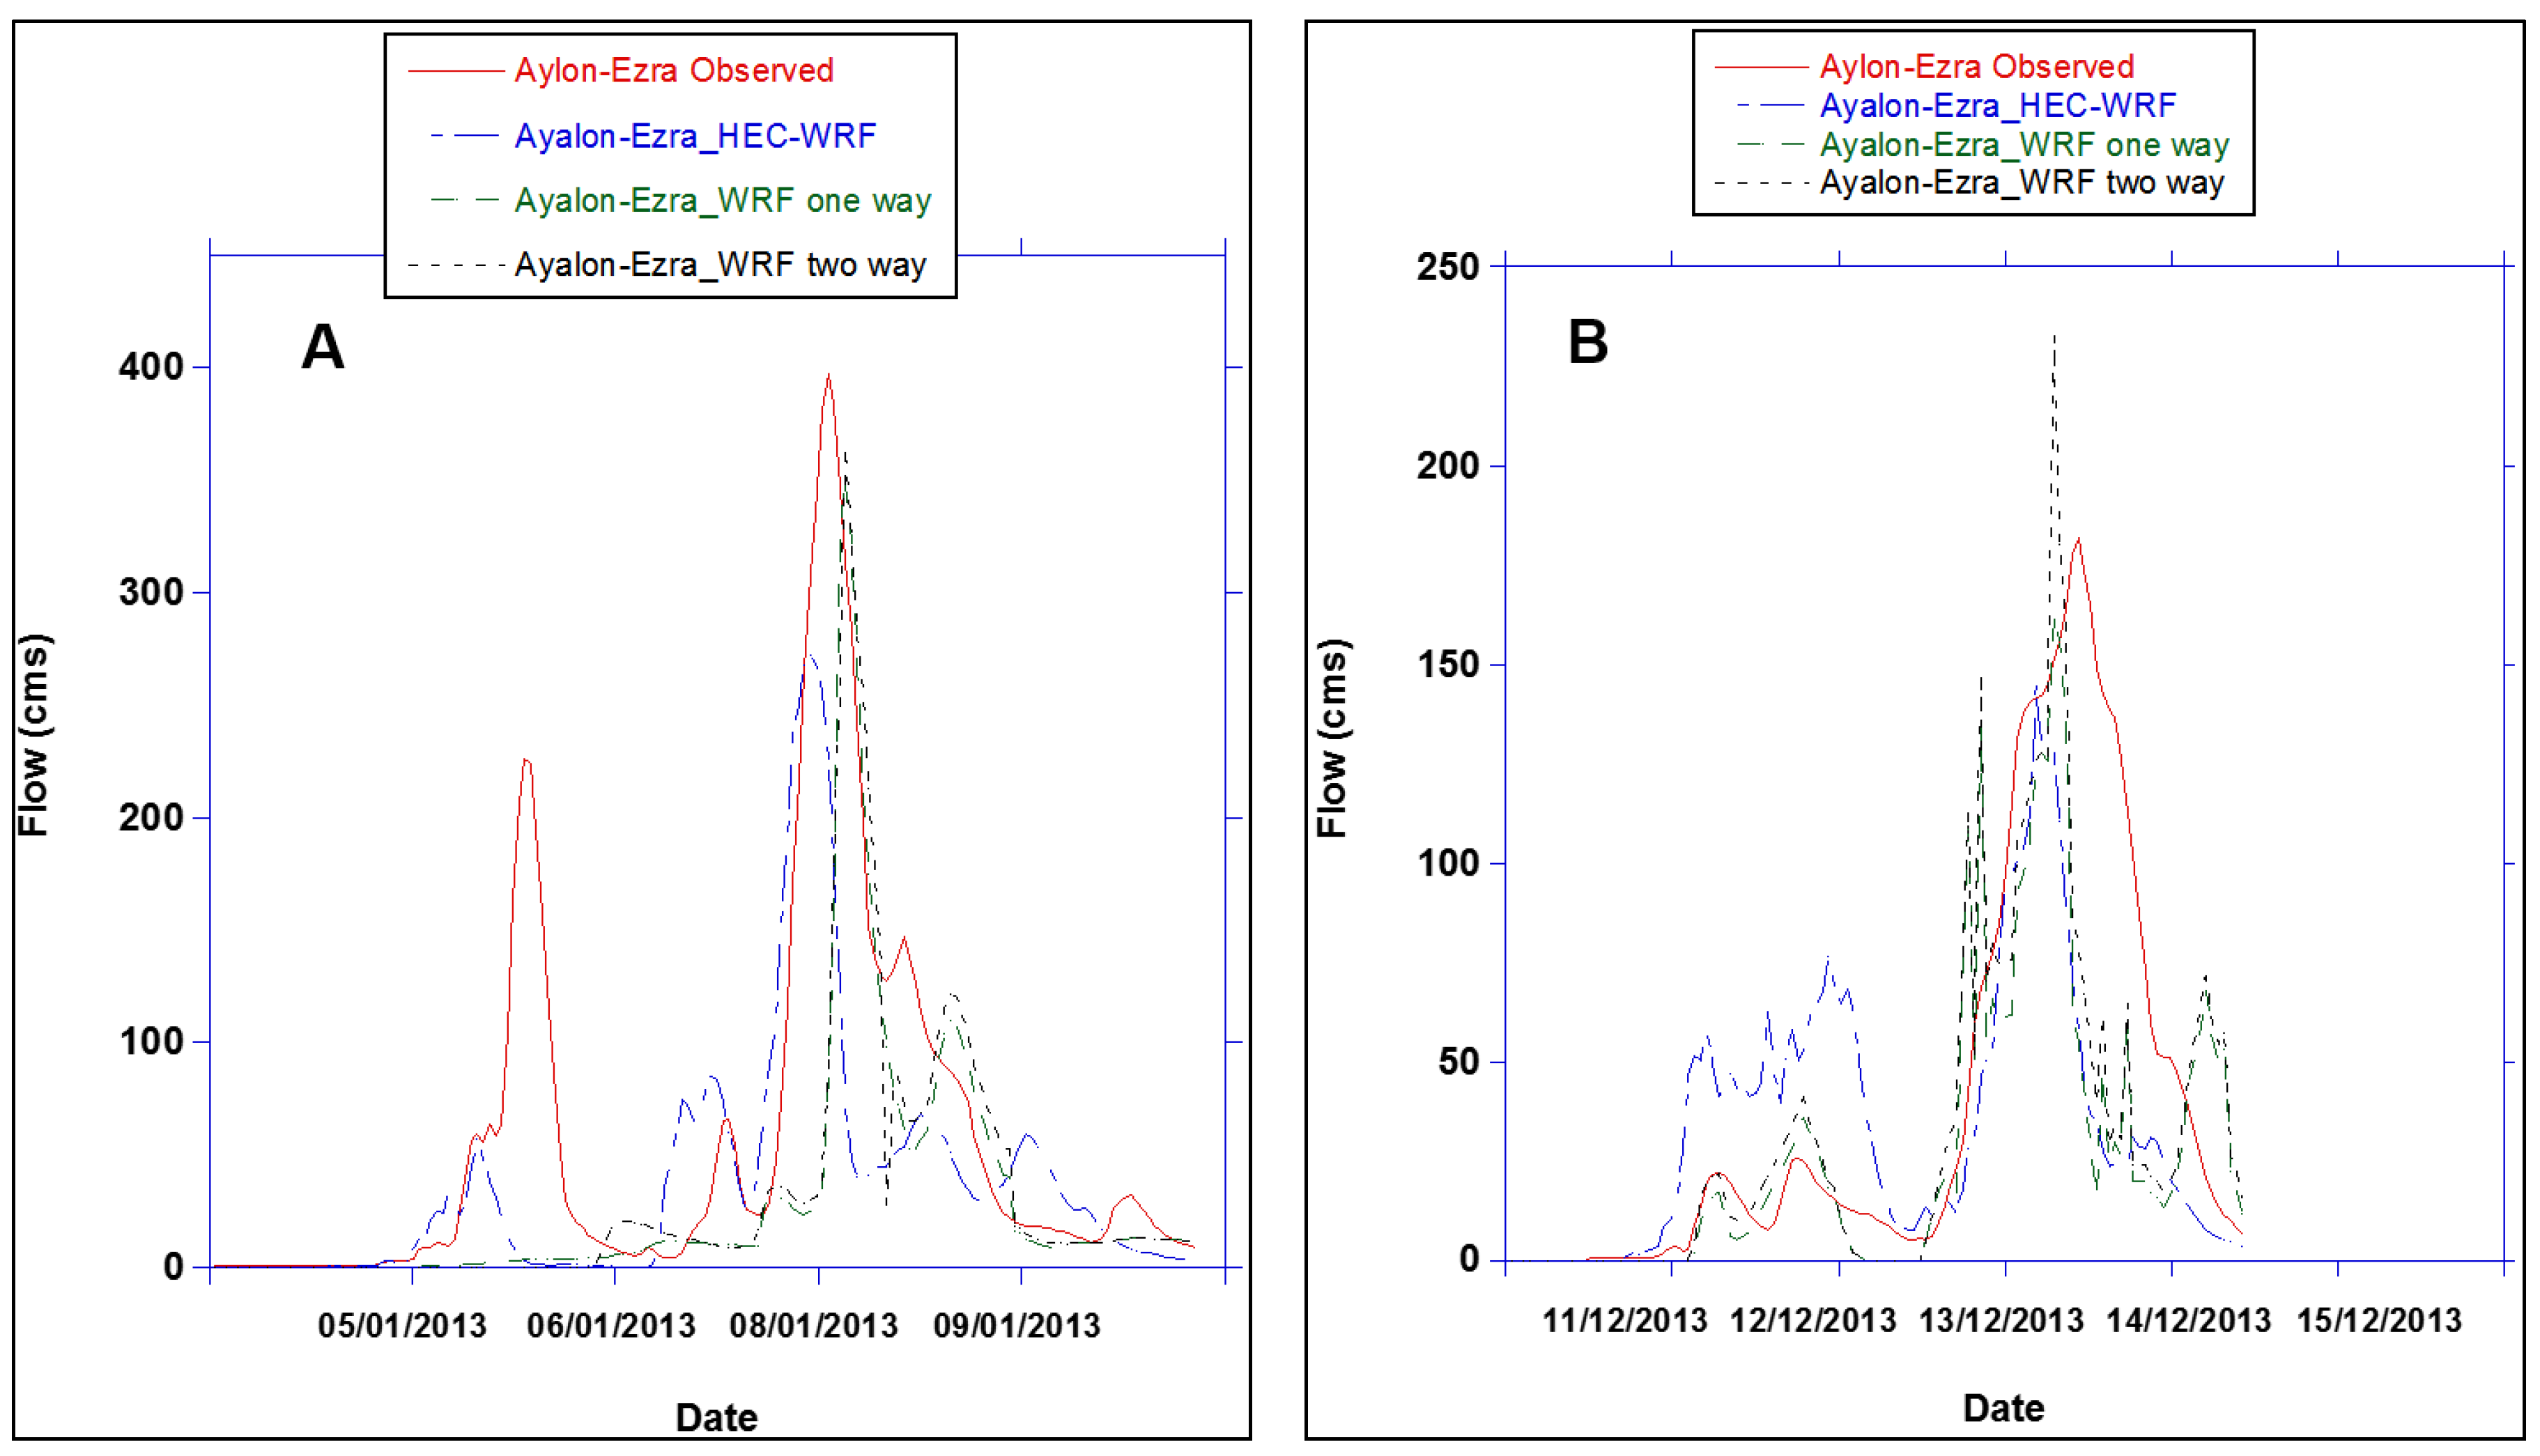
5.2. Observed Versus Simulated Hydrographs Using Precipitation from Different Sources

Figure 8A,B display the observed hydrograph at Ayalon–Ezra hydrometric station (red) and the simulated hydrographs for the HEC-HMS (in green) and WRF-Hydro (blue) models when both of them are derived from the same observed gridded precipitation from the IMS rain gauges for the 4–10 January 2013 (Figure 8A) and 10–14 December 2013 storms (Figure 8B). A very good agreement can be seen between the observed and the simulated hydrographs for both models with respect to both peak discharges as well as hydrograph shapes. However, when feeding the models with WRF-simulated precipitation (WRF 1 and 2 way precipitation) much less agreement is found between the observed and the HEC and WRF-Hydro one-and two-way simulated hydrographs. This weaker correlation is displayed in Figure 9A,B for the January (Figure 9A) and December (Figure 9B) storms.
Table 2 summarizes the results for the observed and simulated hydrographs (hourly values) for the above storm events at the Ayalon-Ezra hydrometric station. The table displays storm peak discharges, total runoff volumes, correlation, RMSE and the NS test for all comparisons: the observed hydrographs; simulated HEC-HMS and WRF-Hydro models derived by observed IMS precipitation; simulated HEC-HMS and WRF-Hydro one way models derived from simulated WRF precipitation; and simulated coupled WRF/WRF-Hydro two way hydrograph. It can be seen that there is almost no difference between the HEC-HMS and WRF-Hydro results when derived by observed precipitation. However, when using simulated precipitation from WRF, the WRF-Hydro two-way system performed better than the WRF-one way and better then HEC-HMS based on WRF precipitation. The NS efficiency coefficient was 0.57–0.61 for the January and December storms, compared to 0.44 and 0.46 for the HEC-HMS and 0.46 and 0.53 for the WRF-Hydro one way. The RMSE was found to be lower for the two way WRF-Hydro at both simulations. The error was reduced by 5% and 15% with respect to the HEC-HMS based on WRF precipitation for, respectively, the January and December storms, and by 9% and 10% with respect to the WRF-Hydro one way for, respectively, the January and December storms. These results show that improvements in modeled precipitation (as was shown in Table 1) can translate into improvements in the timing and magnitude of large runoff events in the Ayalon basin. The WRF-Hydro two way reduced some bias in the precipitation and the hydrological simulation based on it showed better peak discharge performances (for the rare event in January 2013), lower RMSE and higher NS value compared to the simulation based on the HEC–HMS driven by WRF precipitation (one way).

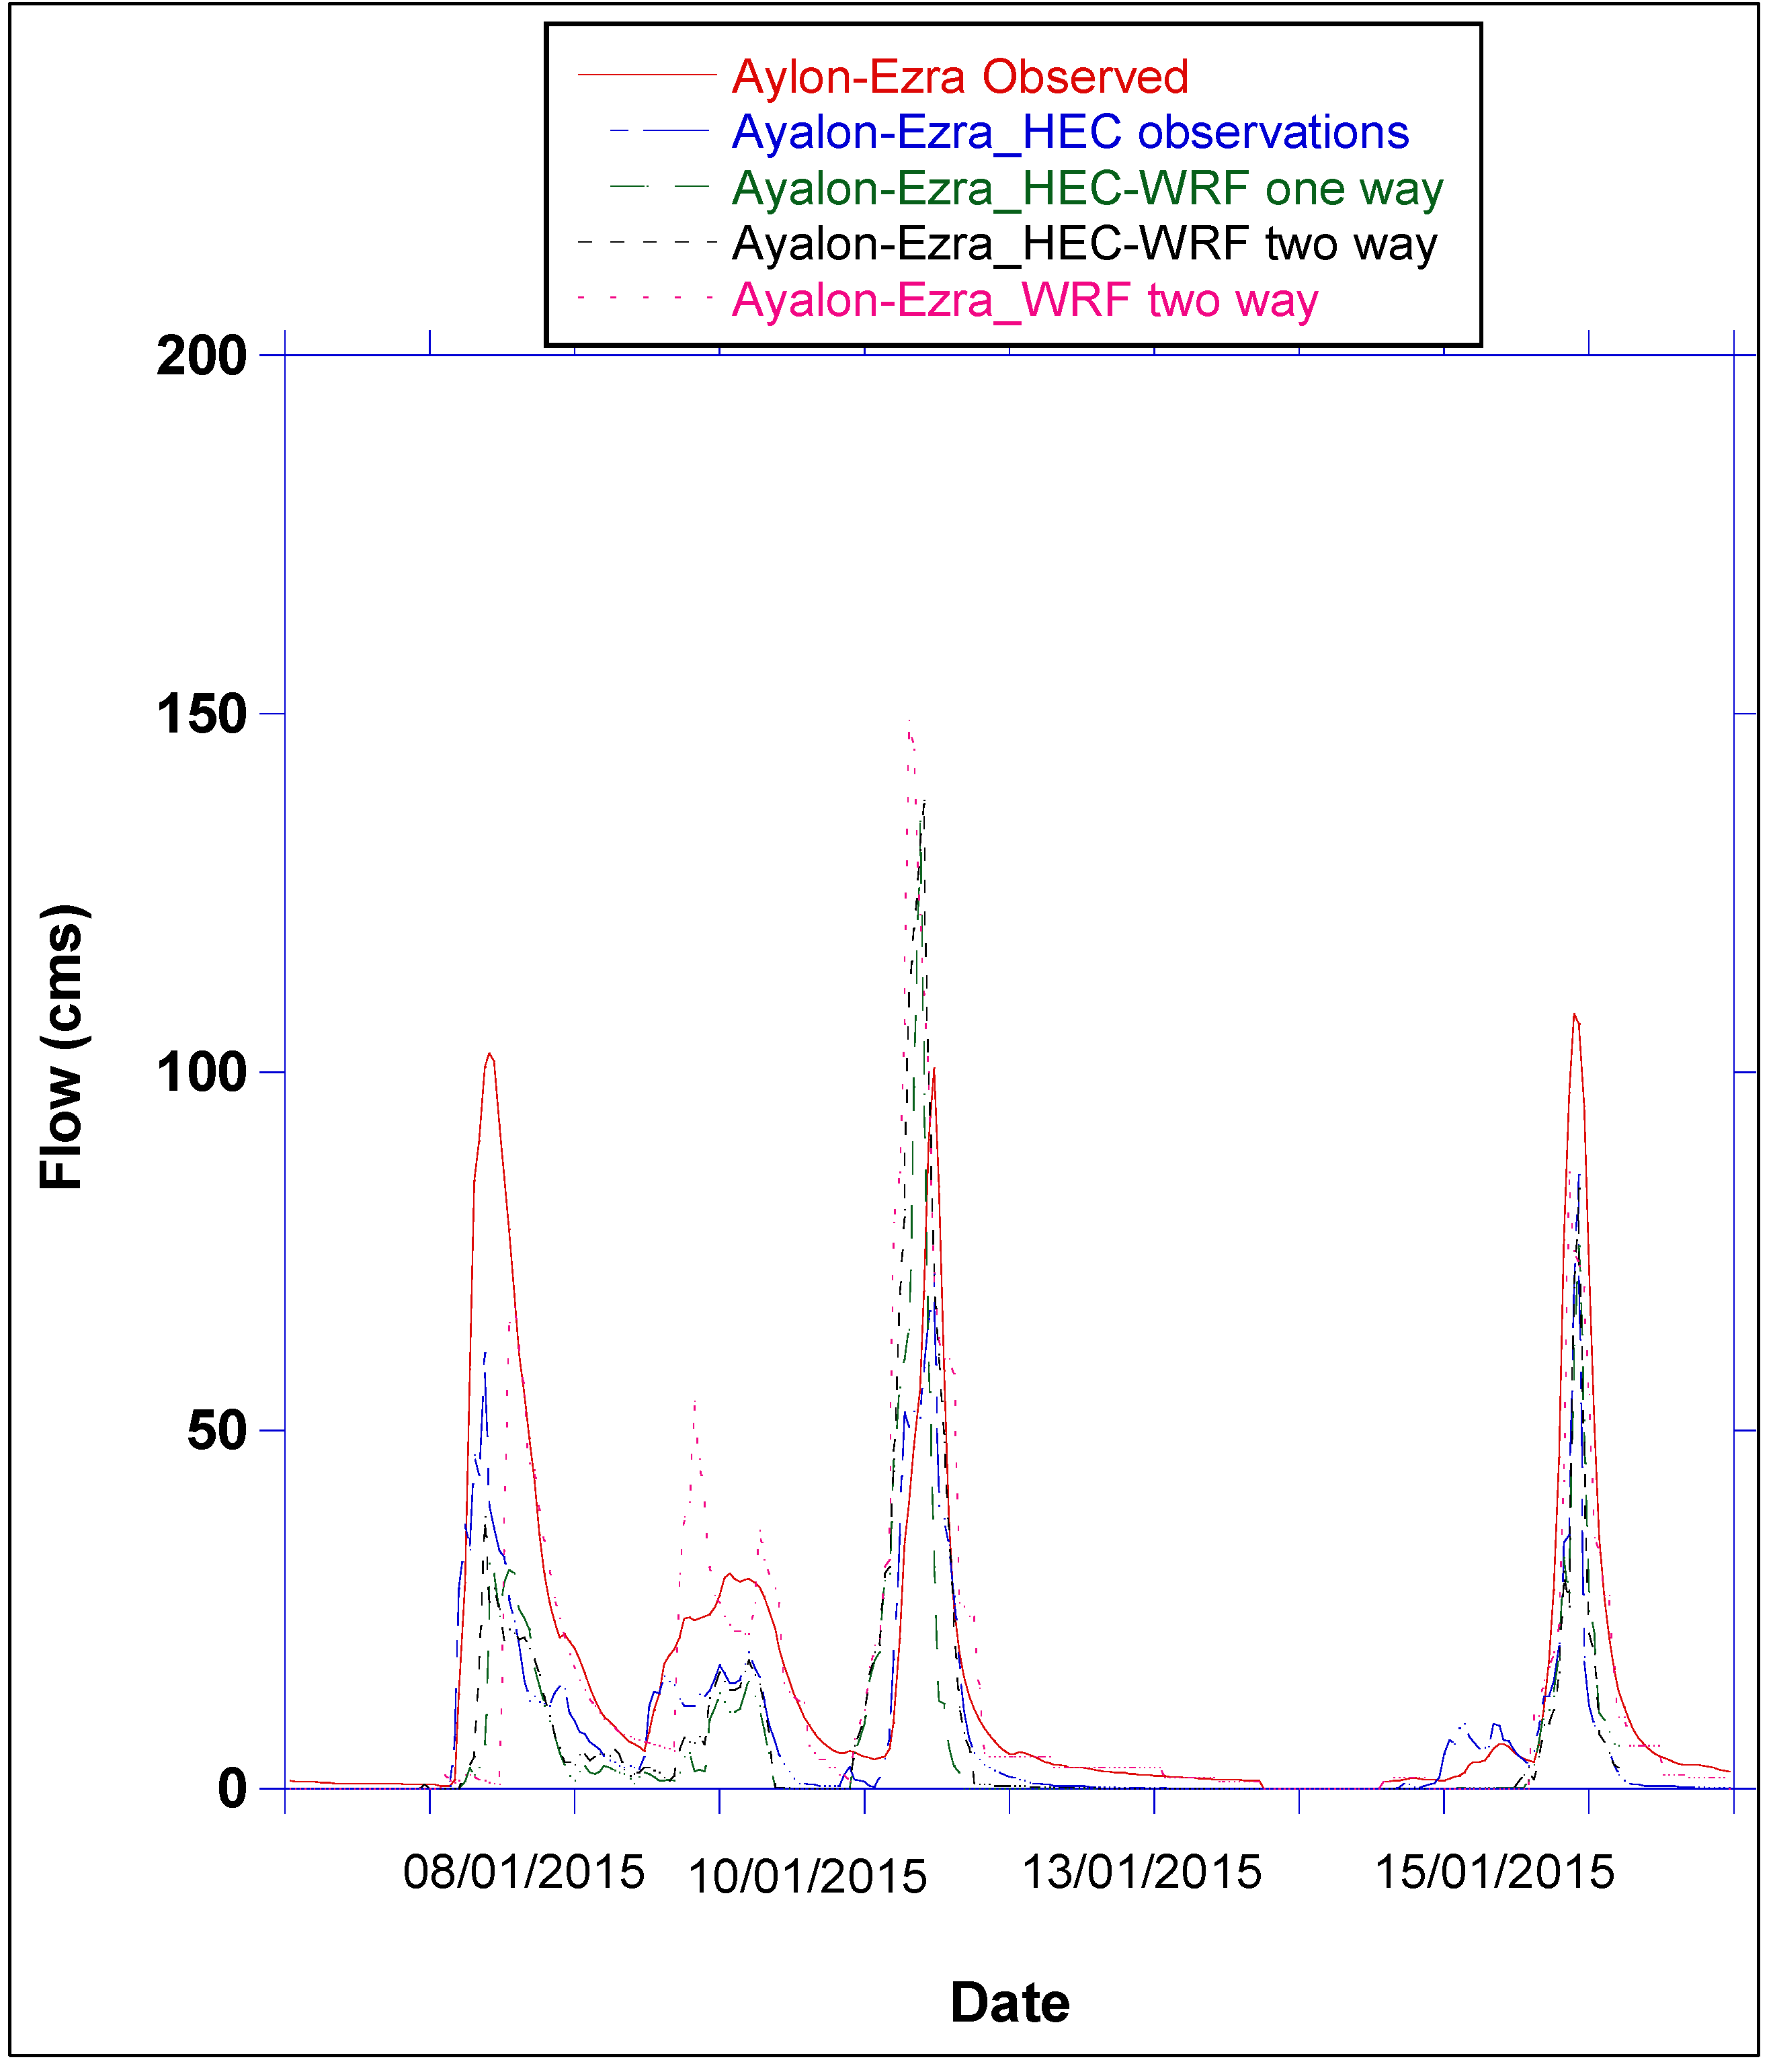
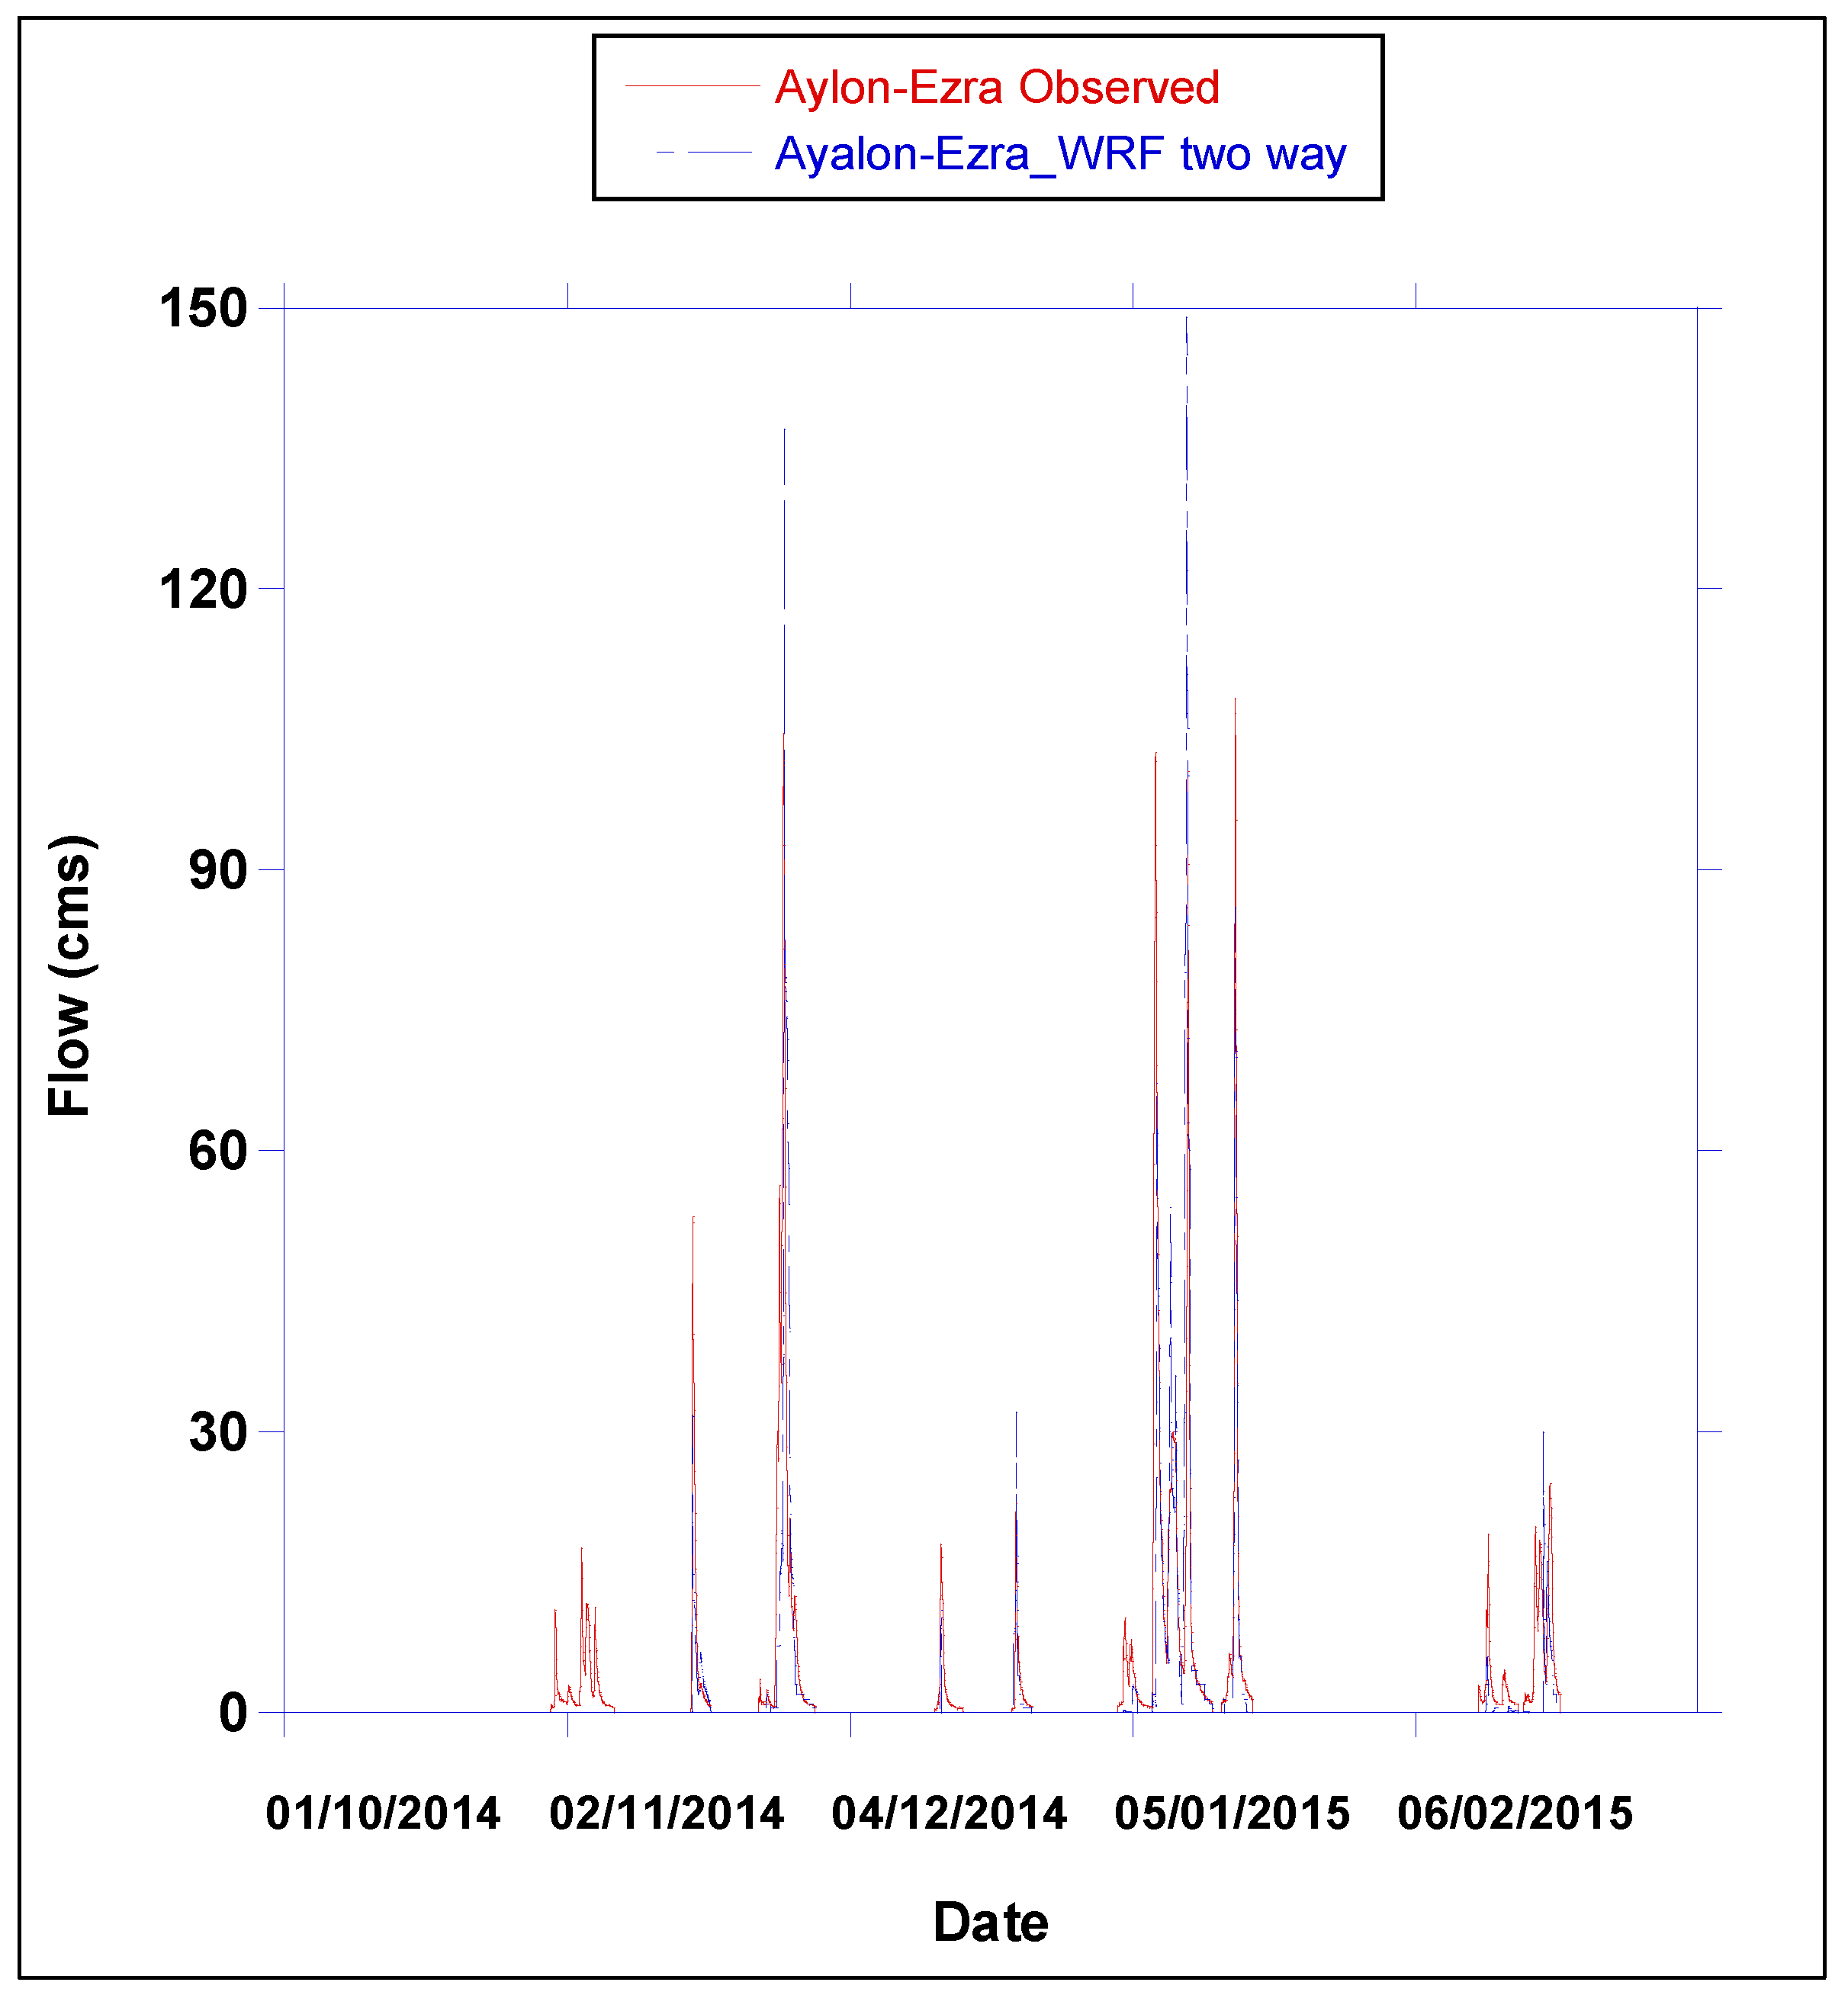
5.3. Season-Long Validation of the Hydrologic Forecasts during the 2014/2015 Rainy Season

Findings from two major storms in 2013 showed the potential of the WRF/WRF-Hydro two way model (WRF 2-way simulated precipitation) to produce reasonable simulations and potentially better simulations and reduced error than the offline, uncoupled mode. Therefore the coupled WRF-Hydro was run for the full 2014–2015 rainy season and compared with the observation for validation. The model was run for the period 1 November 2014–1 March 2015. Analysis ended in early March since the month was dry, with no significant flow events at all in the Ayalon basin. In addition, we compared the WRF-Hydro results to the HEC-HMS model derived with observed precipitation for two weeks in January 2015 that represented the peak of the 2014/15 rainy season and had three significant flow events in the Ayalon basin.
The WRF-Hydro runs used the same calibration parameters which were found during the earlier calibration process and used for the January and December simulations and no further parameters adjustment was done. The model produced hydrographs every 24 h based on daily operational (real-time) GFS forecasts initialized at 00Z, thus producing a hindcast lead time of 24 h. Figure 10 shows the observed hydrograph for Ayalon–Ezra hydrometric station (red) vs. simulated HEC-HMS hydrograph using observed precipitation as an input (blue), HEC-HMS hydrograph using WRF-Hydro one- (green) and two-way (black) simulated precipitation as an input and WRF-Hydro two way hydrograph (pink) for the period 6 January 2015 to 17 January 2015.
It can be seen in the figure that although WRF-Hydro represented well the three flow events, it has significant bias, shown for example in over predicting at the 11 January 2015 flow rate. The model predicted 150 cubic meters per second while HEC-HMS simulated 82 cubic meters per second and 100 cubic meter per second were actually observed. The correlation between the observed to simulated flow was 0.87 for the HEC-HMS and 0.67 for the WRF-Hydro for the total flow period. The NS efficiency coefficient was found to be 0.76 for the HEC-HMS observed precipitation driven, 0.47 when feeding the HEC-HMS in simulated WRF-Hydro two way precipitations, 0.43 for HEC-HMS using simulated WRF-Hydro one-way precipitations and 0.46 for the simulated WRF-Hydro two-way hydrograph. Table 3 summarizes the results of the 06/01/15 to 17/01/15 simulation for the Hec-Hms and WRF-Hydro 2 way.
Figure 11 displays the observed hydrograph at Ayalon-Ezra hydrometric station (red) for the period 1 October 2014–1 March 2015 vs. the operational two-way WRF-Hydro runs for this basin. The correlation between the observed and model was 0.64 and the NS efficiency coefficient was 0.42. The agreement between the observed and model is not high but still the two way simulation was able to capture major flood events that took place this year (in November and January) and to give early alert.

6. Discussion and Conclusions

In this study we simulated precipitation and runoff in order to test the hypothesis that coupled atmospheric-hydrological models can add value for hydrometeorological predictions and for flood forecasting. Unlike previous studies, we simulated winter convective and orographic precipitation that caused flash floods. The simulations showed relatively significant bias when the hydrological models used simulated precipitation as the forcing data with respect to the simulations driven by observed precipitation. When forced by observed precipitation, the HEC-HMS model was found to perform slightly better than the other models for the Ayalon catchment (mostly at the January storm). However, the coupled, two way WRF/WRF-Hydro model performed better compared to other models when used in a framework of flood forecasting with high resolution NWP-modeled precipitation forecasts. Additionally, for the cases studied here, the fully-coupled WRF/WRF-Hydro model showed some improvements for the two meteorological simulations (however, not significant) compared to simulations without routing physics active in the model (feedback between the atmosphere to the land surface) which, in turn, may helped improve subsequent hydrological forecasts from both HEC-HMS and WRF-Hydro. A distributed model like the WRF-Hydro use a finer spatial detail of precipitation, in respect to the lump HEC-HMS model, with a coarser spatial detail. Hassan et al. 2013 [54] compared the performance of two rainfall–runoff models: The semi-distributed conceptual model, the HEC-HMS, and the physically based, distributed-parameter hydrologic model, the Gridded Surface Subsurface Hydrologic Analysis (GSSHA). They concluded that the distributed model benefited from higher resolution DEMs and rainfall products and that it provided distributed outputs of major hydrologic states and fluxes, such as infiltration, and surface runoff, at high spatial and temporal resolutions in respect to the HEC-HMS model. The fully coupled model system allows modeling the complete regional water cycle, from the top of the atmosphere, via the boundary layer, the land surface, the unsaturated zone and the saturated zone till the flow in the river beds. In the fully coupled run, the land model is called on the WRF model physics time step, which is in the order of seconds. The difference in land model execution frequency is important because it impacts how frequently infiltration and other fluxes are calculated. If the land model is called infrequently, then routed waters can travel farther downslope or into a channel before infiltration happens again. When the land model is called frequently, infiltration is calculated more frequently so runoff behaver can be change in respect to one way simulations (Senatore et al. 2015 [41]).
With this increasing complexity, that also allows to describe the complex interaction of the regional water cycle on different spatial and temporal scales. The results presented here are in general agreement with other recent studies at different hydrological regimes as can be view in Table 4. The NS results for the operational WRF-Hydro two way run for the full 2014/15 season (NS = 0.42) are relatively similar to the finding in other basin such as in Italy, Germany and West Africa. Senatore et al. (2015 [41]) found a NS value of 0.80 when using observed precipitation to drive their hydrological simulations at the Crati basin in Italy, and 0.47 when using precipitation from a two-way coupled WRF/WRF-Hydro implementation as forcing. Kunstmann et al. (2015 [56]) applied the WRF-Hydro modeling system in 3 km atmospheric grid resolution for the Ammer catchment in Germany for the period May 2004 till September 2005. They achieved NS of 0.86 using observed meteorological data and 0.49 in fully coupled mode of WRF-Hydro. For the West African Sissilli catchment they reported NS of 0.40 using the fully coupled mode of WRF-Hydro. Table 3 summarizes results for the Nash–Sutcliffe test for WRF-Hydro derived by observed precipitation and WRF-Hydro two way derived by simulated WRF precipitation from the different case studies with different clouds and precipitation types.
We have presented some comparisons of different methodological approaches to simulated floods in a catchment in Israel that can represent climatic and hydrological conditions in the Mediterranean region. Improvements in atmospheric model precipitation simulation can directly translate into improved hydrological forecasts with a finely-resolved, physics-based modeling system, WRF-Hydro, and a more lumped, conceptual hydrologic model, HEC-HMS. Therefore local scale improvements in precipitation forecasts will greatly benefit early warning systems. Lastly, we showed that for the cases studied here, use of a fully-coupled atmospheric-hydrologic modeling system, WRF/WRF-Hydro, resulted in improved precipitation simulation compared to WRF-only simulated precipitation and that this improvement in precipitation simulation has the potential to provide more accurate flood information in a fully-coupled modeling framework as compared to a looser, one-way coupling approach. The bias in atmospheric models simulated precipitation is still high even within a fully-coupled atmospheric-hydrologic modeling system and lead to a significant bias in hydrological prediction. Due to the short response time in basins like the Aylon River, flash flood forecasting using input data like radar may not provide satisfactory lead time to the authorities, thus driving a continued need for improved precipitation forecasting skill. Essentially, improvements in precipitation forecasting lead time and skill should directly translate into improved hydrological forecast lead time.
The improvement produced by fully coupled modeling may be even more evident in continental interior regions, where strong convective phenomena are driven by land surface soil moisture. Givati et al. 2012 [26] analyzed observed and calculated WRF 3 km precipitation at the 2008/2009 rainy season in Israel, including rain gauges at the Ayalon basin. They found that the WRF simulations are much better for winter orographic precipitation then for winter convective precipitation witch emphasize the need for improvement in the simulation results. Two way simulations may be even more relevant to long-range simulations, where soil moisture and land use changes play more critical role in precipitation formation.
The exact mechanisms contributing to the improvement in precipitation forecast skill using the two-way coupled WRF/WRF-Hydro system though are still under investigation and have not been deeply explored here. The improvements of the two-way coupling are not significant and not yet fully evident. Understanding the impact of the enhanced hydrologic representations on short-term meteorological prediction is somewhat more uncertain and as yet under investigation. More research is still needed in order to better understand the physical mechanisms contributing to the atmosphere-land surface feedbacks in different types of precipitation systems, specifically, heavy rainfall generated by larger scale frontal systems, as well as for different storm magnitudes and soil moisture initial conditions. A study for comparison of the evapotranspiration fluxes in the different modeling suites is also needed.

Acknowledgments

The study was partially funded by the German Research Foundation (DFG) within the Trilateral Project IMAP (Integrating Microwave Link Data for Analysis of Precipitation in Complex Terrain: Theoretical Aspects and Hydrometeorological Applications, KU-2090/7-1). Funds are gratefully acknowledged.

Author Contributions

Amir Givati designed the study and produced the results. Both authors analyzed the results and wrote the paper together.

Conflicts of Interest

The authors declare no conflict of interest.

References

  1. Llasat-Botija, M.; Llasat, M.C.; López, L. Natural hazards and the press in the western Mediterranean region. Adv. Geosci. 2007, 12, 81–85. [Google Scholar] [CrossRef]
  2. Milly, P.C.D.; Wetherald, R.T.; Dunne, K.A.; Delworth, T.L. Increasing risk of great floods in a changing climate. Nature 2001, 415, 514–517. [Google Scholar] [CrossRef] [PubMed]
  3. Wagener, T.; Sivapalan, M.; Troch, P.A.; McGlynn, B.L.; Harman, C.J.; Gupta, H.V.; Kumar, P.; Rao, P.S.C.; Basu, N.B.; Wilson, J.S. The future of hydrology: An evolving science for a changing world. Water Resour. Res. 2010. [Google Scholar] [CrossRef]
  4. Kundzewicz, Z.W.; Hirabayashi, Y.; Kanae, S. River floods in the changing climate—Observations and projections. Water Resour. Manag. 2010, 24, 2633–2646. [Google Scholar] [CrossRef]
  5. Trenberth, K.E. Changes in precipitation with climate change. Clim. Res. 2011, 47, 123–138. [Google Scholar] [CrossRef]
  6. Zwiers, F.W.; Alexander, L.V.; Hegerl, G.C.; Knutson, T.R.; Kossin, J.P.; Naveau, P.; Zhang, X. Climate extremes: Challenges in estimating and understanding recent changes in the frequency and intensity of extreme climate and weather events. In Climate Science for Serving Society; Springer: Dordrecht, The Netherlands, 2013; pp. 339–389. [Google Scholar]
  7. Andersen, T.K.; Marshall, S.J. Floods in a Changing Climate. Geogr. Compass 2013, 7, 95–115. [Google Scholar] [CrossRef]
  8. Törnros, T.; Menzel, L. Addressing drought conditions under current and future climates in the Jordan River region. Hydrol. Earth Syst. Sci. 2014, 18, 305–318. [Google Scholar] [CrossRef]
  9. Hoerling, M.; Eischeid, J.; Perlwitz, J.; Xiaowei, Q.; Zhang, T.; Pegion, P. On the Increased Frequency of Mediterranean Drought. J. Clim. 2012, 25, 2146–2161. [Google Scholar] [CrossRef]
  10. Dai, A. Drought under global warming: A review. WIREs Clim. Chang. 2011, 2, 45–65. [Google Scholar] [CrossRef]
  11. Smiatek, G.; Kunstmann, H.; Heckl, A. High resolution climate change simulations for the Jordan River Area. J. Geophys. Res. Atmos. 2011. [Google Scholar] [CrossRef]
  12. Smiatek, G.; Kaspar, S.; Kunstmann, H. Hydrological climate change impact analysis for the Figeh Spring in Damascus area, Syria. J. Hydrometeorol. 2013, 14, I577–I593. [Google Scholar] [CrossRef]
  13. Smiatek, G.; Kunstmann, H.; Heckl, A. High-Resolution Climate Change Impact Analysis on Expected Future Water Availability in the Upper Jordan Catchment and the Middle East. J. Hydrometeorol. 2014. [Google Scholar] [CrossRef]
  14. Yosef, Y.; Saaroni, H.; Alpert, P. Trends in daily rainfall Intensity over Israel 1950/1–2003/4. Open Atmos. Sci. J. 2009, 3, 196–203. [Google Scholar] [CrossRef]
  15. Samuels, R.; Smiatek, G.; Krichak, S.; Kunstmann, H.; Alpert, P. Extreme value indicators in highly resolved climate change simulations for the Jordan River area. J. Geophys. Res. Atmos. 2011. [Google Scholar] [CrossRef]
  16. Bronstert, A.; Niehoff, D.; Bürger, G. Effects of climate and land-use change on storm runoff generation: Present knowledge and modeling capabilities. Hydrol. Process. 2002, 16, 509–529. [Google Scholar] [CrossRef]
  17. Chang, H.; Franczyk, J. Climate Change, Land-Use Change, and Floods: Toward an Integrated Assessment. Geogr. Compass 2008, 2, 1549–1579. [Google Scholar] [CrossRef]
  18. Githui, F.; Mutua, F.; Bauwens, W. Estimating the impacts of land-cover change on runoff using the soil and water assessment tool (SWAT): Case study of Nzoia catchment, Kenya. Hydrol. Sci. J. 2010, 54, 899–908. [Google Scholar] [CrossRef]
  19. Delgado, J.; Llorens, P.; Nord, G.; Calder, I.R.; Gallart, F. Modelling the hydrological response of a Mediterranean medium-sized headwater basin subject to land cover change: The Cardener River basin (NE Spain). J. Hydrol. 2010, 383, 125–134. [Google Scholar] [CrossRef]
  20. Kalantari, Z.; Lyon, S.W.; Folkeson, L.; French, H.K.; Stolte, J.; Jansson, P.E.; Sassner, M. Quantifying the hydrological impact of simulated changes in land use on peak discharge in a small catchment. Sci. Total Environ. 2014, 466, 741–754. [Google Scholar] [CrossRef] [PubMed]
  21. Younis, J.; Anquetin, S.; Thielen, J. The benefit of high-resolution operational weather forecasts for flash flood warning. Hydrol. Earth Syst. Sci. 2008, 12, 1039–1051. [Google Scholar] [CrossRef]
  22. Cloke, H.L.; Pappenberger, F. Ensemble flood forecasting: A review. J. Hydrol. 2009, 375, 613–626. [Google Scholar] [CrossRef]
  23. Shih, D.S.; Chen, C.H.; Yeh, G.T. Improving our understanding of flood forecasting using earlier hydro-meteorological intelligence. J. Hydrol. 2014, 512, 470–481. [Google Scholar] [CrossRef]
  24. Fiori, E.; Comellas, A.; Molini, L.; Rebora, N.; Siccardi, F.; Gochis, D.J.; Tanelli, S.; Parodi, A. Analysis and hindcast simulations of an extreme rainfall event in the Mediterranean area: The Genoa 2011 case. Atmos. Res. 2014, 138, 13–29. [Google Scholar] [CrossRef]
  25. Saaroni, H.; Halfon, N.; Ziv, B.; Alpert, P.; Kutiel, H. Links between the rainfall regime in Israel and location and intensity of Cyprus lows. Int. J. Climatol. 2010, 30, 1014–1025. [Google Scholar] [CrossRef]
  26. Givati, A.; Lynn, B.; Liu, Y.; Rimmer, A. Using the WRF Model in an Operational Streamflow Forecast System for the Jordan River. J. Appl. Meteorol. Clim. 2012, 51, 285–299. [Google Scholar] [CrossRef]
  27. Givati, A.; Sapir, G. Simulating 1% Probability Hydrograph at the Ayalon Basin Using the HEC-HMS; Special Hydrological Report; Israel Hydrological Service: Jerusalem, Israel, 2014. [Google Scholar]
  28. Rahimi, M.; Saghafian, B.; Azadi, M.; Sedghi, H. Flood forecasting in arid and semi-arid region using continuous hydrological modeling. World Appl. Sci. J. 2010, 10, 645–654. [Google Scholar]
  29. Yucel, I.; Keskin, F. Assessment of flash flood events using remote sensing and atmospheric model-derived precipitation in a hydrological model. Int. Assoc. Hydrol. Sci. 2011, 344, 245–251. [Google Scholar]
  30. Ratnayake, U.; Sachindra, D.A.; Nandalal, K.D.W. Rainfall forecasting for flood prediction in the Nilwala basin. In Proceedings of the International Conference on Sustainable Built Environment (ICSBE-2010), Kandy, Sri Lanka, 13–14 December 2010.
  31. Chen, F.; Dudhia, J. Coupling an advanced land surface-hydrology model with the Penn State-NCAR MM5 modeling system. Part I: Model implementation and sensitivity. Mon. Weather Rev. 2001, 129, 569–585. [Google Scholar] [CrossRef]
  32. Jasper, K.; Gurtz, J.; Lang, H. Advanced flood forecasting in Alpine watersheds by coupling meteorological observations and forecasts with a distributed hydrological model. J. Hydrol. 2002, 267, 40–52. [Google Scholar] [CrossRef]
  33. Seuffert, G.; Gross, P.; Simmer, C.; Wood, E.F. The influence of hydrologic modelling on the predicted local weather: Two-way coupling of a mesoscale land surface model and a land surface hydrologic model. J. Hydrometeorol. 2002, 3, 505–523. [Google Scholar] [CrossRef]
  34. Yanhong, G.; Guodong, C.; Wenrui, C.; Fei, C.; Gochis, D.; Wei, Y. Coupling of Enhanced Land Surface Hydrology with Atmospheric Mesoscale Model and Its Implement in Heihe River Basin. Adv. Earth Sci. 2006, 21, 1283–1292. [Google Scholar]
  35. Bouilloud, L.; Chancibault, K.; Vincendon, B.; Ducrocq, V.; Habets, F.; Saulnier, G.M.; Noilhan, J. Coupling the ISBA Land Surface Model and the TOPMODEL Hydrological Model for Mediterranean Flash-Flood Forecasting: Description, Calibration, and Validation. J. Hydrometeorol. 2010, 11, 315–333. [Google Scholar] [CrossRef]
  36. Wang, L.; Koike, T.; Wang, M.; Liu, J.; Sun, J.; Lu, H.; Xu, X. Use of Integrated Observations to Improve 0–36 h Flood Forecasting: Development and Application of a Coupled Atmosphere-Hydrology System in the Nanpan River Basin, China. J. Meteorol. Soc. Jpn. 2012, 90, 131–144. [Google Scholar] [CrossRef]
  37. Marty, R.; Zin, I.; Obled, C. Sensitivity of hydrological ensemble forecasts to different sources and temporal resolutions of probabilistic quantitative precipitation forecasts: Flash flood case studies in the Cévennes-Vivarais region (Southern France). Hydrol. Process. 2013, 27, 33–44. [Google Scholar] [CrossRef]
  38. Zabel, F.; Mauser, W. 2-way coupling the hydrological land surface model PROMET with the regional climate model MM5. Hydrol. Earth Syst. Sci. 2013, 17, 1705–1714. [Google Scholar] [CrossRef]
  39. Moreno, H.A.; Vivoni, E.R.; Gochis, D.J. Limits to flood forecasting in the Colorado Front Range for two summer convection periods using radar nowcasting and a distributed hydrologic model. J. Hydrometeorol. 2013, 14, 1075–1097. [Google Scholar] [CrossRef]
  40. Wagner, S.; Fersch, B.; Yuan, F.; Yu, Z.; Kunstmann, H. Fully-Coupled Atmospheric-Hydrological Modeling at Regional and Long-term Scales: Development, Application and Analysis of WRF-HMS. Water Recour. Res. 2016. [Google Scholar] [CrossRef]
  41. Senatore, A.; Mendicino, G.; Gochis, D.J.; Yu, W.; Yates, D.N.; Kunstmann, H. Fully coupled atmosphere-hydrology simulations for the central Mediterranean: Impact of enhanced hydrological parameterization for short and long time scales. J. Adv. Model. Earth Syst. 2015. [Google Scholar] [CrossRef]
  42. Alpert, P.; Neeman, B.U.; Shay-El, Y. Climatological analysis of Mediterranean cyclones using ECMWF data. Tellus 1990, 42, 65–77. [Google Scholar] [CrossRef]
  43. Goldreich, Y. The Climate of Israel, Observations, Research and Applications; Kluwer Academic/Plenum Publishers: New York, NY, USA, 2003; p. 298. [Google Scholar]
  44. Ohana-Levi, N.; Karnieli, A.M.; Egozi, R.; Givati, A.; Peeters, A. Modeling the effects of land-cover change on rainfall-runoff relationships in a semi-arid, Eastern Mediterranean watershed. Adv. Meteorol. 2015. [Google Scholar] [CrossRef]
  45. Hong, S.Y.; Lim, J.O. The WRF Single-Moment 6-ClassMicrophysics Scheme (WSM6). J. Korean Meteorol. Soc. 2006, 42, 129–151. [Google Scholar]
  46. Hong, S.Y.; Lim, J.O.; Lee, Y.H.; Ha, J.C.; Kim, H.W.; Ham, S.-J.; Dudhia, J. Evaluation of the WRF Double-Moment 6-Class Microphysics Scheme for Precipitating Convection. Adv. Meteorol. 2010. [Google Scholar] [CrossRef]
  47. Gochis, D.J.; Yu, W.; Yates, D.N. The WRF-Hydro Model Technical Description and User’s Guide, Version 1.0; NCAR Technical Document; National Center for Atmospheric Research: Boulder, CO, USA, 2013; p. 120. Available online: http://www.ral.ucar.edu/projects/wrf_hydro/ (accessed on 28 April 2016).
  48. Gochis, D.J.; Chen, F. Hydrological Enhancements to the Community North Land Surface Model; NCAR/TN-454+STR, NCAR Technical Note, Research Applications Program; National Center for Atmospheric Research: Boulder, CO, USA, 2003. [Google Scholar]
  49. Ek, M.; Mitchell, K.E.; Lin, Y.; Rogers, E.; Grunmann, P.; Koren, V.; Gayno, G.; Tarpley, J.D. Implementation of Noah land-surface model advances in the NCEP operational mesoscale Eta model. J. Geophys. Res. 2003. [Google Scholar] [CrossRef]
  50. Operational Deployment of a Physics-Based Distributed Rainfall-Runoff Model for Flood Forecasting in Taiwan. Available online: http://www.vieuxinc.com/Docs/floodwarning_taiwanpreprint.pdf (accessed on 3 May 2016).
  51. U.S. Army Corps of Engineers (USACE). HEC-HMS Hydrologic Modeling System User’s Manual; Hydrologic Engineering Center: Davis, CA, USA, 2008. [Google Scholar]
  52. Lu, Y.G.; Wong, W.D. An adaptive inverse-distance weighting spatial interpolation technique. Comput. Geosci. 2008, 34, 1044–1055. [Google Scholar] [CrossRef]
  53. Schaake, J.C.; Koren, V.I.; Duan, Q.; Mitchell, K.; Chen, F. Simple water balance model for estimating runoff at different spatial and temporal scales. J. Geophys. Res. 1996. [Google Scholar] [CrossRef]
  54. Yucel, I.; Onena, A.; Yilmazb, K.K.; Gochisc, D.J. Calibration and evaluation of a flood forecasting system: Utility of numerical weather prediction model, data assimilation and satellite-based rainfall. J. Hydrol. 2015, 523, 49–66. [Google Scholar] [CrossRef]
  55. Nielsen-Gammon, J.W.; Zhang, F.; Odins, A.; Myoung, B. Extreme rainfall events in Texas: Patterns and predictability. Phys. Geogr. 2005, 26, 340–364. [Google Scholar] [CrossRef]
  56. Kunstmann, H.; Fersch, B.; Rummler, T.; Wagner, S.; Arnault, J.; Senatore, A.; Gochis, D. Towards Fully Coupled Atmosphere-Hydrology Model Systems: Recent Developments and Performance Evaluation for Different Climate Regions. Geophys. Res. Abstr. 2015. [Google Scholar] [CrossRef]
Figure 1. Map of the three nested Grids of Weather Research and Forecasting (WRF) simulations at the east Mediterranean (D1 = 27 km, D2 = 9 km, D3 = 3 km).
Hydrology 03 00019 g001
Figure 2. The WRF-Hydro domain and topography (A) and main watershed in the domain (B).
Hydrology 03 00019 g002
Figure 3. The location of the Yarqon-Ayalon basin in central Israel (A) and the rain gauges (im green circles) and hydrometric stations in (red triangle) the basin (B).
Hydrology 03 00019 g003
Figure 4. WRF-Hydro different REFKDT (runoff/infiltration rate) and REFDK values (saturation hydraulic conductivity) at the Ayalon basin.
Hydrology 03 00019 g004
Figure 5. Observed (in purple) and simulated WRF-Hydro hydrographs at the Ayalon–Ezra station hydrometric stations at the January 2013 major storm (04-10/01/2013) using various REFKDT values.
Hydrology 03 00019 g005
Figure 6. Accumulated observed precipitation (mm) at the Ayalon basin for the January storm (A); WRF one way (B) and WRF two way (C) simulated precipitation (the black dot in the figure is the Ayalon-Ezra hydrometric station at the outlet of the basin).
Hydrology 03 00019 g006
Figure 7. Figure 6A–C: Accumulated observed precipitation at the Ayalon basin for the December storm (A); WRF one way (B) and WRF two way (C) simulated precipitation (the black dot in the figure is the Ayalon-Ezra hydrometric station at the outlet of the basin).
Hydrology 03 00019 g007
Figure 8. Observed hydrograph at Ayalon–Ezra hydrometric station (red) and simulate hydrographs using the Hydrological Engineering Center-Hydrological Modeling System (HEC-HMS) (in green) and WRF-Hydro models using observed precipitation as an input for the January (A) and December (B) storms. The threshold for flood in this station is 200 cubic meter per second.
Hydrology 03 00019 g008
Figure 9. Observed hydrograph at Ayalon–Ezra hydrometric station (red) and simulate hydrographs when the HEC-HMS (black) and WRF-Hydro one way (blue) models are driven by WRF simulated precipitation and the green hydrograph represent the WRF two way simulation for the January (A) and December (B) storms.
Hydrology 03 00019 g009
Figure 10. Observed hydrograph for Ayalon–Ezra hydrometric station (red) vs. simulate HEC-HMS hydrograph using observed precipitation as an input (blue), HEC-HMS hydrograph using WRF-Hydro one (green) and two way (black) simulated precipitation as an input and WRF-Hydro two way hydrograph (pink) for the period 6 January 2015 to 17 January 2015.
Hydrology 03 00019 g010
Figure 11. Observed flow at Ayalon–Ezra hydrometric station (red) vs. two way WRF-Hydro simulated for the full 2014/15 rainy season (October 2014–March 2015).
Hydrology 03 00019 g011
Table 1. Total storm precipitation, mean, min., max., range, correlation and the RMSE for the observed precipitation, one way and two way simulated precipitation.
Precipitation TypeMean (mm)Min. (mm)Max. (mm)Range (mm)STD (mm)Correlation (R)RMSE
Observed January 2013216.0153.0263.9110.914.7
One way January 2013183.1146.9228.481.517.70.8516.0
Two way January 2013185.7134.9249.4114.430.80.8912.2
Observed December 2013209.4175.6248.172.513.6
One way December 2013170.2134.9202.167.215.30.8030.0
Two way December 2013174.8144.6218.273.613.40.8524.0
Table 2. Peak discharges, total Storm runoff volumes, correlation, the Nash–Sutcliffe test and RMSE for observed hydrographs at the January and December floods at Ayalon-Ezra hydrometric statin vs. the following simulations for those events: HEC-HMS derived by observed precipitation, WRF-Hydro derived by observed precipitation, HEC-HMS derived by simulated WRF precipitation, WRF-Hydro one way derived by simulated WRF precipitation and WRF-Hydro two way derived by simulated WRF precipitation.
Runoff TypePeak Discharge (cms)Storm Runoff Volume (mcm)Correlation (R)Nash–SutcliffeRMSE
January 2013
observed Hydrograph397.032.2
WRF-Hydro based on observed precipitation385.726.00.920.7938.9
HEC_HMS based on observed precipitation378.434.20.970.9321.0
HEC_HMS based on WRF precipitation272.120.20.680.4449.6
WRF—one way283.016.70.760.4652.2
WRF—two way366.518.50.800.5747.4
December 2013
observed Hydrograph181.813.4
WRF-Hydro based on observed precipitation159.210.30.890.8125.0
HEC_HMS based on observed precipitation188.611.30.900.8324.2
HEC_HMS based on WRF precipitation144.710.30.620.4641.6
WRF—one way162.79.30.710.5338.9
WRF—two way232.711.30.750.6135.6
Table 3. Results for the Nash–Sutcliffe test and correlation for observed hydrograph for Ayalon–Ezra hydrometric station vs. simulate HEC-HMS hydrograph using observed precipitation as an input, HEC-HMS hydrograph using WRF-Hydro one and two way simulated precipitation as an input and WRF-Hydro two way hydrograph for the period 6 January 2015 to 17 January 2015.
Runoff TypeCorrelation (R)Nash–Sutcliffe
HEC_HMS based on observed precipitation0.870.76
HEC_HMS based on WRF one way precipitation0.630.43
HEC_HMS based on WRF two way precipitation0.680.47
WRF-Hydro two way precipitation0.670.46
Table 4. Results for the Nash–Sutcliffe test for WRF-Hydro derived by observed precipitation and WRF-Hydro two way derived by simulated WRF precipitation.
Basin/CountryCloud TypesNS—Derived with Observed PrecipitationNS—Derived with Two-Way Coupled WRF/WRF-Hydro Precipitation
Ayalon, IsraelWinter: convective + orographic0.760.42
Crati, Italy Senatore et al. (2015) [41]Summer: convective0.800.47
Ammer, Germany Kunstmann et al. (2015) [56]Summer: convective0.860.49
Sissilli, West African Kunstmann et al. (2015) [56]Summer: convective 0.49

