Open-Source Software Application for Hydrogeological Delineation of Potential Groundwater Recharge Zones in the Singida Semi-Arid, Fractured Aquifer, Central Tanzania


Abstract
:1. Introduction
2. Materials and Methods
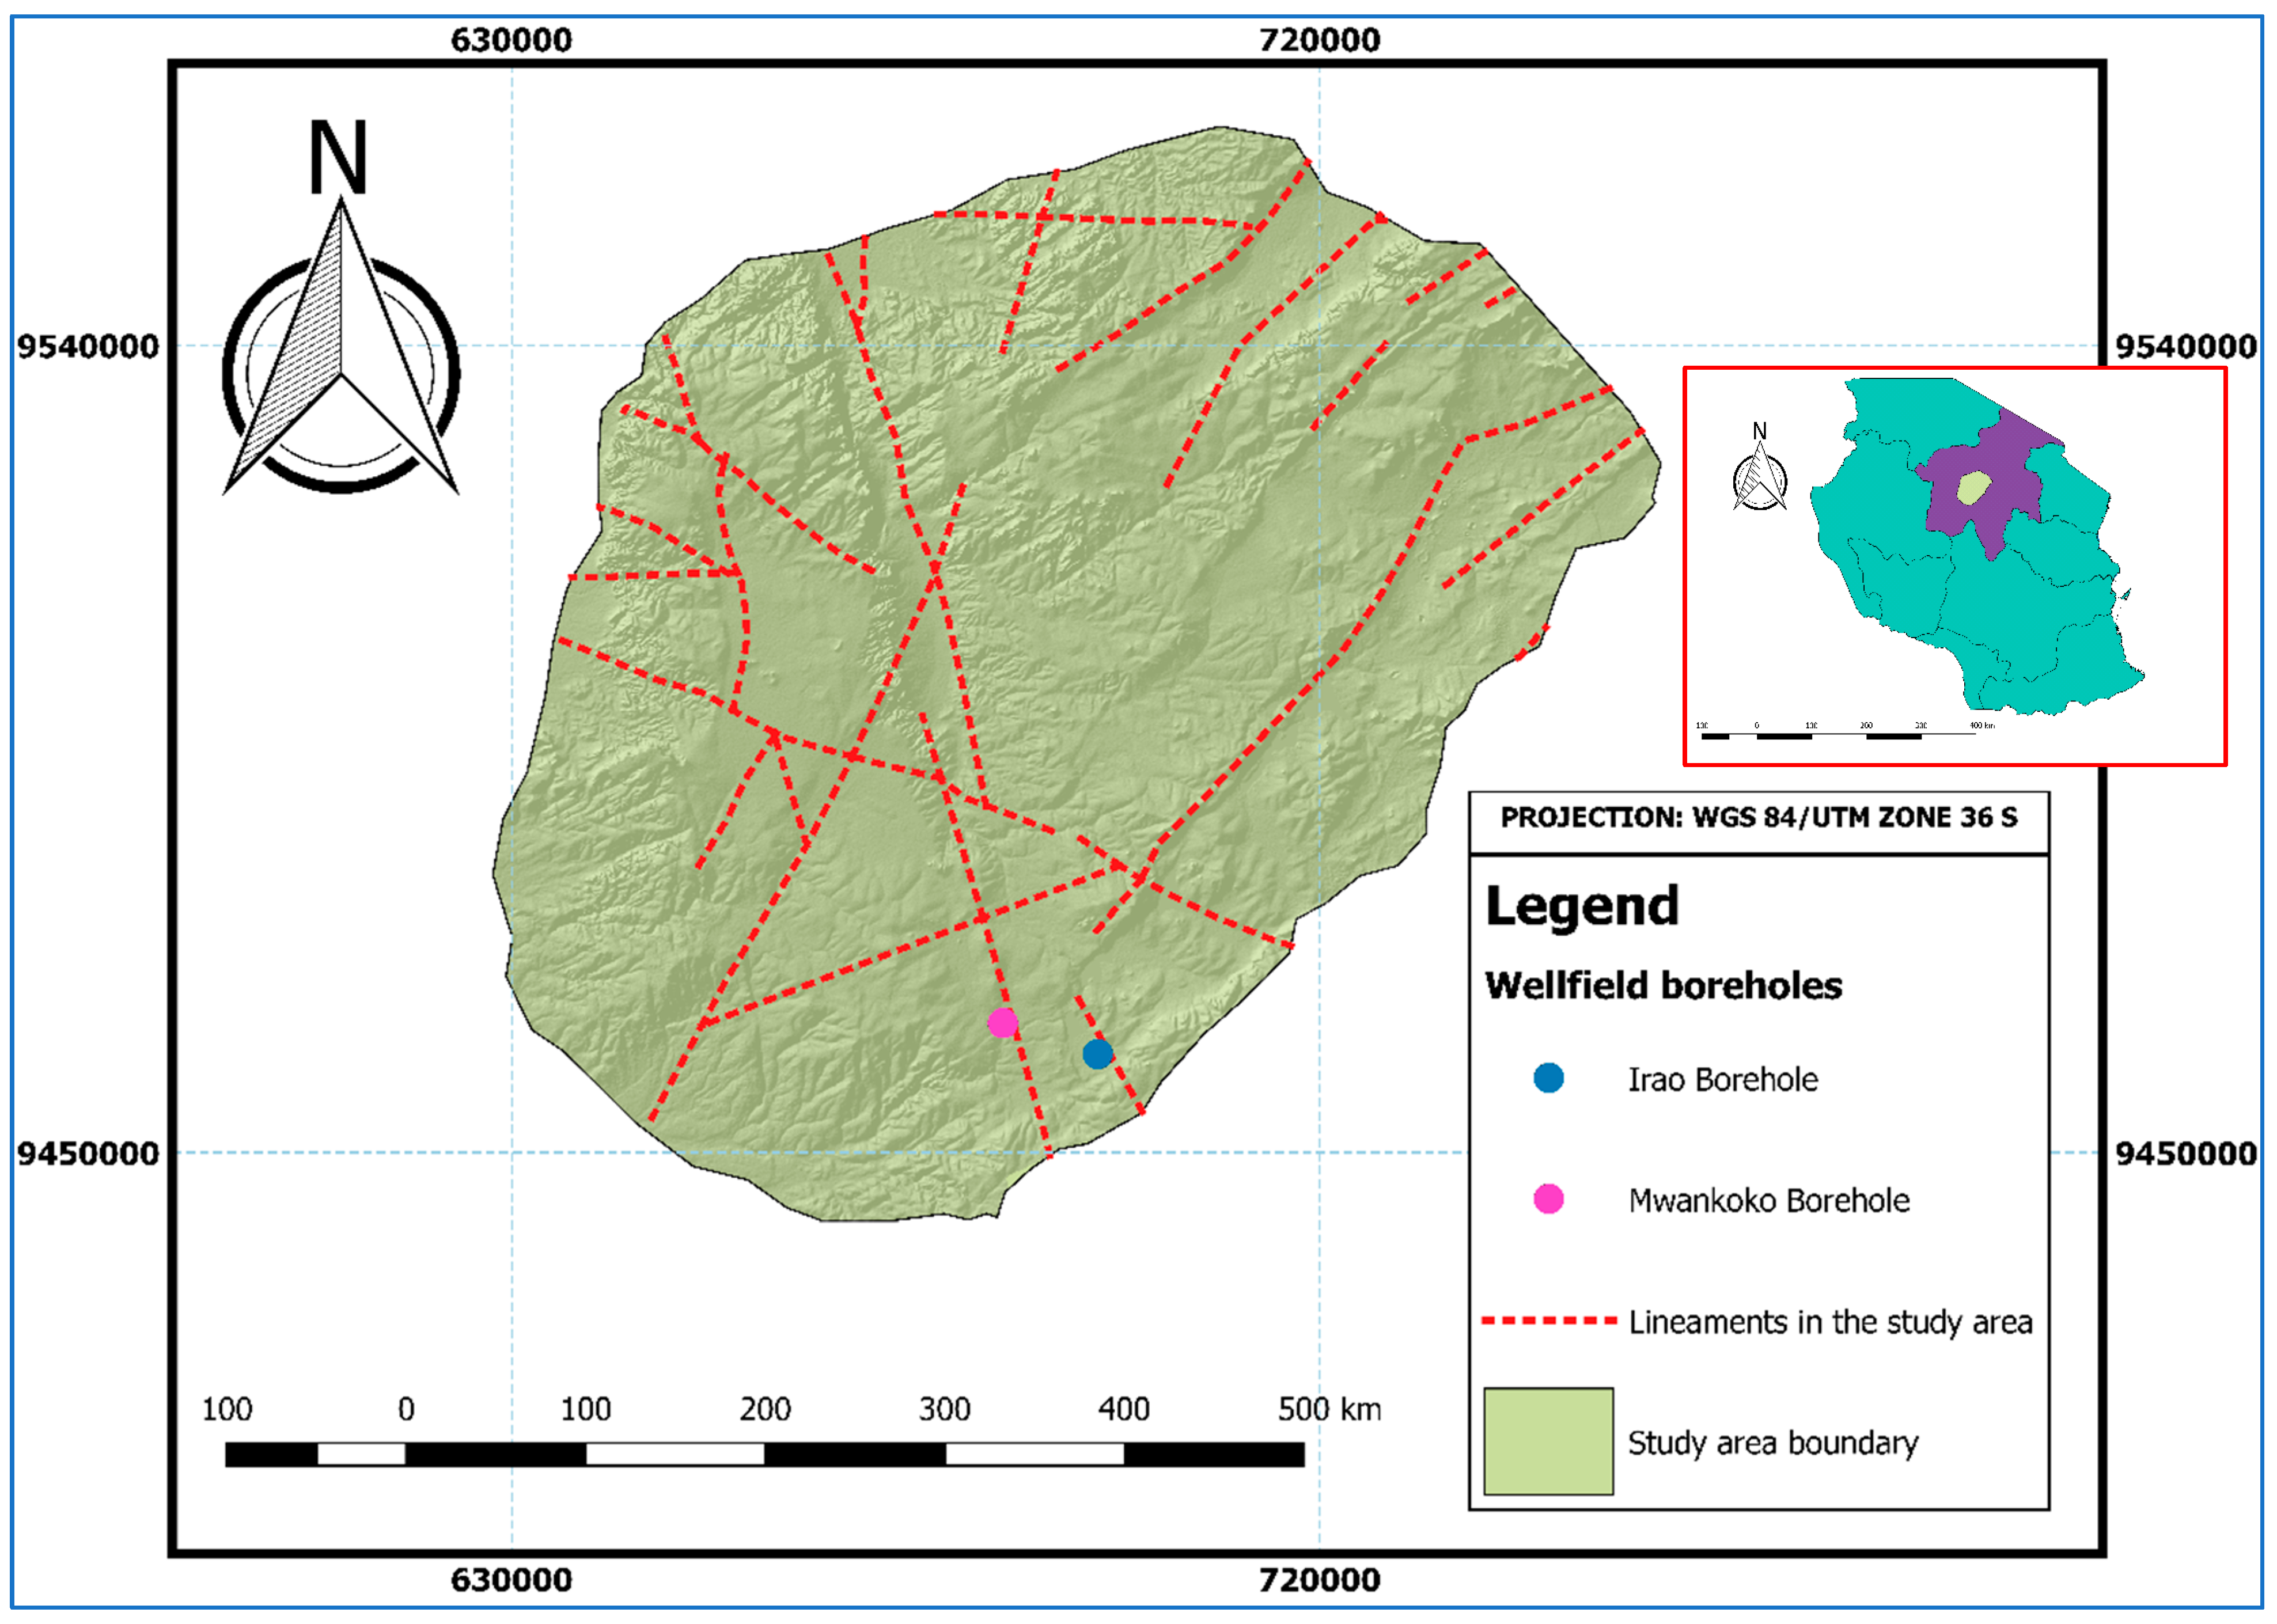
2.1. Description of the Study Area
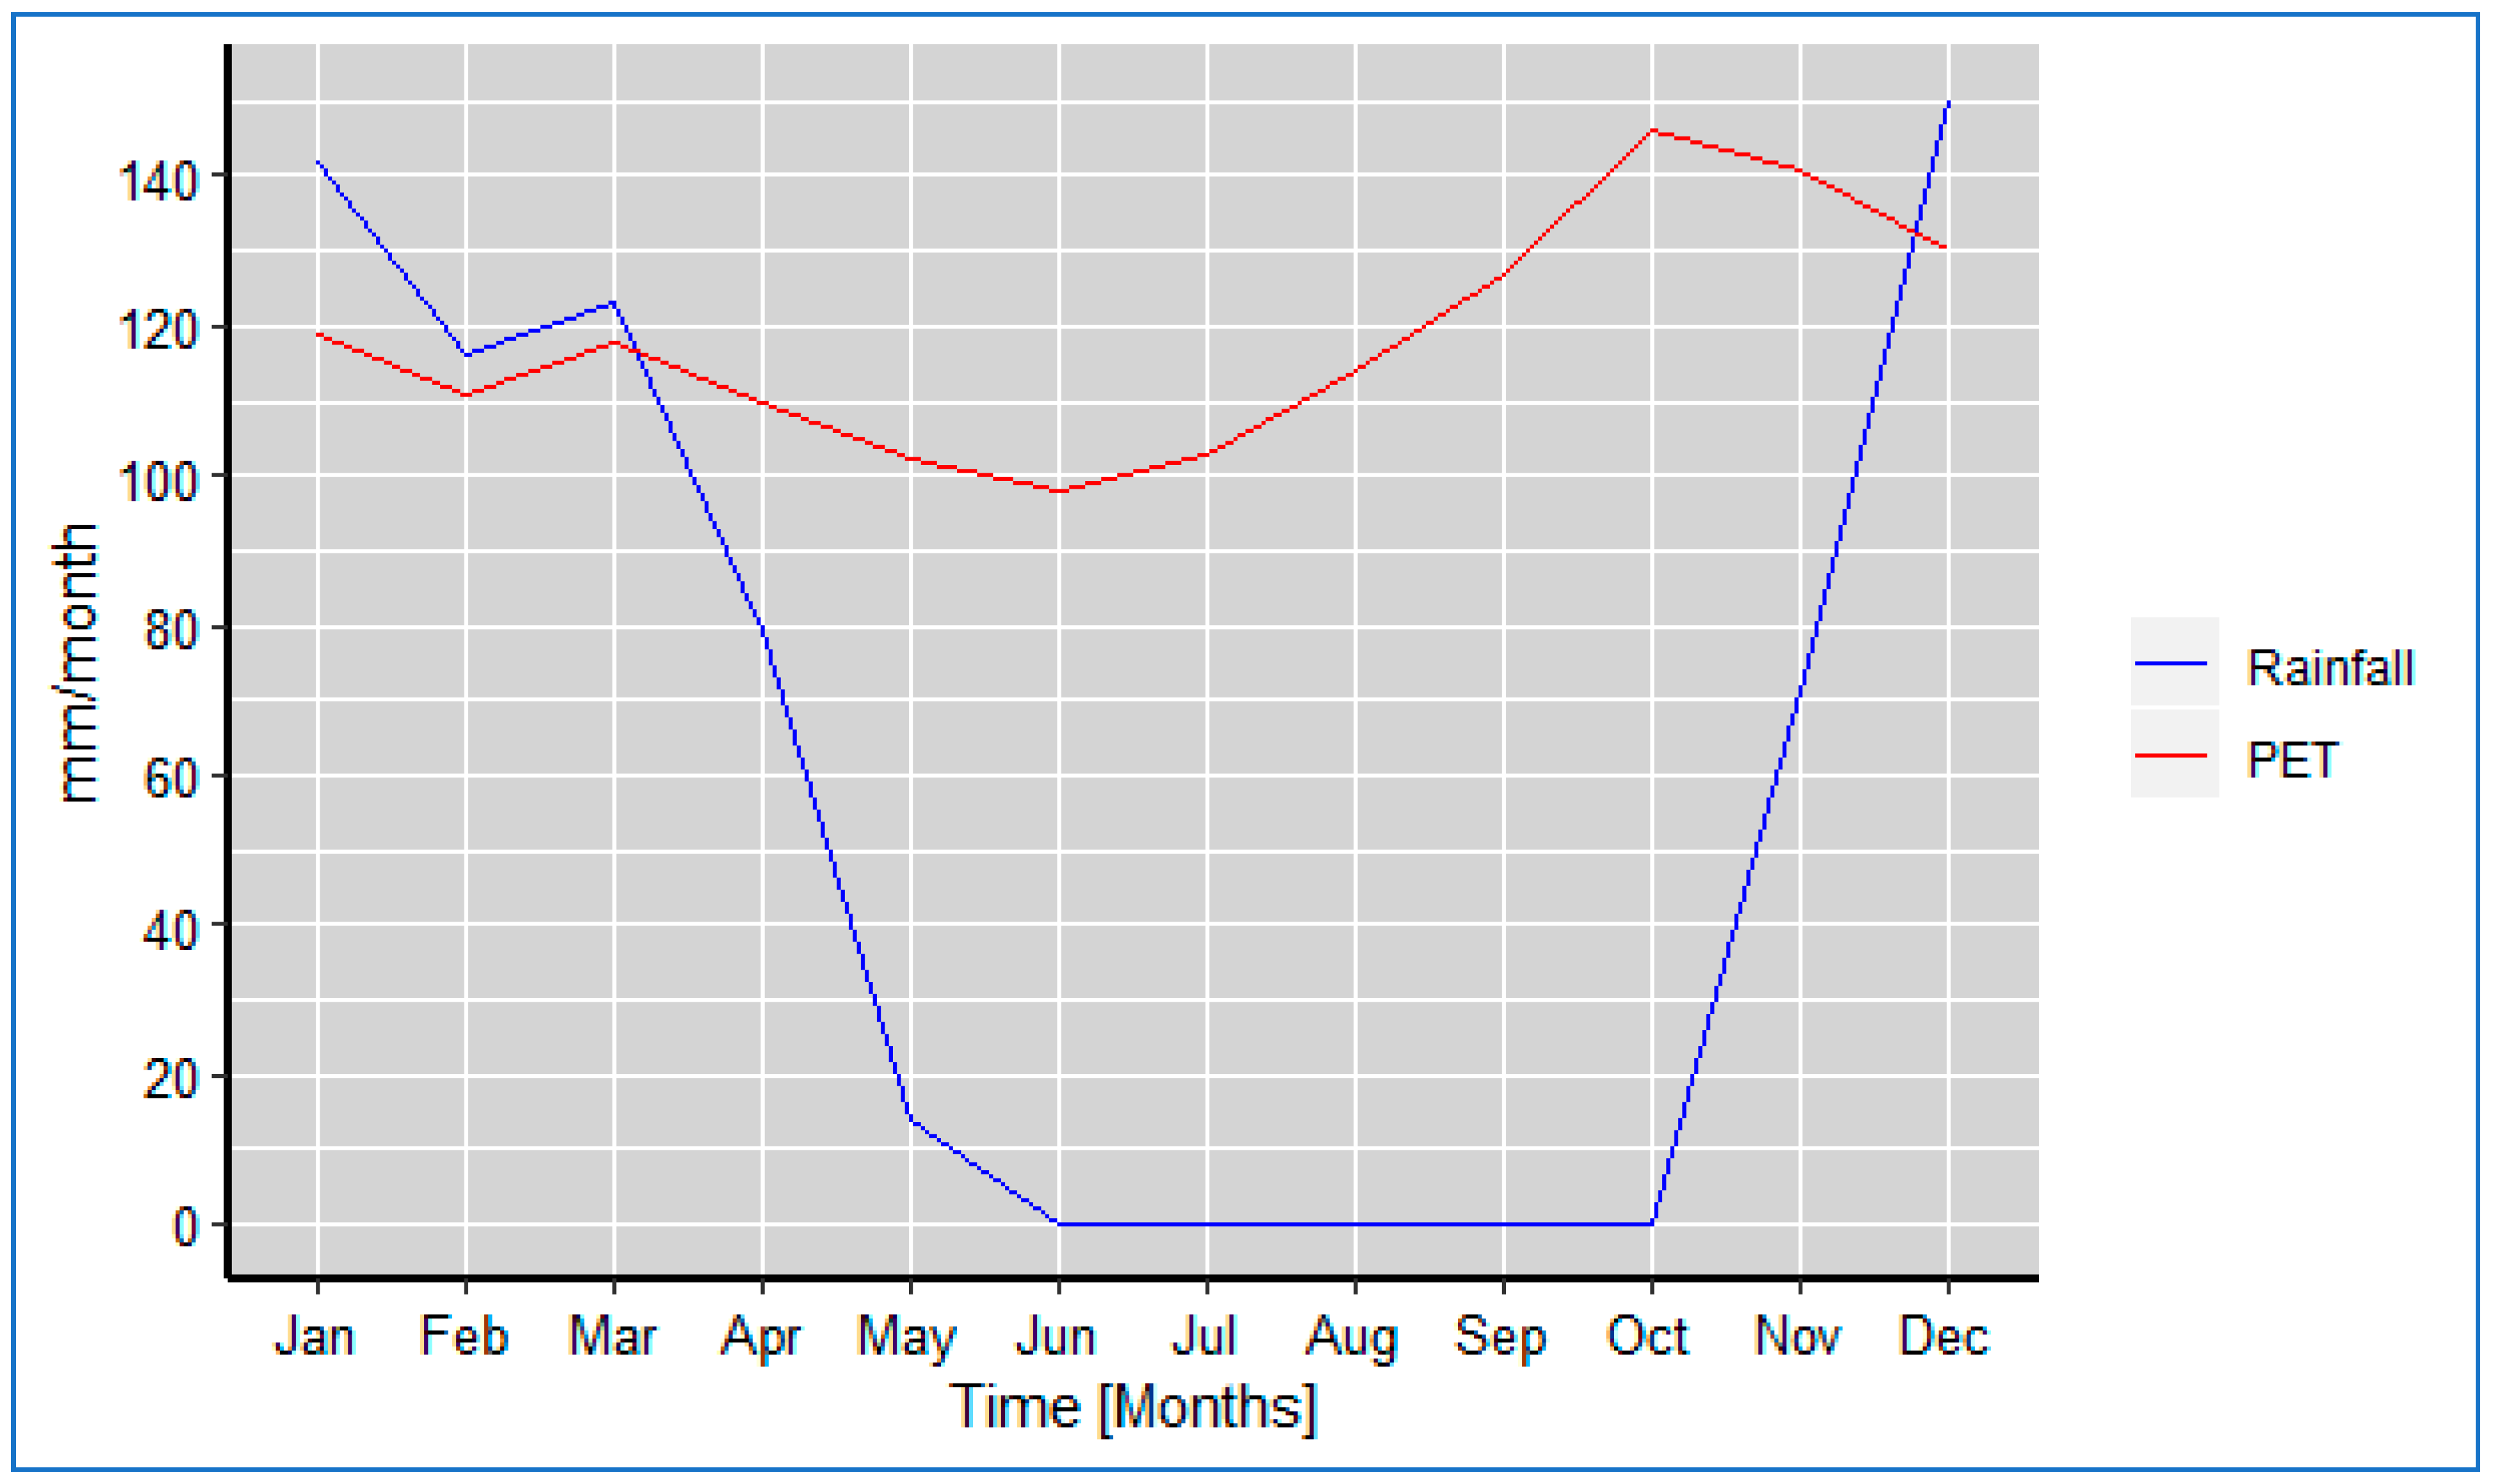
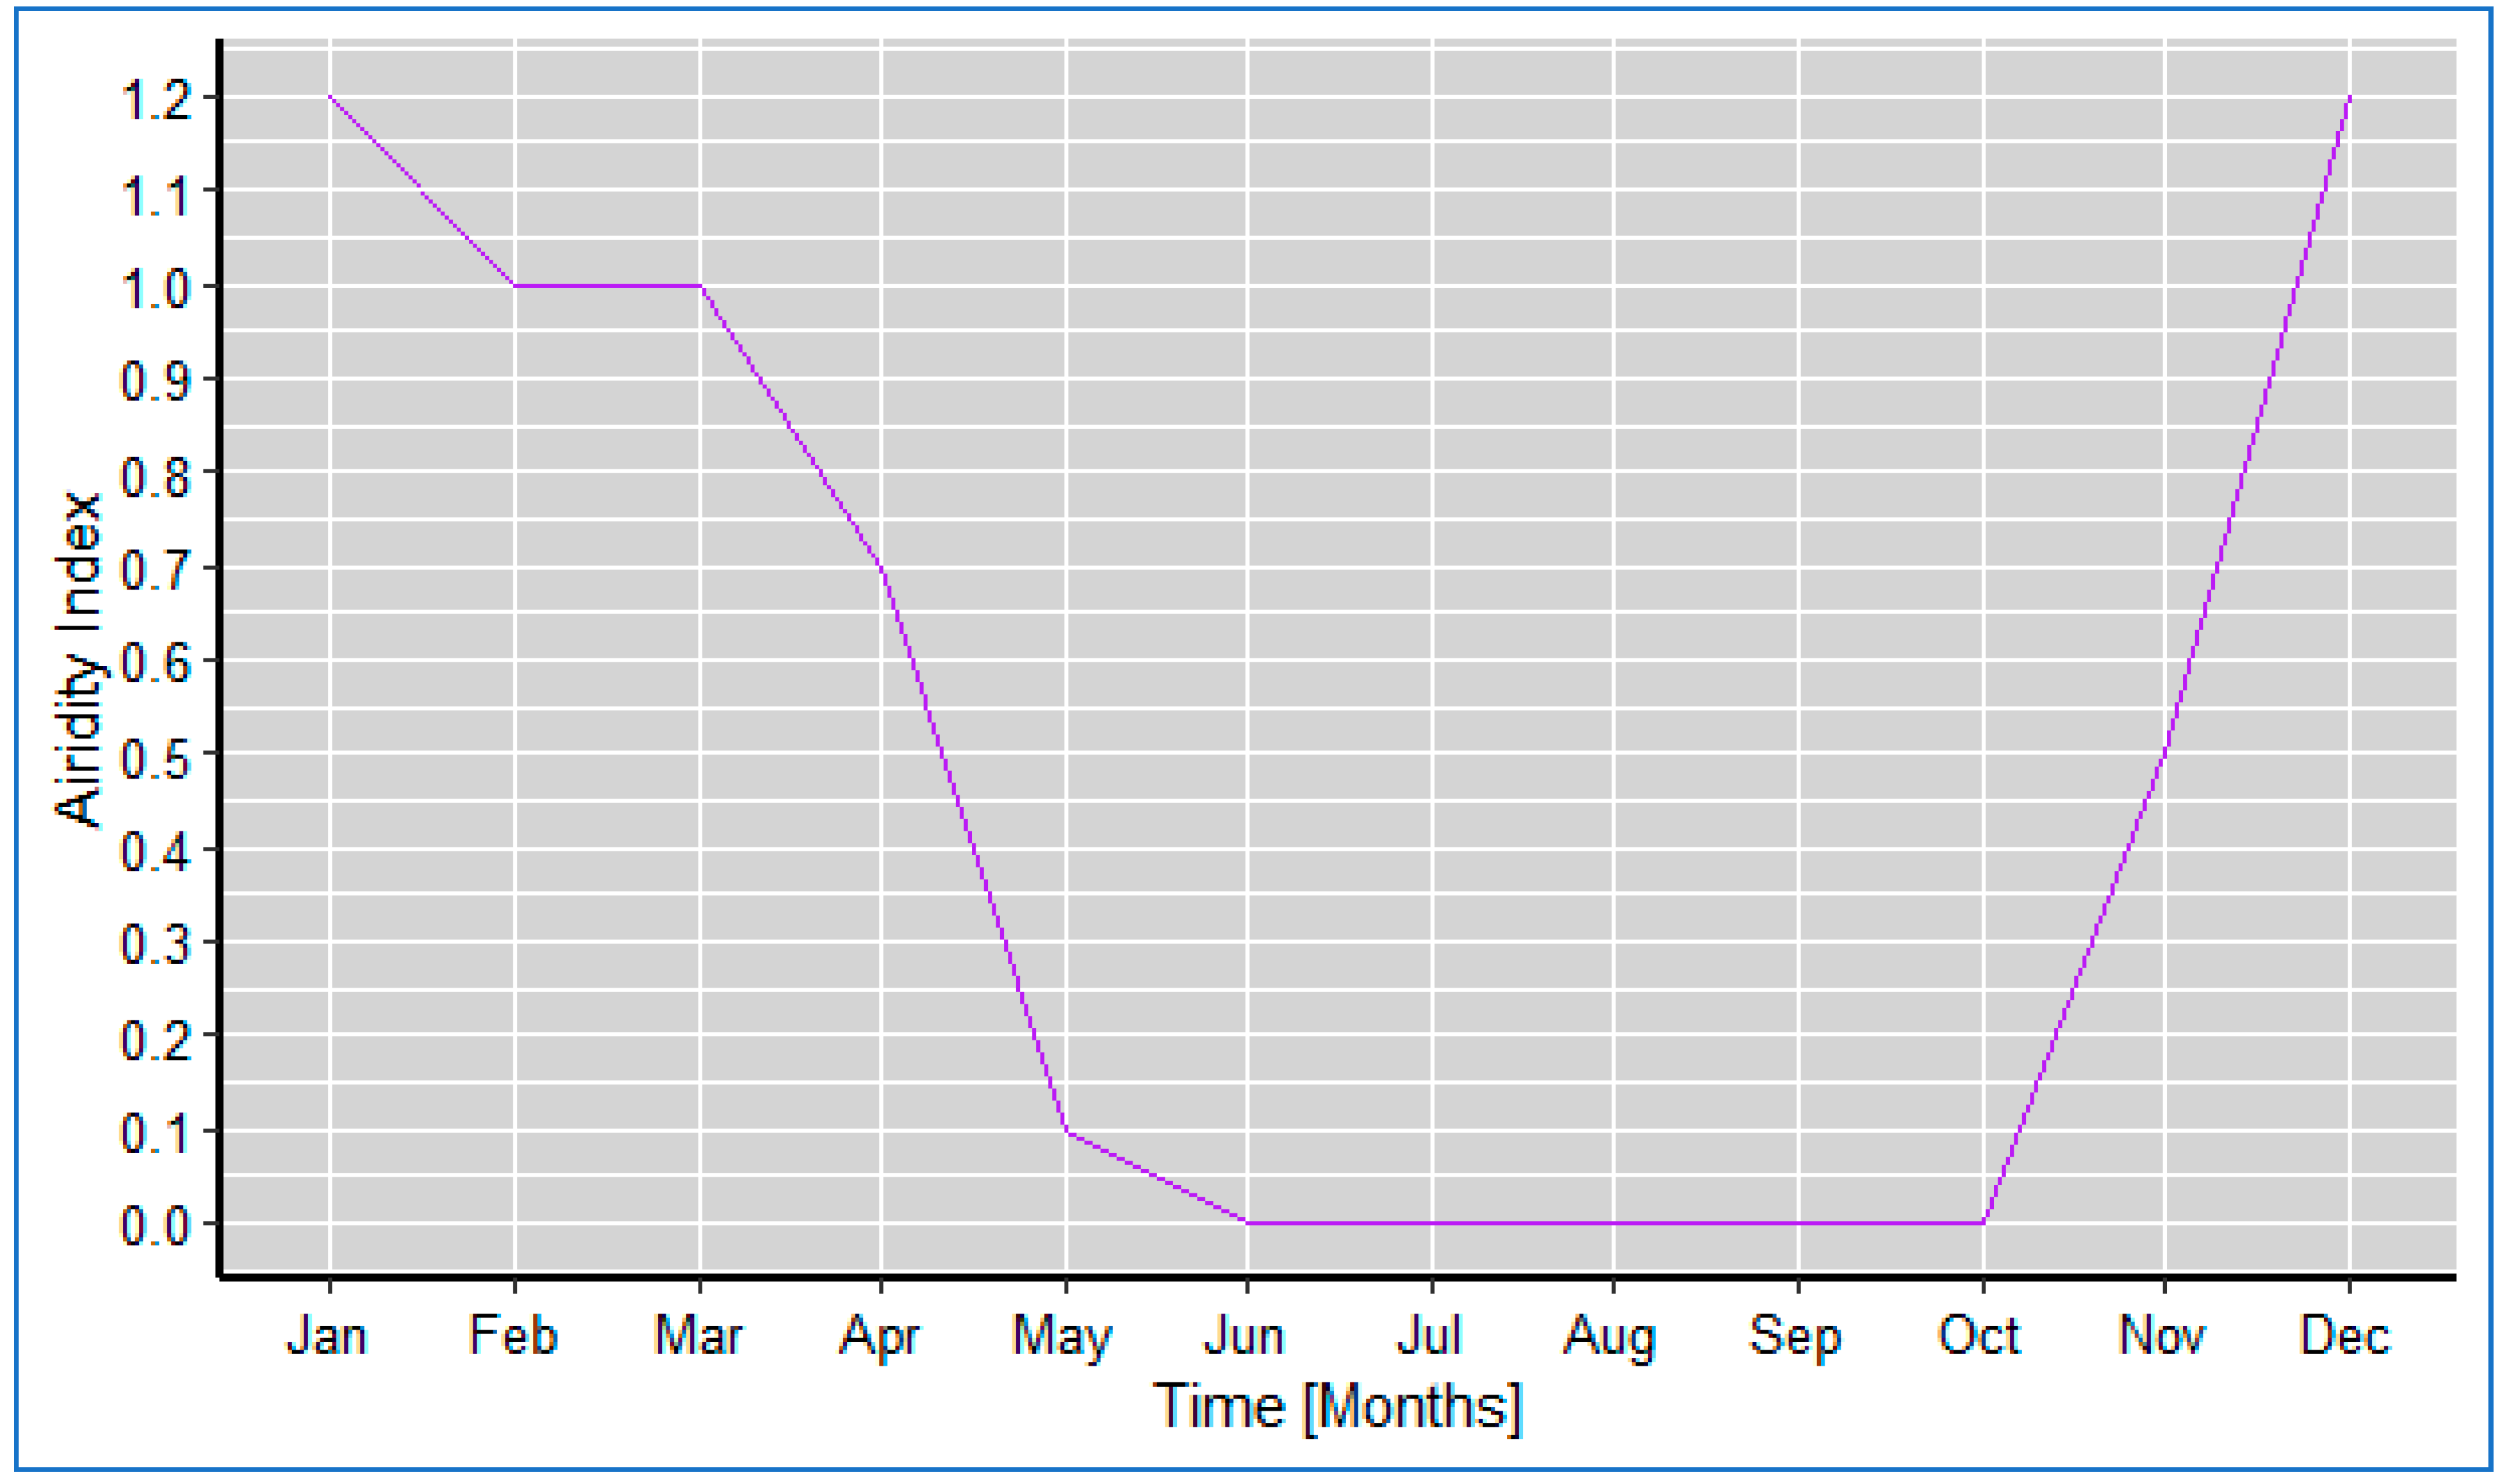
2.2. Climate of the Study Area
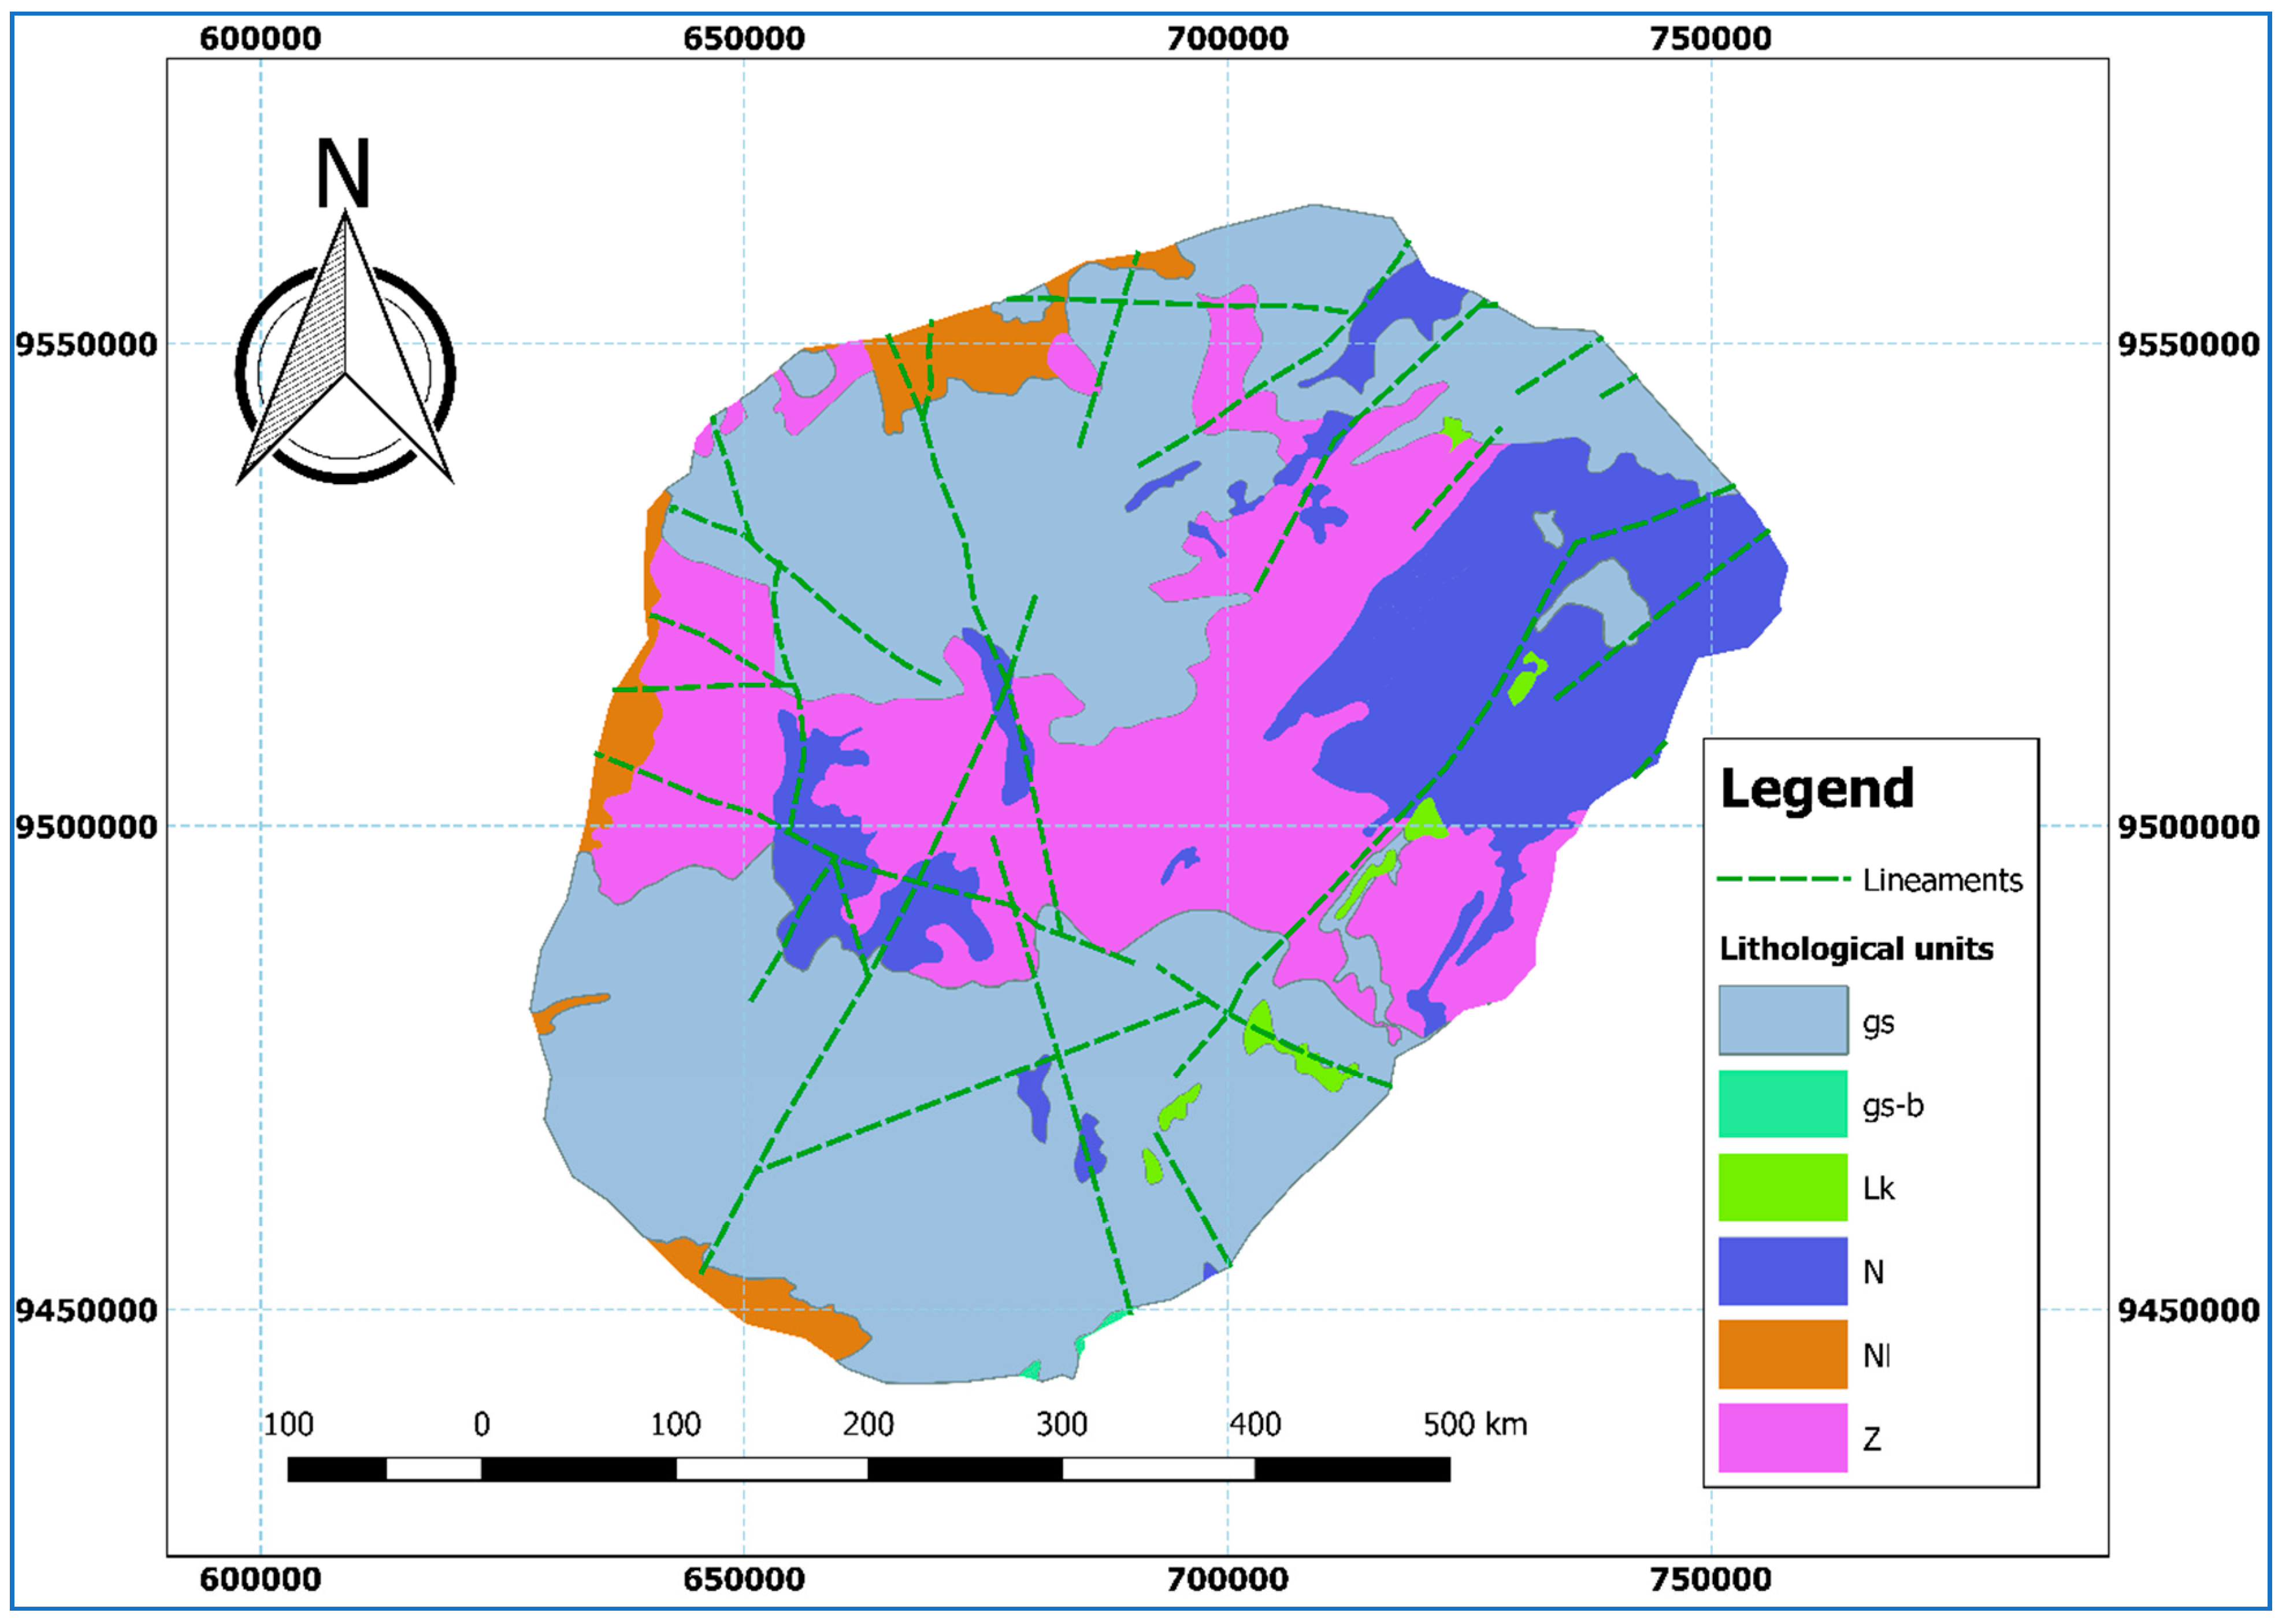
2.3. Geology
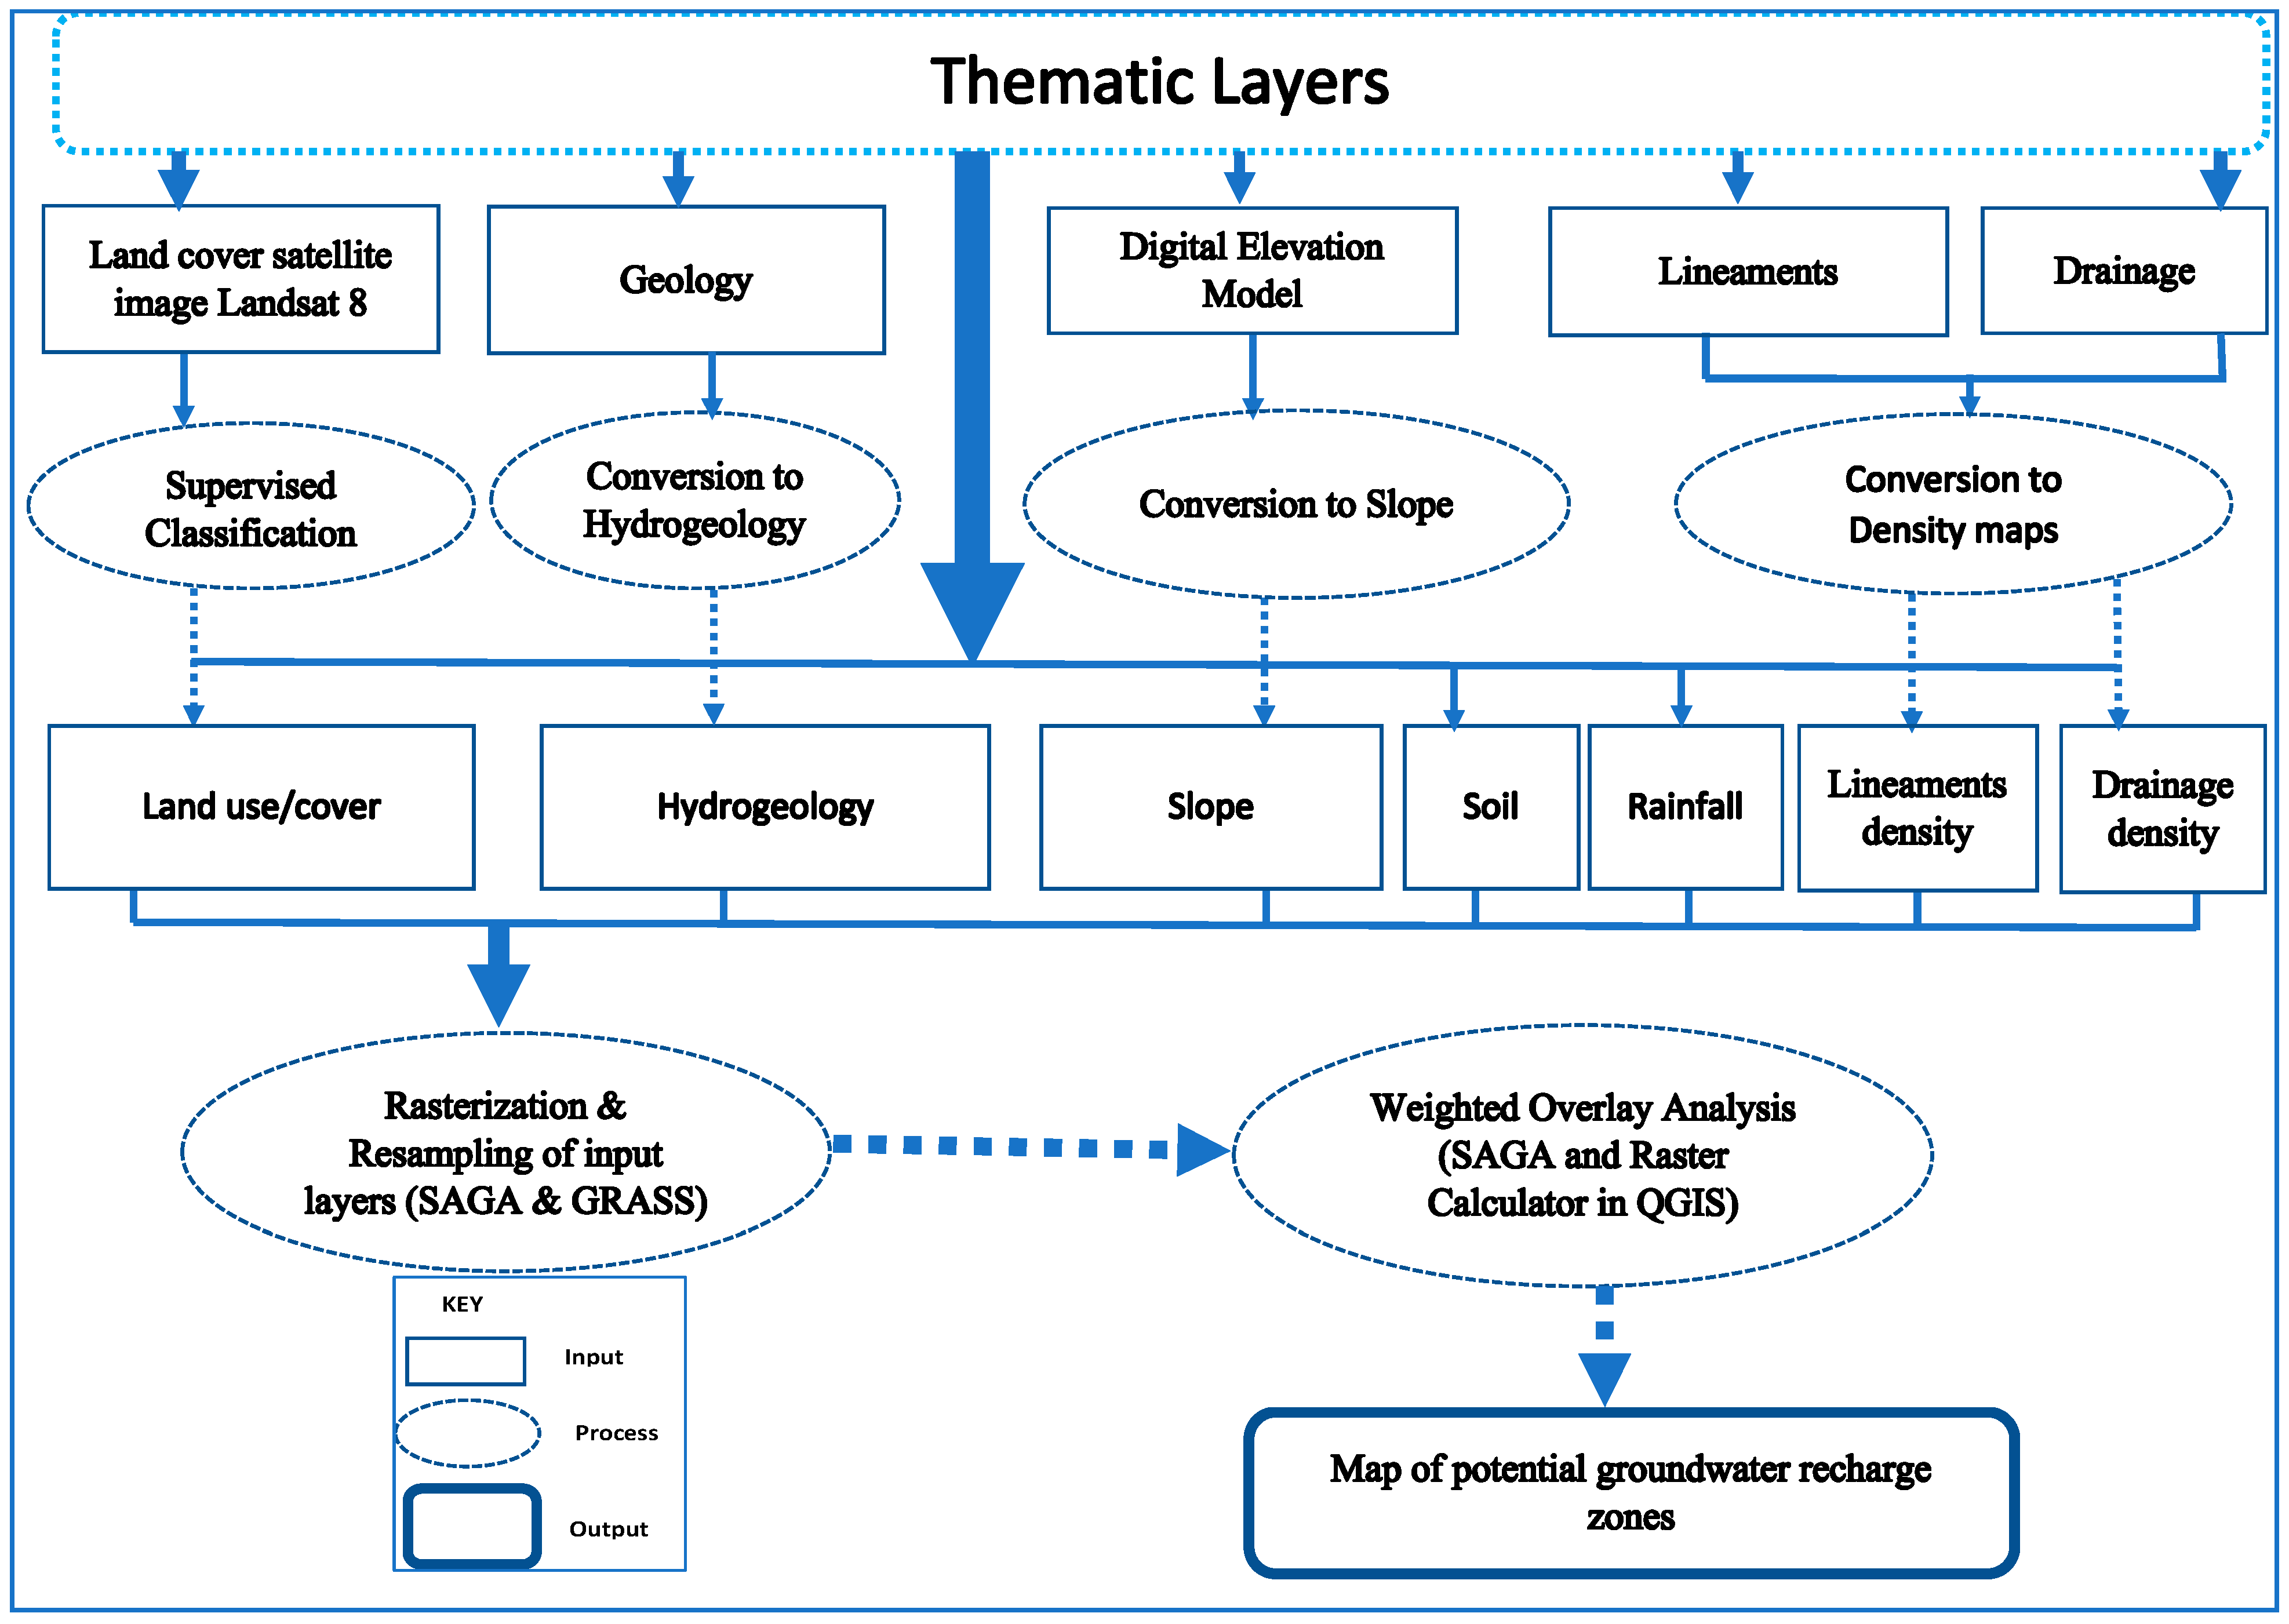
2.4. Input Thematic Maps
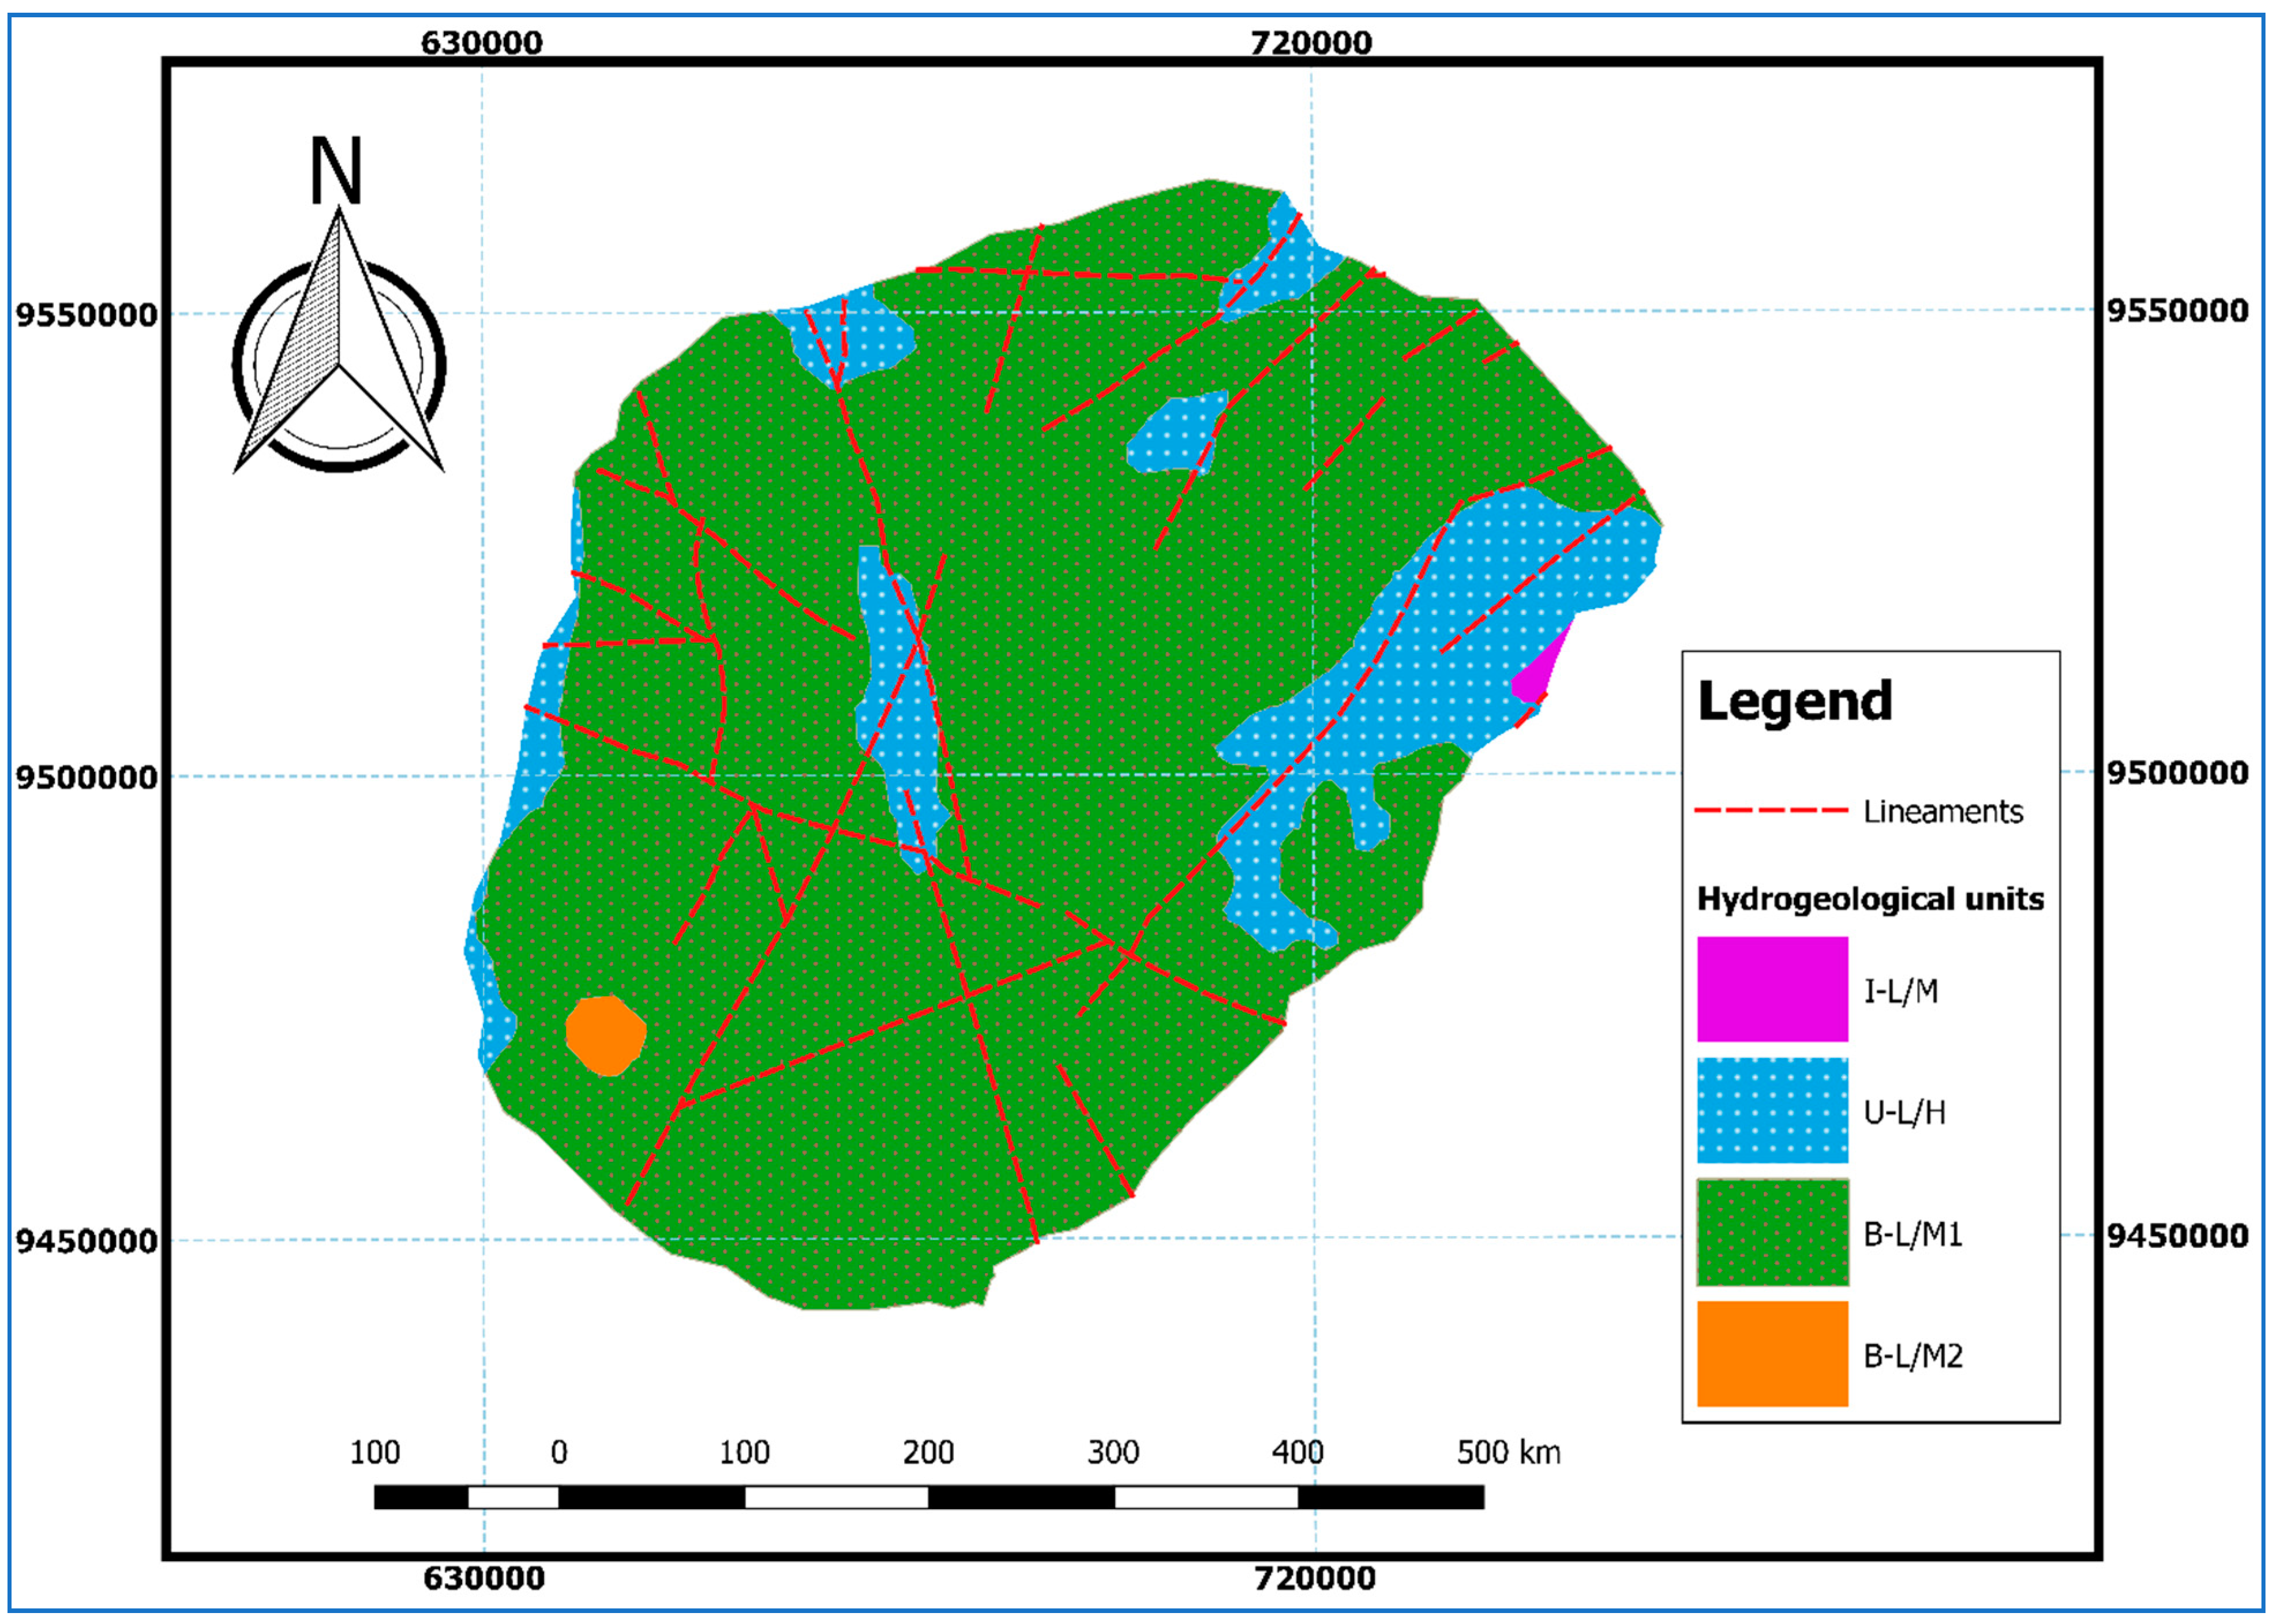
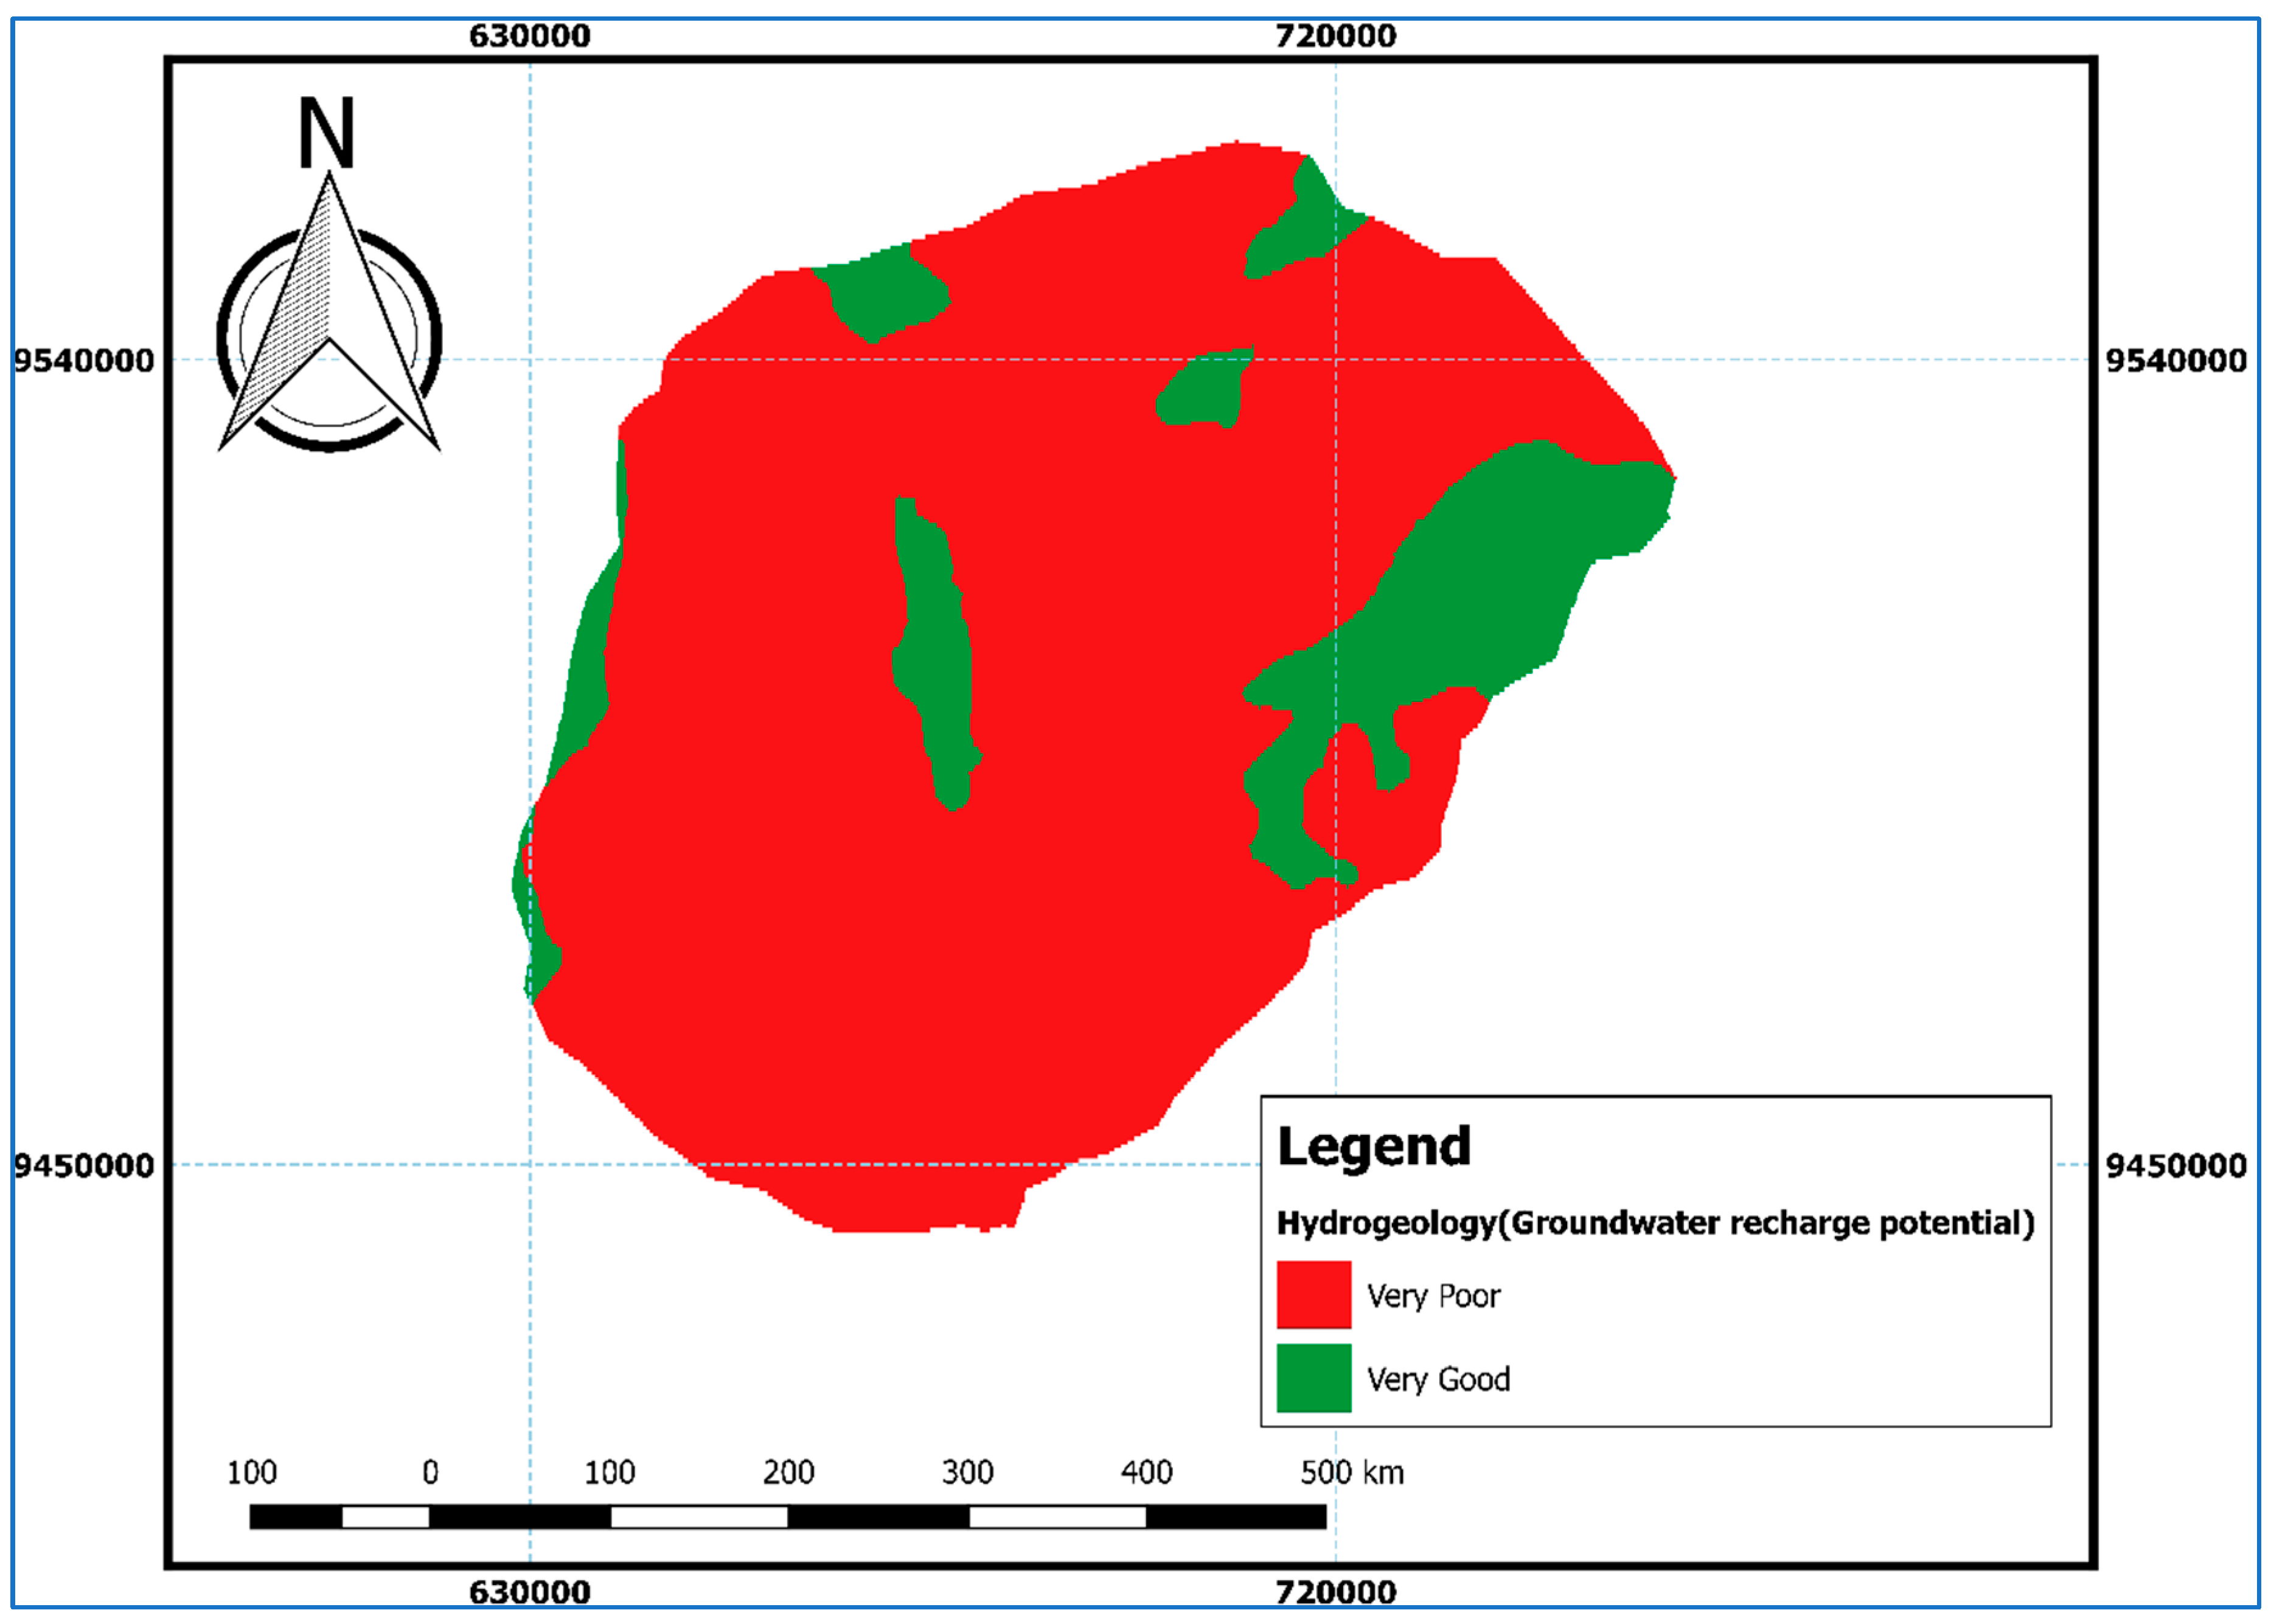
2.4.1. Lithology/Hydrogeology
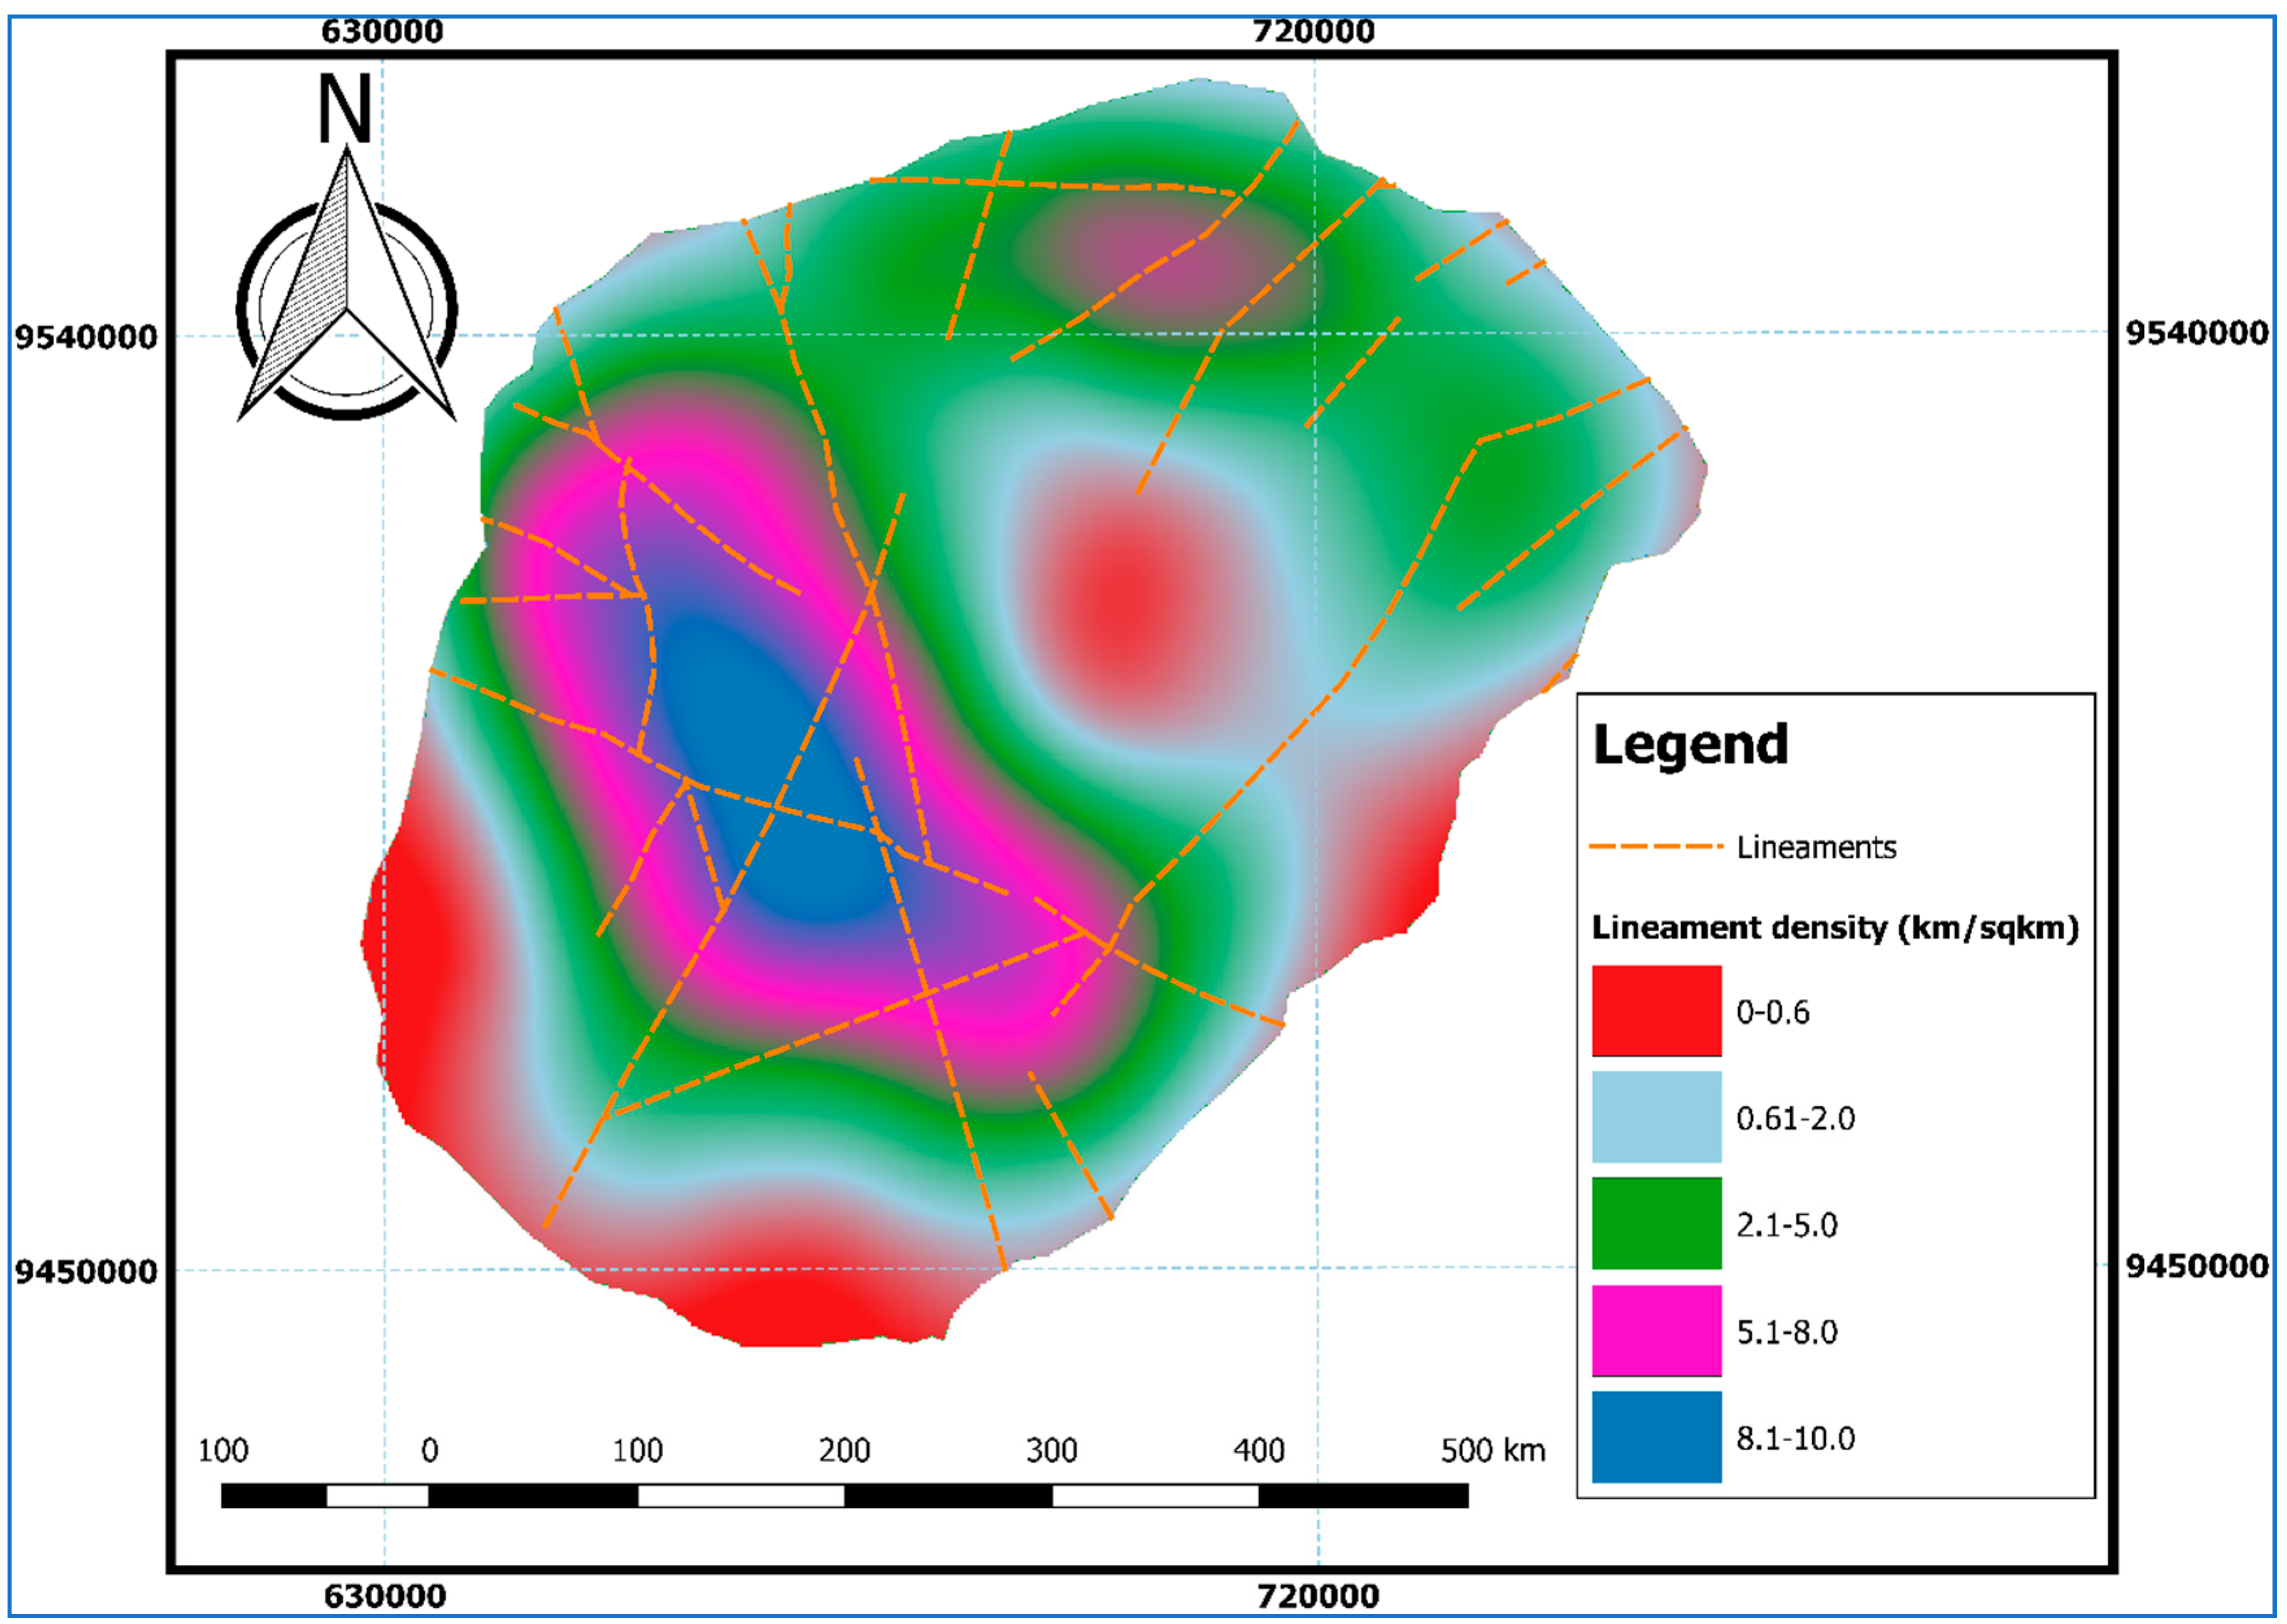
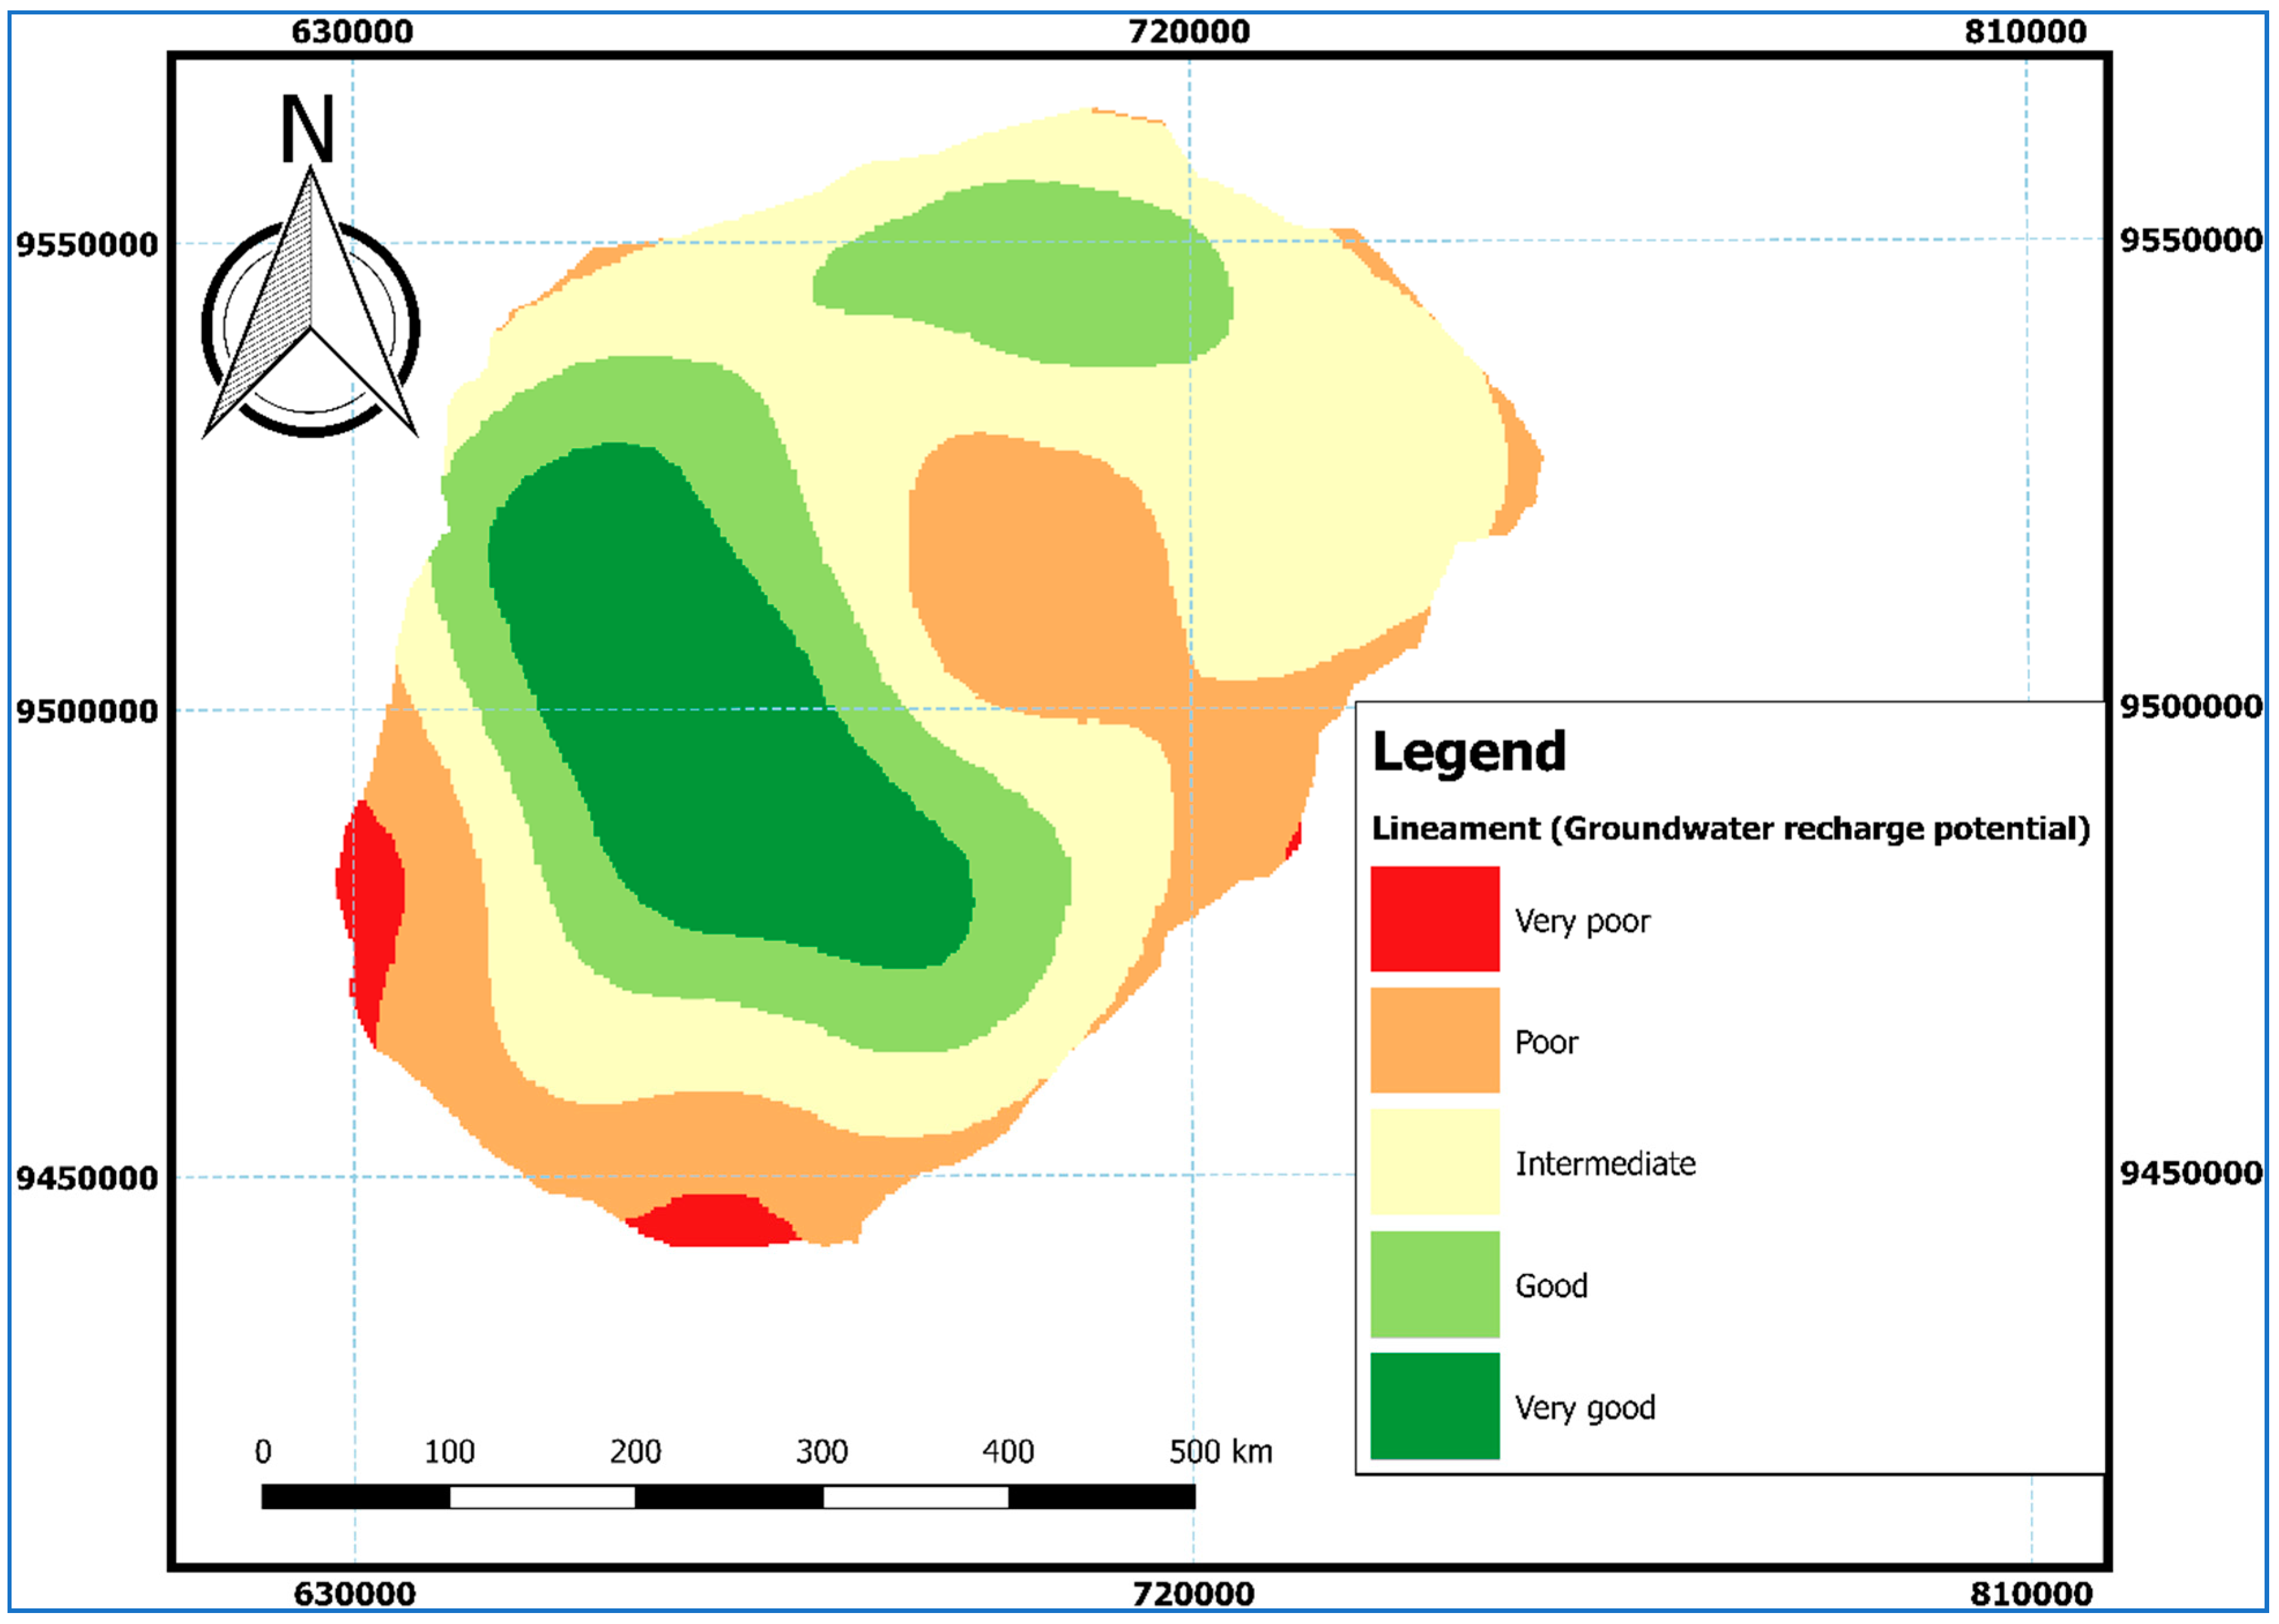
2.4.2. Lineaments and Lineament Density
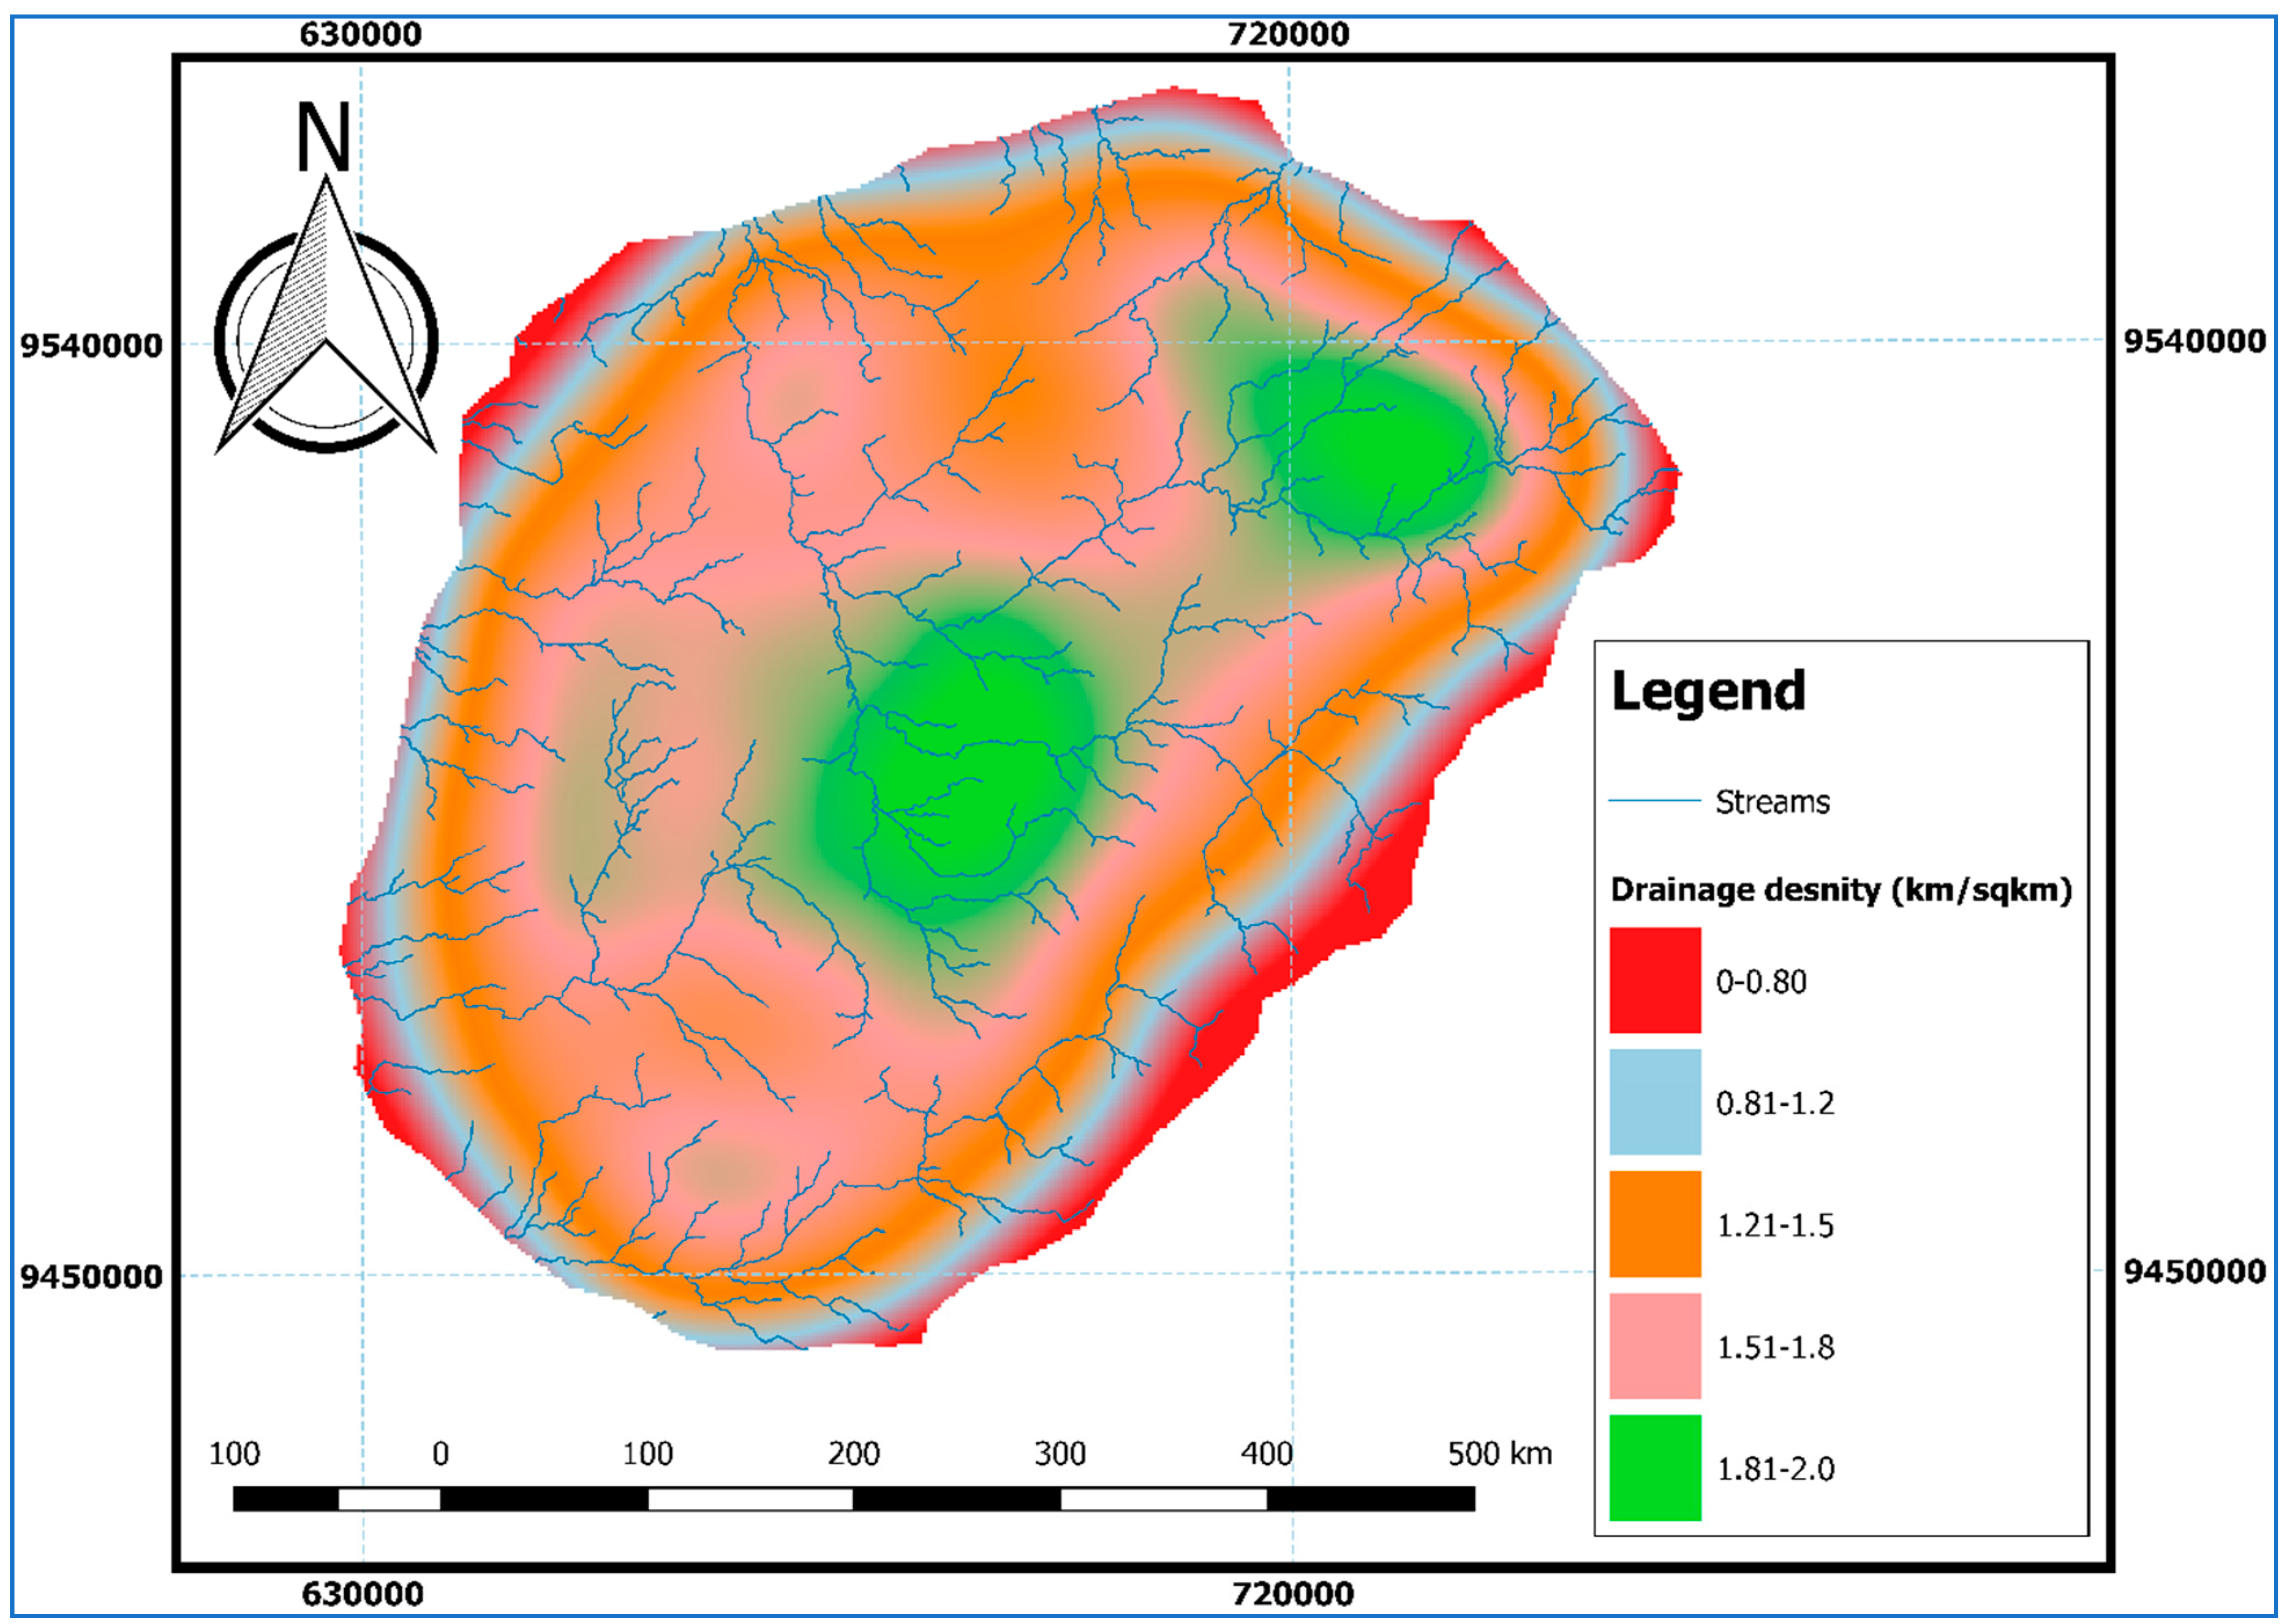
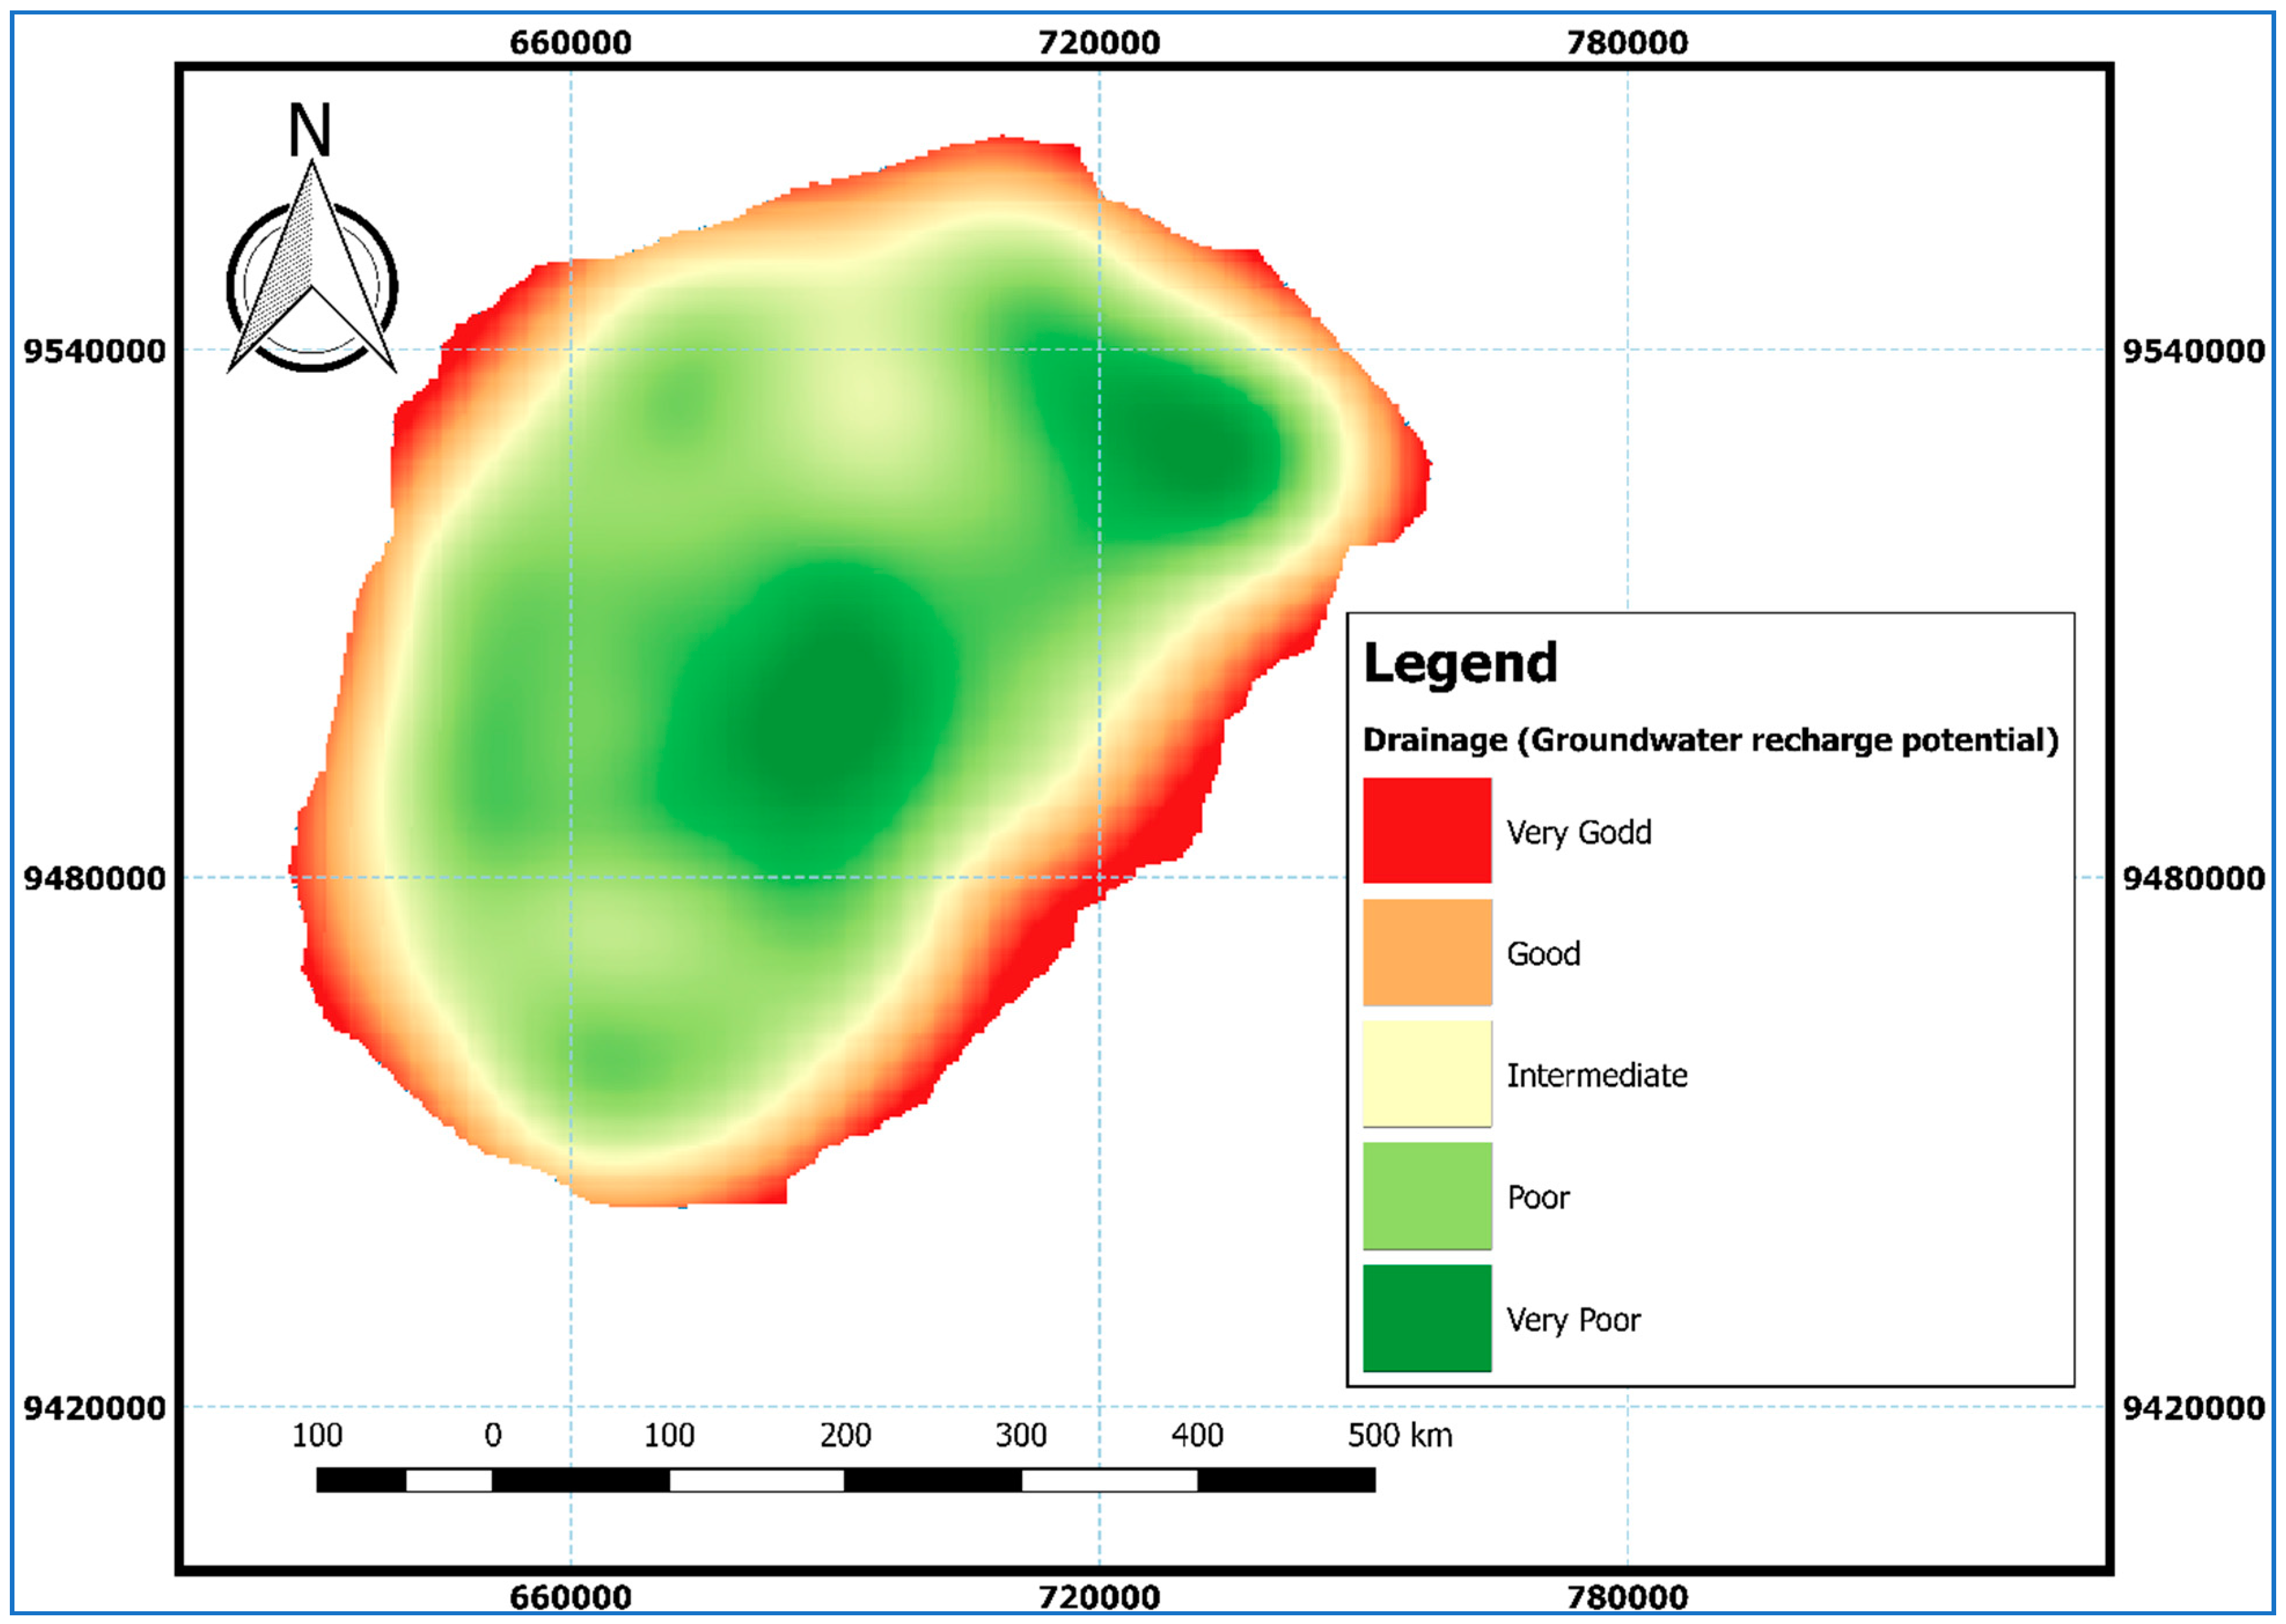
2.4.3. Drainage and Drainage Density
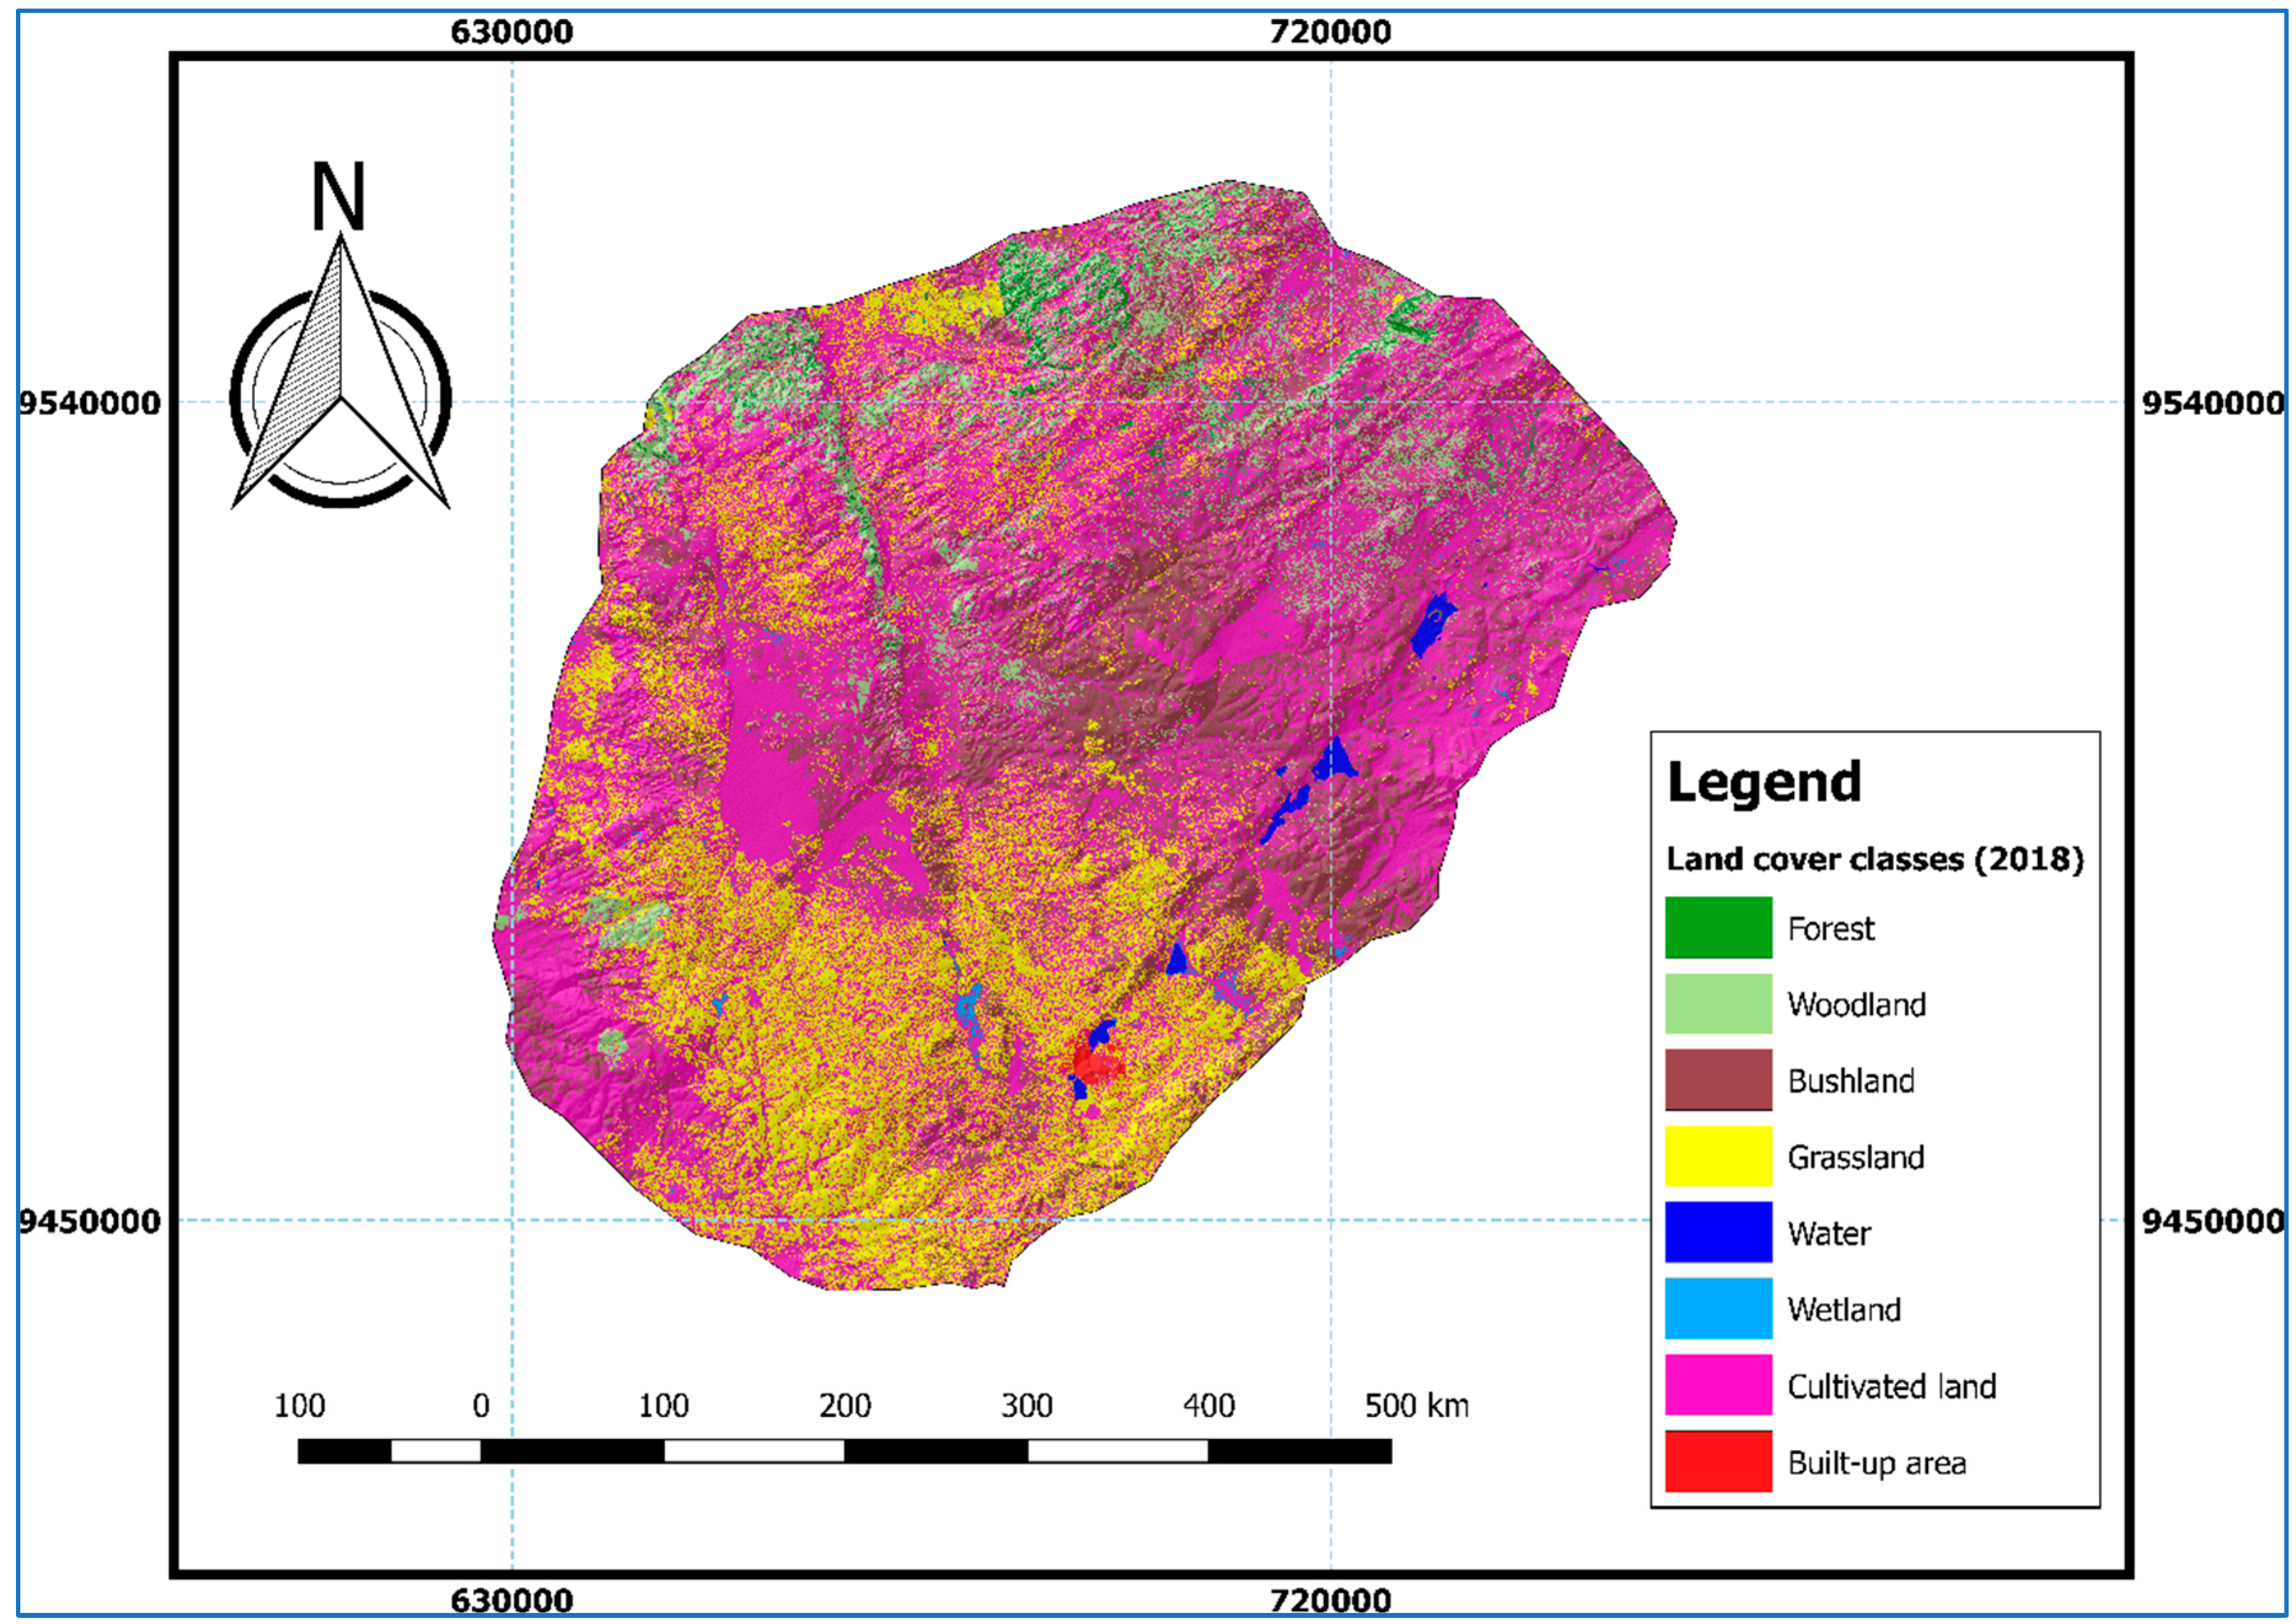
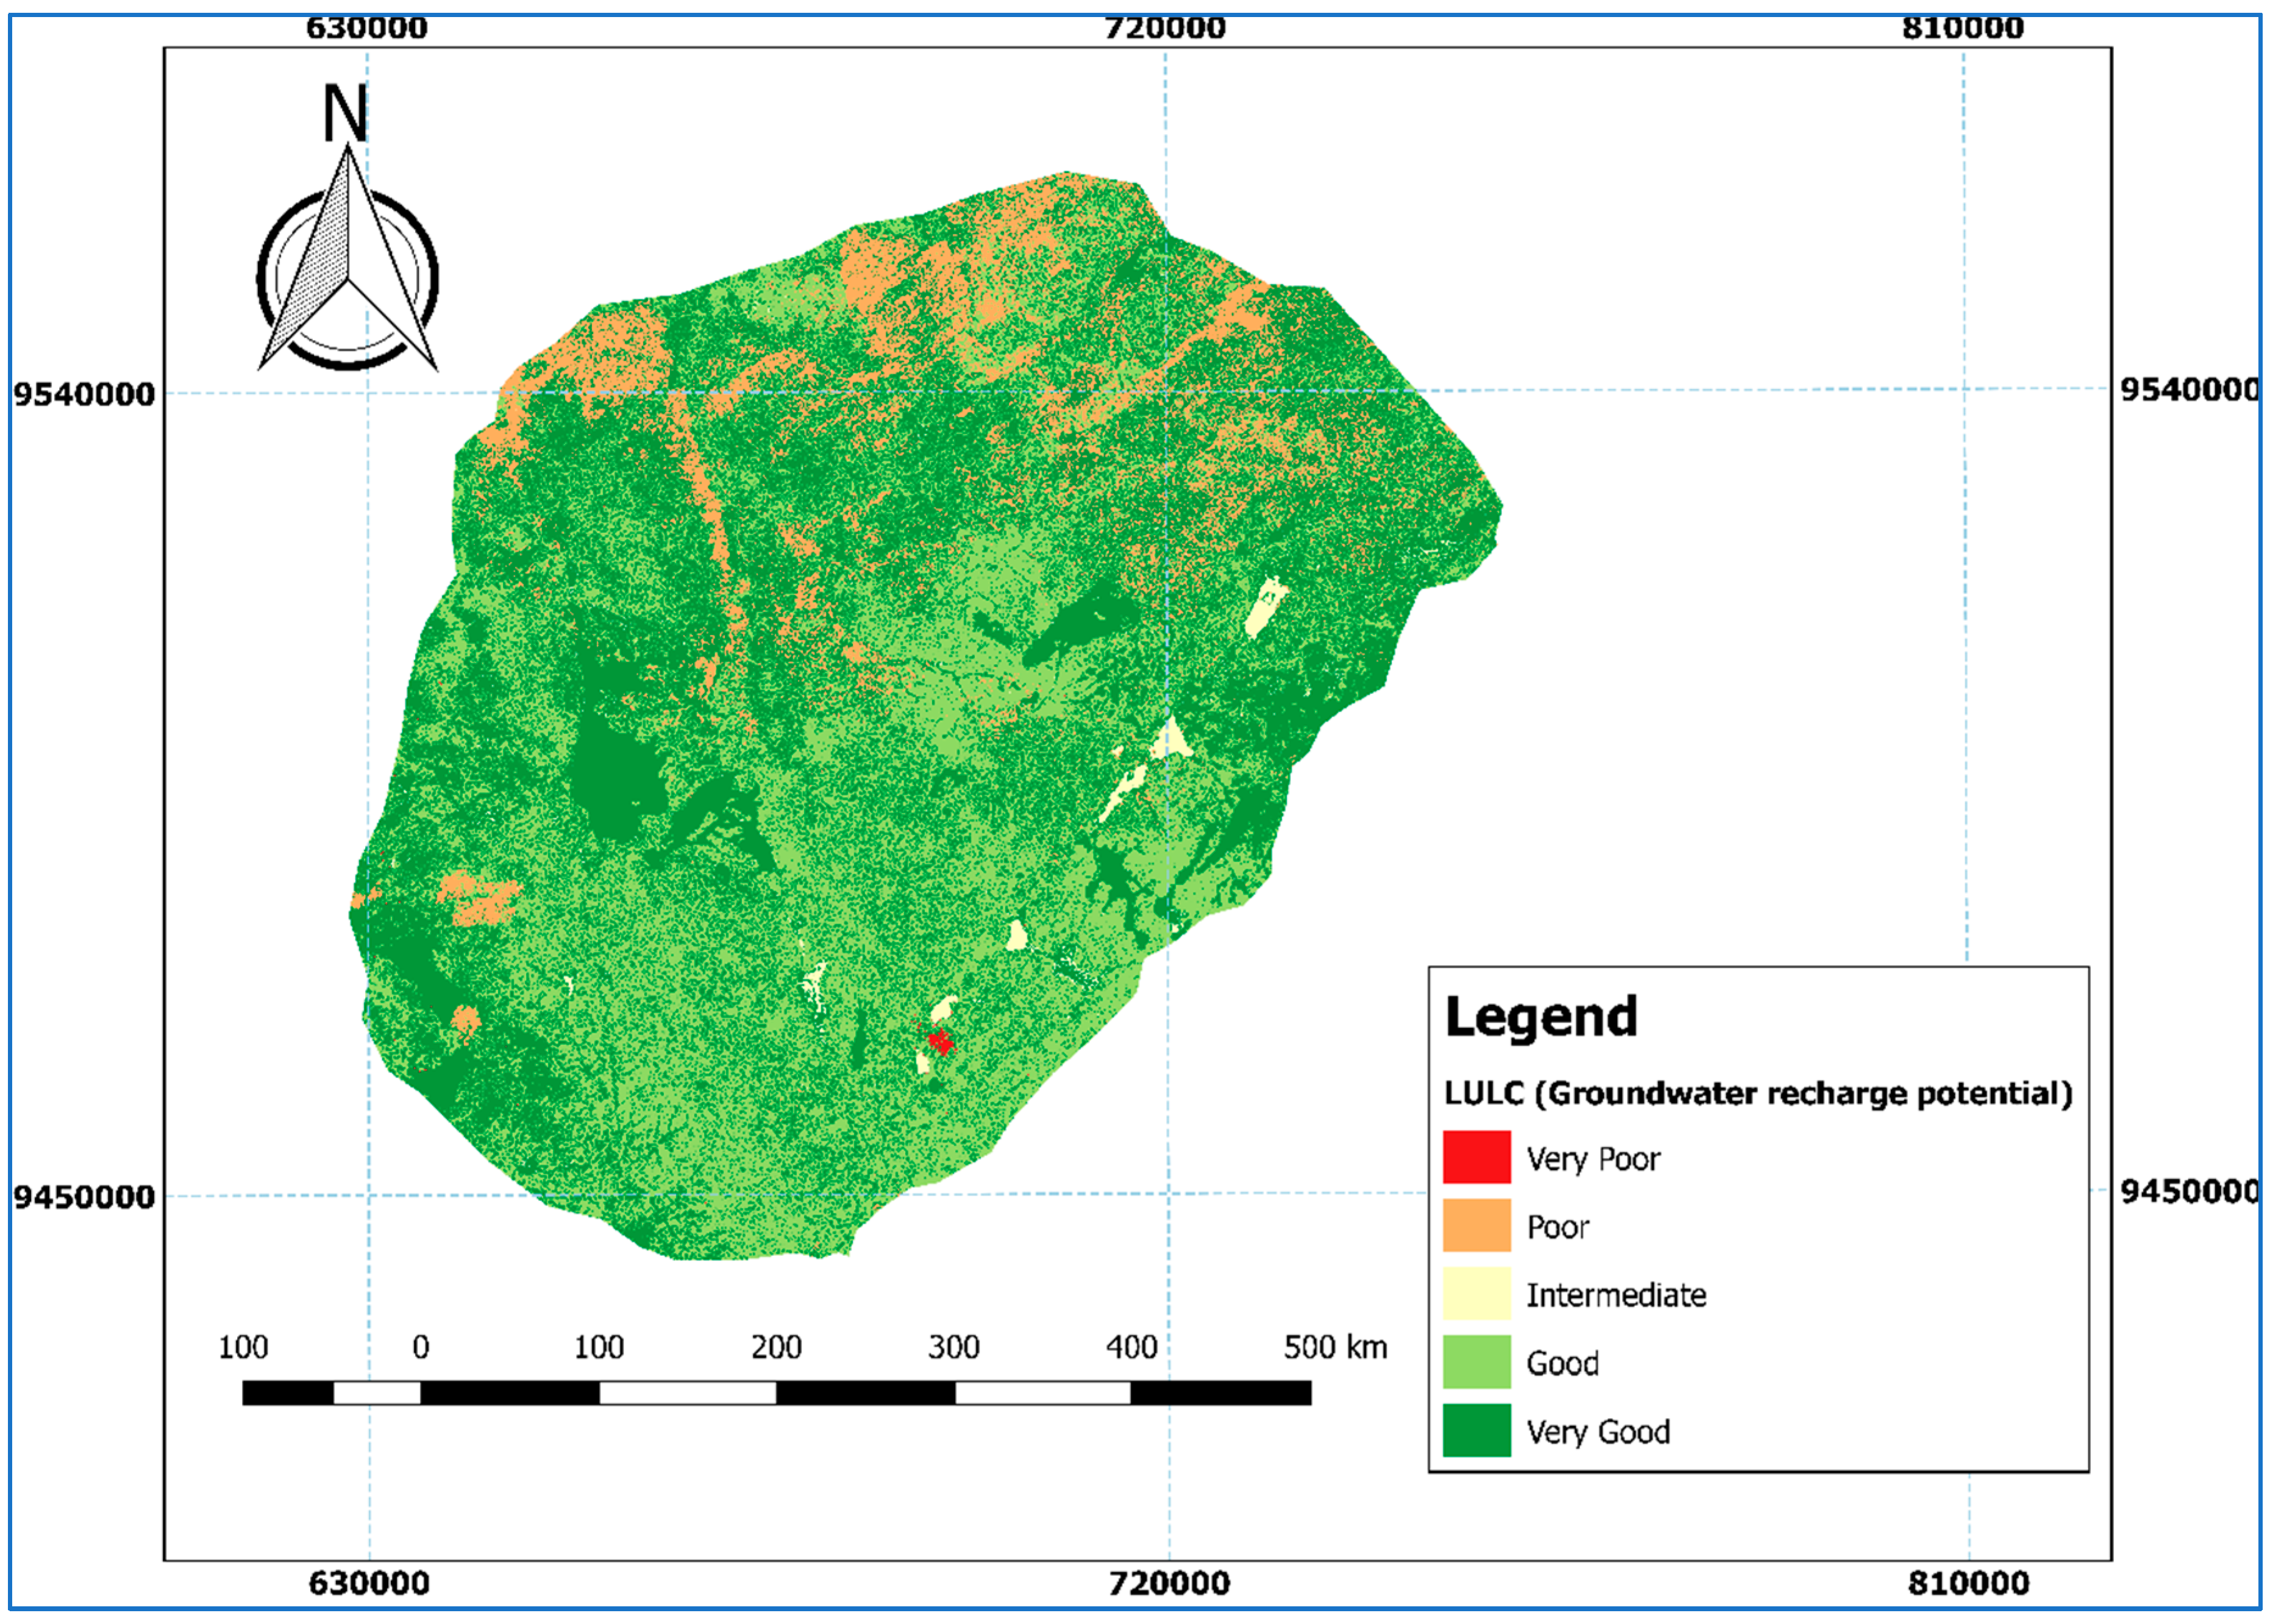
2.4.4. Land Use/Cover
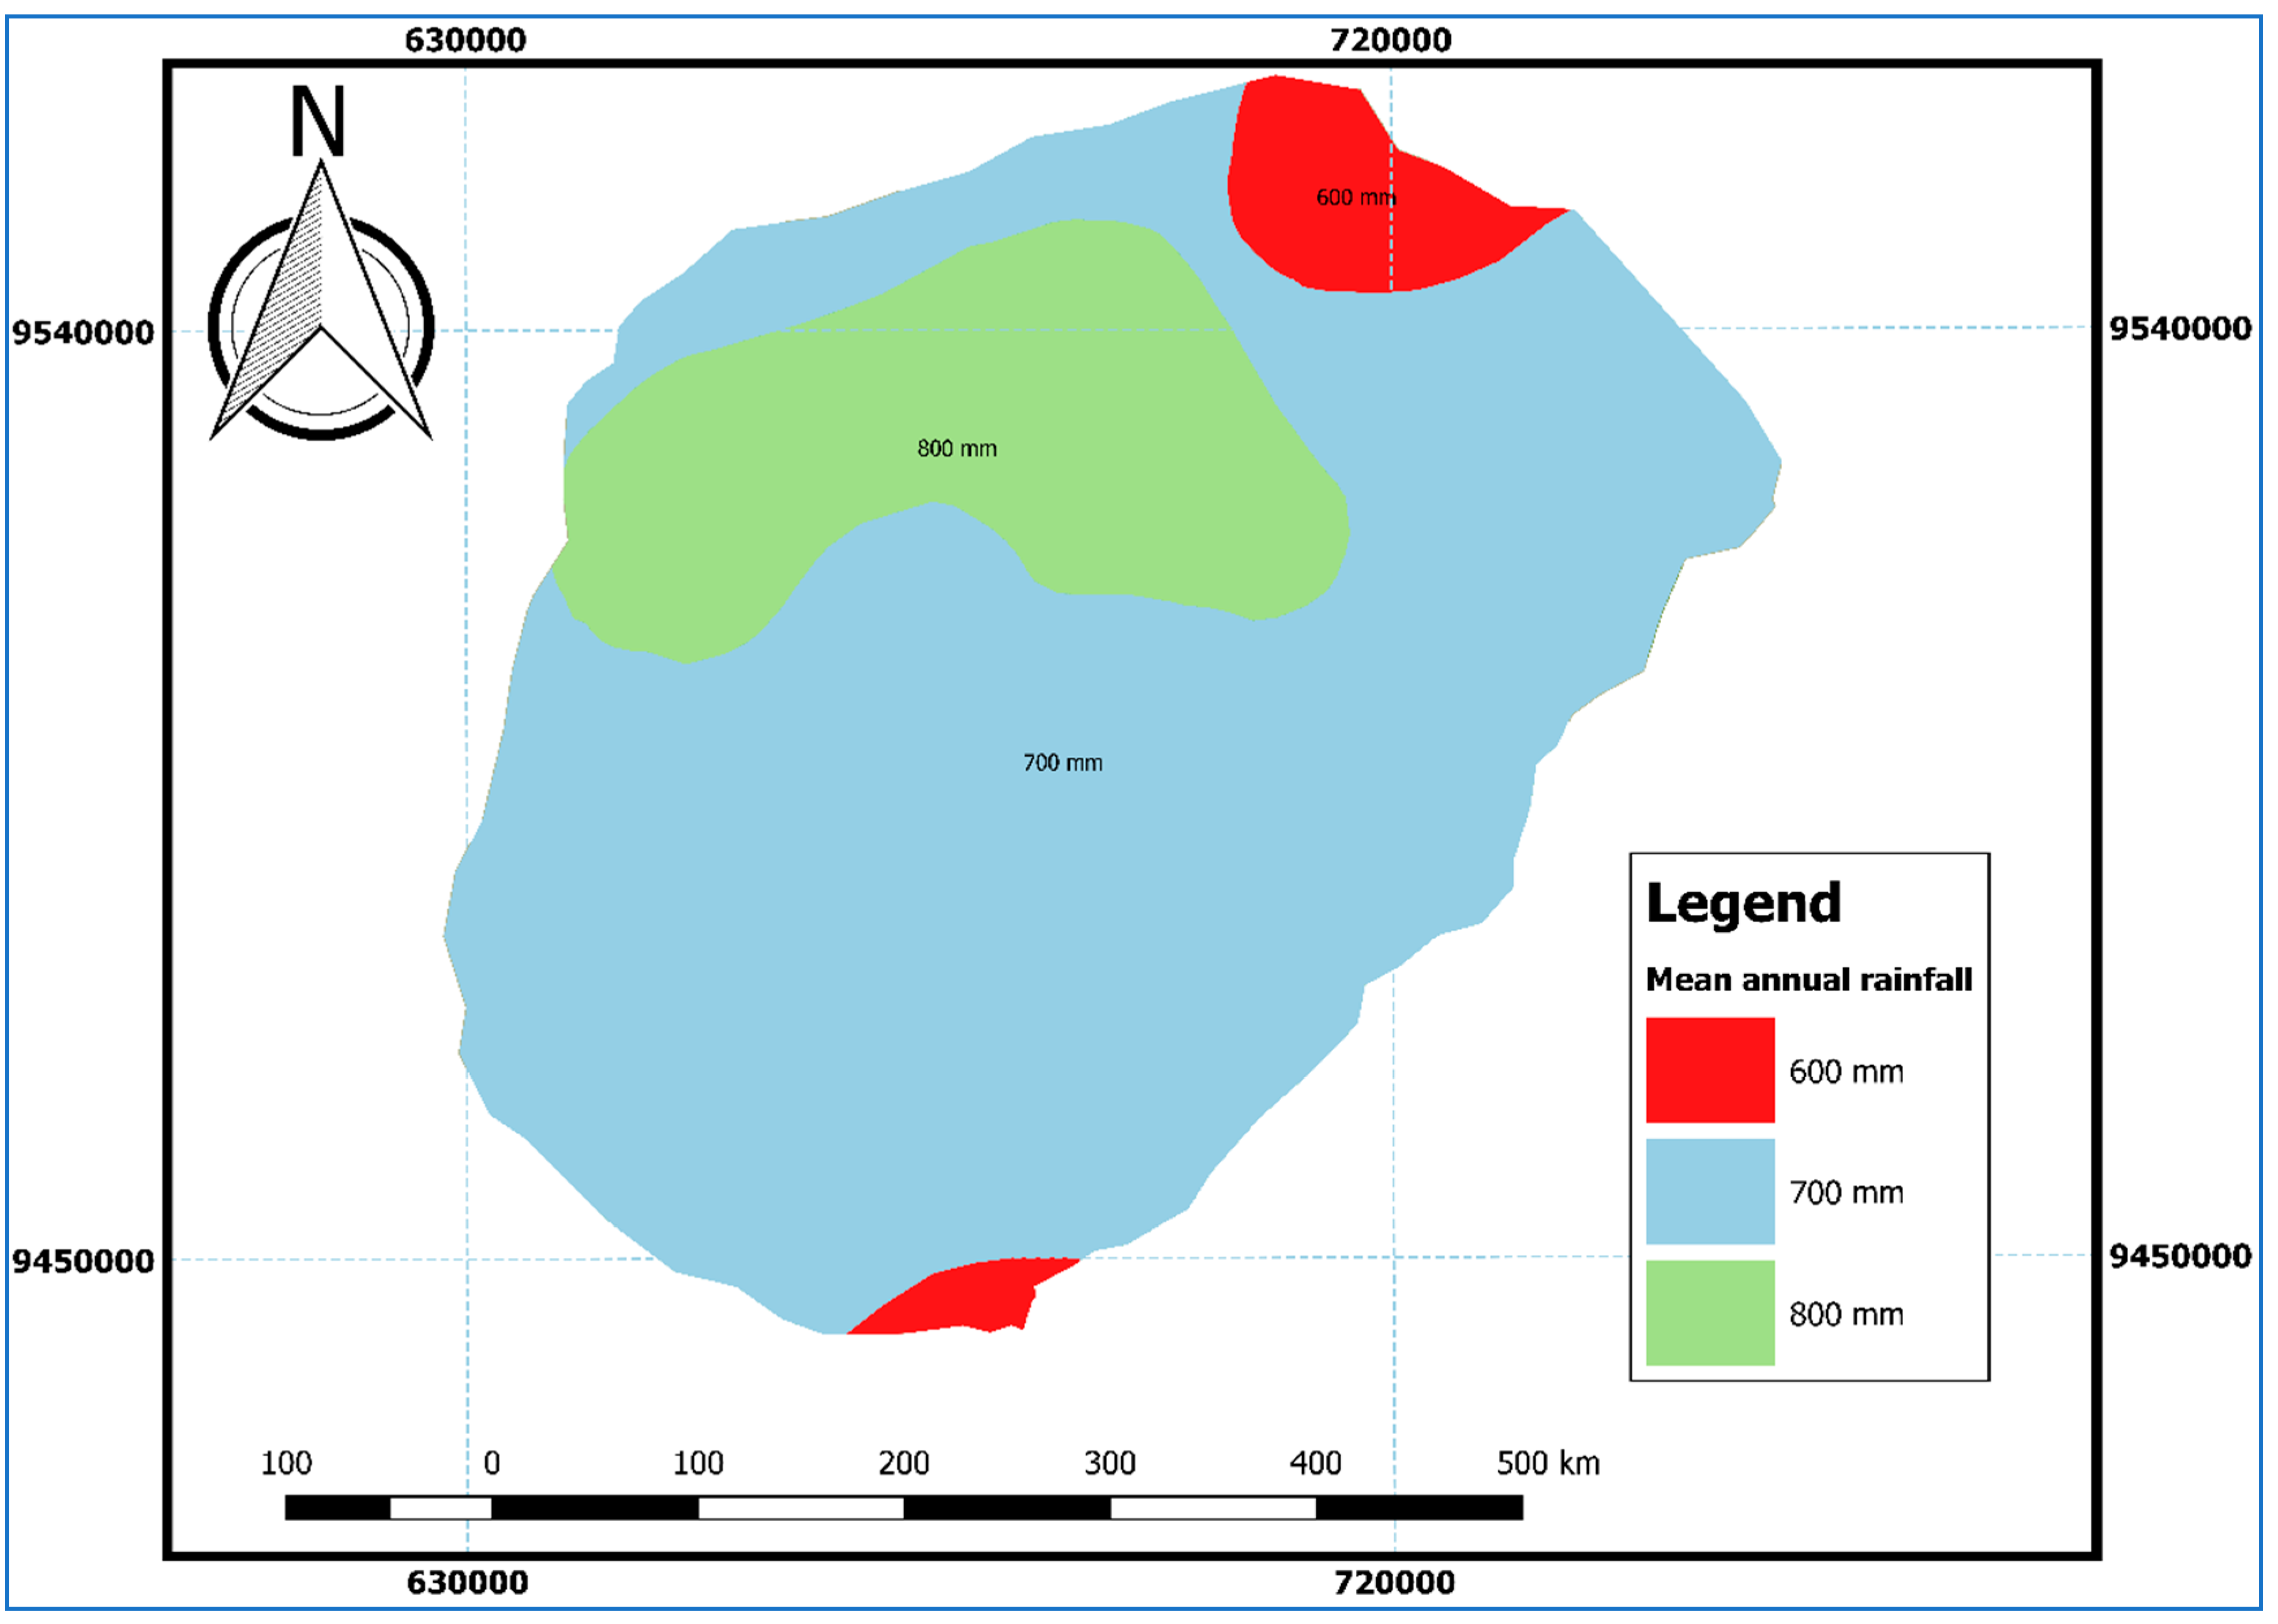
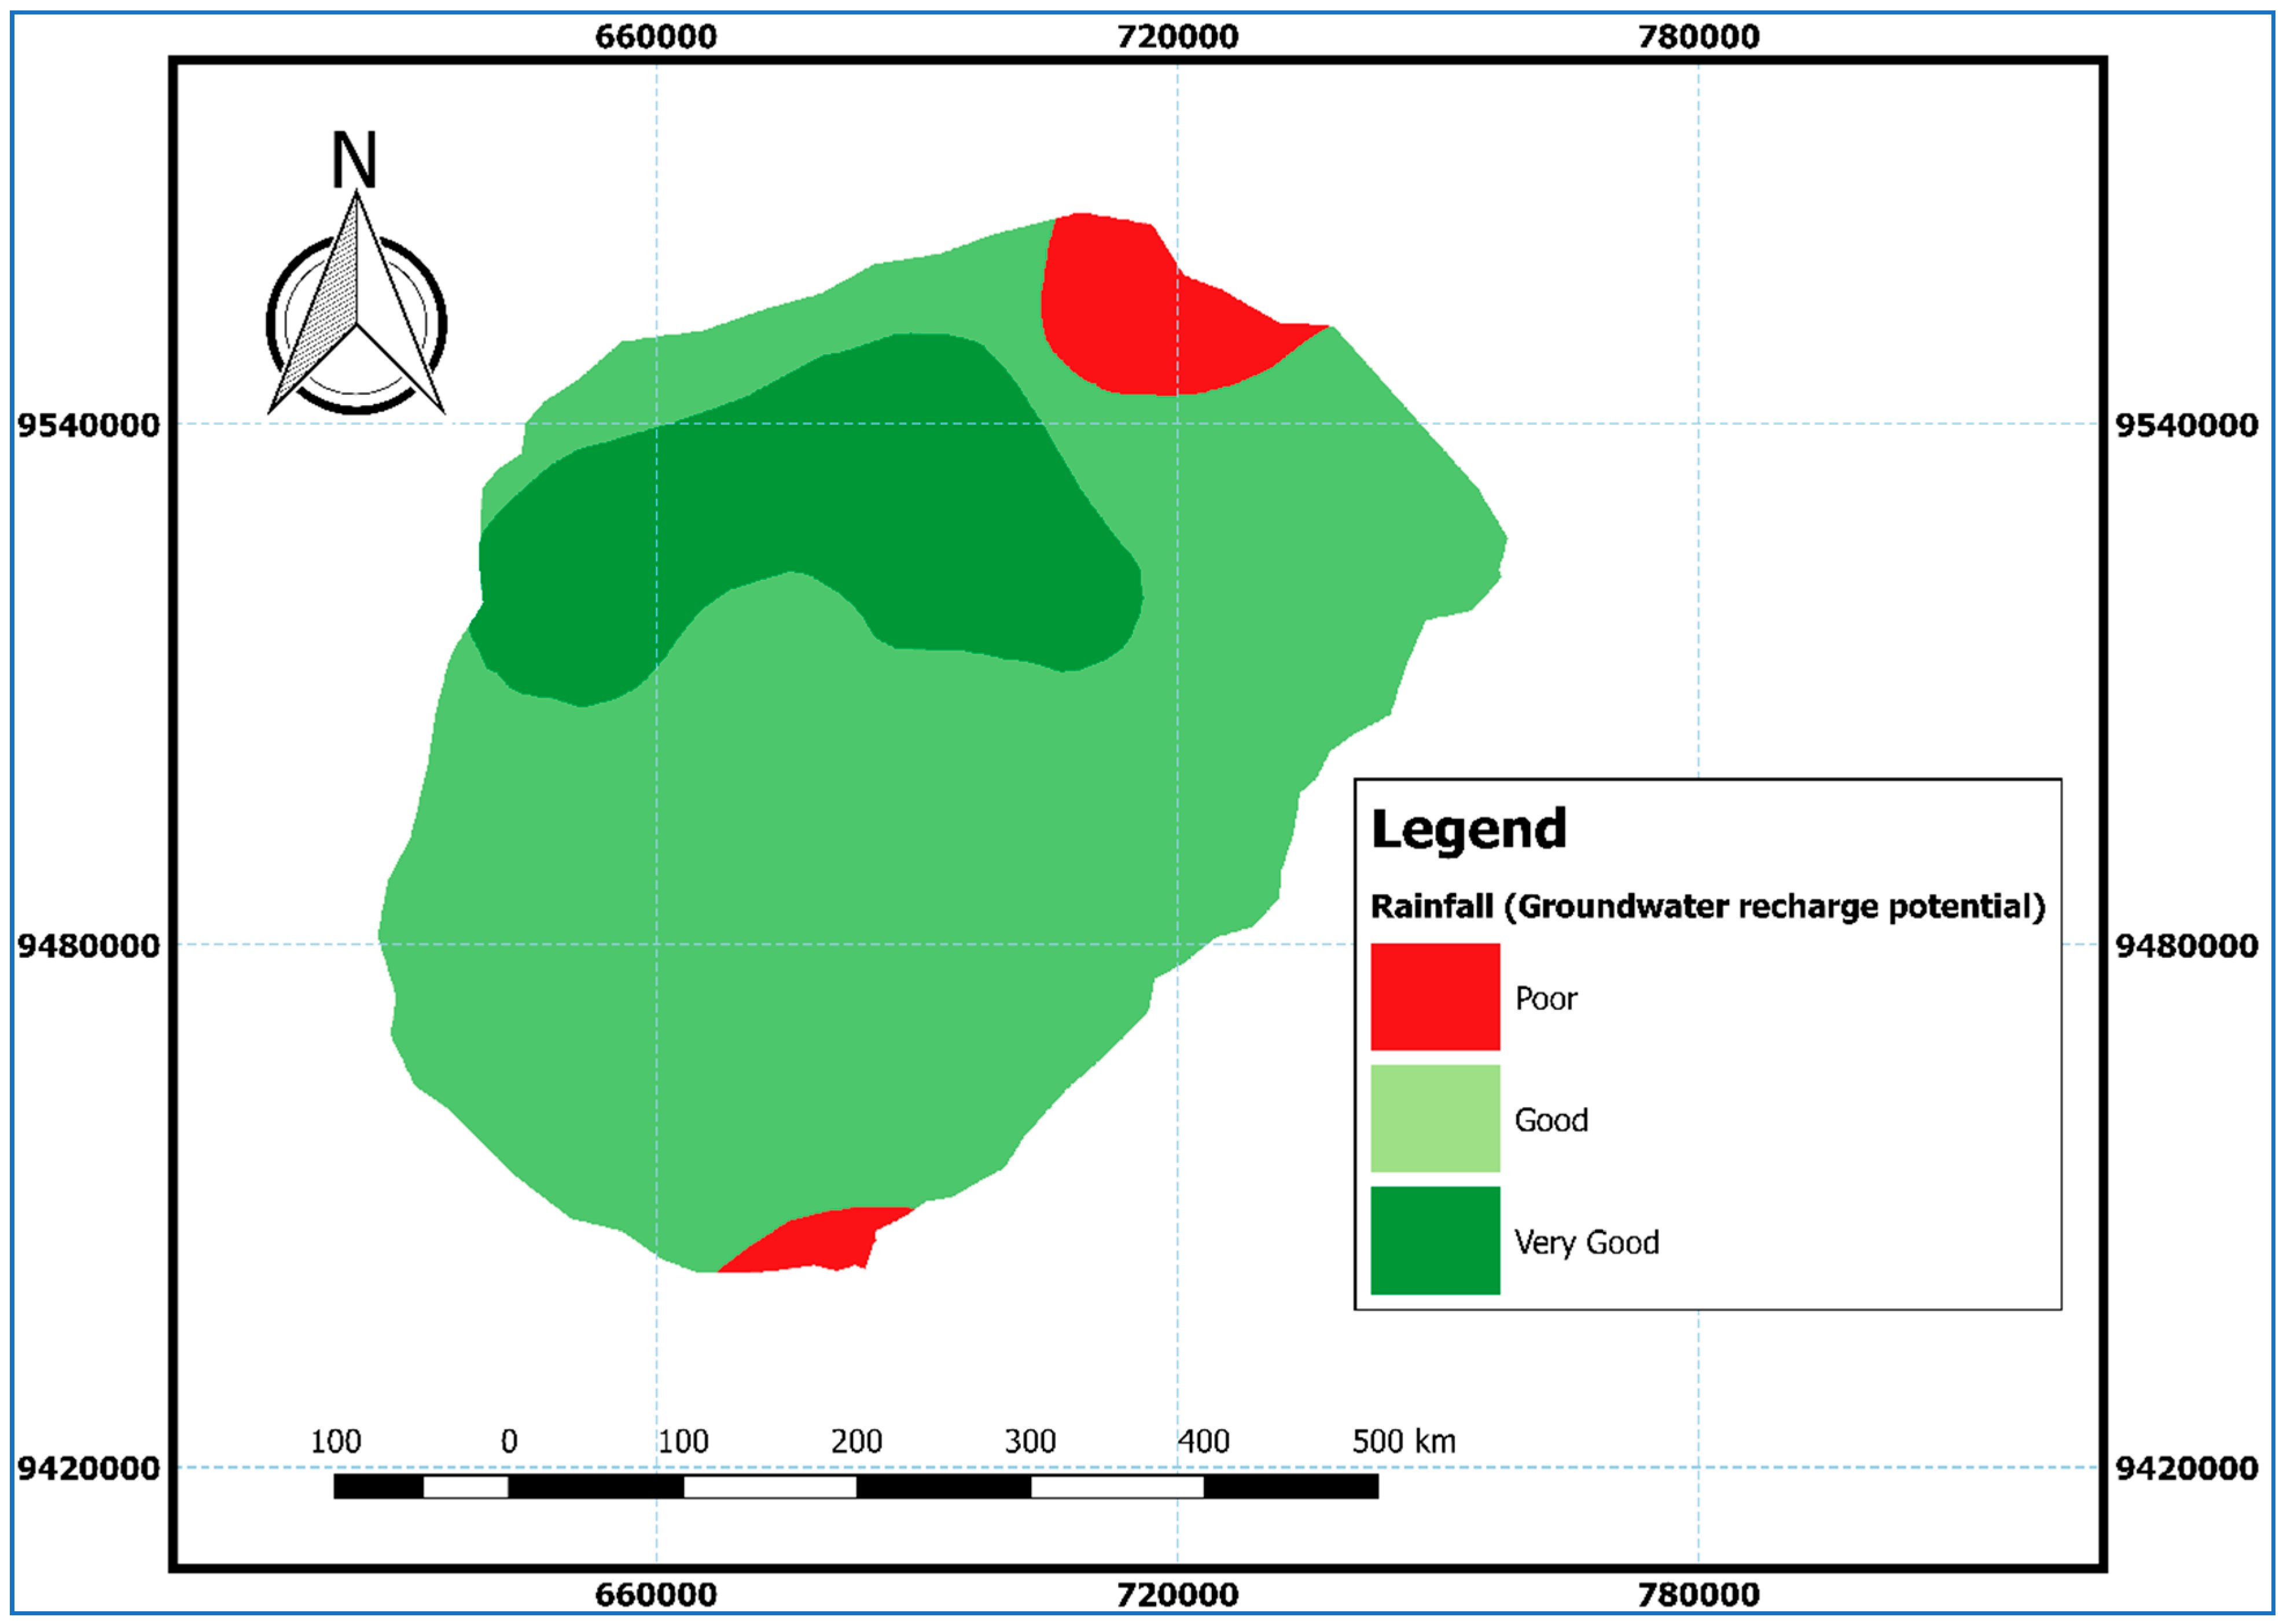
2.4.5. Rainfall Distribution
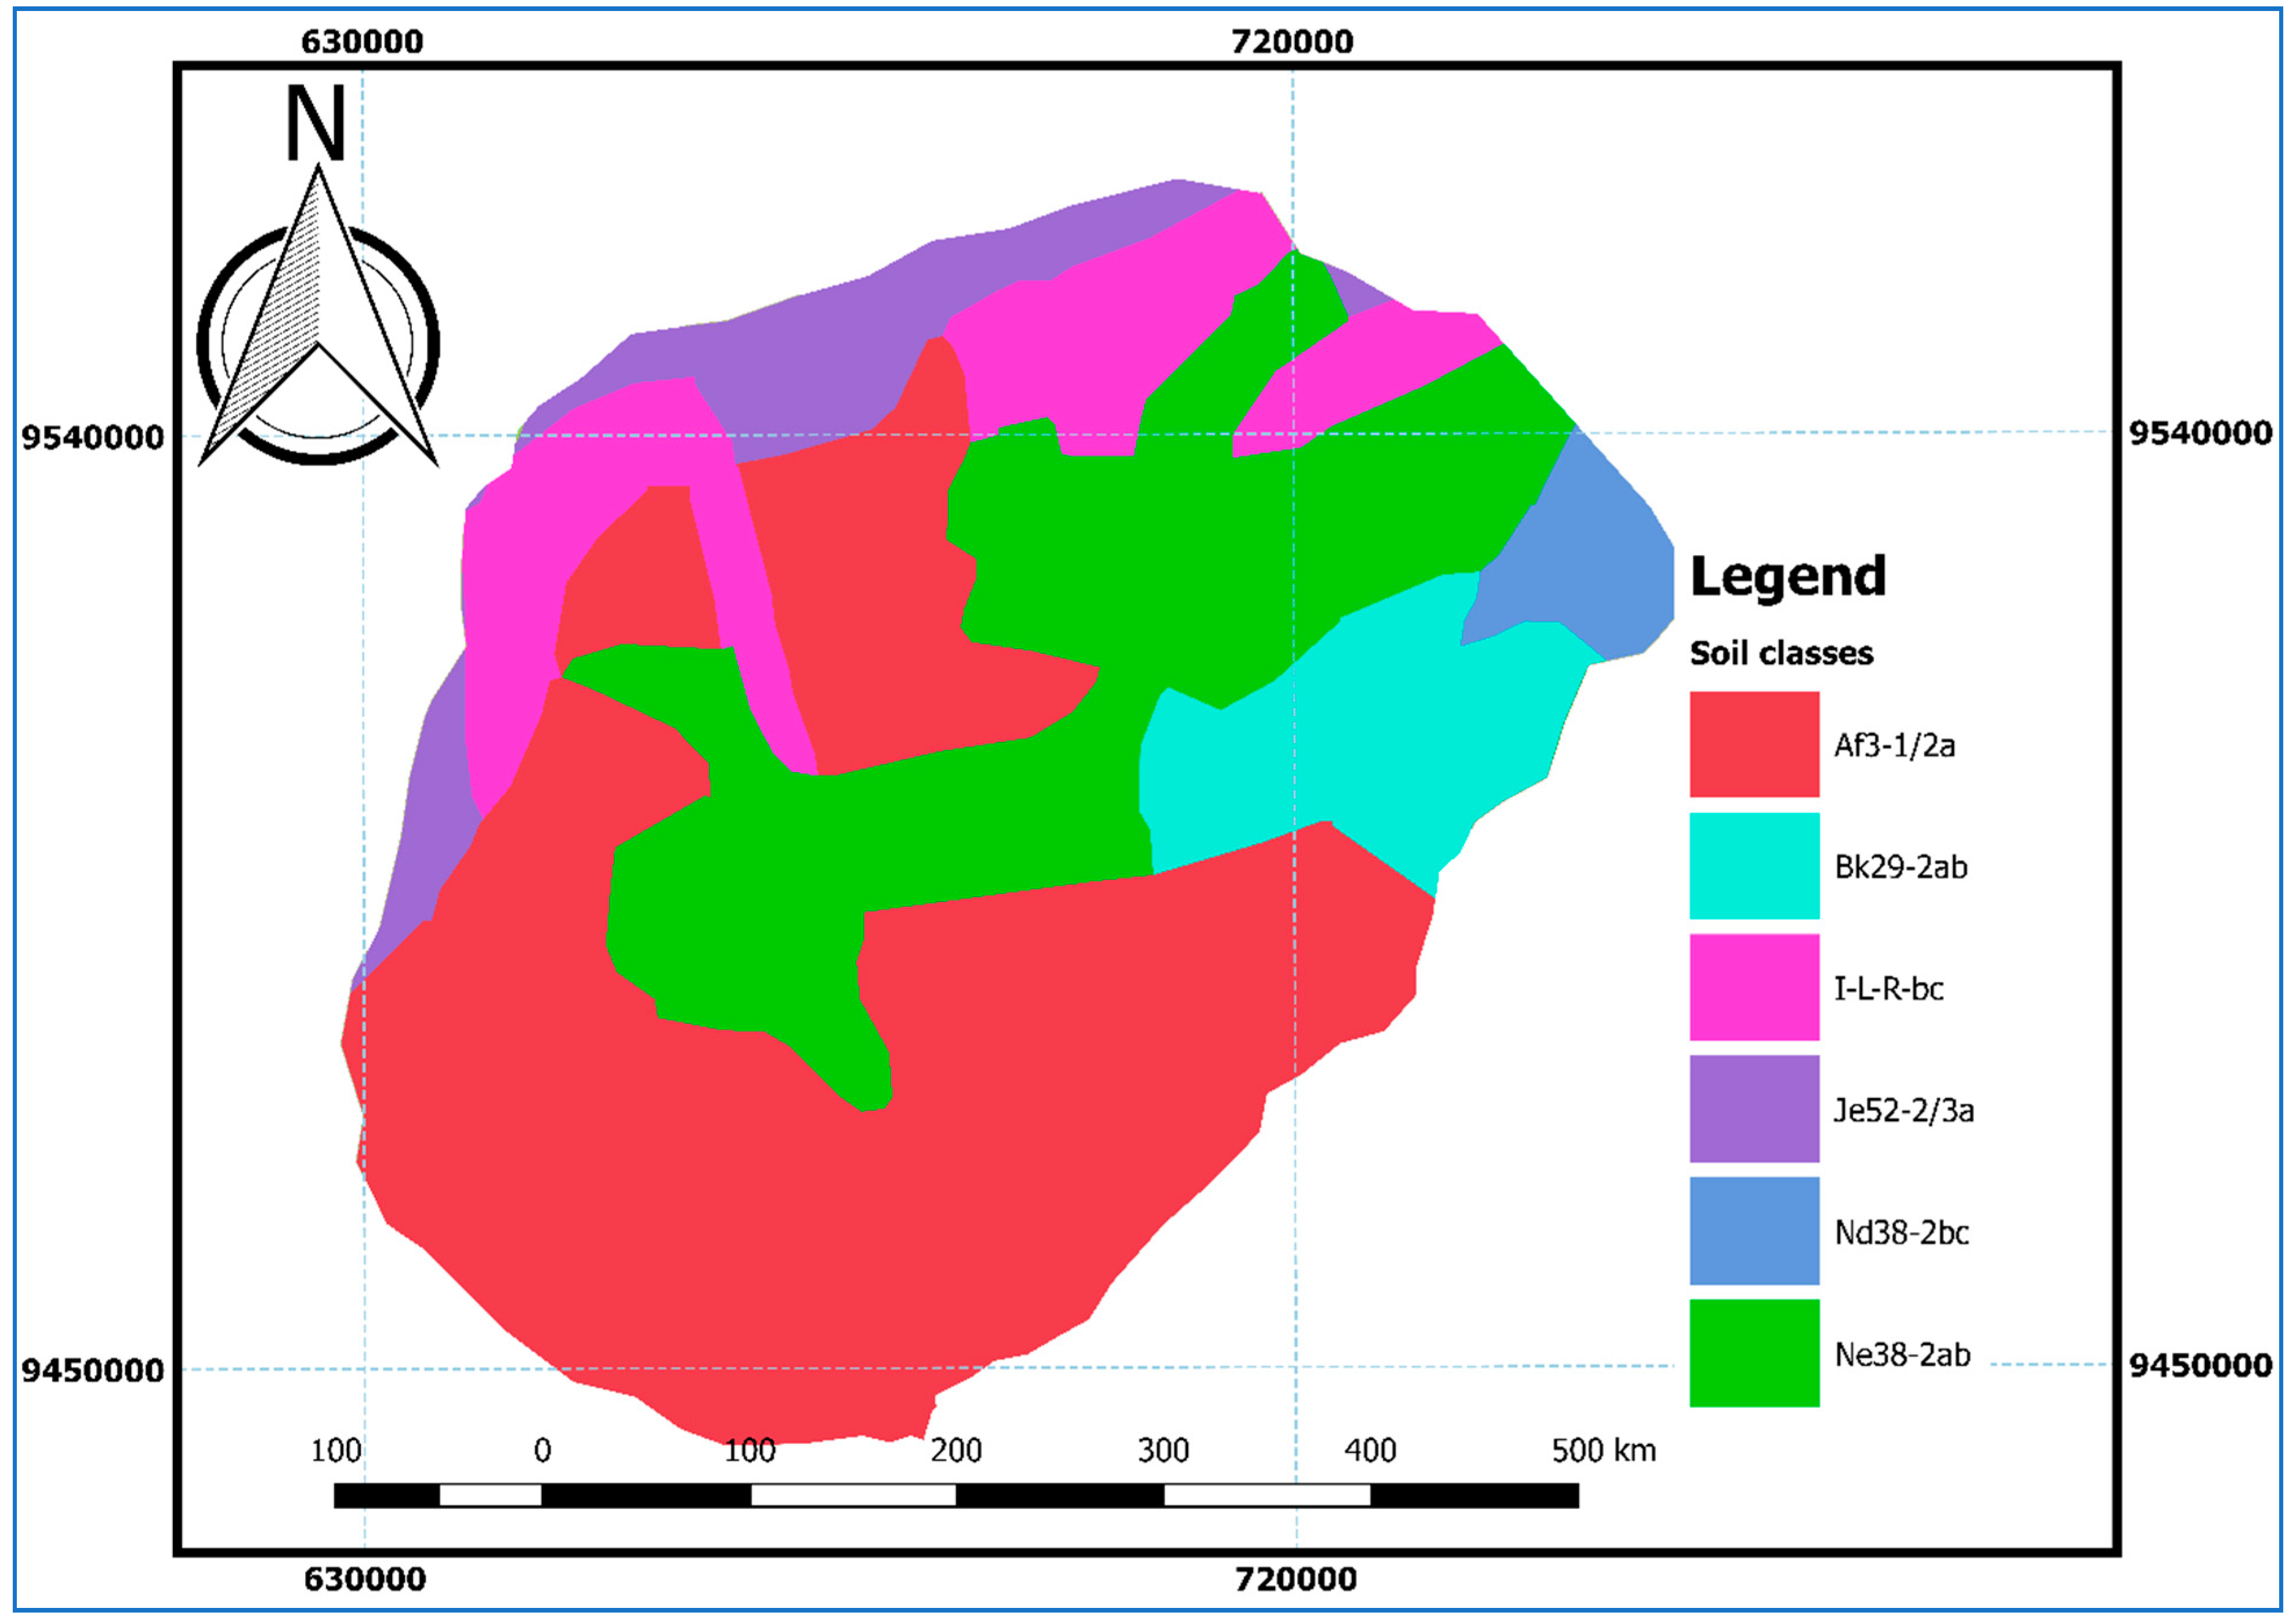
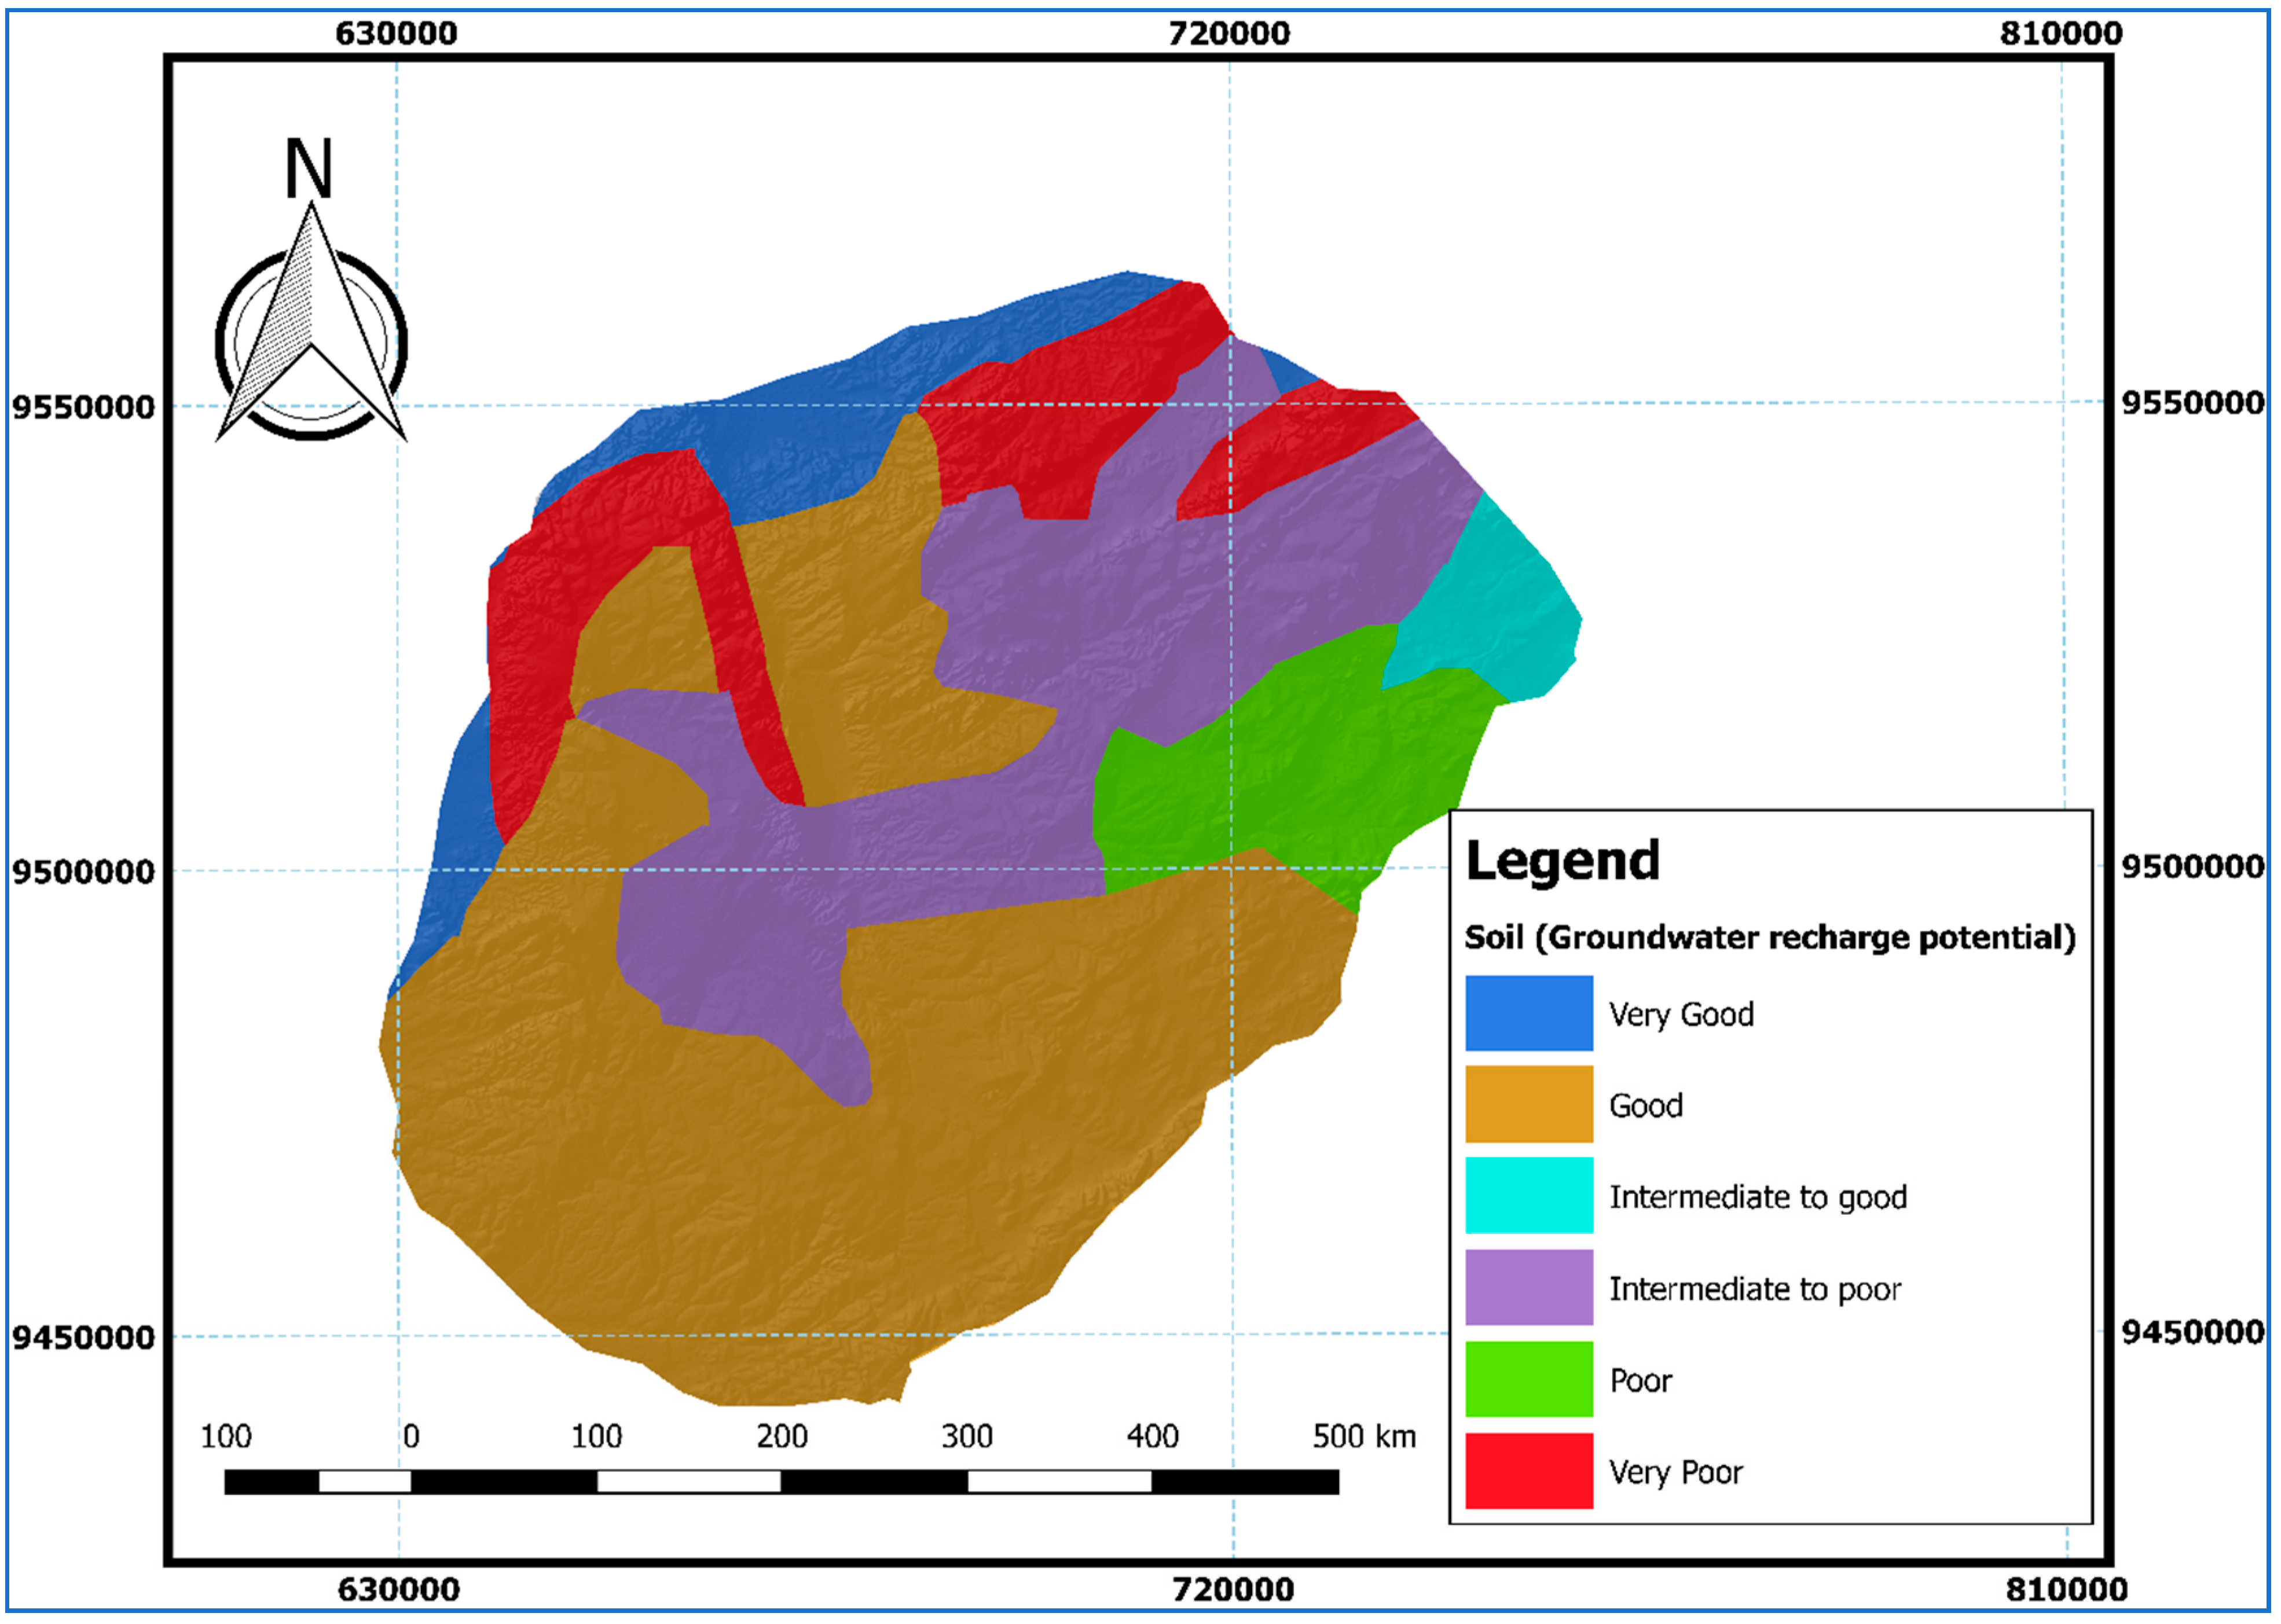
2.4.6. Soil
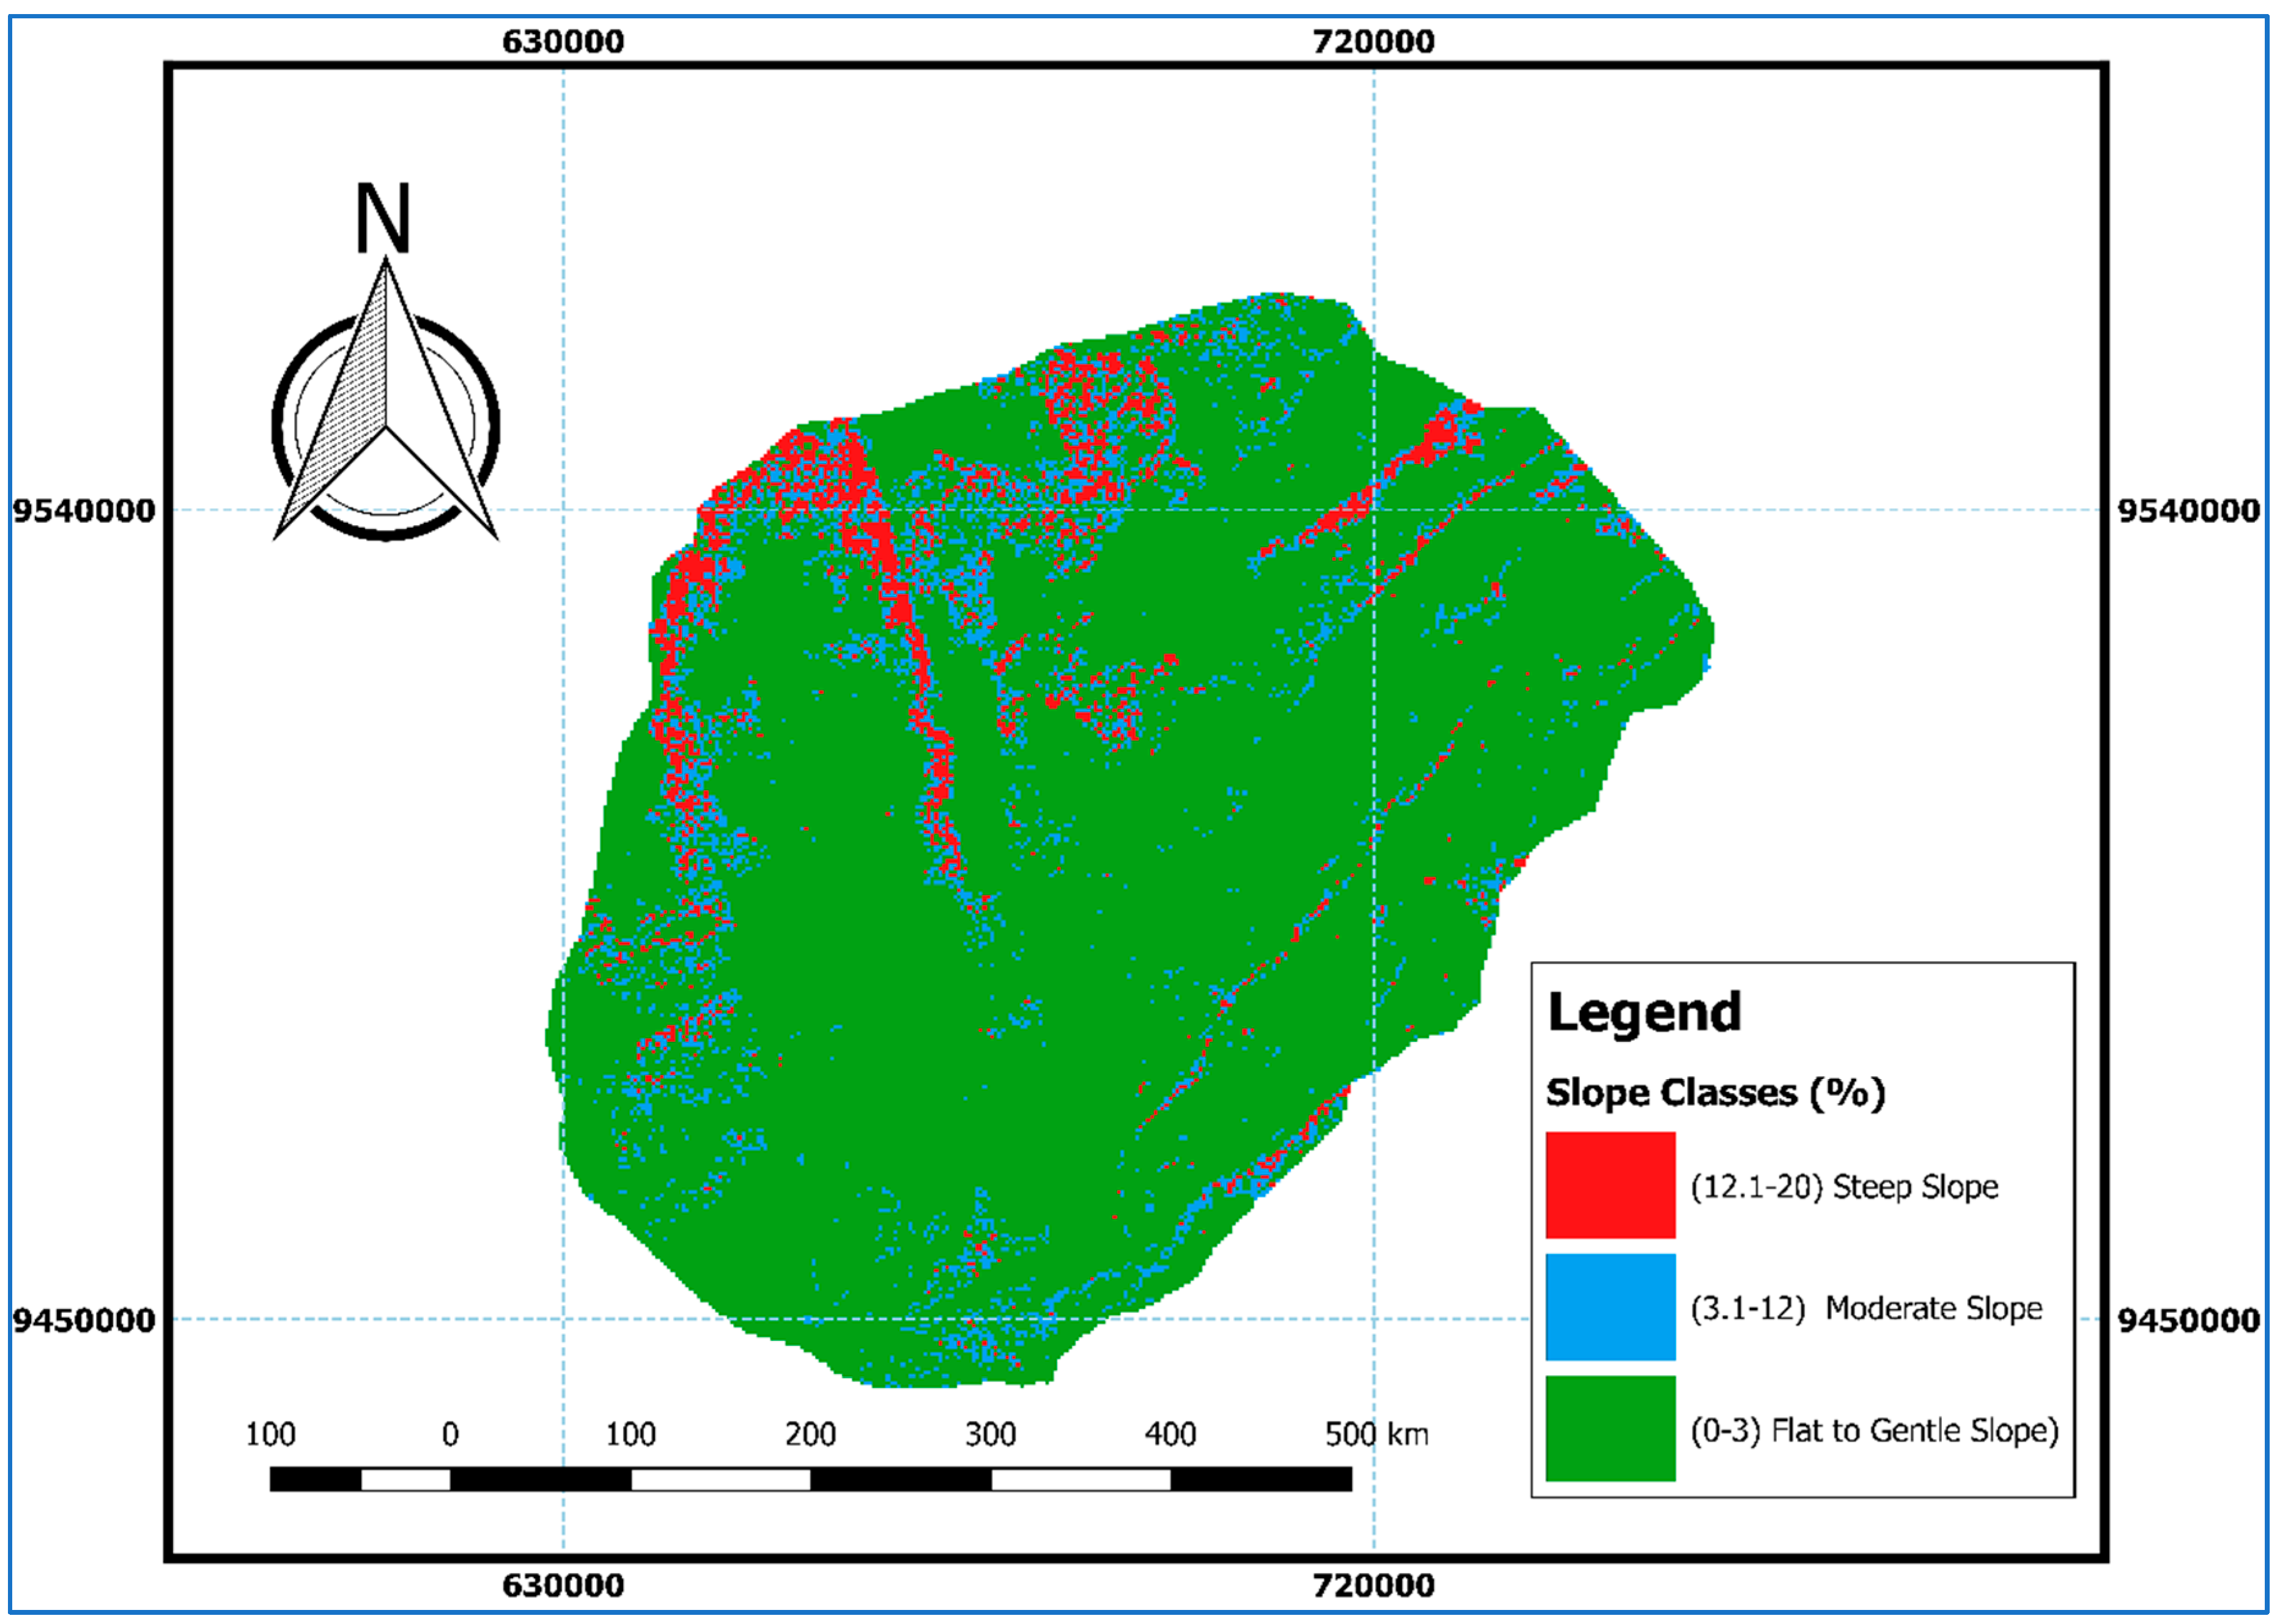
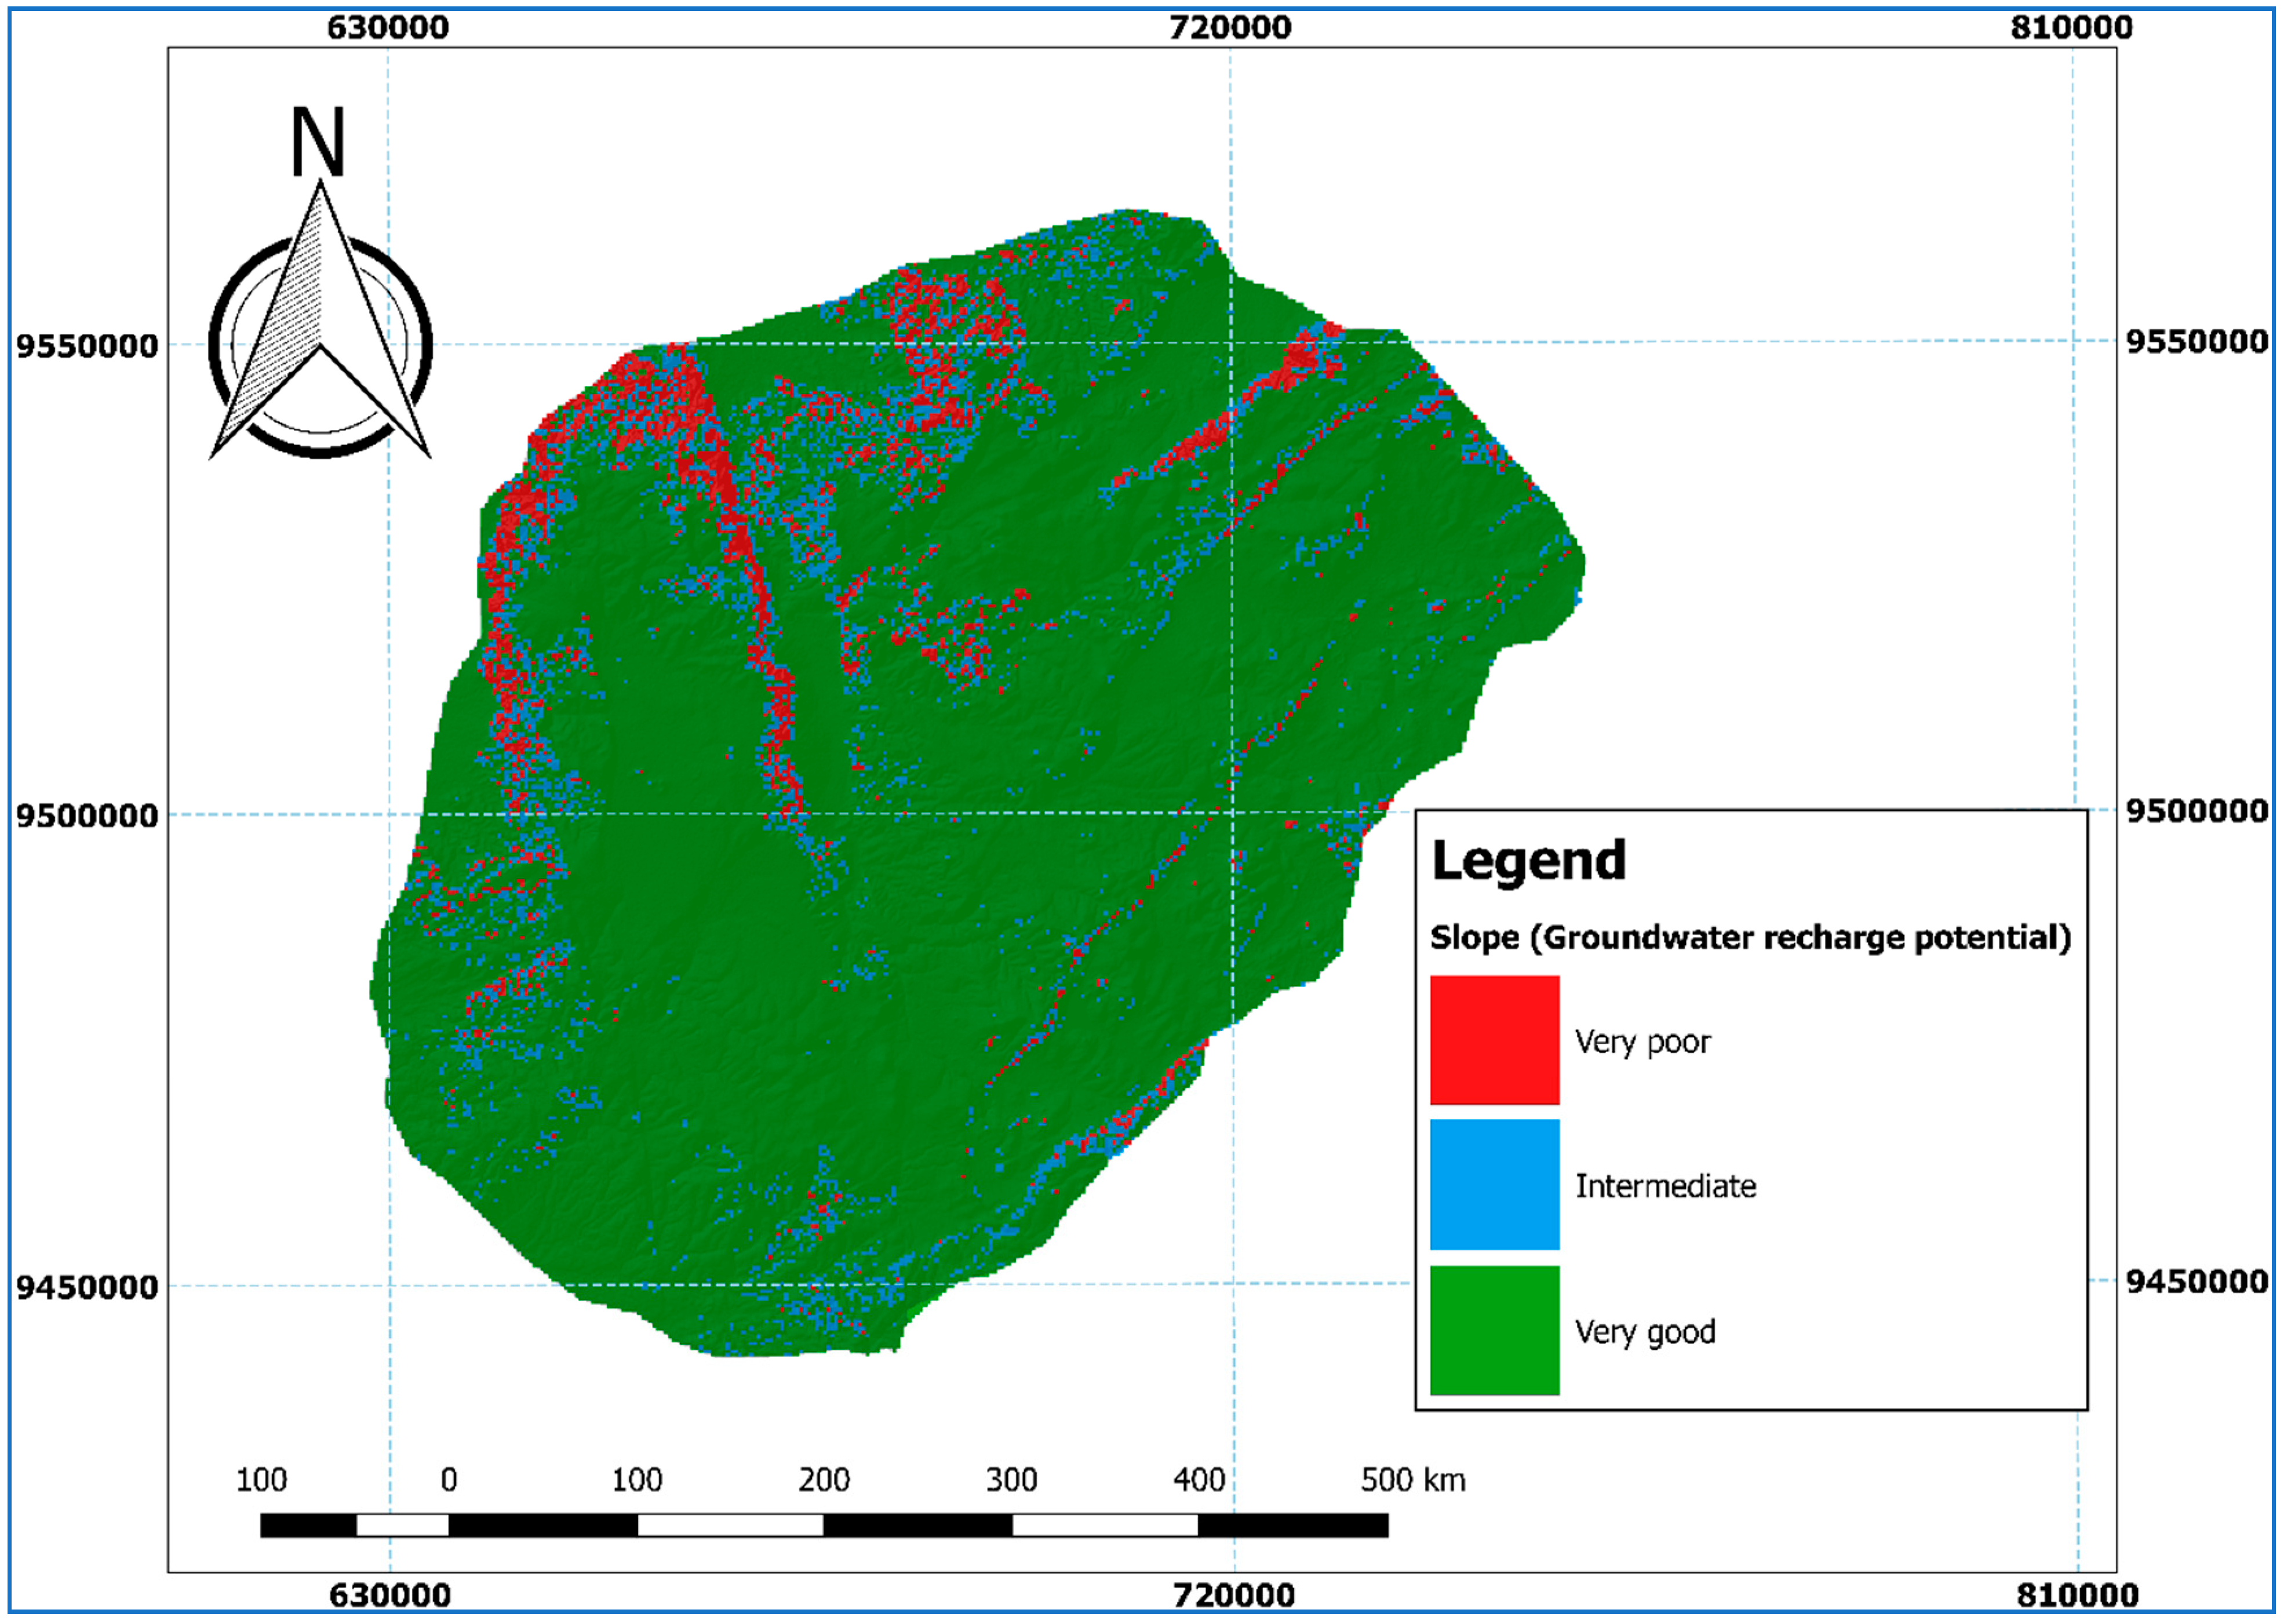
2.4.7. Slope
2.5. Determining the Factor Relations and Percentage Influence of the Thematic Layers
2.6. Rasterization, Resampling and Reclassification
2.7. Weighted Overlay Analysis
3. Results
- Groundwater recharge potential from each thematic factor and their respective classes
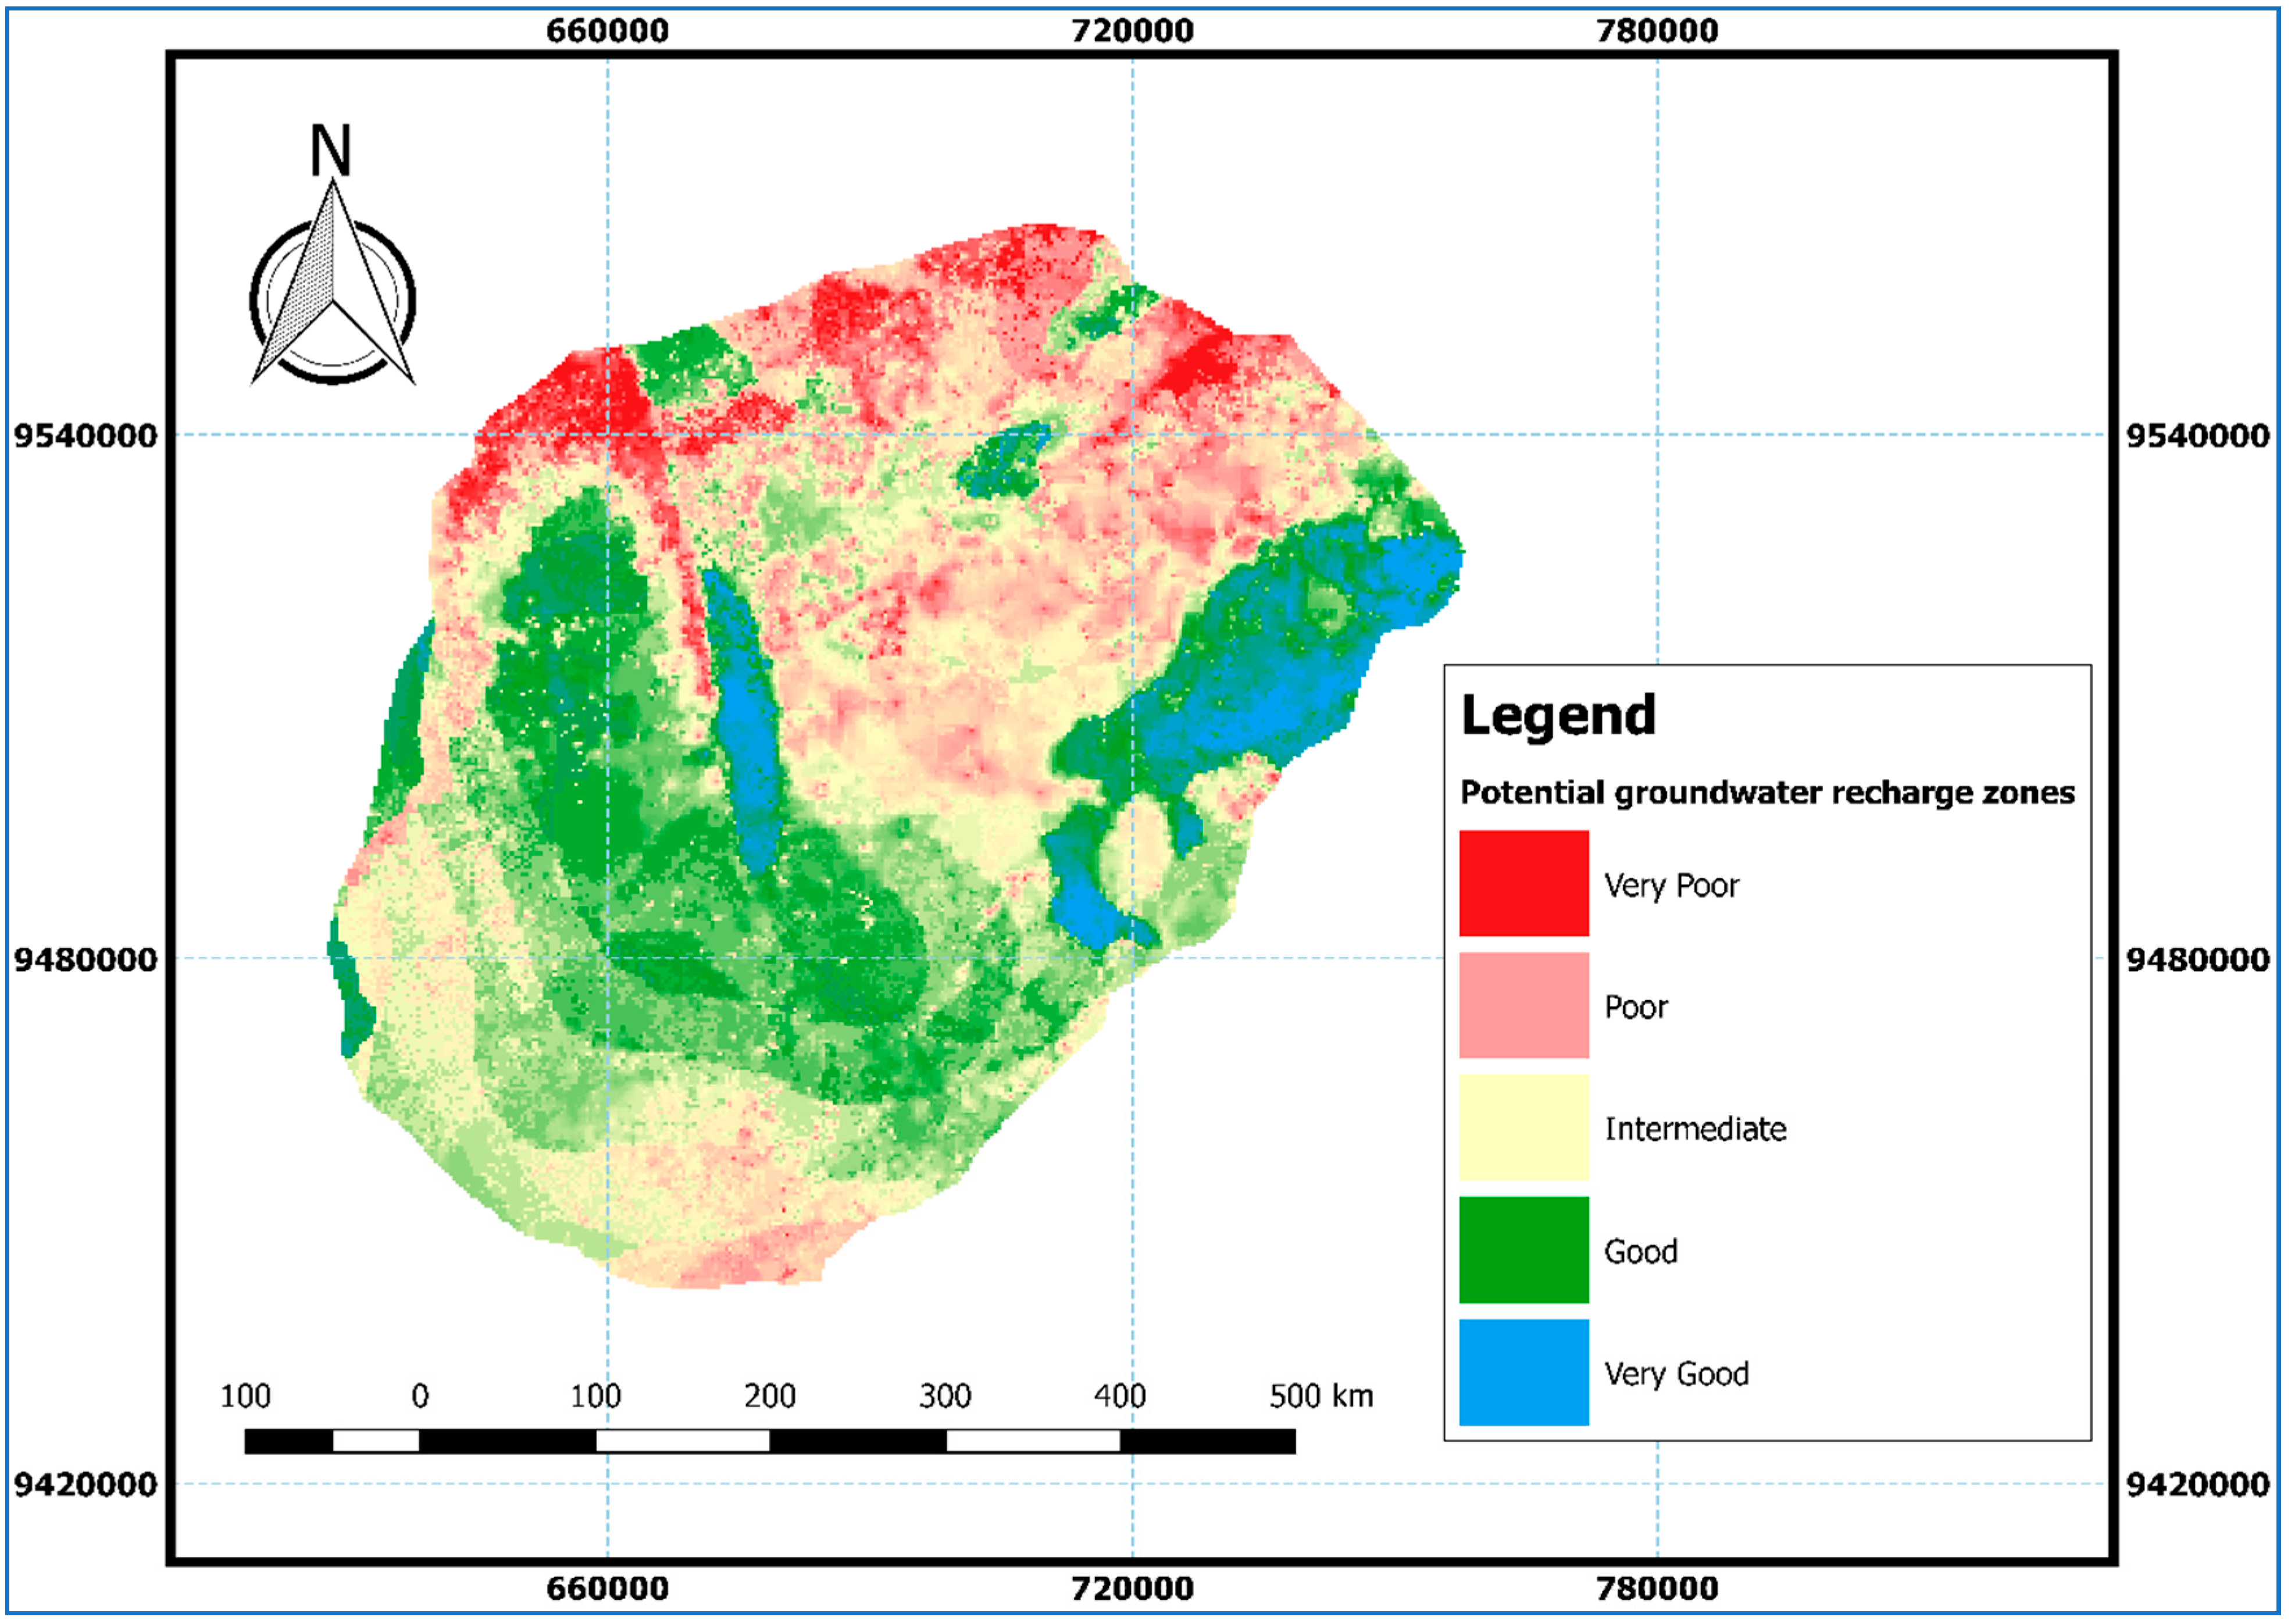
- Potential groundwater recharge zones
4. Discussion
5. Conclusions
Author Contributions
Funding
Acknowledgments
Conflicts of Interest
References
- Murthy, K.S.R. Ground water potential in a semi-arid region of Andhra Pradesh–A geographical information system approach. Int. J. Remote Sens. 2000, 21, 1867–1884. [Google Scholar] [CrossRef]
- Gleeson, T.; Befus, K.M.; Jasechko, S.; Luijendijk, E.; Cardenas, M.B. The global volume and distribution of modern groundwater. Nat. Geosci. 2015, 9, 161–167. [Google Scholar] [CrossRef]
- Hernández-Mora, N.; Llamas, R.; Cortina, L.M. Misconceptions in Aquifer Over-exploitation: Implications for Water Policy in Southern Europe. In Agricultural Use of Groundwater; Springer Science and Business Media LLC: Dordrecht, The Netherlands, 2001; Volume 17, pp. 107–126. [Google Scholar]
- Siebert, S.; Burke, J.; Faures, J.M.; Frenken, K.; Hoogeveen, J.; Döll, P.; Portmann, F.T. Groundwater use for irrigation—A global inventory. Hydrol. Earth Syst. Sci. 2010, 14, 1863–1880. [Google Scholar] [CrossRef] [Green Version]
- Konikow, L.F. Groundwater depletion in the United States (1900−2008). Sci. Investig. Rep. 2013, 63. [Google Scholar] [CrossRef] [Green Version]
- Dakhlalla, A.O.; Parajuli, P.B.; Ouyang, Y.; Schmitz, D.W. Evaluating the impacts of crop rotations on groundwater storage and recharge in an agricultural watershed. Agric. Water Manag. 2016, 163, 332–343. [Google Scholar] [CrossRef] [Green Version]
- Haitjema, H.; Mitchell-Bruker, S. Are Water Tables a Subdued Replica of the Topography? Ground Water 2005, 43, 781–786. [Google Scholar] [CrossRef]
- Gleeson, T.; Marklund, L.; Manning, A.H.; Smith, L. Classifying the water table at regional to continental scales. Geophys. Res. Lett. 2011, 38, 1–6. [Google Scholar] [CrossRef]
- Acharya, T.; Kumbhakar, S.; Prasad, R.; Mondal, S.; Biswas, A. Delineation of potential groundwater recharge zones in the coastal area of north-eastern India using geoinformatics. Sustain. Water Resour. Manag. 2017, 5, 533–540. [Google Scholar] [CrossRef]
- Palmer, P.C.; Gannett, M.; Hinkle, S.R. Isotopic characterization of three groundwater recharge sources and inferences for selected aquifers in the upper Klamath Basin of Oregon and California, USA. J. Hydrol. 2007, 336, 17–29. [Google Scholar] [CrossRef]
- Yusuf, M.; Abiye, T.; Butler, M.; Ibrahim, K. Origin and residence time of shallow groundwater resources in Lagos coastal basin, south-west Nigeria: An isotopic approach. Heliyon 2018, 4, e00932. [Google Scholar] [CrossRef] [Green Version]
- Bakari, S.S.; Aagaard, P.; Vogt, R.D.; Ruden, F.; Johansen, I.; Vuai, S.A. Delineation of groundwater provenance in a coastal aquifer using statistical and isotopic methods, Southeast Tanzania. Environ. Earth Sci. 2011, 66, 889–902. [Google Scholar] [CrossRef]
- Tiwari, A.; Rai, B. Hydromorphogeological Mapping for Groundwater Prospecting Using Landsat-MSS Images—A Case Study of Part of Dhanbad District, Bihar. J. Indian Soc. Remote Sens. 1996, 24, 281–285. [Google Scholar] [CrossRef]
- Srinivasan, P. Use of remote sensing techniques for detailed hydrogeological investigations in parts of Narmada Sagar command area, MP. J. Indian Soc. Remote Sens. 1988, 16, 55–62. [Google Scholar] [CrossRef]
- Saraf, A.K.; Choudhary, E.R. Integrated remote sensing and GIS for ground water exploration and identification of artificial recharge sites. Int. J. Remote Sens. 1998, 19, 1825–1841. [Google Scholar] [CrossRef]
- Rao, N.S.; Chakradhar, G.K.J.; Srinivas, V. Identification of Groundwater Potential Zones Using Remote Sensing Techniques in and Around Guntur Town, Andhra Pradesh, India. J. Indian Soc. Remote Sens. 2001, 29, 69–78. [Google Scholar] [CrossRef]
- Samson, S.; Elangovan, K. Delineation of Groundwater Recharge Potential Zones in Namakkal District, Tamilnadu, India Using Remote Sensing and GIS. J. Indian Soc. Remote Sens. 2015, 43, 769–778. [Google Scholar] [CrossRef]
- Selvam, S.; Dar, F.A.; Magesh, N.S.; Singaraja, C.; Venkatramanan, S.; Chung, S.Y. Application of remote sensing and GIS for delineating groundwater recharge potential zones of Kovilpatti Municipality, Tamil Nadu using IF technique. Earth Sci. Inform. 2015, 9, 137–150. [Google Scholar] [CrossRef]
- Raviraj, A.; Kuruppath, N.; Kannan, B. Identification of Potential Groundwater Recharge Zones Using Remote Sensing and Geographical Information System in Amaravathy Basin. J. Remote Sens. GIS 2017, 6, 1–10. [Google Scholar] [CrossRef]
- Das, S.; Pardeshi, S.D. Integration of different influencing factors in GIS to delineate groundwater potential areas using IF and FR techniques: A study of Pravara basin, Maharashtra, India. Appl. Water Sci. 2018, 8, 197. [Google Scholar] [CrossRef] [Green Version]
- Das, S.; Gupta, A.; Ghosh, S. Exploring groundwater potential zones using MIF technique in semi-arid region: A case study of Hingoli district, Maharashtra. Spat. Inf. Res. 2017, 25, 749–756. [Google Scholar] [CrossRef]
- Hamilton, W.B. Archean magmatism and deformation were not products of plate tectonics. Precambrian Res. 1998, 91, 143–179. [Google Scholar] [CrossRef]
- Stanley, S.M. Earth System History; W.H. Freeman and Company: New York, NY, USA, 1999; pp. 297–302. ISBN 0-7167-2882-6. [Google Scholar]
- Grotzinger, J.P.; Jordan, T.H. Understanding Earth, 6th ed.; W. H. Freeman: New York, NY, USA, 2010; ISBN 978-1429219518. [Google Scholar]
- Petit, C. Continental hearts: Ancient expanses called cratons pose a geological puzzle. Sci. News 2010, 178, 22–26. [Google Scholar] [CrossRef]
- Fenta, A.A.; Kifle, A.; Gebreyohannes, T.; Hailu, G. Spatial analysis of groundwater potential using remote sensing and GIS-based multi-criteria evaluation in Raya Valley, northern Ethiopia. Hydrogeol. J. 2014, 23, 195–206. [Google Scholar] [CrossRef]
- Jaiswal, R.K.; Mukherjee, S.; Krishnamurthy, J.; Saxena, R. Role of remote sensing and GIS techniques for generation of groundwater prospect zones towards rural development—An approach. Int. J. Remote Sens. 2003, 24, 993–1008. [Google Scholar] [CrossRef]
- Rao, Y.S.; Jugran, D.K. Delineation of groundwater potential zones and zones of groundwater quality suitable for domestic purposes using remote sensing and GIS. Hydrol. Sci. J. 2003, 48, 821–833. [Google Scholar] [CrossRef]
- Sener, E.; Davraz, A.; Ozcelik, M. An integration of GIS and remote sensing in groundwater investigations: A case study in Burdur, Turkey. Hydrogeol. J. 2004, 13, 826–834. [Google Scholar] [CrossRef]
- Chowdhury, A.; Jha, M.K.; Chowdary, V.M.; Mal, B.C. Integrated remote sensing and GIS-based approach for assessing groundwater potential in West Medinipur district, West Bengal, India. Int. J. Remote Sens. 2008, 30, 231–250. [Google Scholar] [CrossRef]
- Hammouri, N.; El-Naqa, A.; Barakat, M. An Integrated Approach to Groundwater Exploration Using Remote Sensing and Geographic Information System. J. Water Resour. Prot. 2012, 4, 717–724. [Google Scholar] [CrossRef] [Green Version]
- Fashae, O.; Tijani, M.; Talabi, A.O.; Adedeji, O.I. Delineation of groundwater potential zones in the crystalline basement terrain of SW-Nigeria: An integrated GIS and remote sensing approach. Appl. Water Sci. 2013, 4, 19–38. [Google Scholar] [CrossRef] [Green Version]
- Ramu, M.B.; Vinay, M. Identification of groundwater potential zones using GIS and Remote Sensing Techniques: A case study of Mysore Taluk–Karnataka. Int. J. Geomat. Geosci. 2014, 5, 393–403. [Google Scholar]
- Manikandan, J.; Kiruthika, A.M.; Sureshbabu, S. Evaluation of groundwater potential zones in Krishnagiri district, Tamil Nadu using MIF technique. Int. J. Innov. Res. Sci. 2014, 4, 70–88. [Google Scholar]
- Bagyaraj, M.; Ramkumar, T.; Venkatramanan, S.; Gurugnanam, B.; Senapathi, V. Application of remote sensing and GIS analysis for identifying groundwater potential zone in parts of Kodaikanal Taluk, South India. Front. Earth Sci. 2012, 7, 65–75. [Google Scholar] [CrossRef]
- Jenifer, M.A.; Jha, M.K. Comparison of Analytic Hierarchy Process, Catastrophe and Entropy techniques for evaluating groundwater prospect of hard-rock aquifer systems. J. Hydrol. 2017, 548, 605–624. [Google Scholar] [CrossRef]
- Thomas, R.; Duraisamy, V. Hydrogeological delineation of groundwater vulnerability to droughts in semi-arid areas of western Ahmednagar district. Egypt. J. Remote Sens. Space Sci. 2018, 21, 121–137. [Google Scholar] [CrossRef]
- Mehra, M.; Oinam, B.; Singh, C.K. Integrated Assessment of Groundwater for Agricultural Use in Mewat District of Haryana, India Using Geographical Information System (GIS). J. Indian Soc. Remote Sens. 2016, 44, 747–758. [Google Scholar] [CrossRef]
- Mehra, M.; Singh, C.K. Spatial analysis of soil resources in the Mewat district in the semiarid regions of Haryana, India. Environ. Dev. Sustain. 2016, 20, 661–680. [Google Scholar] [CrossRef]
- Singh, C.K.; Shashtri, S.; Singh, A.; Mukherjee, S. Quantitative modeling of groundwater in Satluj River basin of Rupnagar district of Punjab using remote sensing and geographic information system. Environ. Earth Sci. 2010, 62, 871–881. [Google Scholar] [CrossRef]
- Nag, S.K. Application of lineament density and hydrogeomorphology to delineate groundwater potential zones of Baghmundi block in Purulia District, West Bengal. J. Indian Soc. Remote Sens. 2005, 33, 521–529. [Google Scholar] [CrossRef]
- Dar, I.A.; Sankar, K.; Dar, M.A. Remote sensing technology and geographic information system modeling: An integrated approach towards the mapping of groundwater potential zones in Hardrock terrain, Mamundiyar basin. J. Hydrol. 2010, 394, 285–295. [Google Scholar] [CrossRef]
- Rajaveni, S.P.; Brindha, K.; Elango, L. Geological and geomorphological controls on groundwater occurrence in a hard rock region. Appl. Water Sci. 2015, 7, 1377–1389. [Google Scholar] [CrossRef] [Green Version]
- Machiwal, D.; Jha, M.K.; Mal, B.C. Assessment of Groundwater Potential in a Semi-Arid Region of India Using Remote Sensing, GIS and MCDM Techniques. Water Resour. Manag. 2010, 25, 1359–1386. [Google Scholar] [CrossRef]
- Solomon, S.; Quiel, F. Groundwater study using remote sensing and geographic information systems (GIS) in the central highlands of Eritrea. Hydrogeol. J. 2006, 14, 1029–1041. [Google Scholar] [CrossRef] [Green Version]
- Savita, R.; Mittal, H.; Satishkumar, U.; Singh, P.; Yadav, K.K.; Jain, H.; Mathur, S.; Davande, S. Delineation of Groundwater Potential Zones using Remote Sensing and GIS Techniques in Kanakanala Reservoir Subwatershed, Karnataka. Int. J. Curr. Microbiol. Appl. Sci. 2018, 7, 273–288. [Google Scholar] [CrossRef] [Green Version]
- Maurice, L.; Taylor, R.G.; Tindimugaya, C.; Macdonald, A.; Johnson, P.; Kaponda, A.; Owor, M.; Sanga, H.; Bonsor, H.C.; Darling, W.G.; et al. Characteristics of high-intensity groundwater abstractions from weathered crystalline bedrock aquifers in East Africa. Hydrogeol. J. 2018, 27, 459–474. [Google Scholar] [CrossRef] [Green Version]
- Hernandez-Marin, M.; Guerrero-Martínez, L.; Zermeño-Villalobos, A.; Rodríguez-González, L.; Burbey, T.J.; Pacheco-Martinez, J.; Martínez-Martínez, S.I.; González-Cervantes, N. Spatial and temporal variation of natural recharge in the semi-arid valley of Aguascalientes, Mexico. Hydrogeol. J. 2018, 26, 2811–2826. [Google Scholar] [CrossRef]


| Month | Precipitation (mm/month) | PET (mm/month) | Aridity Index (AI) | Aridity Status | Tmin (°C) | Tmax (°C) | Tmean (°C) |
|---|---|---|---|---|---|---|---|
| January | 142 | 119 | 1.2 | Humid | 17 | 28 | 21 |
| February | 116 | 111 | 1.0 | Humid | 17 | 28 | 21 |
| March | 123 | 118 | 1.0 | Humid | 17 | 27 | 21 |
| April | 79 | 110 | 0.7 | Humid/Sub-humid | 17 | 27 | 21 |
| May | 14 | 102 | 0.1 | Arid | 15 | 26 | 20 |
| June | 0 | 98 | 0.0 | Hyper-arid | 13 | 25 | 19 |
| July | 0 | 103 | 0.0 | Hyper-arid | 12 | 25 | 18 |
| August | 0 | 114 | 0.0 | Hyper-arid | 13 | 26 | 18 |
| September | 1 | 127 | 0.0 | Hyper-arid | 14 | 28 | 21 |
| October | 9 | 146 | 0.1 | Arid | 16 | 29 | 22 |
| November | 61 | 141 | 0.4 | Semi-arid | 17 | 29 | 22 |
| December | 150 | 130 | 1.2 | Humid | 17 | 29 | 22 |
| 695 | 1419 | 0.49 | SEMI-ARID | ||||
| Status | P/PET (Penman-Monteith Method) | P/PET (Thornthwaite Method) |
|---|---|---|
| Aridity Index | Aridity Index | |
| Hyper-Arid | <0.03 | <0.05 |
| Arid | 0.03–0.2 | 0.05–0.2 |
| Semi-Arid | 0.21–0.5 | 0.21–0.5 |
| Sub-humid | 0.51–0.75 | 0.51–0.65 |
| Humid | >0.75 | 0.75 |
| Thematic Layer | Major Influence (Imajor) | Minor Influence (Iminor) | Factor Score (FS) = (Imajor + Iminor) | Factor Influence (FI) |
|---|---|---|---|---|
| Lineament density | Hydrogeology, soil, drainage density, land use/cover, slope | 5.0 | 21 | |
| Hydrogeology/Lithology | Drainage, soil, lineaments, | Slope, drainage density | 4.0 | 17 |
| Lan use/cover | Drainage density, Soil, hydrogeology | Lineament density, | 3.5 | 15 |
| Soil | Drainage density, land use/cover, hydrogeology, | Lineament density | 3.5 | 15 |
| Rainfall | Drainage density, land use/cover, hydrogeology | 3.0 | 13 | |
| Slope | Drainage density, hydrogeology | 2.5 | 11 | |
| Drainage density | Land use/cover, hydrogeology | 2.0 | 8 | |
| = 23.5 | 100 | |||
| Factor Parameter | Class | Class Rank (Equation (3) and Equation (4)) | Reclassified Ranks (Scale 1–5) | Factor Weightage (%) |
|---|---|---|---|---|
| Lineament density | 8.1–10.0 | 21 | 5 | 21 |
| 5.1–8.0 | 16 | 4 | ||
| 2.1–5.0 | 11 | 3 | ||
| 0.6–2.0 | 6 | 1 | ||
| Hydrogeology | Tertiary quaternary unconsolidated | 17 | 5 | 17 |
| Tertiary quaternary volcanic aquifer | 13 | 4 | ||
| Kimberlites | 9 | 3 | ||
| Precambrian Craton | 5 | 1 | ||
| Land cover | Grassland | 15 | 5 | 15 |
| Cultivated land | 12.5 | 4 | ||
| Water body | 10 | 3 | ||
| Forest | 7.5 | 3 | ||
| Bare land | 5.0 | 2 | ||
| Built-up area | 2.5 | 1 | ||
| Soil | Je52-2/3a (Eutric Fluvisols) | 15 | 5 | 15 |
| Af3-1/2a (Ferric Acrisols) | 12.5 | 4 | ||
| Nd38-2bc (Dystric Nitosols) | 10 | 3 | ||
| Ne38-2ab (Eutric Nitosols) | 7.5 | 3 | ||
| Bk29-2ab (Calcic Cambisols) | 5.0 | 2 | ||
| I-L-R-bc (Lithosols) | 2.5 | 1 | ||
| Rainfall | 800 mm | 13 | 5 | 13 |
| 700 mm | 9 | 4 | ||
| 600 mm | 5 | 2 | ||
| Slope | 0–3.0 | 11 | 5 | 11 |
| 3.1–12.0 | 7 | 3 | ||
| 12.1–20 | 3 | 1 | ||
| Drainage density | 0–0.80 | 8 | 5 | 8 |
| 0.81–1.2 | 6.4 | 4 | ||
| 1.21–1.5 | 4.8 | 3 | ||
| 1.51–1.8 | 3.2 | 2 | ||
| 1.81–2.0 | 1.6 | 1 |
© 2020 by the authors. Licensee MDPI, Basel, Switzerland. This article is an open access article distributed under the terms and conditions of the Creative Commons Attribution (CC BY) license (http://creativecommons.org/licenses/by/4.0/).
Share and Cite
Mussa, K.R.; Mjemah, I.C.; Machunda, R.L. Open-Source Software Application for Hydrogeological Delineation of Potential Groundwater Recharge Zones in the Singida Semi-Arid, Fractured Aquifer, Central Tanzania. Hydrology 2020, 7, 28. https://0-doi-org.brum.beds.ac.uk/10.3390/hydrology7020028
Mussa KR, Mjemah IC, Machunda RL. Open-Source Software Application for Hydrogeological Delineation of Potential Groundwater Recharge Zones in the Singida Semi-Arid, Fractured Aquifer, Central Tanzania. Hydrology. 2020; 7(2):28. https://0-doi-org.brum.beds.ac.uk/10.3390/hydrology7020028
Chicago/Turabian StyleMussa, Kassim Ramadhani, Ibrahimu Chikira Mjemah, and Revocatus Lazaro Machunda. 2020. "Open-Source Software Application for Hydrogeological Delineation of Potential Groundwater Recharge Zones in the Singida Semi-Arid, Fractured Aquifer, Central Tanzania" Hydrology 7, no. 2: 28. https://0-doi-org.brum.beds.ac.uk/10.3390/hydrology7020028