
Flood Mapping from Dam Break Due to Peak Inflow: A Coupled Rainfall–Runoff and Hydraulic Models Approach


1
Graduate School of Water Resources, Sungkyunkwan University, 2066 Seobu-ro, Jangan-gu, Suwon 440-746, Korea
2
K-water Research Institute, Korea Water Resources Corporation (K-water), 1689 beon-gil 125, Yuseong-daero, Yuseong-gu, Daejeon 34045, Korea
*
Author to whom correspondence should be addressed.
Hydrology 2021, 8(2), 89; https://0-doi-org.brum.beds.ac.uk/10.3390/hydrology8020089
Submission received: 28 April 2021
/
Revised: 29 May 2021
/
Accepted: 31 May 2021
/
Published: 6 June 2021
(This article belongs to the Special Issue Flood Early Warning and Risk Modelling)
Abstract
:In this study, we conducted flood mapping of a hypothetical dam break by coupling the Hydrologic Engineering Center’s Hydrologic Modeling System (HEC-HMS) and River Analysis System (HEC-RAS) models under different return periods of flood inflow. This study is presented as a case study on the Kesem embankment dam in Ethiopia. Hourly hydrological and meteorological data and high-resolution land surface datasets were used to simulate the design floods for piping dam failure with empirical dam breach methods. Based on the extreme inflows and the dam physical characteristics, the dam failure was simulated by a two-dimensional, unsteady flow hydrodynamic model. As a result, the dam will remain safe for up to 50-year return-period inflows, but it breaks for 100- and 200-year return periods and floods the downstream area. For the 100-year peak inflow, a 208 km2 area will be inundated by a maximum depth of 20 m and for a maximum duration of 46 h. The 200-year inflow will inundate a 240 km2 area with a maximum depth of 31 m for a maximum duration of 93 h. The 2D flood map provides satisfactory spatial and temporal resolution of the inundated area for evaluation of the affected facilities.
1. Introduction
Dam failures have recently had a large disastrous effect on downstream areas in many countries. Between 2000 and 2009, more than 200 notable dam failures occurred worldwide [1,2], such as Oroville, USA, in 2017 (dam failure) [3]; Brumadinho, Brazil, in 2019 (dam break) [4]; Xepian Xe Nam Noy Dam, Laos, in 2018 (dam break) [5]; and Hidroituango, Colombia, in 2018 (dam failure) [6]. In the east Africa region, water burst through the banks of the Patel Dam in Kenya’s Rift Valley, washing away almost an entire village [7]. Public concern has resulted in an increasing focus on dam safety and has imposed responsibility on decision makers. Dam-break-induced disasters may occur more frequently due to infrastructure ageing. Emergency planning, as a non-structural measure to minimize flood impacts, plays an important role in crisis management. One of the keys to preventing and reducing losses from flood disasters is obtaining reliable information about the flood risk through flood inundation maps [8]. If a disaster cannot be avoided, individual and social structure preparedness may help in risk reduction [9]. As the cost of hazard assessment is negligible compared with the total cost of disasters, every dam should have been analyzed for safety with an emergency plan in place [10].
Numerical flood simulation models are useful tools for quantitatively evaluating flooding, which enable researchers to qualitatively evaluate hazard and other risks caused by flooding; however, these models have limitations related to insufficient datasets [11]. Recently, due to advances in hydraulic models, research on the application of 2D models for flood risk management, including dam breaks [12,13], has been increasing. Despite the rapid development of the risk analysis of dam breaks, research is relatively lacking on integrating the impact of peak inflows, which causes dam breaks. Heavy rainfall and peak flood inflows have the potential to trigger dam failures. As a result, determining their impacts on dam failure and the associated disaster is instrumental in understanding complicated dam break problems. Moreover, the flood risk analysis, the inundation extent, and the environmental impact of dam breaks are also affected by peak flood inflows.
In this study, the Hydrologic Engineering Center’s Hydrological Modeling System (HEC-HMS), which can simulate a wide range of hydro-meteorological and physical processes including flooding, and the Hydrologic Engineering Center’s River Analysis System (HEC-RAS) 2D model were used to evaluate the impact of peak inflows on dam break and flood inundation. HEC-GeoHMS is typically used to import all the required inputs into HEC-HMS [14]. The watershed is physically represented with the HEC-HMS semi-distributed basin model [15]. Various hydrologic elements are connected in a dendritic network to simulate runoff processes [16,17]. In this study, the inflow hydrographs for different return periods were generated with hourly precipitation and streamflow data using the curve number method. RAS Mapper, an extension of HEC-RAS, has a set of procedures, tools, and utilities to explicitly display the results [18]. HEC-RAS 2D has a GIS interface and applies the finite method to solve unsteady flow equations that describe the two dimensions of the river and floodplain [19,20]. A detailed animation showing flood wave progression in multiple directions on a local scale is best-represented using a 2D model.
The novel objective of this study was to develop a flood inundation map by integrating hydrological and hydraulic models for a hypothetical dam break. The peak inflow for various return periods was used to initiate the dam break. The inputs derived from the physical condition, material properties, dimensions of the dam, and maximum bounding breach width and height were used in the empirical breach method. A stepwise approach was implemented to execute the model. The first step was developing a physically based hydrological model to simulate the designed rainfall for flood discharges with HEC-HMS after calibrating and validating using historical storm events. The output of this step was used to predict flood volume, peak rates, and the runoff hydrograph. The next step was to develop a hydraulic model of the watershed for a piping dam break with an HEC-RAS model. The last step was to simulate the flood hydrograph and analyze the inundation map of the return periods using the 2D flood map.
This study is presented as a case study of the Kesem embankment dam. The aim was to understand the interaction of hydro-meteorological, topographic, and physical dam settings to determine dam-break-associated flooding. The Afar region, located in the East African Rift System, has been affected by progressive stages in the development of the largest active rift in the world [21]. Given its volcanically and seismically active setting, the Kesem dam is subjected to high seismicity due to regular strain release occurrences [22]. Previously, dam breach simulation and analysis of the Kesem dam were conducted by combining the physical breaching model HR BREACH, a simple geotechnical failure model, to simulate any breaches in the embankments, with HEC-RAS 1-D, to perform the flood routing [23]. In our method, peak inflows drive the dam break in the piping dam failure method, demonstrating the inundation area on a 2D flood map.
Study Area
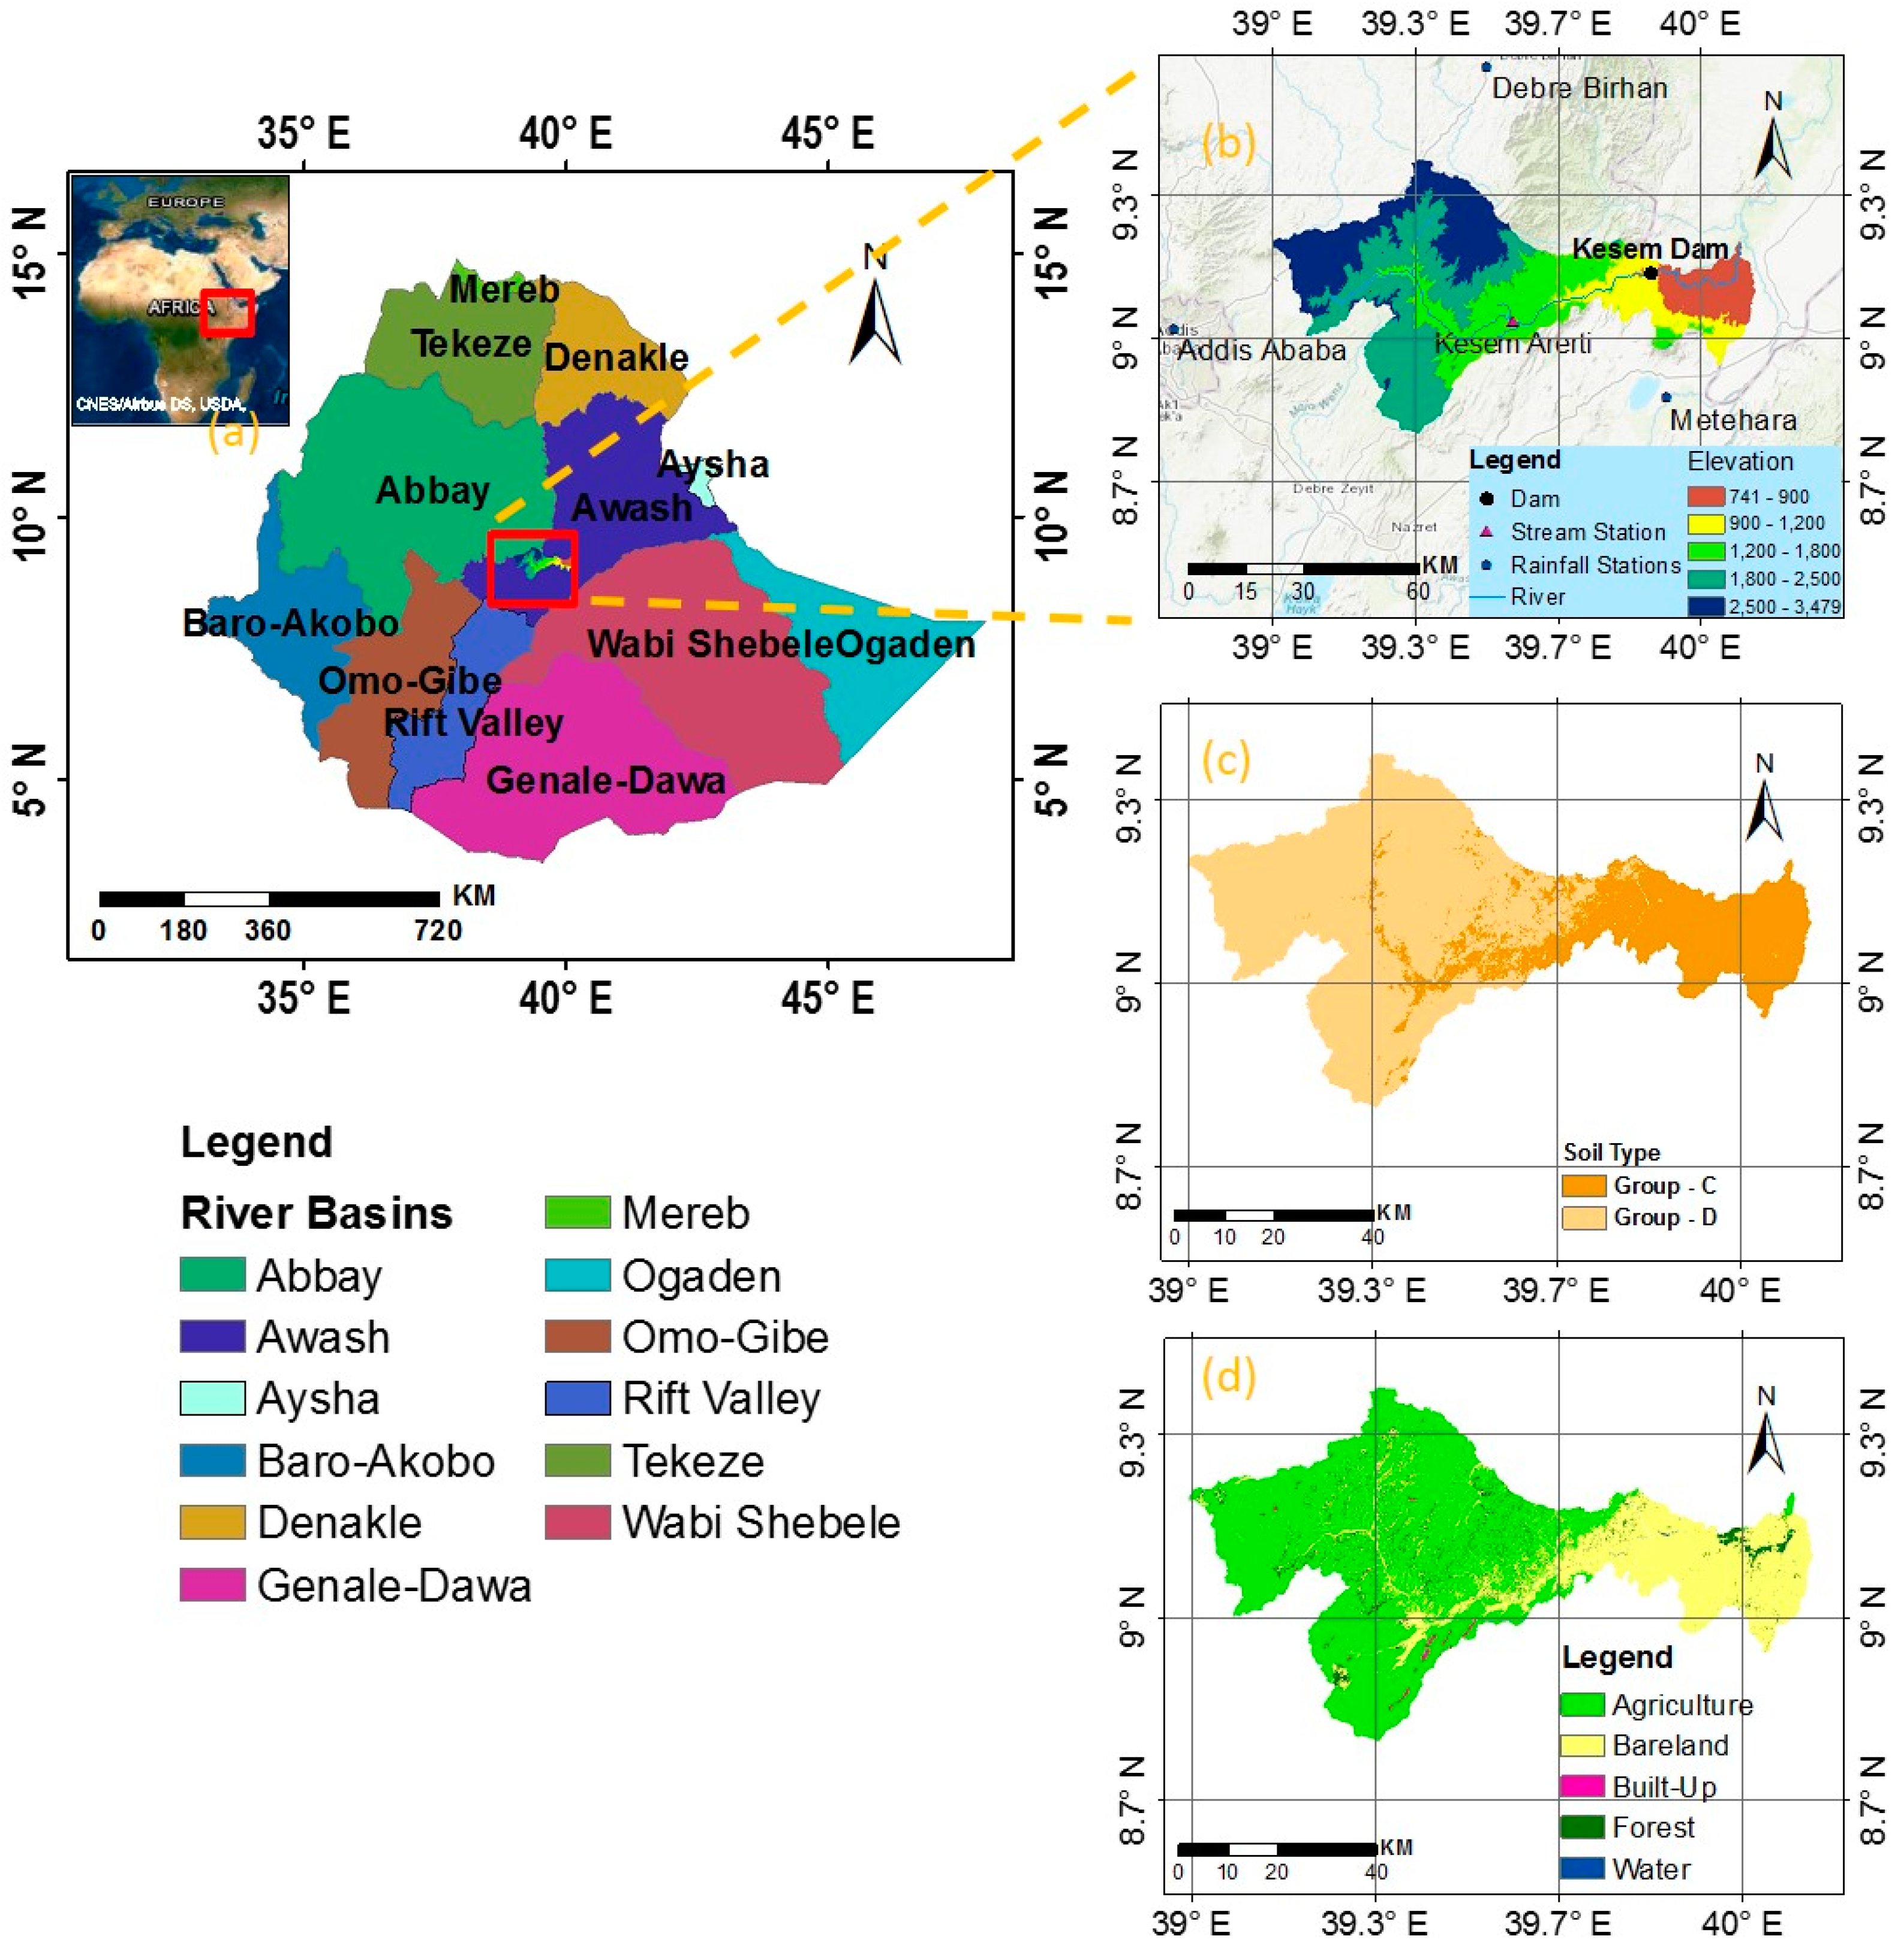
Kesem River is a tributary to the Awash River Basin, which is the most-used among the twelve basins in Ethiopia (Figure 1a). Annual rainfall is received in the four rainy months of June, July, August, and September, and most of the river courses become full and flood their surroundings during these months [11]. The Kesem dam was built in 2015 by the then Ethiopian Water Work Construction Enterprise (WWCE), mainly for sugarcane irrigation, with the capacity for developing 20,000 ha of land. The dam is a rockfill dam, categorized as a large dam, possessing an embankment volume of 3.15 hm3 and a crest length of 685 m. The capacity of the reservoir is estimated at 770 hm3, of which 360–480 hm3 (47–62%) is assumed to be live storage, and the spillway capacity is about 6180 m3/s. The dam is located 237 km to the northeast of Addis Ababa at 800 m above sea level.
2. Materials and Methods
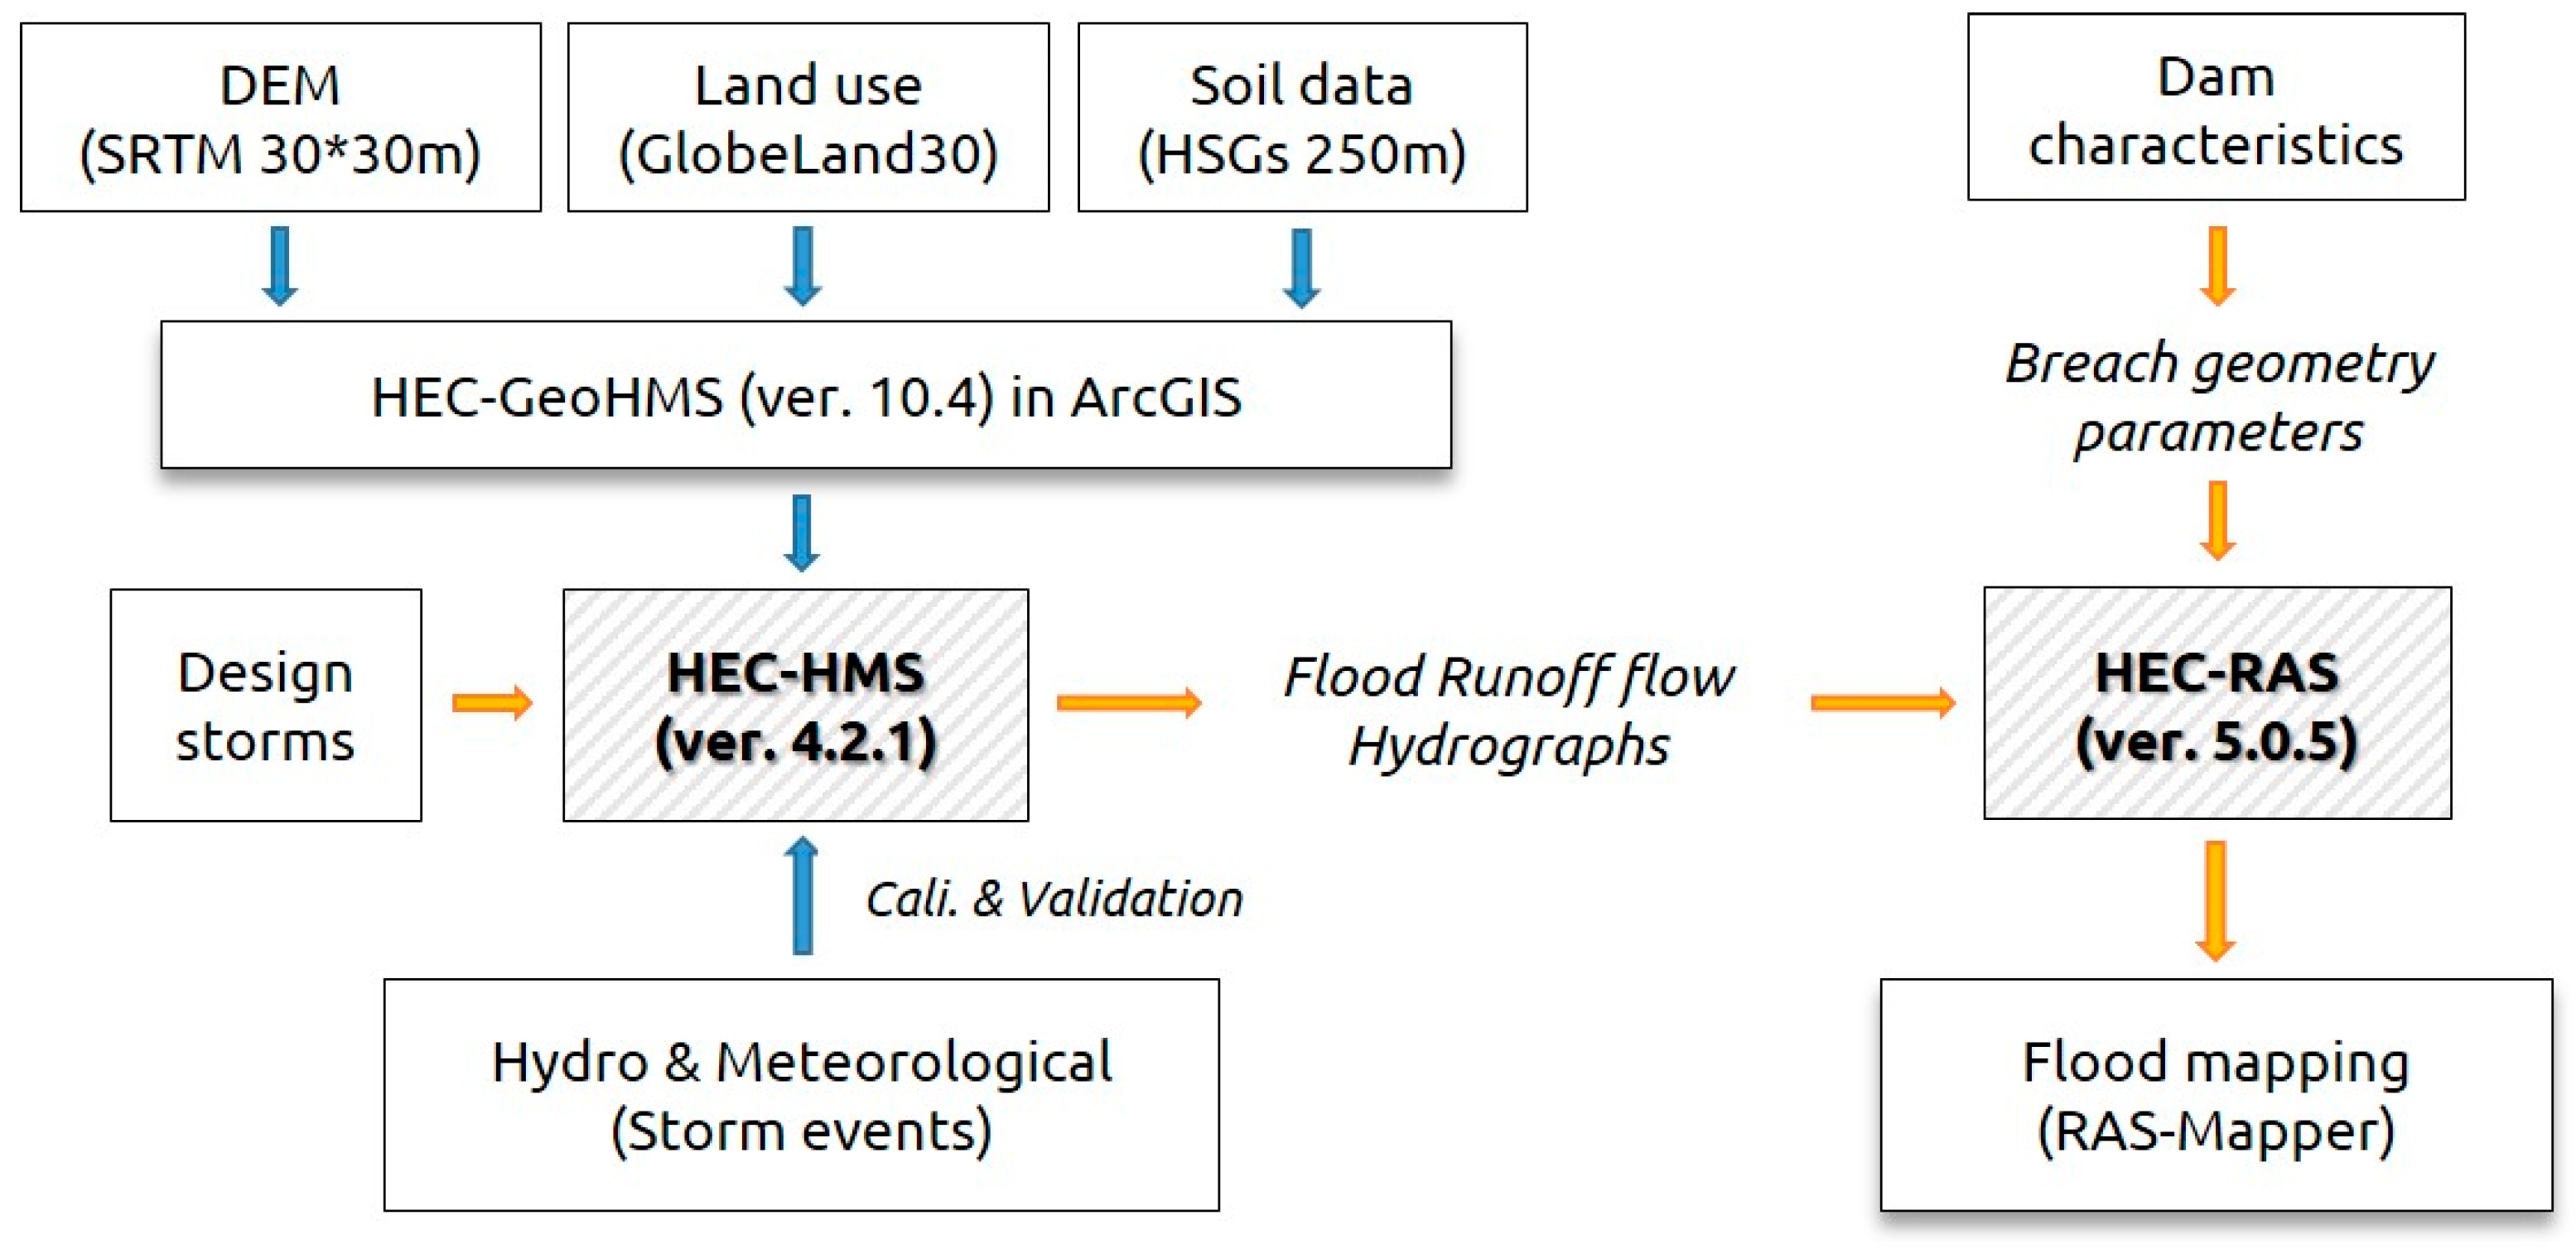
We combined a rainfall–runoff and a hydro-dynamic model to map floods due to dam break. High spatio-temporal resolution land surface and observed hydro-climatic datasets were employed for simulating the probabilistic rainfall events of various return periods that trigger piping dam failure. We also investigated the performance of the coupled rainfall–runoff and hydraulic models in flood hazard and inundation extent analysis. The topographic data (i.e., DEM, soil, land use, and terrain data) and the hydro-meteorological data used in this study are presented in the Data Acquisition section. Figure 2 summarizes the methodological workflow followed in this study.
2.1. Data Acquisition
2.1.1. Land Surface Data
The global data for a digital elevation model (DEM) with a 30 m × 30 m resolution were acquired from the Shuttle Radar Topographic Mission (SRTM) of the United States Geological Survey (USGS) to extract stream networks and prepare inputs to the hydrologic model. ArcGIS (version 10.4) was used to prepare the spatial datasets for use in the HEC-HMS 4.2.1 [24] model. Shapefiles collected from the Ministry of Water Irrigation and Energy (MoWIE), Ethiopia, reservoir geometry in the form of control levels, and the revised elevations–area–capacity curve from a dam design report [25] were used to determine the breaching simulation at different water levels.
Although a wide range of soil types exists in the Awash river basin, two main soil classes, shown in Figure 1c, can be distinguished in the Kesem sub-basin, based on the global hydrologic soil groups (HYSOGs250m) for curve number-based runoff modeling [26]. The most abundant hydrologic soil group (HSG) is D soils, which have the highest runoff potential and very low infiltration rates when thoroughly wetted. They mainly consist of clay soils with a high swelling potential, soils with a permanent high-water table, soils with a claypan or clay layer at or near the surface, and shallow soils over nearly impervious material. The other HSG that exists in the study area is Group C. Group C has low infiltration rates when thoroughly wetted and mainly consists of soils with a layer that impedes downward movement of water and soils with a moderately fine structure [27].
For the land-use classification, the GlobeLand30 dataset developed by China, which has a global surface coverage dataset with a 30 m resolution, was acquired from the National Geographic Information Resource Directory Service [28]. These data contain richer and more detailed information on the distribution of global surface coverage, which can more accurately portray most human land-use activities and the landscape patterns. The land use was reclassified broadly into five groups: agriculture, bare land, forest, built-up, and water. Table 1 shows the major land-use areas in km2 in the Kesem watershed.
2.1.2. Meteorological and Hydrological Data
In this study, hourly precipitation and discharge data were used for the model simulation. The rainfall data were collected from the Ethiopia National Meteorological Agency (NMA) at three observation stations. Similarly, hourly streamflow data from MOWIE were collected at the automated Kesem Arerti gauge station. The locations and description of these stations are provided in Figure 1 and Table 2. Both the precipitation and streamflow data were originally collected in 15 min intervals and were converted to hourly intervals. An automated real-time telemetry observation system was used to collect the streamflow data; the precipitation data were collected from first-class meteorological stations. In Ethiopia, only the first-class meteorological stations can collect and store high-temporal-resolution data, up to 15 min, with many climate parameters. For the hydrologic model set-up, five storm events (16–19 August 2012, 22–24 August 2013, 22–24 August 2016, 7–9 August 2014, and 18–20 August 2015) were used independently to calibrate and validate the model.
2.2. Estimation of the Designed Storm
In this study, the rainfall distributions (i.e., designed storm) for the different return periods were estimated using the Gumbel distribution. The Gumbel distribution method is best for identifying and predicting future rainfall occurrences and flood analysis [29]. The equation for fitting the Gumbel distribution using the observed series of annual peak storm events (i.e., maximum precipitation) for the return period T is
where Pt denotes the precipitation depth of the T-year storm event; KT is the frequency factor; and Pav and σ are the mean and the standard deviation of the annual maximum precipitation, respectively. The frequency factor KT is expressed as
where π is 3.14; λ is the Euler constant (0.5572); and ln is the natural logarithm.
Pt = Pav + KTσ
From this, the rainfall intensity, It, is calculated by the precipitation depth of the T-year return period divided by a certain duration as
where Td is the rainfall duration.
It = Pt/Td
2.3. Hydrologic Modeling (HEC-HMS)
The HEC-HMS rainfall–runoff model [30] was used to simulate inflows into the dam. HEC-HMS is capable of simulating runoff based on hourly to daily rainfall [24]. All the necessary processes to produce HEC-HMS projects were prepared using ArcHydro [31] and HEC-GeoHMS [32] tools with input files from the DEM, stream network, sub-basin boundaries, and connectivity of various hydrologic elements. The HEC-GeoHMS in the ArcGIS environment can create HEC-HMS projects using terrain pre-processing and basin processing tools [14,33]. Arc Hydro is a geospatial and temporal data model for water resources, which operates within ArcGIS. The attribute tables of the terrain were populated with consecutive calculations of basin slope, river length, river slope, basin centroid, centroid elevation, and centroid longest flow path under the Characteristics tool. The land use and soil map were employed to generate the CN grid map through the HEC-Geo HMS tool Generate CN grid.
In the hydrologic modeling, different methods were used to create the rainfall–runoff relationship. The soil conservation service-curve number (SCS-CN) method for losses, the SCS unit hydrograph for transformation, the monthly constant for base flow, and the Muskingum–Cunge method for determining the channel routing were used for the simulation. A curve number grid was generated with the HMS tool; the most common parameters in the flood simulation were entered to develop the HMS schematic for import into HEC-HMS. After performing all the necessary processes in HEC-GeoHMS, the HMS model was exported for hydrologic simulation.
The rainfall–runoff model parameters have to be derived from calibration against one or more observed variables, e.g., streamflow. Comparison of these parameters with modeled results provides physical meaning and acceptable ranges for their values [34]. Exact values for the parameters usually cannot be fixed in advance. Therefore, five hourly historical storm events between 2012 and 2018 at three precipitation gauge and one hydrological gauge stations were used to set up the model through calibration and validation. The model estimates flow output and compares it with the observed flow at the Kesem Arerti gauge station. Statistical measures were used to assess the model performance (i.e., the strengths and weaknesses of the model). This measures-oriented approach to model performance assessment focuses on several different aspects of the overall accuracy or skill of the streamflow model. The applied model was evaluated with a coefficient of statistics, to provide the range of information [35].
The coefficient of determination (R2) is used to describe the degree of correlation between the simulated and measured data. It ranges from −1 to 1, where values close to 1 indicate the least error. The percent bias (PBIAS) measures the tendency of the average value. The Nash–Sutcliffe efficiency (NSE) is a normalized statistic showing the residual variance, where an NSE > 0.5 is considered to indicate a good fit. The mean absolute error (MAE) and root mean square error (RMSE) are absolute measures of fit. The equations that were employed in this study are shown below:
where Oi is measured flow (m3/s); Si is simulated flow (m3/s); and Oav and Sav are mean measured and simulated flow (m3/se), respectively. Afterward, the frequency method was selected to run the HEC-HMS model for specified durations under the inbuilt meteorological model in the HEC-HMS model.
2.4. Hydraulic Modeling (HEC-RAS)
HEC-RAS was designed to perform one- and two-dimensional hydraulic calculations for a full network of natural and constructed channels. HEC-RAS can be used to route an inflowing flood hydrograph through a reservoir with any of the following three methods: one-dimensional (1D) unsteady flow routing (full Saint-Venant equations), two-dimensional (2D) unsteady flow routing (full Saint-Venant equations or diffusion wave equations), or level pool routing. In general, full unsteady flow routing (1D or 2D) is more accurate for both the with- and without-breach scenarios. Because HEC-RAS solves the full Saint-Venant equations, it is well-suited for computing floods [36].
In a previous study, the Kesem dam was simulated using HR BREACH for both the overtopping and piping failure modes, employing Hershfield’s technique to estimate the probable maximum flood. The result showed overtopping failure is not expected as the spillway can safely evacuate this flood [23]. For piping failure, the water seeps in at a significant rate through the dam; as the material is eroded, a large hole forms. Hence, during the piping process, erosion and head cutting begin to occur on the downstream side of the dam, which eventually widen the breach. Depending on the volume of water in the reservoir, the widening continues until the natural channel bed is reached. HEC-RAS has two types of methods available for assessing the dam breach characteristics, namely, the user-entered and the simplified physical methods.
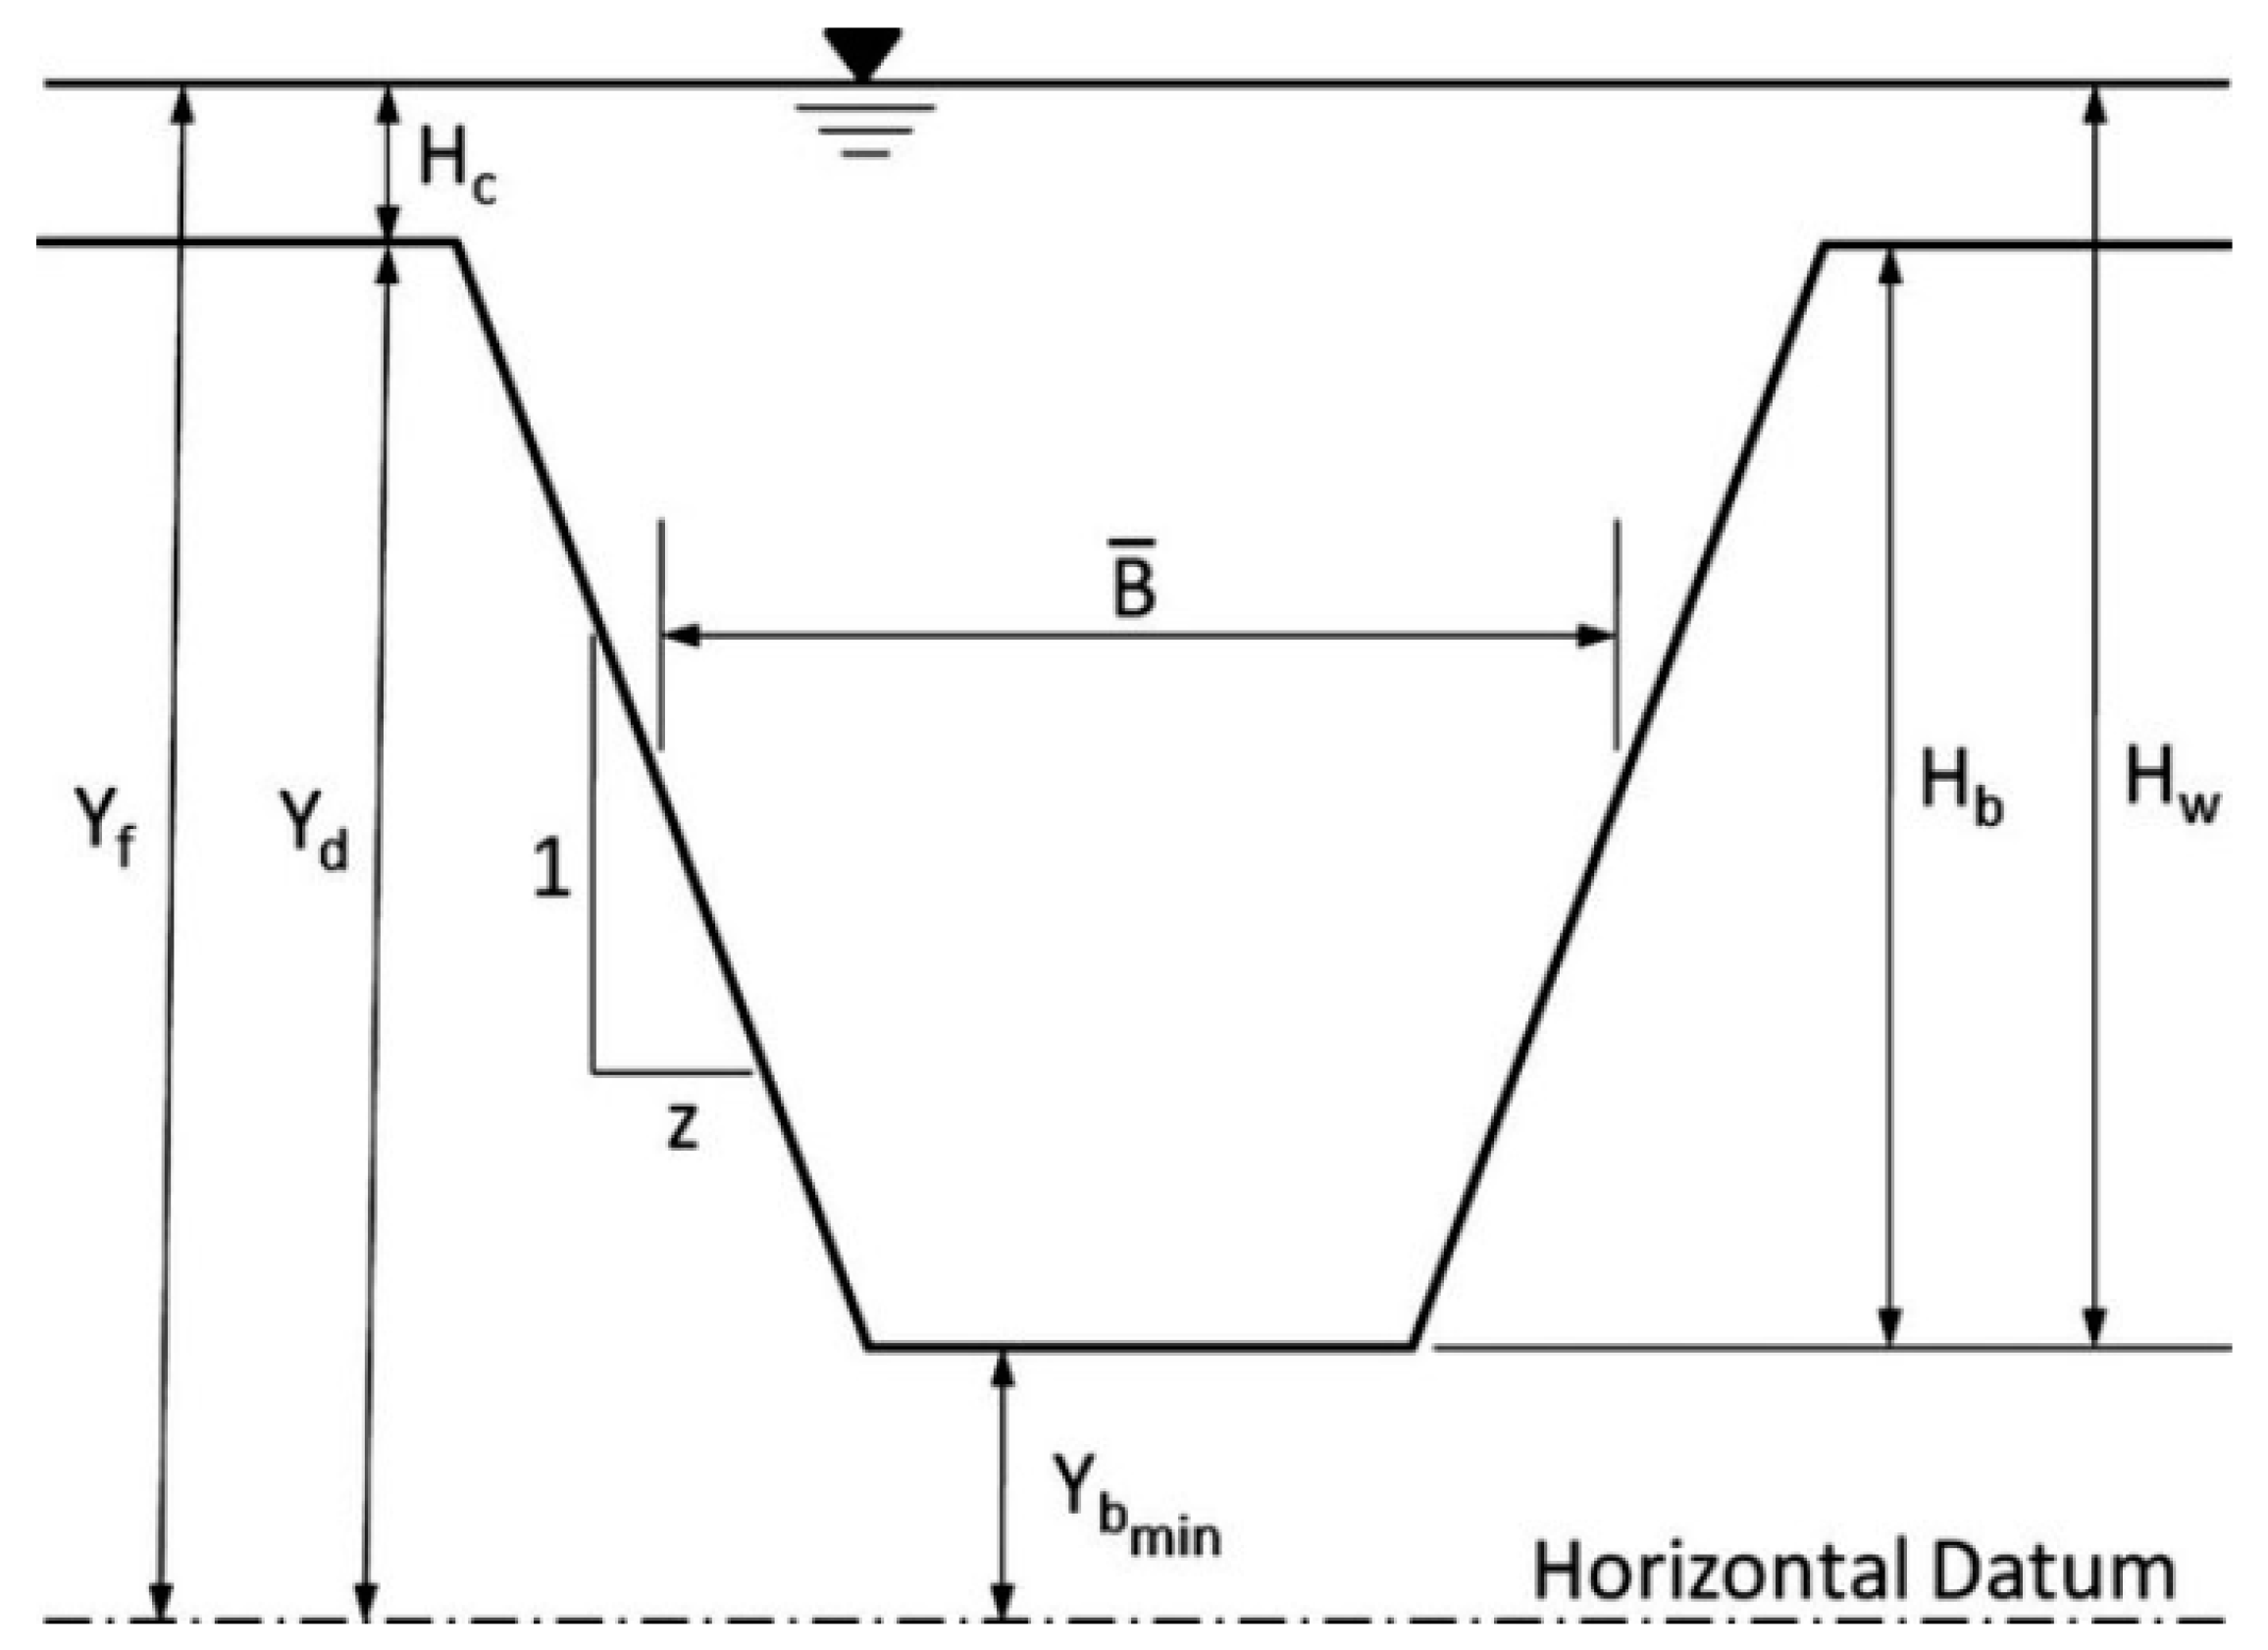
Breach formation model parameters that need to be estimated consist of the reservoir water-surface elevation at which breach formation begins (Yf), height (Hb), average width (Bav), average side slope ratio z of the final trapezoidal breach, and the breach formation time (tf, the time needed for complete development of the breach following the initiation phase), as shown in Figure 3. For this study, the Froehlich simplified physical method regression equations [37] were used for piping dam breach simulation. The relationships for both expected values and their variances are presented using the coefficient of determination (R2) for breach width, peak outflow, and breach formation time parameters: 0.68, 0.86, and 0.96, respectively [38]. The prediction equations for the parameters Bav, z, and tf were determined from multiple regression analysis of the assembled data. Logarithmic transformations of all dependent and independent variables were found to provide the best linear relationships [39]. As a result, the Froehlich method was found to be more appropriate for the simulation of the Kesem dam.
2.5. 2-D Flood Mapping
The modeling of a dam break flood wave is one of the most difficult unsteady flow problems to solve. Within HEC-RAS, the downstream area can be modeled as a combination of one-dimensional streams and storage areas; as a combination of one-dimensional streams, storage areas, and two-dimensional flow areas; or as a single two-dimensional flow area. Many other factors must be considered to obtain an accurate estimate of the downstream flood stages and flows. In unsteady flow model development for a dam break, stability and numerical accuracy can be improved by selecting a time step that satisfies the Courant condition. Too large a time step causes numerical diffusion (attenuation of the peak) and possible model instability, whereas too small a time step can lead to long computation times, as well as possible model instability.
The best method to estimate a computational time step for HEC-RAS is to use the Courant condition. This is especially important for dam-break flood studies. The water depth, velocity, and the water surface elevation were analyzed, and the result was displayed in HEC-RAS Mapper view. The Courant condition is shown below:
where C denotes the courant number; ∆T is time step in seconds; ∆X is the distance step in feet (average cross-section spacing or two-dimensional cell size); and Vw is the wave speed in feet per second. The flood wave speed can be calculated by
where dQ is the change in discharge over a short time interval (Q2 − Q1); and dA is the change in cross-sectional area over a short time interval (A2 − A1).
C = Vw ∆T/∆X ≤ 1 and ∆T ≤ ∆X/Vw
Vw = dQ/dA
For our applications of the Courant condition, we used the maximum average velocity from HEC-RAS and multiplied it by 1.5 to obtain a rough estimate of the flood wave speed in natural cross-sections. According to the recommendation of the HEC-RAS manual, multiplication by 1.5 can be used for practical reasons to identify the flood wave speed. The contour lines of velocity and their flow directions can also be displayed in the 2D flood map.
Afterward, a new set of layers were created and imported into the RAS mapper to visualize the outputs generated in a specified pre-processing step for performing the floodplain delineation. For the model to be accurate, small cell sizes can be used as the computational requirements are less relevant and the simulation runs quickly [12]. Previous studies have addressed the effects of mesh size and resolution on 2D flood map modeling. The coefficient of surface roughness, i.e., Manning values analysis, is required to be very large to avoid any significant impact on the model predictions [13,40]. In this study, different mesh sizes were tested considering the terrain resolution and the computational time. The maximum possible cell size, i.e., 30 m × 30 m, was employed to simulate the flood flow in a reasonable amount of computational time. In addition, a constant Manning roughness value (i.e., 0.05) was used per Chow’s (1959) recommendation for vegetated flood plains [41].
Stream centerlines, cross-section cut lines, bank points, velocity points, and bounding polygons were created in ArcGIS. The software creates different bounding polygons and a spatial limit for floods based on the water surface elevation of the return periods floodplain. Finally, inundation mapping was performed in two steps: water surface generation and floodplain delineation. The water surface was created from the altitude of the water surface in the 2D flow area. Floodplain delineation was achieved using the SRTM terrain model. The flood damage and inundated infrastructure were analyzed by overlaying the Google Earth satellite map. Thus, the flood inundation boundaries and their depths were calculated. The flood inundation areas for different flood values are represented by polygons of the contour lines generated in the RAS mapper.
3. Results
3.1. Designed Storm
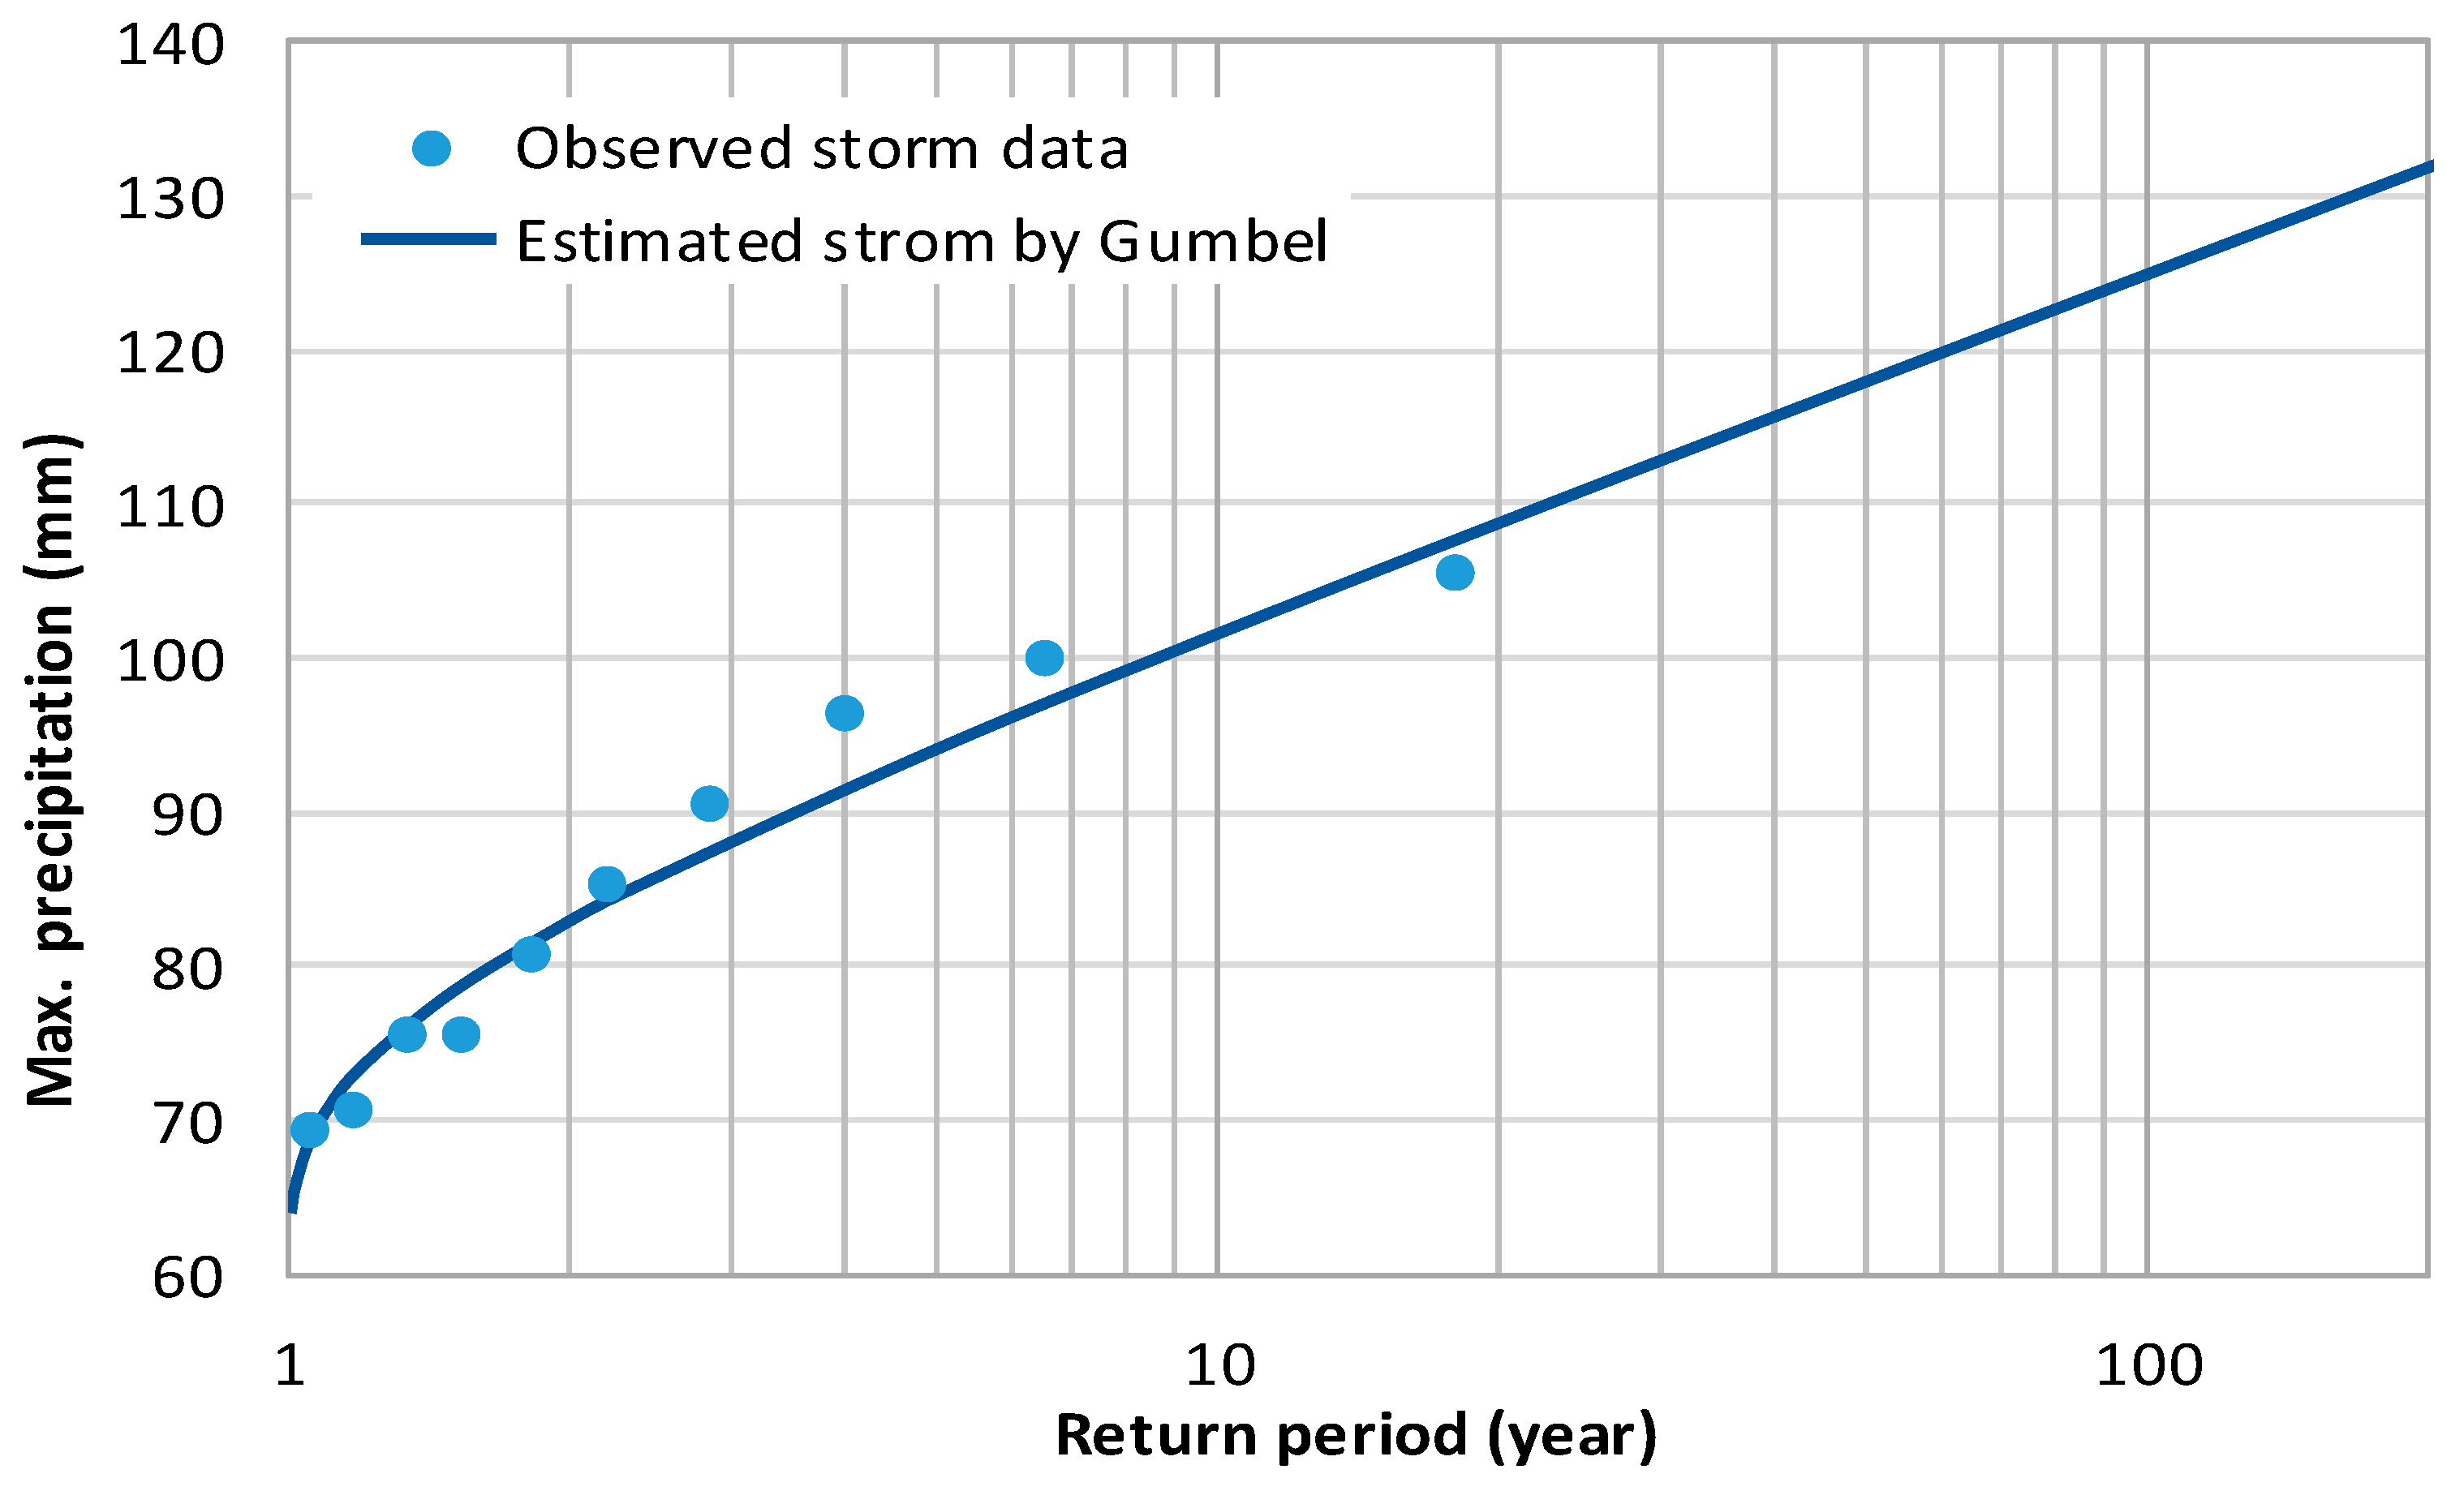
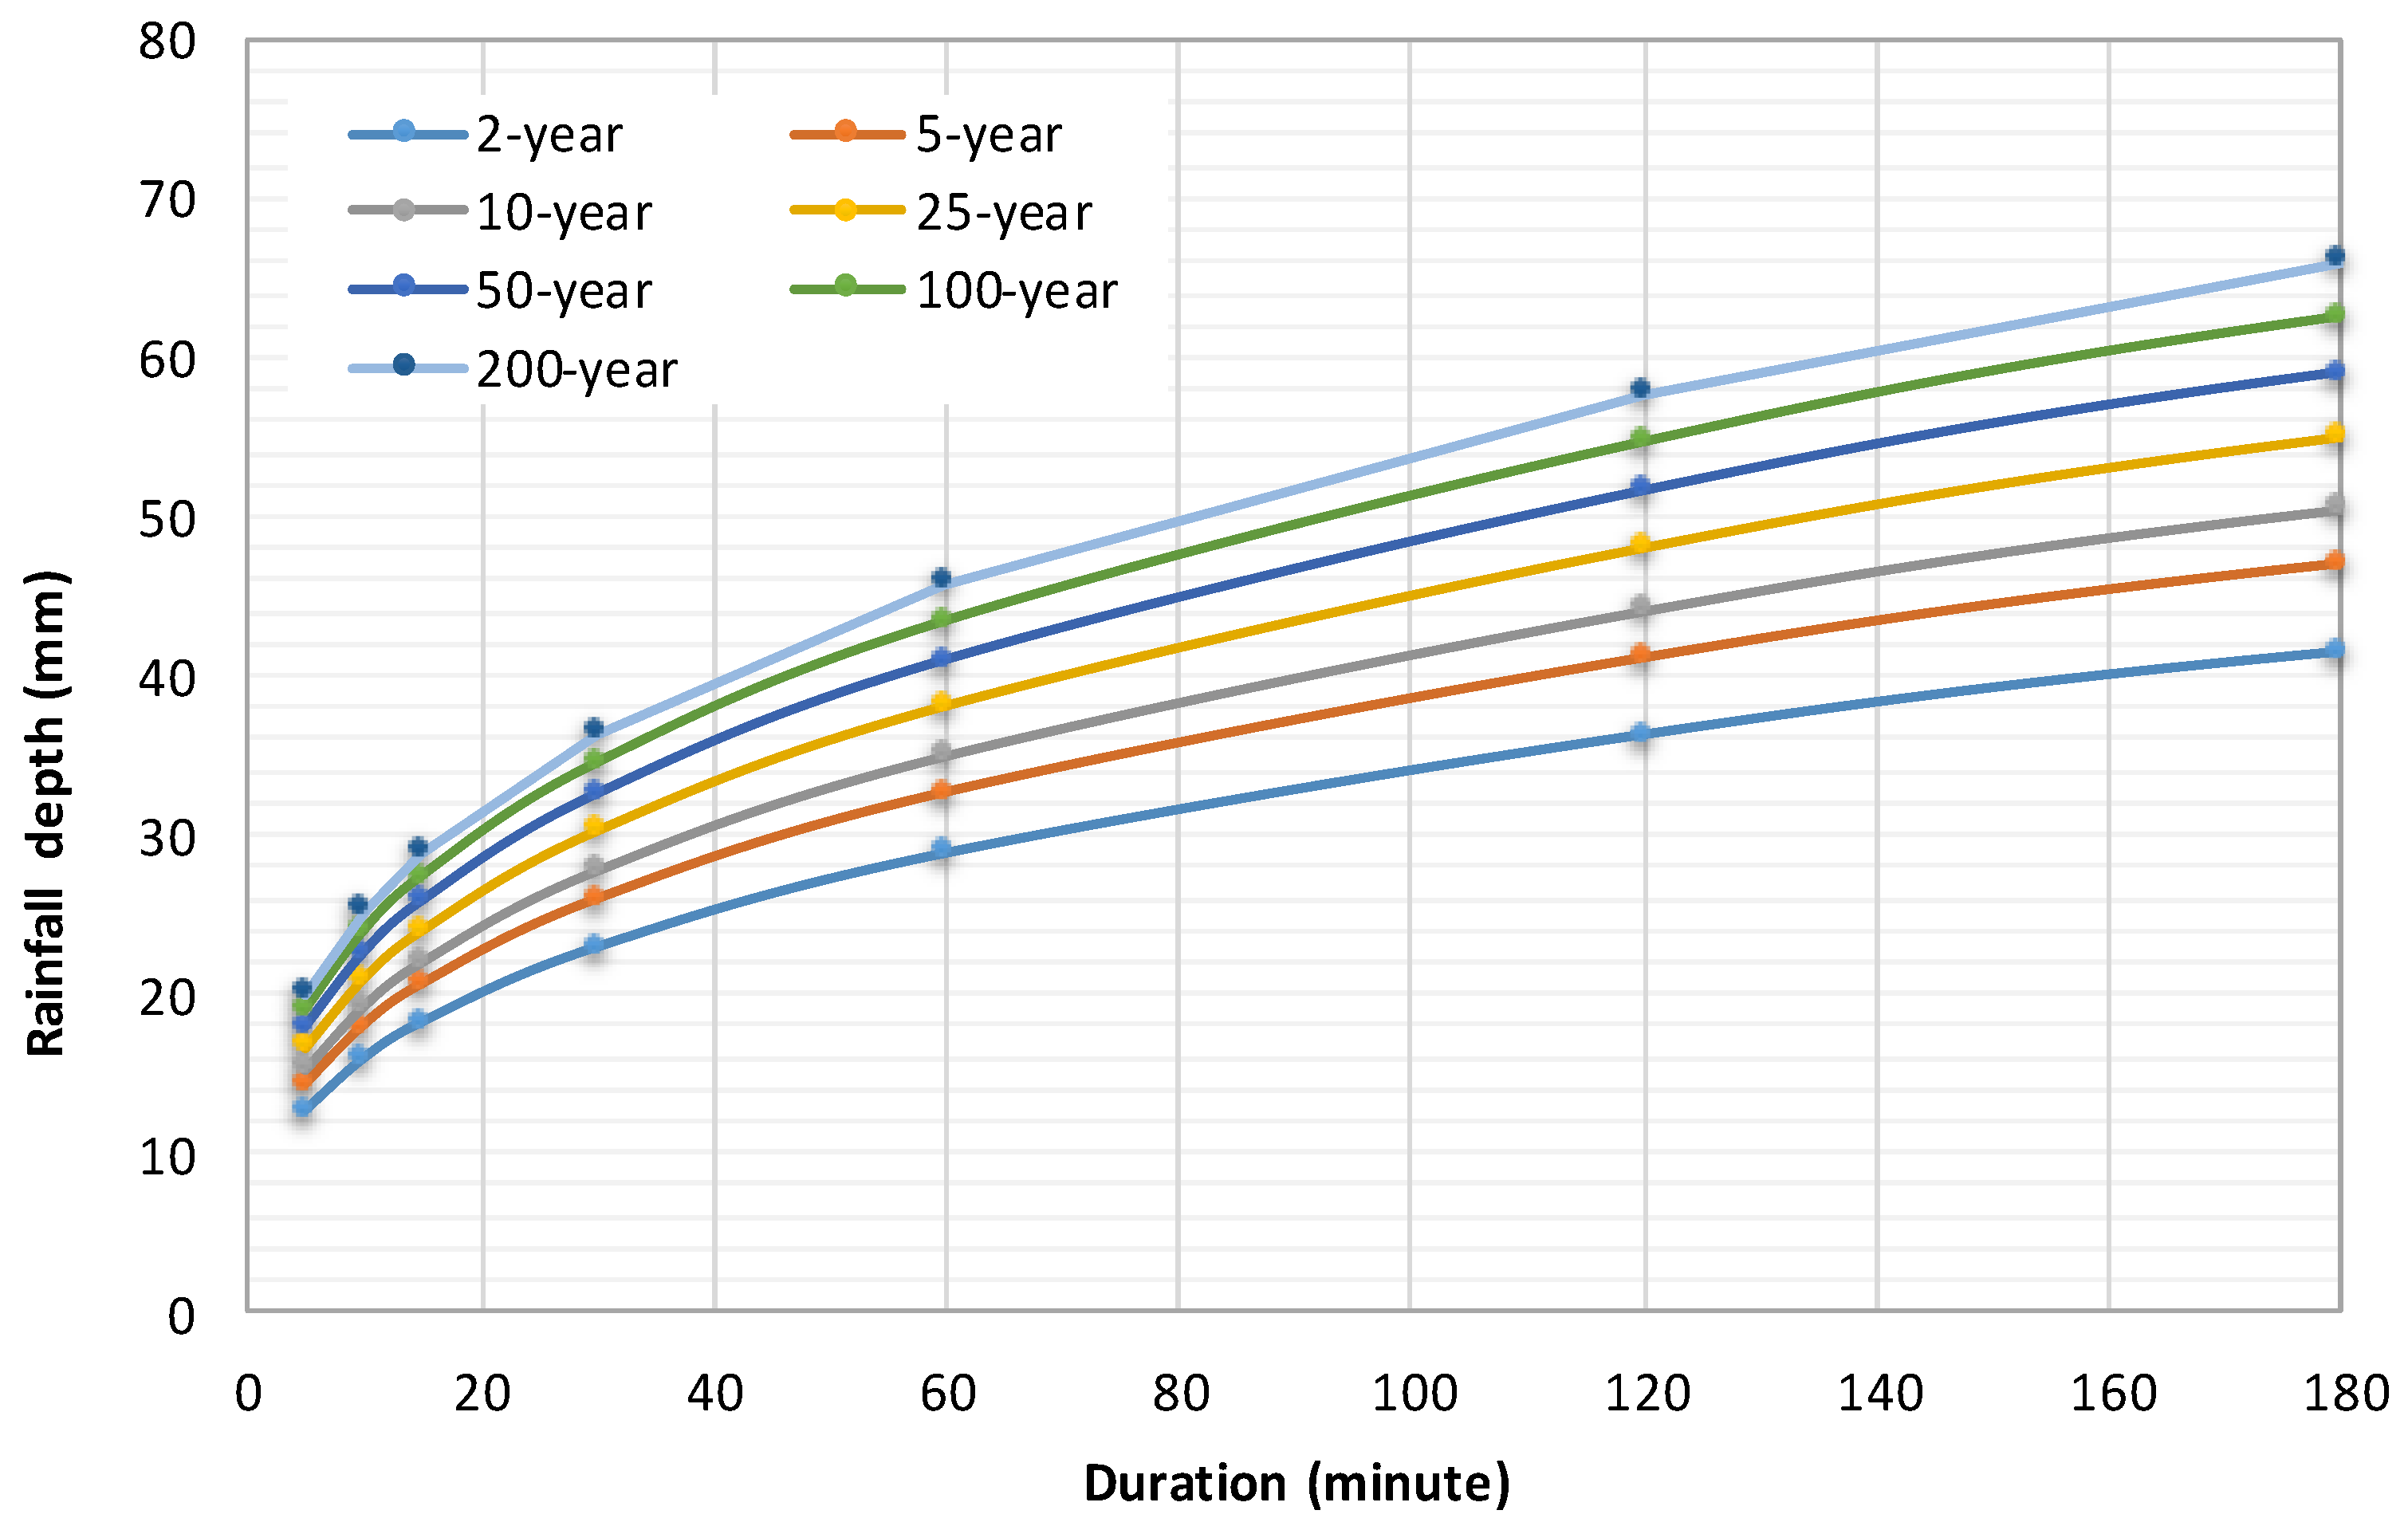
The designed storm was computed by applying the Gumbel distribution to each set of annual daily maximum precipitation corresponding to the return periods, as shown in Figure 4. The Gumbel distribution fairly estimates the stochasticity of the Kesem watershed, as shown on the curve below. Following the frequency result, an intensity duration frequency (IDF) curve was developed to estimate the designed storm for various return periods. The value of the IDF was converted into the depth duration frequency (DDF) to estimate the design precipitation depth, as shown in Figure 5, and computed for the design inflow calculation.
3.2. Hydrologic Simulation (Flood Hydrograph)
The HEC-HMS model was set up by simulating the historical observed data and tuning the sensitive parameters within the model. The calibration, validation, and physical properties analysis of the HEC-HMS model significantly enhanced the performance of the hydrologic model. Moreover, the base flow that was calculated from the annual minimum monthly flow of the streamflow was the crucial element in determining the peak rainfall and maintaining the hydrograph consistency during low flows. Figure 6 shows the monthly average precipitation of the Kesem watershed.
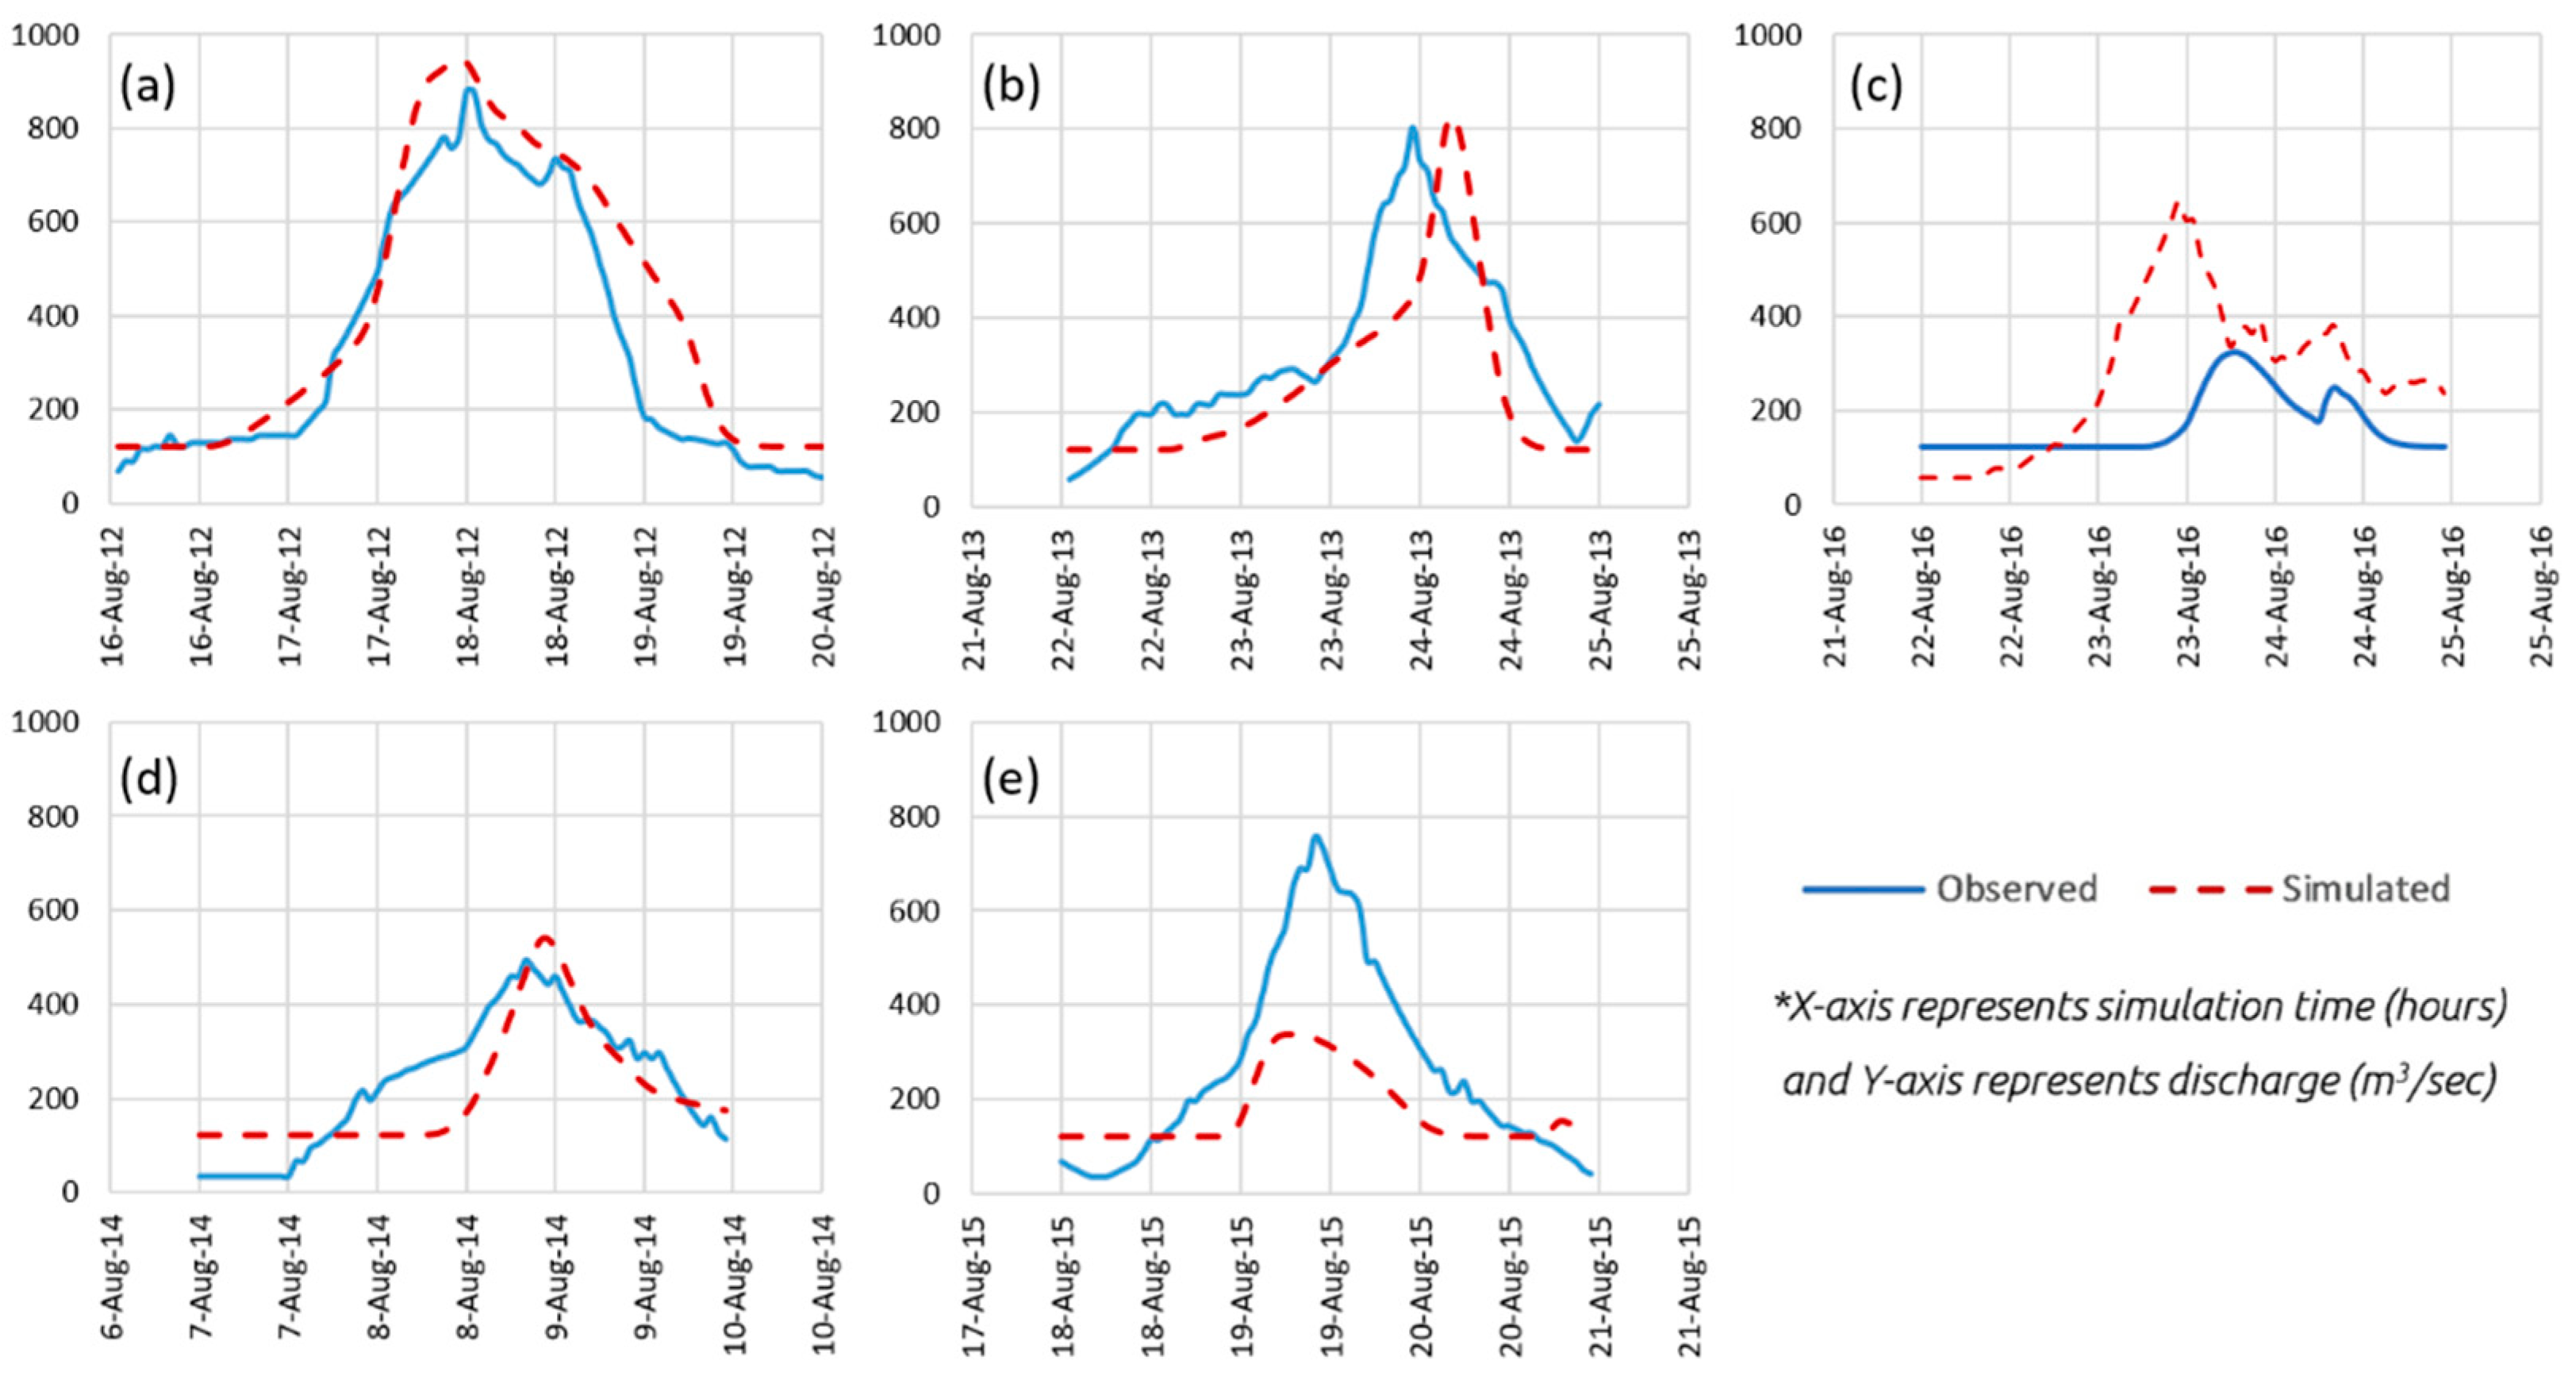
Regardless of historical changes in the basin, the model calibration increased the efficiency of the model in making a good agreement between the simulated and observed hydrographs. Furthermore, the model was verified using peak hourly storm events in August 2014 and 2015. Both calibration and validation hydrographs are shown in Figure 7. The results of the statistical evaluations after calibration and validation are within the acceptable range, as shown in Table 3. Thus, the model was well-set and ready for the simulation of flood hydrographs using the return periods of the designed storm.
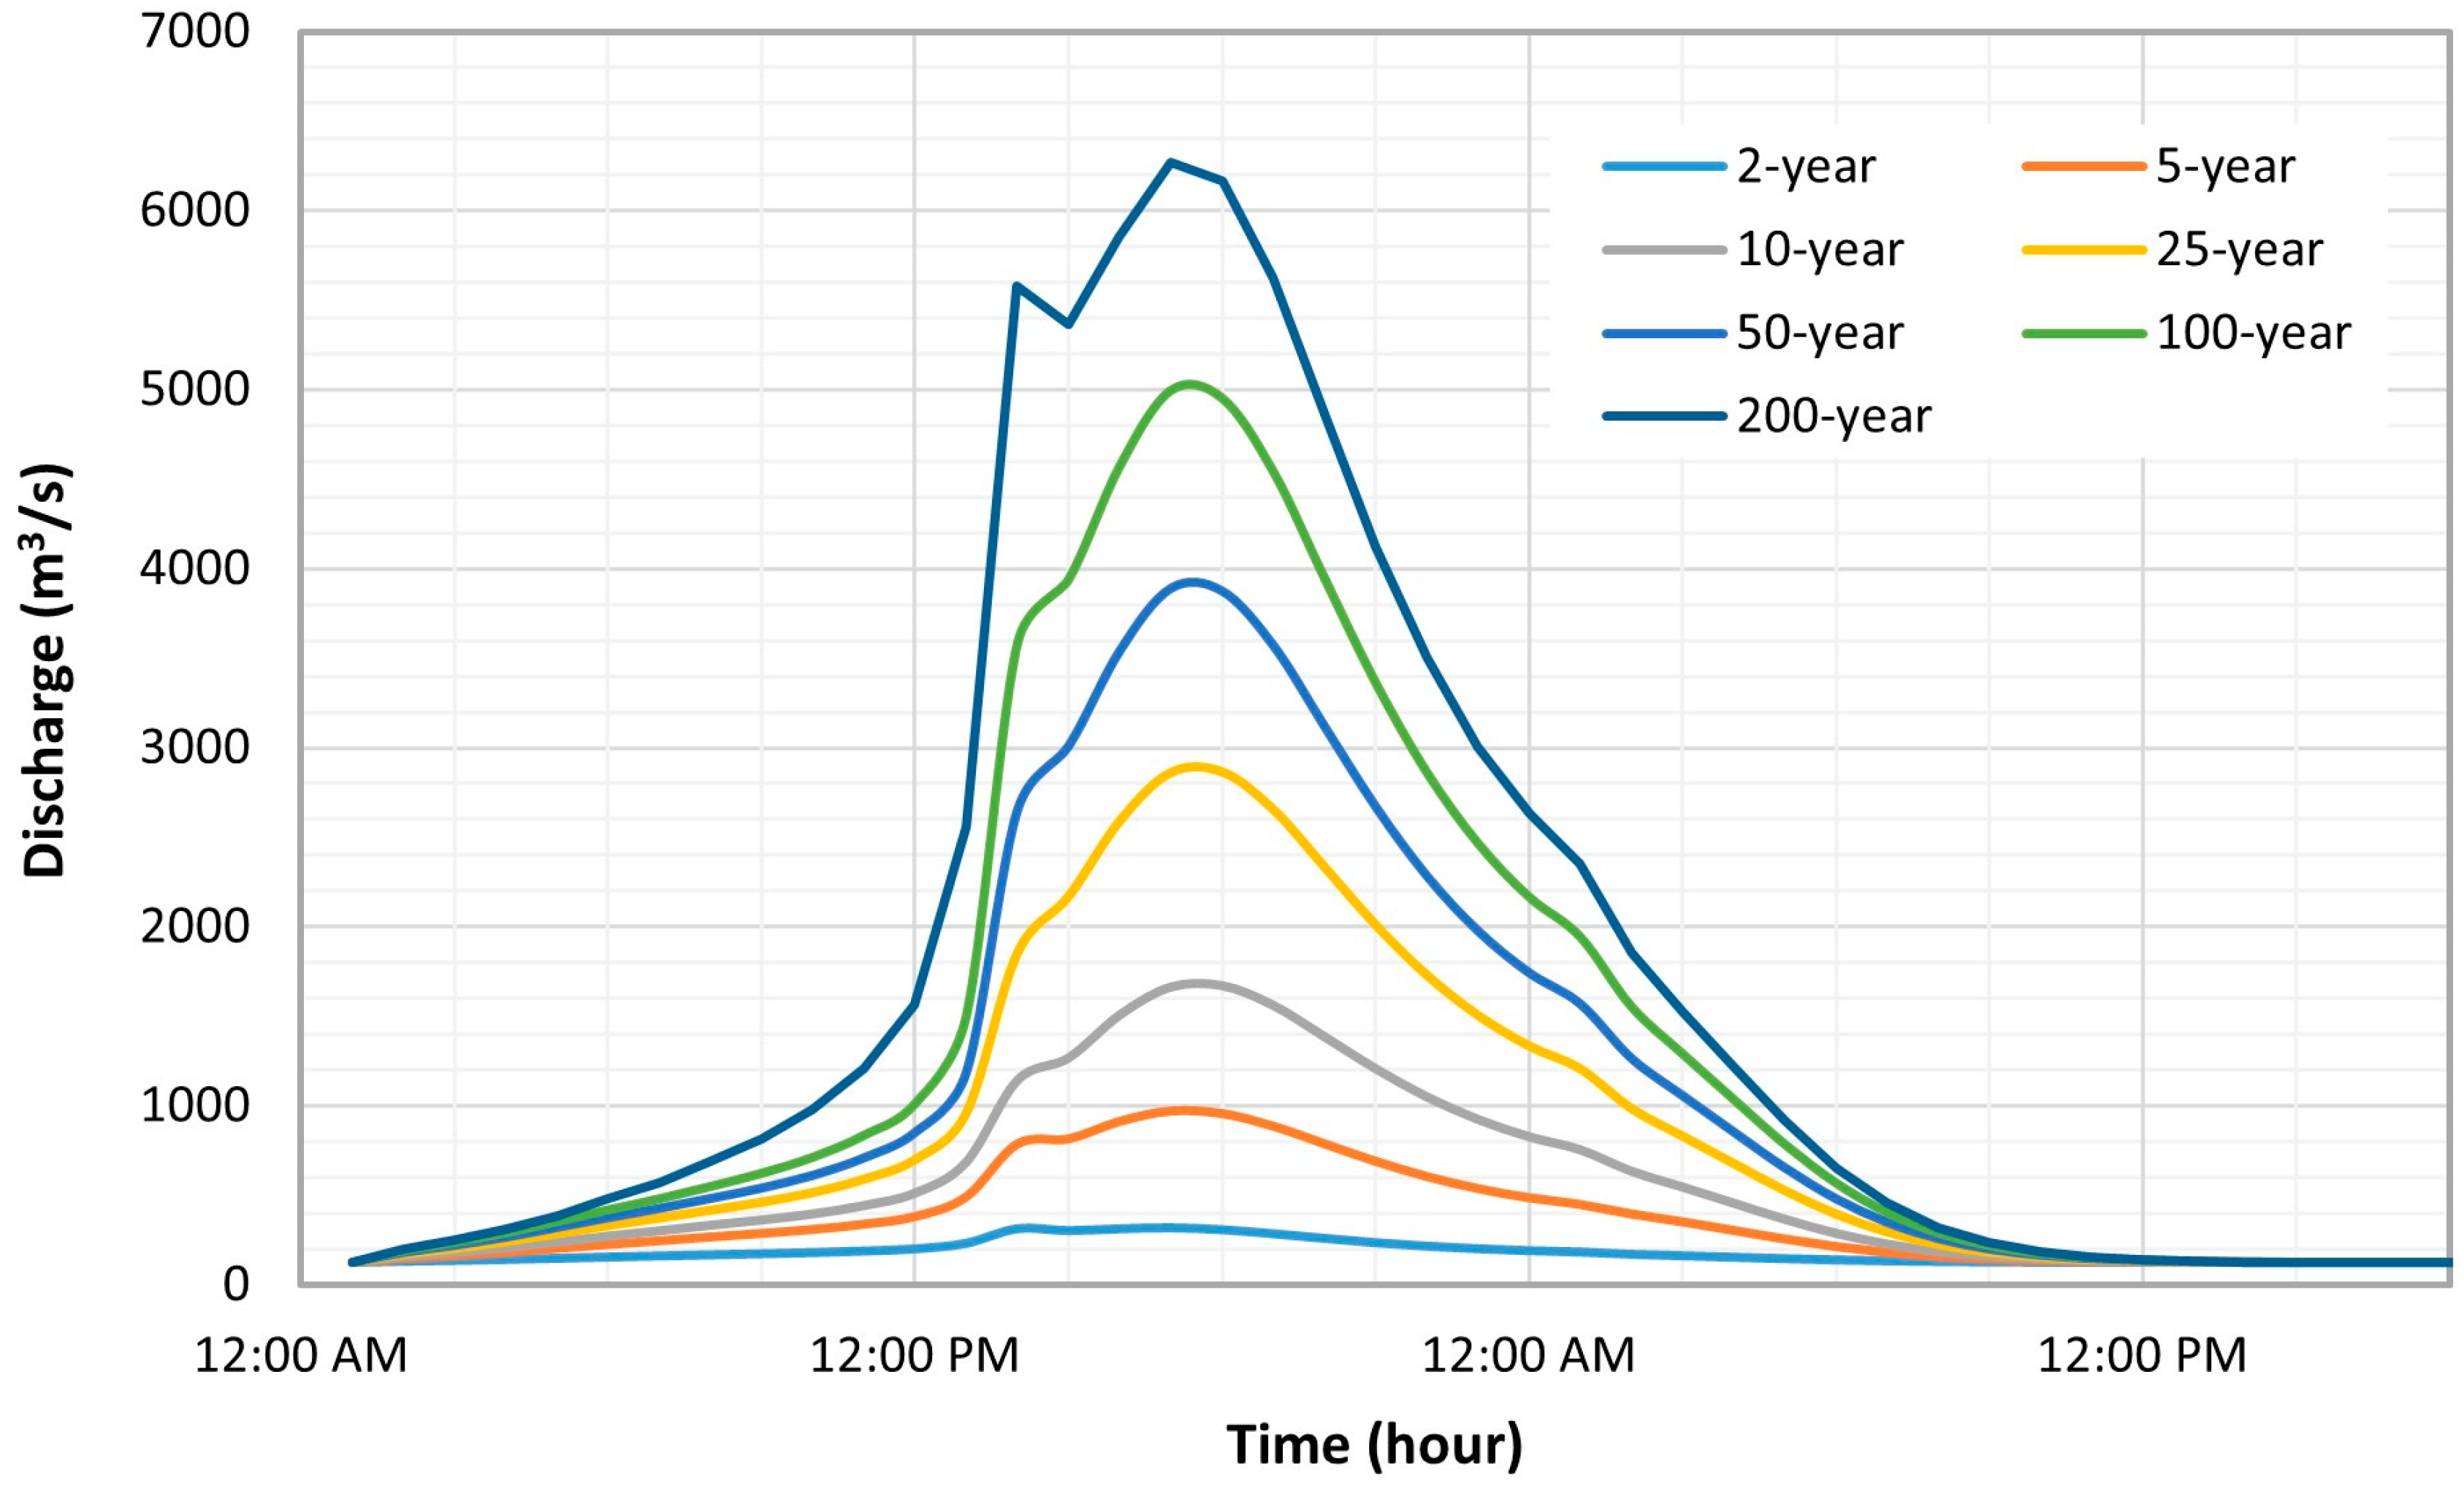
Afterward, the model simulated a 48 h storm event. The hydrographs from the HEC-HMS model were used as a boundary condition for the hydraulic model. Figure 8 depicts the flood hydrographs of the designed storm in the Kesem reservoir. The reservoir inflow hydrograph peak discharge for the return periods of 2, 5, 10, 25, 50, 100, and 200 years was 318.2, 968.1, 1672.6, 2866.9, 3892.3, 4997.5, and 6161.1 m3/s, respectively. The use of hourly peak observed rainfall events for the flood estimation shows a relatively higher flood hydrograph, which increased the estimation accuracy of the Kesem watershed hydrographs.
3.3. Hydraulic Simulation (Flood Mapping)
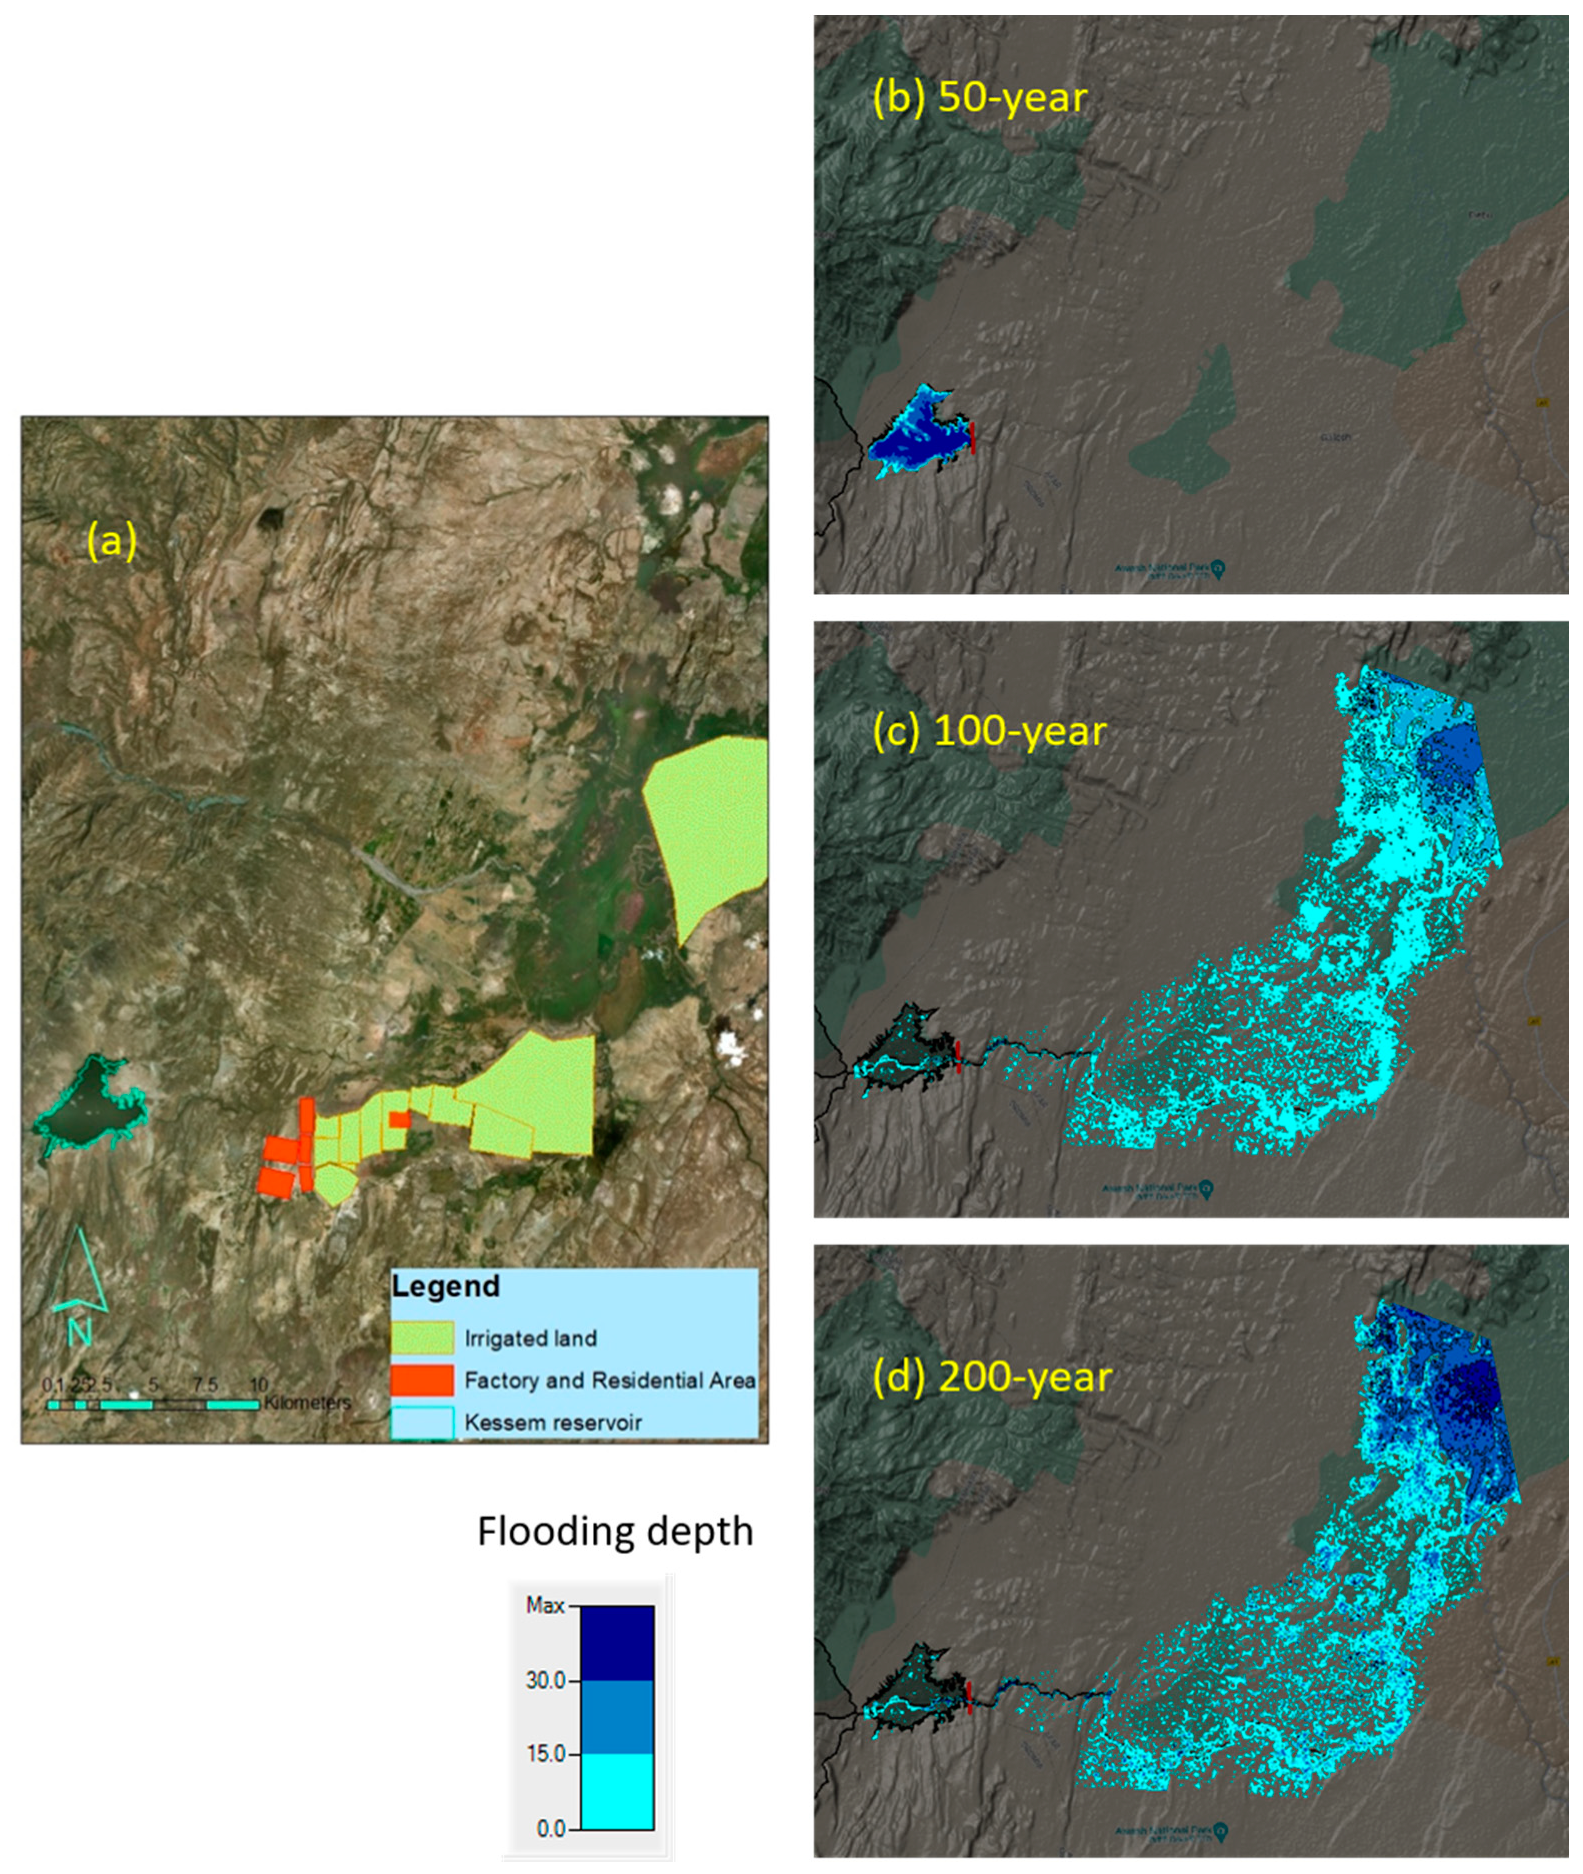
Then, HEC-RAS simulation was performed using the peak inflow hydrographs of the hydrologic model outputs as the boundary conditions for a piping dam breach. Consequently, we found the inflow up to the 50-year return period cannot result in a Kesem dam break. However, the 100- and 200-year return period inflows show dam failure and flooding of the downstream area. The dam breaching begins when the water level of the reservoir reaches an elevation of 930 m and the volume of water stored in the reservoir is 550 million m3. The breach is estimated to begin as triangular and then stretching to reach the bottom of the breach, when the shape changes to trapezoidal. A standardized dam-breach scenario examines a range of possibilities to estimate the expected annual damages, which vary with the volume of water in the reservoir. For general planning purposes, the most useful scenario is the worst-case one in which the dam fails while the reservoir is full [42]. Therefore, in this study, the stored water in the dam and the inflow was routed to the floodplain downstream of the dam. Thus, the flood hazard maps for the 100- and 200-year return periods were generated. Figure 9 represents the model results for the return periods that show dam break and those that remain safe.
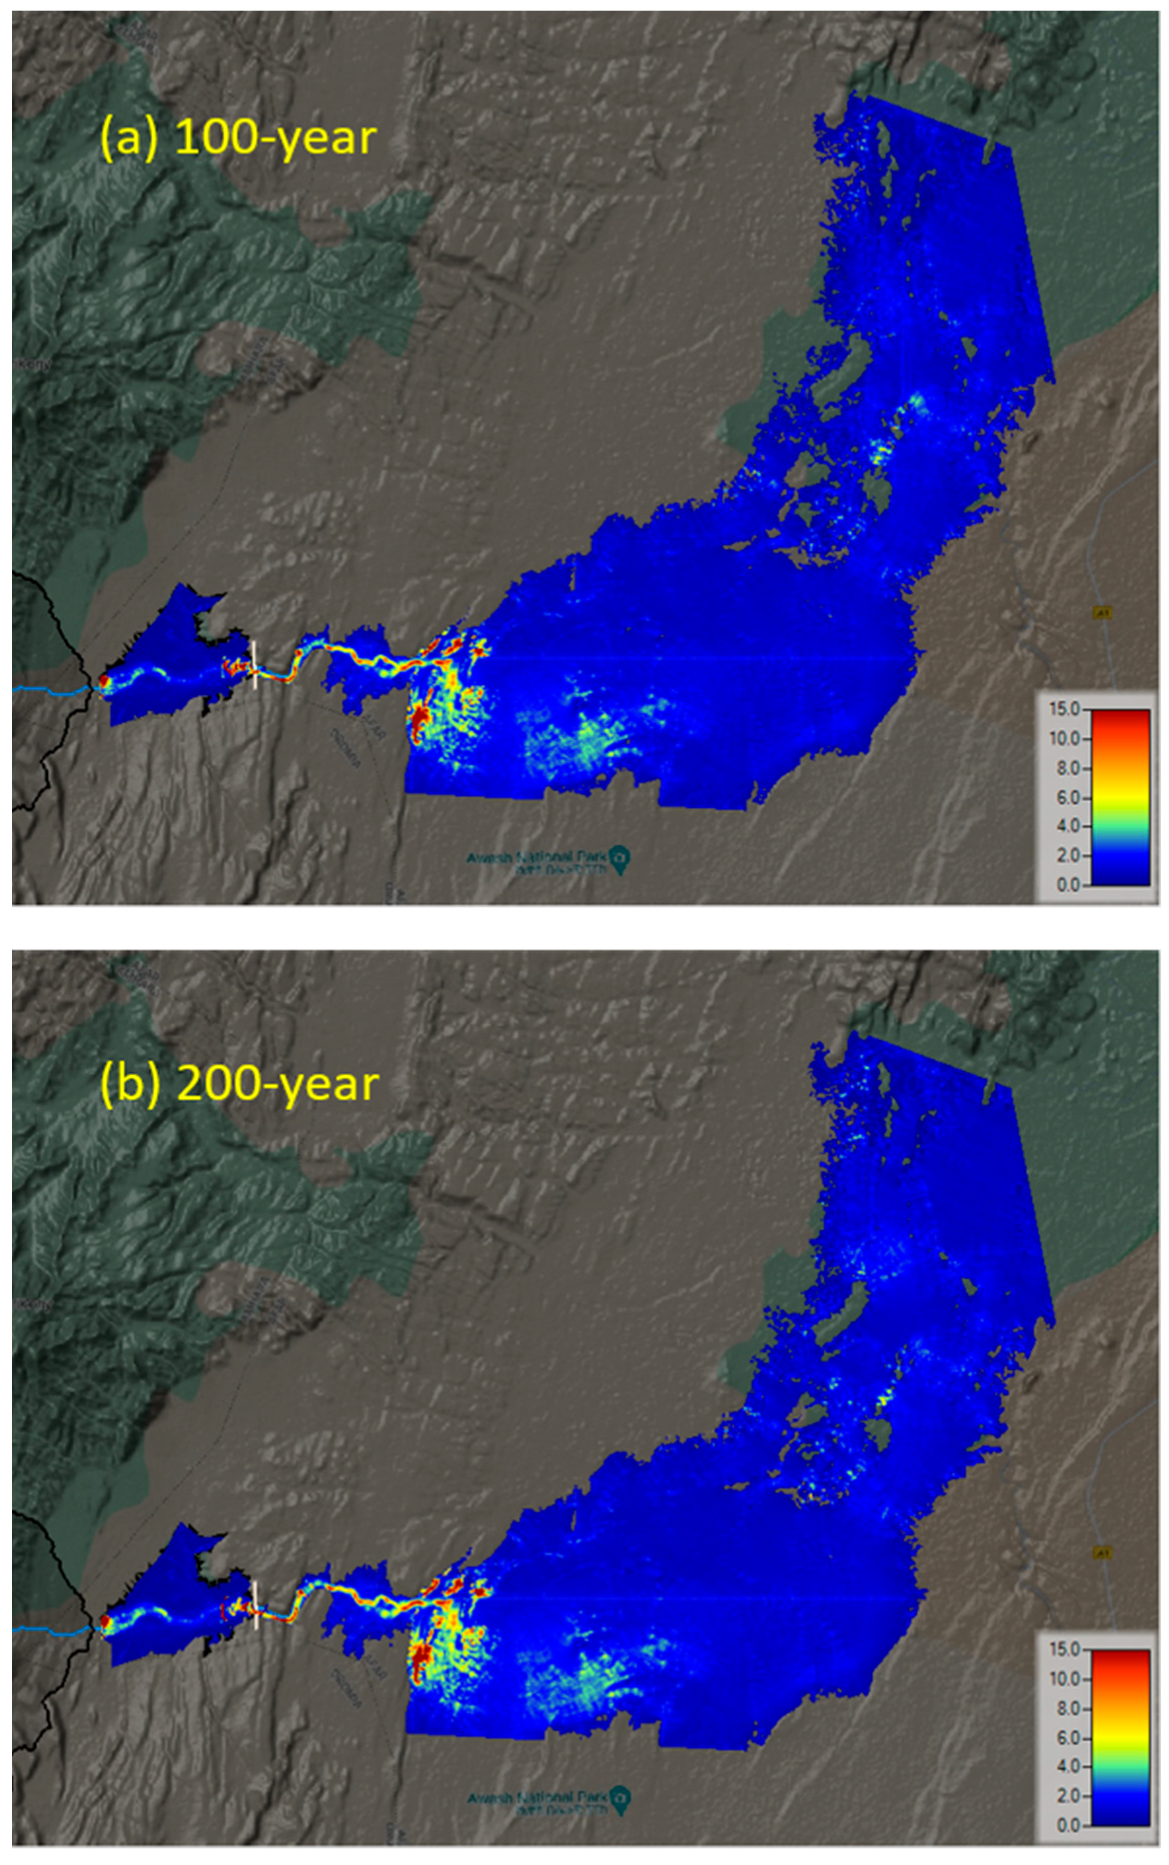
The inundation area coverage and depth in the floodplain are displayed for both the 100- and 200-year return periods. The 2D flood simulation video in RAS mapper provides a detailed view of the flood extent, propagation, and depth. In this case, the velocity of the flooding shows variation in space and time, increasing to 15 m/s in the immediate vicinity of the dam and slowing as it flows to the wider area toward the confluence with the Awash River, as shown in Figure 10.
The inundation depth and duration vary depending on the topography and proximity to the dam. Table 4 provides the main information about the flood inundation. The maximum water depth for the 100- and 200-year return periods are 20 and 31 m, respectively. The inundation time also increases to 46 and 93 h, with 10 and 39 h on average, for the 100- and 200-year return periods, respectively. The flood inundates everything in the downstream area of the dam. The devastating effect extends to the life, livelihood, and property of the community as well as the national economy, including major infrastructure such as Awash National Park, the irrigation control area, the Kesem sugar factory, and two small villages downstream of the dam.
4. Discussion
In previous studies, the Kesem watershed and dam flood flows were estimated using monthly to daily time-series data for flood simulation. In this study, the flood flow estimation using hourly time steps of precipitation data demonstrated a more reasonable results, as short duration peak events are included in flow calculation. That means the higher the temporal resolution of the record, the higher the accuracy of the flow estimation. Moreover, the statistical results of the simulated flow hydrograph against stream flow observations were within an acceptable range after model calibration and validation. Although the application of short-term rainfall data to the evolution of long-term trends might not be representative and conclusive, as the trend results are influenced by data uncertainty [43], the observed annual maximum storm data of the Kesem watershed well fit the estimated storm curve produced using the Gumbel method, as shown in Figure 4. In addition, the accuracy of estimation was enhanced using a longer period of observed data and the use of IDF and DDF curves with the Gumbel precipitation distribution, which were found indispensable for return periods flow simulation.
Dam breaches are often simply modeled in the shape of a trapezoid that is defined by its final height, base width, or average width and side slopes, along with the time needed for the opening to form completely [39]. In this study, the dimension and occurrence of the dam breach were estimated by Froehlich mathematical expressions for the expected values of the final width and the side slope of a trapezoidal breach, along with its formation time. Although data on historical embankment dam failures are limited and were generally not directly and accurately recorded, Froehlich collected data from 74 embankment dam failures for the determination of the breach characteristics [37]. Additionally, an investigation into the Mosul embankment dam failure with HEC-RAS embedded with piping dam breach mathematical equations showed that Froehlich is the most suitable method for estimating breach parameters from an embankment dam [44]. Therefore, the application of the Froehlich method to the Kesem dam is the most accurate method to estimate the breach dimensions and formation time.
The use of a high-spatial-resolution DEM for 2D flood map generation and inundation extent determination was essential for topographic and cross-sectional data-scarce areas. River cross-sectional dimension data at a specified interval are scarcely available for many rivers of the world. Furthermore, for flood patterns around discrete features, it is important to use a 2D model to determine the direction of flow [45]. However, terrain analysis for implementing large-scale hydraulic simulation is still a challenging and active research issue. A comparison of the detailed digital surface models (DSMs) and DEMs shows that the detailed DSMs may more accurately indicate the surface relief and the existing natural obstacles, such as vegetation, buildings, and greenhouses, enabling more realistic hydraulic simulation results [46]. Consequently, the 2D map can be enhanced by incorporating 1D simulations with the necessary topographic and cross-sectional data as well as detailed digital surface models. Additionally, in this study, the existing structures downstream the dam, except for the flood-control levee on the side of Awash River, could not be included due to a lack of data. However, the accuracy of the results can be improved with the addition of existing inline and lateral structures, such as weirs, bridges, and dykes. The effect of land use on both the watershed and the floodplain can be demonstrated to depict scenario-based flow change and the expected damage. The depth of inundation and the velocity can be synchronized to assist in practical impact-based flood forecasting and damages calculation.
Although there is no unified definition, the environmental impact of a dam break, which refers to the changes in the natural environment and ecological conditions around the reservoirs, mainly includes the natural environment, including water, soil, atmosphere, noise, and solid waste [47]. Flood maps of anticipated dam breaks cannot be accurately drawn, and it is practically impossible to exactly validate the inundation area. Flood maps can be enhanced by incorporating a validation sample specific to the flood-inundated area. We used the volume–area–elevation curve between the reservoir storage time and the breach occurrence time to validate the inundation area. The validated model could be useful for reservoir operation and dam safety management.
5. Conclusions
In this study, we coupled HEC-HMS and HEC-RAS for application to the flood mapping of a Kesem dam break in Ethiopia, with the results showing a satisfactory result for both the rainfall–runoff and hydraulic simulations. The use of 2D flood mapping, particularly in data-scarce areas, greatly contributed to the identification of risk zones and the extent of the hazard. From this study, the following conclusions were drawn:
- The use of high-temporal-resolution hydro-meteorological data (i.e., precipitation and streamflow), for flow estimation, and high-spatial-resolution topographic data (i.e., DEM, land use, and soil), for flood inundation mapping, performs well.
- The flood hydrographs produced from event-based runoff estimation by the SCS curve number method displayed suitable results for application to peak storm events.
- The Kesem dam, from the empirical dam break simulations, shows possible failure for the 100- and 200-year return period inflows, whereas the dam remains safe for inflows up to the 50-year return period. This may indicate user-defined breaching, with the HEC-RAS models determining the dam breach time and dimension depending on the breach trigger inputs, such as inflow boundary conditions.
- The 2D flood map provides a satisfactory spatial and temporal resolution result for the inundated area. Furthermore, 2D flood mapping can be used to better understand the flood inundation extent of any type of flood.
Author Contributions
Conceptualization, methodology, investigation, resources, data curation, writing original draft preparation, validation, software and formal analysis: M.G.T.; writing—review and editing, supervision and project administration: Y.C.; conceptualization and funding acquisition: K.J. All authors have read and agreed to the published version of the manuscript.
Funding
This research was done under the scholarship funded by the Korea International Cooperation Agency (KOICA).
Data Availability Statement
The data presented in this study are available on request from the first author. The data are not publicly available due to restrictions from the raw data providers.
Acknowledgments
We would like to acknowledge to all the support from the KOICA and the graduate school of water resources at Sungkyunkwan University. The author thanks K-water and the USACE for training in the HEC-RAS 2-D flood modeling.
Conflicts of Interest
The authors declare no conflict of interest.
References
- Cannata, M.; Marzocchi, R. Two-dimensional dam break flooding simulation: A GIS-embedded approach. Nat. Hazards 2012, 61, 1143–1159. [Google Scholar] [CrossRef]
- Science Engineering & Sustainability. 2019. Dam Break Simulation with HEC-RAS: Chepete Proposed Dam. Available online: https://sciengsustainability.blogspot.com/2019/03/dam-break-simulation-hec-ras.html (accessed on 5 May 2019).
- Koskinas, A.; Tegos, A.; Tsira, P.; Dimitriadis, P.; Iliopoulou, T.; Papanicolaou, P.; Koutsoyiannis, D.; Williamson, T. Insights into the Oroville Dam 2017 Spillway Incident. Geosciences 2019, 9, 37. [Google Scholar] [CrossRef] [Green Version]
- Rotta, L.H.; Alcantara, E.; Park, E.; Negri, R.G.; Lin, Y.N.; Bernardo, N.; Mendes, T.S.; Souza Filho, C.R. The 2019 Brumadinho tailings dam collapse: Possible cause and impacts of the worst human and environmental disaster in Brazil. Int. J. Appl. Earth Obs. Geoinf. 2020, 90, 102119. [Google Scholar] [CrossRef]
- Latrubesse, E.M.; Park, E.; Sieh, K.; Dang, T.; Lin, Y.N.; Yun, S.H. Dam failure and a catastrophic flood in the Mekong basin (Bolaven Plateau), southern Laos, 2018. Geomorphology 2020, 362, 107221. [Google Scholar] [CrossRef]
- Dave, P. Hidroituango: Another Landslide Crisis at a Hydroelectric Dam. The Landslide Blog, AGU. 2018. Available online: https://blogs.agu.org/landslideblog/2018/05/21/hidroituango-1/ (accessed on 5 April 2019).
- Aljazeera News. 2018. Search for Survivors after Deadly Kenya Dam Collapse. Available online: https://www.aljazeera.com/news/2018/05/search-survivors-deadly-kenya-dam-collapse-180511054548148.html (accessed on 5 May 2019).
- Zin, W.W.; Kawasaki, A.; Takeuchi, W.; San, Z.M.L.T.; Htun, K.Z.; Aye, T.H.; Win, S. Flood hazard assessment of Bago River Basin, Myanmar. J. Disaster Res. 2018, 13, 14–21. [Google Scholar] [CrossRef]
- Mao, J.; Wang, S.; Ni, J.; Xi, C.; Wang, J. Management System for Dam-Break Hazard Mapping in a Complex Basin Environment. ISPRS Int. J. Geo-Inf. 2017, 6, 162. [Google Scholar] [CrossRef] [Green Version]
- Rodrigues, A.S.; Santos, M.A.; Santos, A.D.; Rocha, F. Dam-break flood emergency management system. Water Resour. Manag. 2002, 16, 489–503. [Google Scholar] [CrossRef]
- Tsakiris, G.D. Flood risk assessment: Concepts, modelling, applications. Nat. Hazards Earth Syst. Sci. 2014, 14, 1361–1369. [Google Scholar] [CrossRef] [Green Version]
- Urzică, A.; Mihu-Pintilie, A.; Stoleriu, C.C.; Cîmpianu, C.I.; Huţanu, E.; Pricop, C.I.; Grozavu, A. Using 2D HEC-RAS Modeling and Embankment Dam Break Scenario for Assessing the Flood Control Capacity of a Multi-Reservoir System (NE Romania). Water 2020, 13, 57. [Google Scholar] [CrossRef]
- Albu, L.-M.; Enea, A.; Iosub, M.; Breabăn, I.-G. Dam Breach Size Comparison for Flood Simulations. A HEC-RAS Based, GIS Approach for Drăcșani Lake, Sitna River, Romania. Water 2020, 12, 1090. [Google Scholar] [CrossRef]
- Cho, Y. Application of NEXRAD Radar-Based Quantitative Precipitation Estimations for Hydrologic Simulation Using ArcPy and HEC Software. Water 2020, 12, 273. [Google Scholar] [CrossRef] [Green Version]
- Tahmasbinejad, H.; Feyzolahpour, M.; Mumipour, M.; Zakerhoseini, F. Rainfall-runoff Simulation and Modeling of Karon River Using HEC-RAS and HEC-HMS Models, Izeh District, Iran. J. Appl. Sci. 2012, 12, 1900–1908. [Google Scholar] [CrossRef] [Green Version]
- Horritt, M.; Bates, P. Evaluation of 1D and 2D numerical models for predicting river flood inundation. J. Hydrol. 2002, 268, 87–99. [Google Scholar] [CrossRef]
- Jayakrishnan, R.; Srinivasan, R.; Arnold, J. Comparison of raingage and WSR-88D Stage III precipitation data over the Texas-Gulf basin. J. Hydrol. 2004, 292, 135–152. [Google Scholar] [CrossRef]
- CEIWR-HEC. HEC-RAS, River Analysis System: Hydraulic Reference Manual; US Army Corps of Engineers Hydrologic Engineering Center: Davis, CA, USA, 2016. [Google Scholar]
- Bhandari, M.; Nyaupane, N.; Mote, S.R.; Kalra, A.; Ahmad, S. 2D Unsteady Flow Routing and Flood Inundation Mapping for Lower Region of Brazos River Watershed. In World Environmental and Water Resources Congress 2017; Digital Scholarship@UNLV: Sacramento, CA, USA, 2017; pp. 292–303. [Google Scholar] [CrossRef]
- Brunner, M.I.; Seibert, J.; Favre, A. Bivariate return periods and their importance for flood peak and volume estimation. Wiley Interdiscip. Rev. Water 2016, 3, 819–833. [Google Scholar] [CrossRef] [Green Version]
- Yang, Z.; Chen, W.-P. Earthquakes along the East African Rift System: A multiscale, system-wide perspective. J. Geophys. Res. Solid Earth 2010, 115. [Google Scholar] [CrossRef]
- Ayele, A.; Ebinger, C.J.; van Alstyne, C.; Keir, D.; Nixon, C.W.; Belachew, M.; Hammond, J.O.S. Seismicity of the central Afar rift and implications for Tendaho dam hazards. Geol. Soc. Lond. Spéc. Publ. 2016, 420, 341–354. [Google Scholar] [CrossRef] [Green Version]
- Yared, M.G.; Nigussie, T.; Yohannis, B.T. Dam Breach Modeling and Flood Inundation Mapping a Case Study on Kesem Dam. ACADEMIA. 2016. Available online: https://www.academia.edu/27150269/Dam_Breach_Modelling_and_Flood_Inundation_Mapping_A_Case_Study_on_Kesem_Dam (accessed on 5 May 2019).
- CEIWR-HEC; HEC-HMS. Hydrological Modeling System: Application Guide; US Army Corps of Engineers Hydrologic Engineering Center: Davis, CA, USA, 2017; pp. 3.1–3.19. [Google Scholar]
- MoWIE, Kesem Kebena Dam and Irrigation Project Final Feasibility study and Dam Design Report. Available online: http://www.fao.org/3/ar867e/ar867e.pdf (accessed on 12 April 2019).
- Ross, C.W.; Prihodko, L.; Anchang, J.; Kumar, S.; Ji, W.J.; Hanan, N.P. HYSOGs250m, global gridded hydrologic soil groups for curve-number-based runoff modeling. Sci. Data 2018, 5, 180091. [Google Scholar] [CrossRef] [PubMed]
- USDA NRCS. Urban Hydrology for Small Watersheds; US Dept. of Agriculture, Soil Conservation Service, Engineering Division: Washington, DC, USA, 1986.
- National Catalog Service for Geographic Information. Globeland30. Available online: http://www.webmap.cn/main.do?method=index (accessed on 3 February 2019).
- Subyani, A.M. Hydrologic behavior and flood probability for selected arid basins in Makkah area, western Saudi Arabia. Arab. J. Geosci. 2011, 4, 817–824. [Google Scholar] [CrossRef]
- CEIWR-HEC. Hydrologic Modeling System HEC-HMS, Technical Reference Manual; U.S. Army Corps of Engineers, Hydrologic Engineering Center (HEC): Davis, CA, USA, 2000. [Google Scholar]
- Maidment, D.R.; Morehouse, S. Arc Hydro: GIS for Water Resources; ESRI, Inc.: Redlands, CA, USA, 2002. [Google Scholar]
- CEIWR-HEC; HEC-GeoHMS. Geospatial Hydrologic Modeling Extension: Hydraulic Reference Manual; US Army Corps of Engineers Hydrologic Engineering Center: Davis, CA, USA, 2013. [Google Scholar]
- Getahun, Y.S.; Gebre, S.L. Flood hazard assessment and mapping of flood inundation area of the Awash River basin in Ethiopia using GIS and HEC-GeoRAS/HEC-RAS model. J. Civ. Environ. Eng. 2015, 5, 1. [Google Scholar] [CrossRef]
- Behailu, S. Stream Flow Simulation for the Upper Awash Basin. Ph.D. Thesis, Faculty of Technology Department of Civil Engineering, Addis Ababa University, Addis Ababa, Ethiopia, 2004. [Google Scholar]
- Kisi, O.; Shiri, J.; Tombul, M. Modeling rainfall-runoff process using soft computing techniques. Comput. Geosci. 2013, 51, 108–117. [Google Scholar] [CrossRef]
- CEIWR-HEC; HEC-GeoRAS. GIS Tools for Support of HEC-RAS Using ArcGIS. [Online] Version 4.3.93; US Army Corps of Engineers, Institute of water Resources: Davis, CA, USA, 2011. [Google Scholar]
- Froehlich, D.C. Embankment Dam Breach Parameters and Their Uncertainties. J. Hydraul. Eng. 2008, 134, 1708–1721. [Google Scholar] [CrossRef]
- Wahl, T. Evaluation of Erodibility-Based Embankment Dam Breach Equations (Hydraulic Laboratory Report HL-2014-02); US Department of the Interior Bureau of Reclamation: Denver, CO, USA, 2014; p. 99.
- Thornton, C.I.; Pierce, M.W.; Abt, S.R. Enhanced Predictions for Peak Outflow from Breached Embankment Dams. J. Hydrol. Eng. 2011, 16, 81–88. [Google Scholar] [CrossRef]
- Yu, D.; Lane, S.N. Urban fluvial flood modelling using a two-dimensional diffusion-wave treatment, part 1: Mesh resolution effects. Hydrol. Process. 2005, 20, 1541–1565. [Google Scholar] [CrossRef]
- Chow, V.T. Open-Channel Hydraulics; McGraw-Hill Civil Engineering Series; McGraw-Hill Book Company Inc.: New York, NY, USA, 1959. [Google Scholar]
- Michaud, J.; Johnson, C.; Iokepa, J.; Marohnic, J. Methods for Estimating the Impact of Hypothetical Dam Break Floods. In Chemistry for the Protection of the Environment; Springer: Boston, MA, USA, 2005; pp. 195–199. [Google Scholar] [CrossRef]
- Onyutha, C.; Tabari, H.; Taye, M.T.; Nyandwaro, G.N.; Willems, P. Analyses of rainfall trends in the Nile River Basin. J. Hydro-Environ. Res. 2016, 13, 36–51. [Google Scholar] [CrossRef]
- Basheer, T.A.; Wayayok, A.; Yusuf, B.; Kamal, M. Dam Breach parameters and their influence on flood hydrographs for Mosul Dam. J. Eng. Sci. Technol. 2017, 12, 2896–2908. [Google Scholar]
- Awal, R.; Nakagawa, H.; Kawaike, K.; Baba, Y.; Zhang, H. Experimental study on piping failure of natural dam. J. Jpn. Soc. Civ. Eng. Ser. B1 Hydraul. Eng. 2011, 67, I_157–I_162. [Google Scholar] [CrossRef] [Green Version]
- Psomiadis, E.; Tomanis, L.; Kavvadias, A.; Soulis, K.; Charizopoulos, N.; Michas, S. Potential Dam Breach Analysis and Flood Wave Risk Assessment Using HEC-RAS and Remote Sensing Data: A Multicriteria Approach. Water 2021, 13, 364. [Google Scholar] [CrossRef]
- Wu, M.; Ge, W.; Li, Z.; Wu, Z.; Zhang, H.; Li, J.; Pan, Y. Improved Set Pair Analysis and Its Application to Environmental Impact Evaluation of Dam Break. Water 2019, 11, 821. [Google Scholar] [CrossRef] [Green Version]
Figure 1.
Locations and characteristics of the study area: (a) Ethiopian river basins and the Kesem watershed in the Awash river basin; (b) elevation, Hydro-Met observation stations, and Kesem dam location; (c) hydrologic soil group; and (d) land-use map of the Kesem watershed.
Figure 1.
Locations and characteristics of the study area: (a) Ethiopian river basins and the Kesem watershed in the Awash river basin; (b) elevation, Hydro-Met observation stations, and Kesem dam location; (c) hydrologic soil group; and (d) land-use map of the Kesem watershed.

Figure 2.
Overall procedures of our modeling work.

Figure 3.
Dimensions of a trapezoidal dam breach approximation (Froehlich, 2008).

Figure 4.
Frequency analysis using Gumbel frequency factors (Kesem, 2006 to 2015).

Figure 5.
Depth duration frequency (DDF) for the Kesem watershed with rainfall estimation of seven return periods.
Figure 5.
Depth duration frequency (DDF) for the Kesem watershed with rainfall estimation of seven return periods.

Figure 6.
Annual monthly average flow at the Kesem Arerti station from 2006 to 2015.

Figure 7.
Model calibration and validation results: hydrographs of storm events after calibration in (a) 2012, (b) 2013, and (c) 2016; and validation in (d) 2014 and (e) 2015.
Figure 7.
Model calibration and validation results: hydrographs of storm events after calibration in (a) 2012, (b) 2013, and (c) 2016; and validation in (d) 2014 and (e) 2015.

Figure 8.
Reservoir flood inflow hydrographs for different return periods of the designed storm.

Figure 9.
Hydraulic model outputs of inundation areas for various return periods: (a) the main infrastructure and flooded area locations; and the (b) 50-year, (c) 100-year, and (d) 200-year return periods.
Figure 9.
Hydraulic model outputs of inundation areas for various return periods: (a) the main infrastructure and flooded area locations; and the (b) 50-year, (c) 100-year, and (d) 200-year return periods.

Figure 10.
Maximum velocity of flood flow from the dam in the cases of (a) 100-year and (b) 200-year return period inflows.
Figure 10.
Maximum velocity of flood flow from the dam in the cases of (a) 100-year and (b) 200-year return period inflows.


Table 1.
Land-use classifications and corresponding areas in the Kesem watershed.
| Land Use | Contents | Area (km2) |
|---|---|---|
| Agriculture | Land used for agriculture, horticulture and gardens | 2242.7 |
| Bare land | Land covered by natural grass, shrubs and with vegetation less than 10% | 1095.9 |
| Forest | Land covered with trees, with vegetation cover over 30% | 148.8 |
| Built-up | Lands modified by human activities | 11.1 |
| Water | Water bodies in the land area | 1.4 |
Table 2.
List of selected meteorological and hydrological gauge stations.
| Type | Name | Latitude (Decimal Degrees) | Longitude (Decimal Degrees) | Period (Years) |
|---|---|---|---|---|
| Precipitation | Addis Ababa | 9.02 | 38.77 | 2012–2018 |
| Precipitation | Metehara | 8.86 | 39.92 | 2012–2018 |
| Precipitation | Debre Birhan | 9.63 | 39.50 | 2012–2018 |
| Stream flow | Kesem Arerti | 9.04 | 39.56 | 2012–2018 |
Table 3.
Major parameter indices after calibration and validation with optimized parameter values.
| Type | Storm Event Period | NSE | MAE | RMSE | R2 | PBIAS |
|---|---|---|---|---|---|---|
| Calibration | 16–19 August 2012 | 0.81 | 75.45 | 117.63 | 0.90 | 22.36 |
| 22–24 August 2013 | 0.50 | 66.51 | 130.25 | 0.66 | −20.34 | |
| 22–24 August 2016 | −0.30 | 109.79 | 179.80 | 0.21 | −39.74 | |
| Validation | 7–9 August 2014 | 0.61 | 21.19 | 86.51 | 0.64 | −9.01 |
| 18–20 August 2015 | 0.75 | 94.92 | 171.33 | 0.86 | 35.24 |
Table 4.
Main information on inundated areas from the results.
| Return Period | Inundation Area (km2) | Depth (m) | Duration (h) | ||
|---|---|---|---|---|---|
| Maximum | Mean | Maximum | Mean | ||
| 100 years | 208 | 20.06 | 2.04 | 46 | 10 |
| 200 years | 240 | 31.20 | 2.84 | 93 | 39 |
Publisher’s Note: MDPI stays neutral with regard to jurisdictional claims in published maps and institutional affiliations. |
© 2021 by the authors. Licensee MDPI, Basel, Switzerland. This article is an open access article distributed under the terms and conditions of the Creative Commons Attribution (CC BY) license (https://creativecommons.org/licenses/by/4.0/).
Share and Cite
MDPI and ACS Style
Tedla, M.G.; Cho, Y.; Jun, K. Flood Mapping from Dam Break Due to Peak Inflow: A Coupled Rainfall–Runoff and Hydraulic Models Approach. Hydrology 2021, 8, 89. https://0-doi-org.brum.beds.ac.uk/10.3390/hydrology8020089
AMA Style
Tedla MG, Cho Y, Jun K. Flood Mapping from Dam Break Due to Peak Inflow: A Coupled Rainfall–Runoff and Hydraulic Models Approach. Hydrology. 2021; 8(2):89. https://0-doi-org.brum.beds.ac.uk/10.3390/hydrology8020089
Chicago/Turabian StyleTedla, Mihretab G., Younghyun Cho, and Kyungsoo Jun. 2021. "Flood Mapping from Dam Break Due to Peak Inflow: A Coupled Rainfall–Runoff and Hydraulic Models Approach" Hydrology 8, no. 2: 89. https://0-doi-org.brum.beds.ac.uk/10.3390/hydrology8020089
Note that from the first issue of 2016, this journal uses article numbers instead of page numbers. See further details here.