Article

Application of GIS Techniques in Identifying Artificial Groundwater Recharging Zones in Arid Regions: A Case Study in Tissamaharama, Sri Lanka

by
Tiran Kariyawasam
1,
Vindhya Basnayake
1,
Susantha Wanniarachchi
1,
Ranjan Sarukkalige
2 and
Upaka Rathnayake
1,*
1
Department of Civil Engineering, Faculty of Engineering, Sri Lanka Institute of Information Technology, Malabe 10115, Sri Lanka
2
School of Civil and Mechanical Engineering, Faculty of Science and Engineering, Curtin University, Perth, WA 6102, Australia
*
Author to whom correspondence should be addressed.
Submission received: 15 November 2022 / Revised: 7 December 2022 / Accepted: 8 December 2022 / Published: 10 December 2022

Abstract

:
Groundwater resources are severely threatened not only in terms of their quality but also their quantity. The availability of groundwater in arid regions is highly important as it caters to domestic needs, irrigation, and industrial purposes in those areas. With the increasing population and human needs, artificial recharging of groundwater has become an important topic because of rainfall scarcity, high evaporation, and shortage of surface water resources in arid regions. However, this has been given the minimum attention in the context of Sri Lanka. Therefore, the current research was carried out to demarcate suitable sites for the artificial recharging of aquifers with the help of geographic information system (GIS) techniques, in one of the water-scarce regions in Sri Lanka. Tissamaharama District Secretariat Division (DSD) is located in Hambanthota district. This region faces periodic water stress with a low-intensity seasonal rainfall pattern and a lack of surface water sources. Hydrological, geological, and geomorphological parameters such as rainfall, soil type, slope, drainage density, and land use patterns were considered to be the most influential parameters in determining the artificial recharging potential in the study area. The GIS tools were used to carry out a weighted overlay analysis to integrate the effects of each parameter into the potential for artificial groundwater recharge. The result of the study shows that 14.60% of the area in the Tissamaharama DSD has a very good potential for artificial groundwater recharge, while 41.32% has a good potential and 39.03% and 5.05% have poor and very poor potential for artificial groundwater recharge, respectively. The southern part of the DSD and the Yala nature reserve areas are observed to have a higher potential for artificial groundwater recharge than the other areas of Tissamaharama DSD. It is recommended to test the efficiency and effects of groundwater recharge using groundwater models by simulating the effects of groundwater recharge in future studies. Therefore, the results of the current research will be helpful in effectively managing the groundwater resources in the study area.

1. Introduction

Water is considered the most precious and essential resource on the planet earth. A total of 1386 trillion liters is estimated as the total volume of water resources on earth. Of the total water volume, 97% is salt water, 3% is classified as freshwater, and only 0.6% is available as groundwater [1]. Groundwater is the water that exists underground in saturated zones below the land surface inside aquifers [2]. Principally, the recharging of groundwater resources is accomplished by surface water and rainfall. [3]. However, Sri Lanka is an island rich in both surface water and groundwater resources. There are 103 major rivers and a significant number of irrigation projects that cover 4363.85 km2 of the country [4]. Importantly, these water bodies are interrelated; thus, groundwater is a critical source. An aquifer can be defined as the geological formation of porous rocks or sediment that is saturated with groundwater. The natural replenishment of groundwater is due to the precipitation and percolation of surface water into underground aquifers [5]. Generally, groundwater has a slow movement of 7 cm to 60 cm per day.
Arid regions that cover about 35% of the land surface of the earth are characterized by a lack of water, averting or hindering the growth of the life of fauna and flora [6]. The scarcity of rainfall and the high evaporation rate is the basis for the existence of arid regions. Groundwater is the main source of water in such regions. Overexploitation of groundwater or extracting extensive amounts of groundwater from aquifers results in the depletion of the existing groundwater resources. As a result, stream and well-water levels drop, the availability of water in surface water bodies reduces, the water quality may deteriorate, and further, it can create subsequent land subsidence caused by the drop in the groundwater table [7,8].
Since it is difficult to directly observe groundwater resources, monitoring, modeling, and mapping are highly important for managing these resources [6]. To use these natural resources sustainably by alleviating the problem of groundwater depletion, extraction needs to be carried out together with artificial recharging [1]. Artificial groundwater recharge is the process of enhancing/accelerating the groundwater replenishment rate with human intervention, improving the recharging rate under natural conditions. There are two main types of artificial recharging methods for groundwater: direct (surface and sub-surface) and indirect methods. In the direct method, water is supplied to the aquifers by surface or subsurface technologies, where water artificially fills basins, furrows, ditches, percolation tanks, streams, or by using subsurface techniques such as injection wells, recharge pits, and shafts, dug wells, boreholes, and natural openings. In the indirect methods, the aquifers are modified or recharged by surface water sources [7]. Therefore, the identification of suitable sites for the artificial recharging of groundwater is very important in groundwater management.
In Sri Lanka, an arid climate and related environmental characteristics can be seen in Hambantota in the southern part of the island and Puttalam in the northwestern part of the island. The principal factors that affect artificial groundwater recharge are the quantity of source water, the quality of source water with required pre-treatments, clogging potential and transmission, and characteristics of the aquifer [2]. Many studies have been [5,9,10,11,12,13,14,15] carried out to identify potential recharging zones in arid regions of many parts of the world. However, only a limited number of studies [1,2,16] that were carried out to identify potential areas for artificial groundwater recharge can be found in the context of Sri Lanka. Therefore, the current study aimed to identify tpotential sites for artificial groundwater recharge using available meteorological, geological, and geophysical data with the help of GIS techniques.

2. GIS Applications in Groundwater Studies

Geographic information systems (GIS) are helpful mapping tools that can be beneficial in carrying out geospatial analysis in many research fields. GIS tools have the capacity to efficiently solve problems that need the integration of several spatially referenced data [5]. Several studies have adopted GIS tools in geospatial analyses related to groundwater quality assessment [17,18,19], groundwater pollution hazard and risk analyses [20,21], and artificial recharge potential [5,7,9,10,11,13,14,22]. In some studies, researchers [14,15,23] have taken advantage of integrating remote sensing and GIS tools to perform groundwater-related analyses.
Adimalla and Taloor [17] used the groundwater quality index (GWQI) method within a GIS environment to manipulate groundwater quality data and analyze the geospatial variation of groundwater quality in a hard rock terrain of the Medak region in Telangana State, which is located in South India. A similar study has been performed by Babiker et al. [18] to estimate the spatial variation of water quality in Nasuno basin, in Japan, using a GIS-based groundwater quality index. Nas and Berktay [19] adopted GIS and geostatistics techniques to assess the spatial distribution of groundwater quality in Konya City in Turkey. Further, Baalousha [20] used GIS tools together with a groundwater flow model to map the risk of groundwater contamination in the Gaza Strip in Palestine. Many of the groundwater studies are focused on the identification of groundwater recharge potential zones. A study was undertaken by Prabhu and Venkateswaran [5] to delineate the groundwater potential zones in the Sarabanga sub-basin of the Cauvery River, Tamil Nadu, using the weighted overlay analysis technique employed within a GIS environment. Rajasekhar et al. [9] evaluated different decision-making approaches (i.e., fuzzy logic (FL), analytical hierarchy process (AHP), and integrated fuzzy-AHP techniques) in identifying the groundwater potential zones in the Jilledubanderu River Basin, India, with the help of GIS techniques. A similar study was undertaken by Biswajit and Subodh Chandra to identify artificial groundwater recharging potential for the critical Goghat-II block of West Bengal, India, with combined GIS and fuzzy-AHP methods.
The method of the current study was proposed based on the knowledge gained through this literature and considering the applicability of those methods to the selected study area.

3. Case study Application
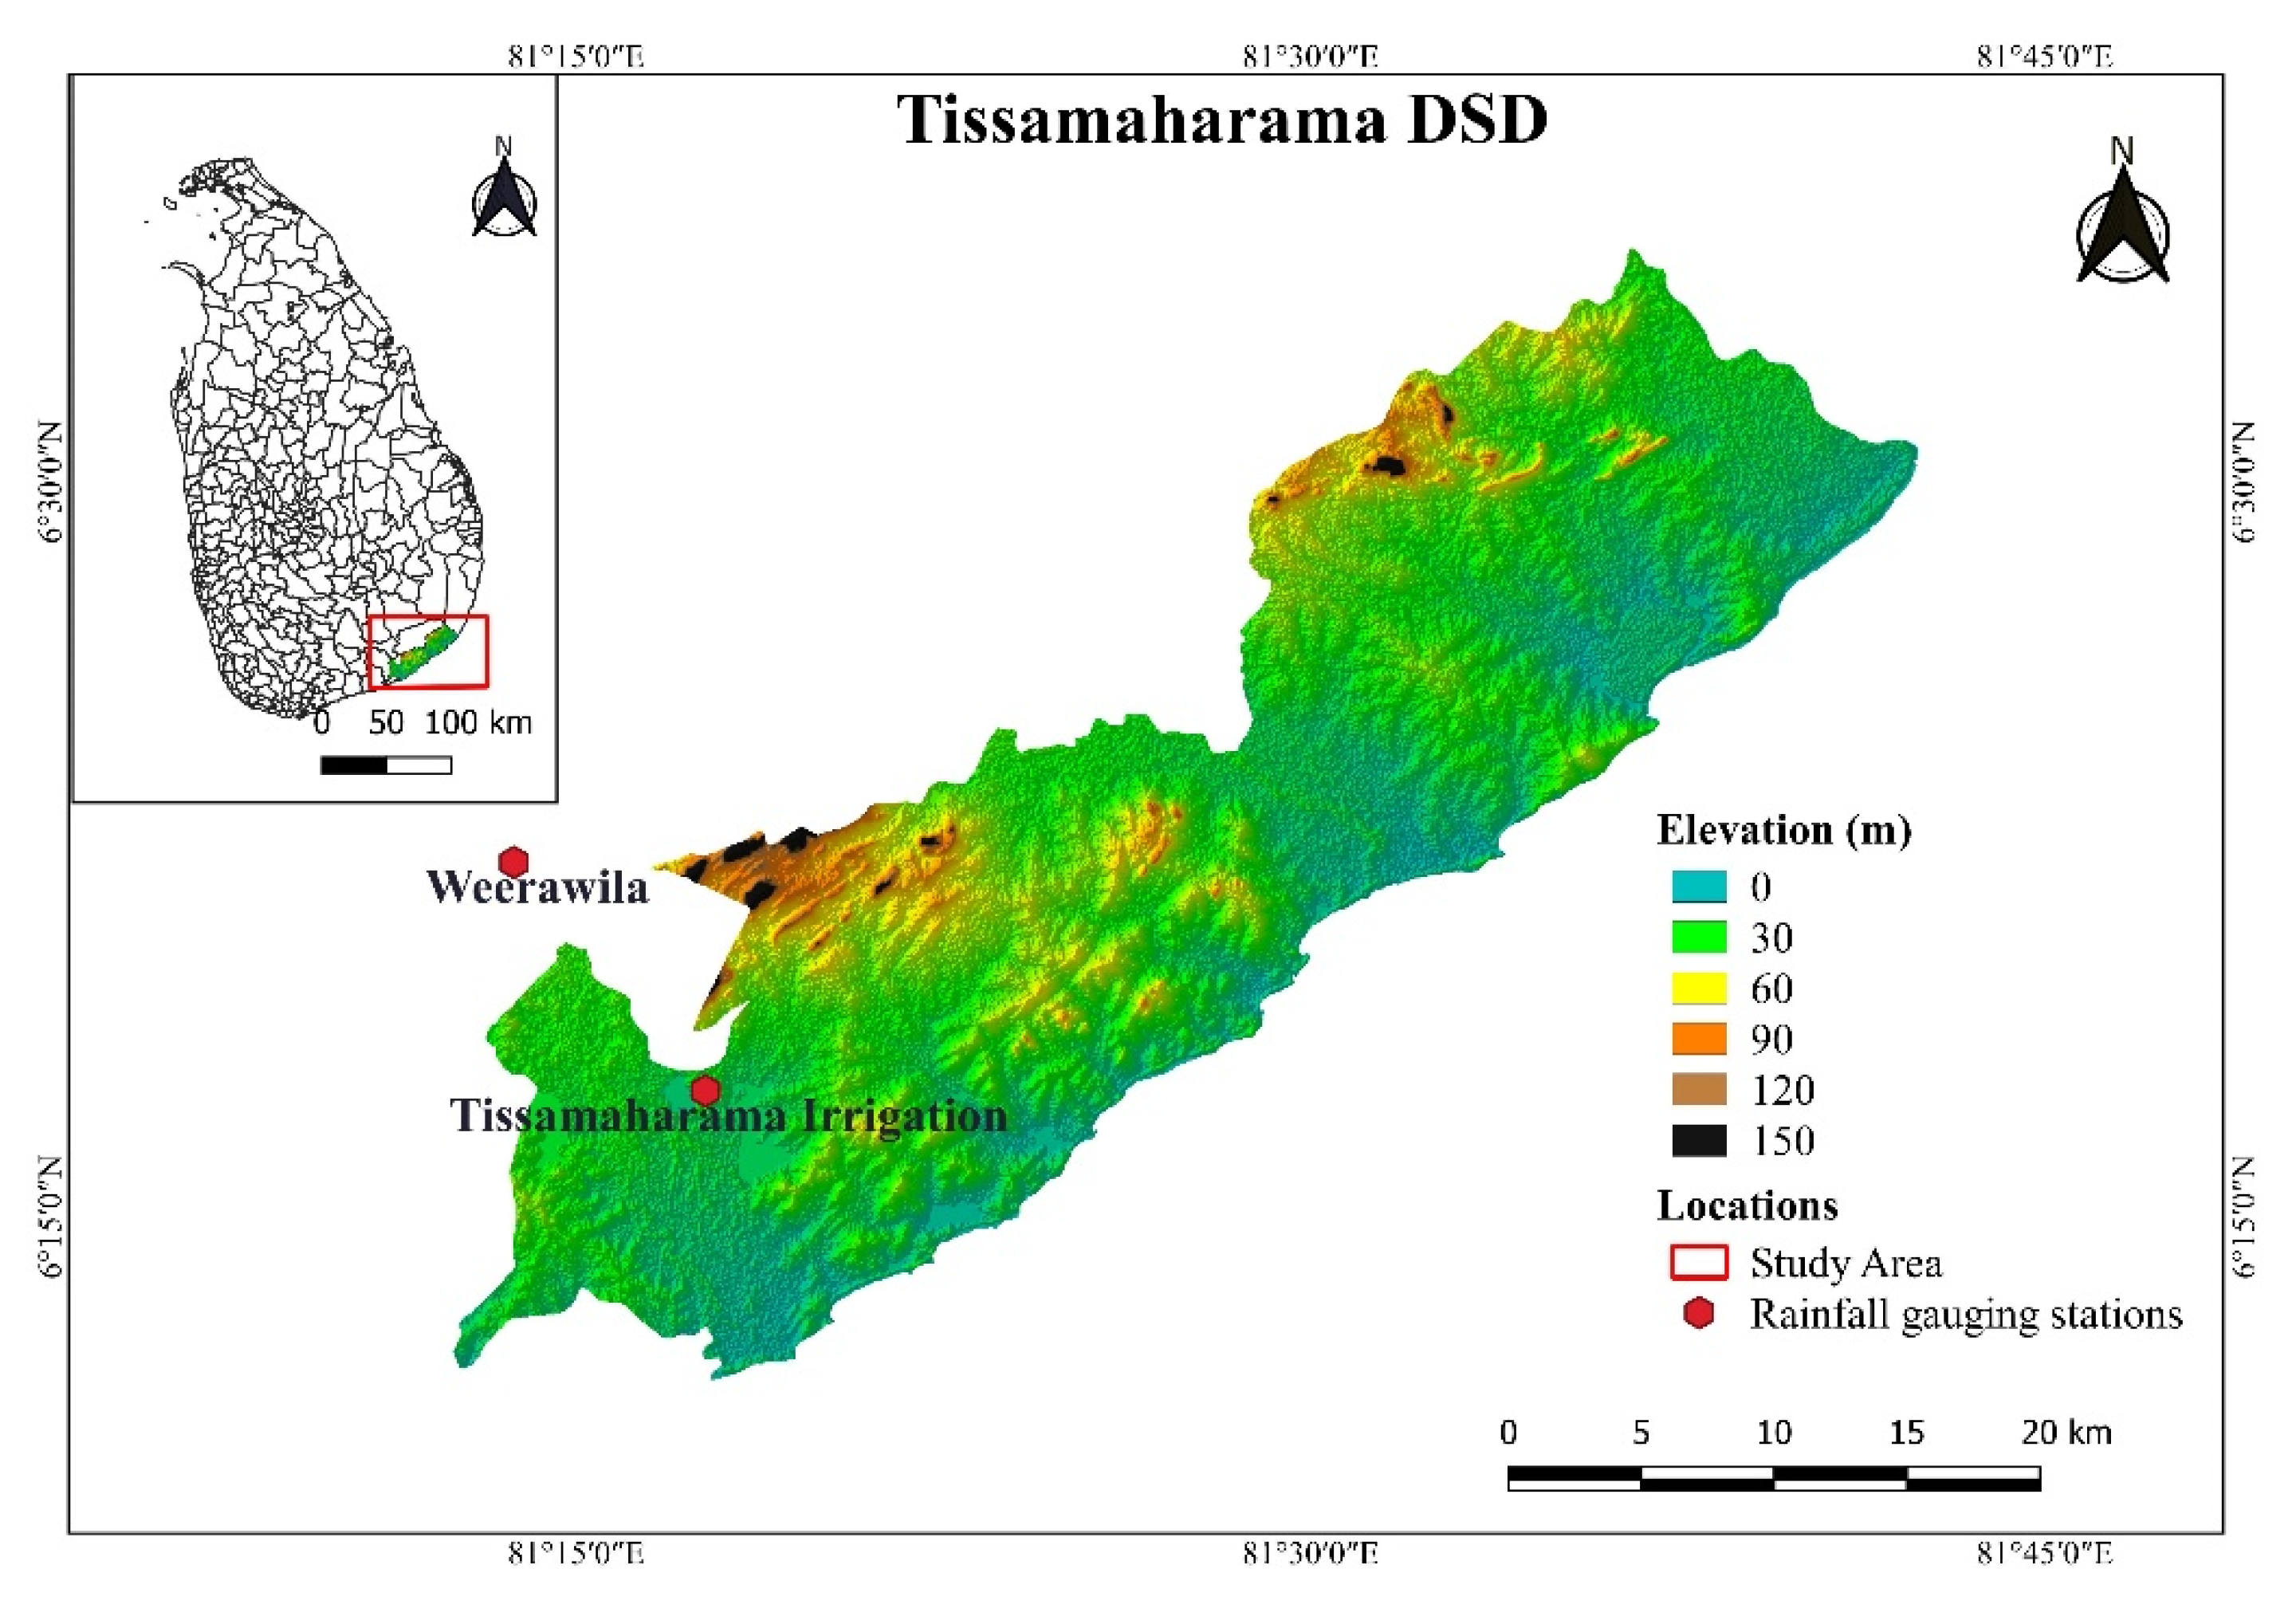
3.1. Study Area

This study was carried out focusing on Tissamaharama Divisional Secretariat Division (DSD) located in the Hambantota district of the Southern province of Sri Lanka, covering a 421 km2 area. The area receives an average annual rainfall of about 950–1100 mm, and the average temperature of the area ranges from 27 to 32 °C. Two main rivers flow through this area: Kirindi Oya and Manika Ganga. The Weerawila tank, Tissa tank, and Yoda tank are the largest surface water reservoirs in the study area. When we consider the land use, most parts of Tissamaharama DSD are covered with forests and croplands, and the topography of the area consists of mostly flat terrain where the elevations are less than 30 m from the mean sea level (MSL). The location and the topography of the study area are illustrated in Figure 1.

3.2. Rainfall Data

Rainfall is a key parameter when delineating the groundwater recharge potentiality zone. Therefore, it is necessary to understand the spatio-temporal distribution of rain in the study area. When observing the spatial distribution of rainfall, it is clear that the southwestern part of the Tissamaharama DSD, which is adjacent to the wet zone boundary, and the eastern part in the Yala National Park receive higher rainfall (1000–1100 mm) with the south-west and north-east monsoonal effects. The central hilly terrain receives less rainfall (900–950 mm). Even though it is a minor difference, rainfall is still an important controlling factor as it is the main input to the water balance of the study area. Daily rainfall data were obtained from the Department of Meteorology, Sri Lanka for the period from 2010 to 2019 for the Tissamaharama DSD. There are two rain gauging stations available within the study area, namely the Tissamaharama irrigation gauging station and the Weerawila rain gauging station. These daily rainfall values were used in calculating the average annual rainfall values for the considered period. Table 1 gives the location of these two rain gauges.

3.3. Digital Elevation Model (DEM)

The groundwater level variations are likely to depend on the topography and are regulated by the geomorphological processes [24] To illustrate the effect of the topography, a satellite-derived digital elevation model (DEM) with a 30 m resolution (30 m × 30 m pixel size) was obtained from the USGS Earth Explorer [25] website and this was used as the elevation data source for the study. This raster data set was processed within the GIS environment to derive the slope, which is represented in degrees (°) based on the elevation. The slope is a critical parameter that controls the availability and flow of groundwater. Six slope classes were derived from gentle slope to steep slope, where high groundwater recharging potential was observed in gentle slope and vice versa. Additionally, drainage density was identified as another important parameter that correlated with groundwater recharge, where high drainage density facilitates a high level of groundwater recharge. DEM was used to delineate the drainage density in the area.

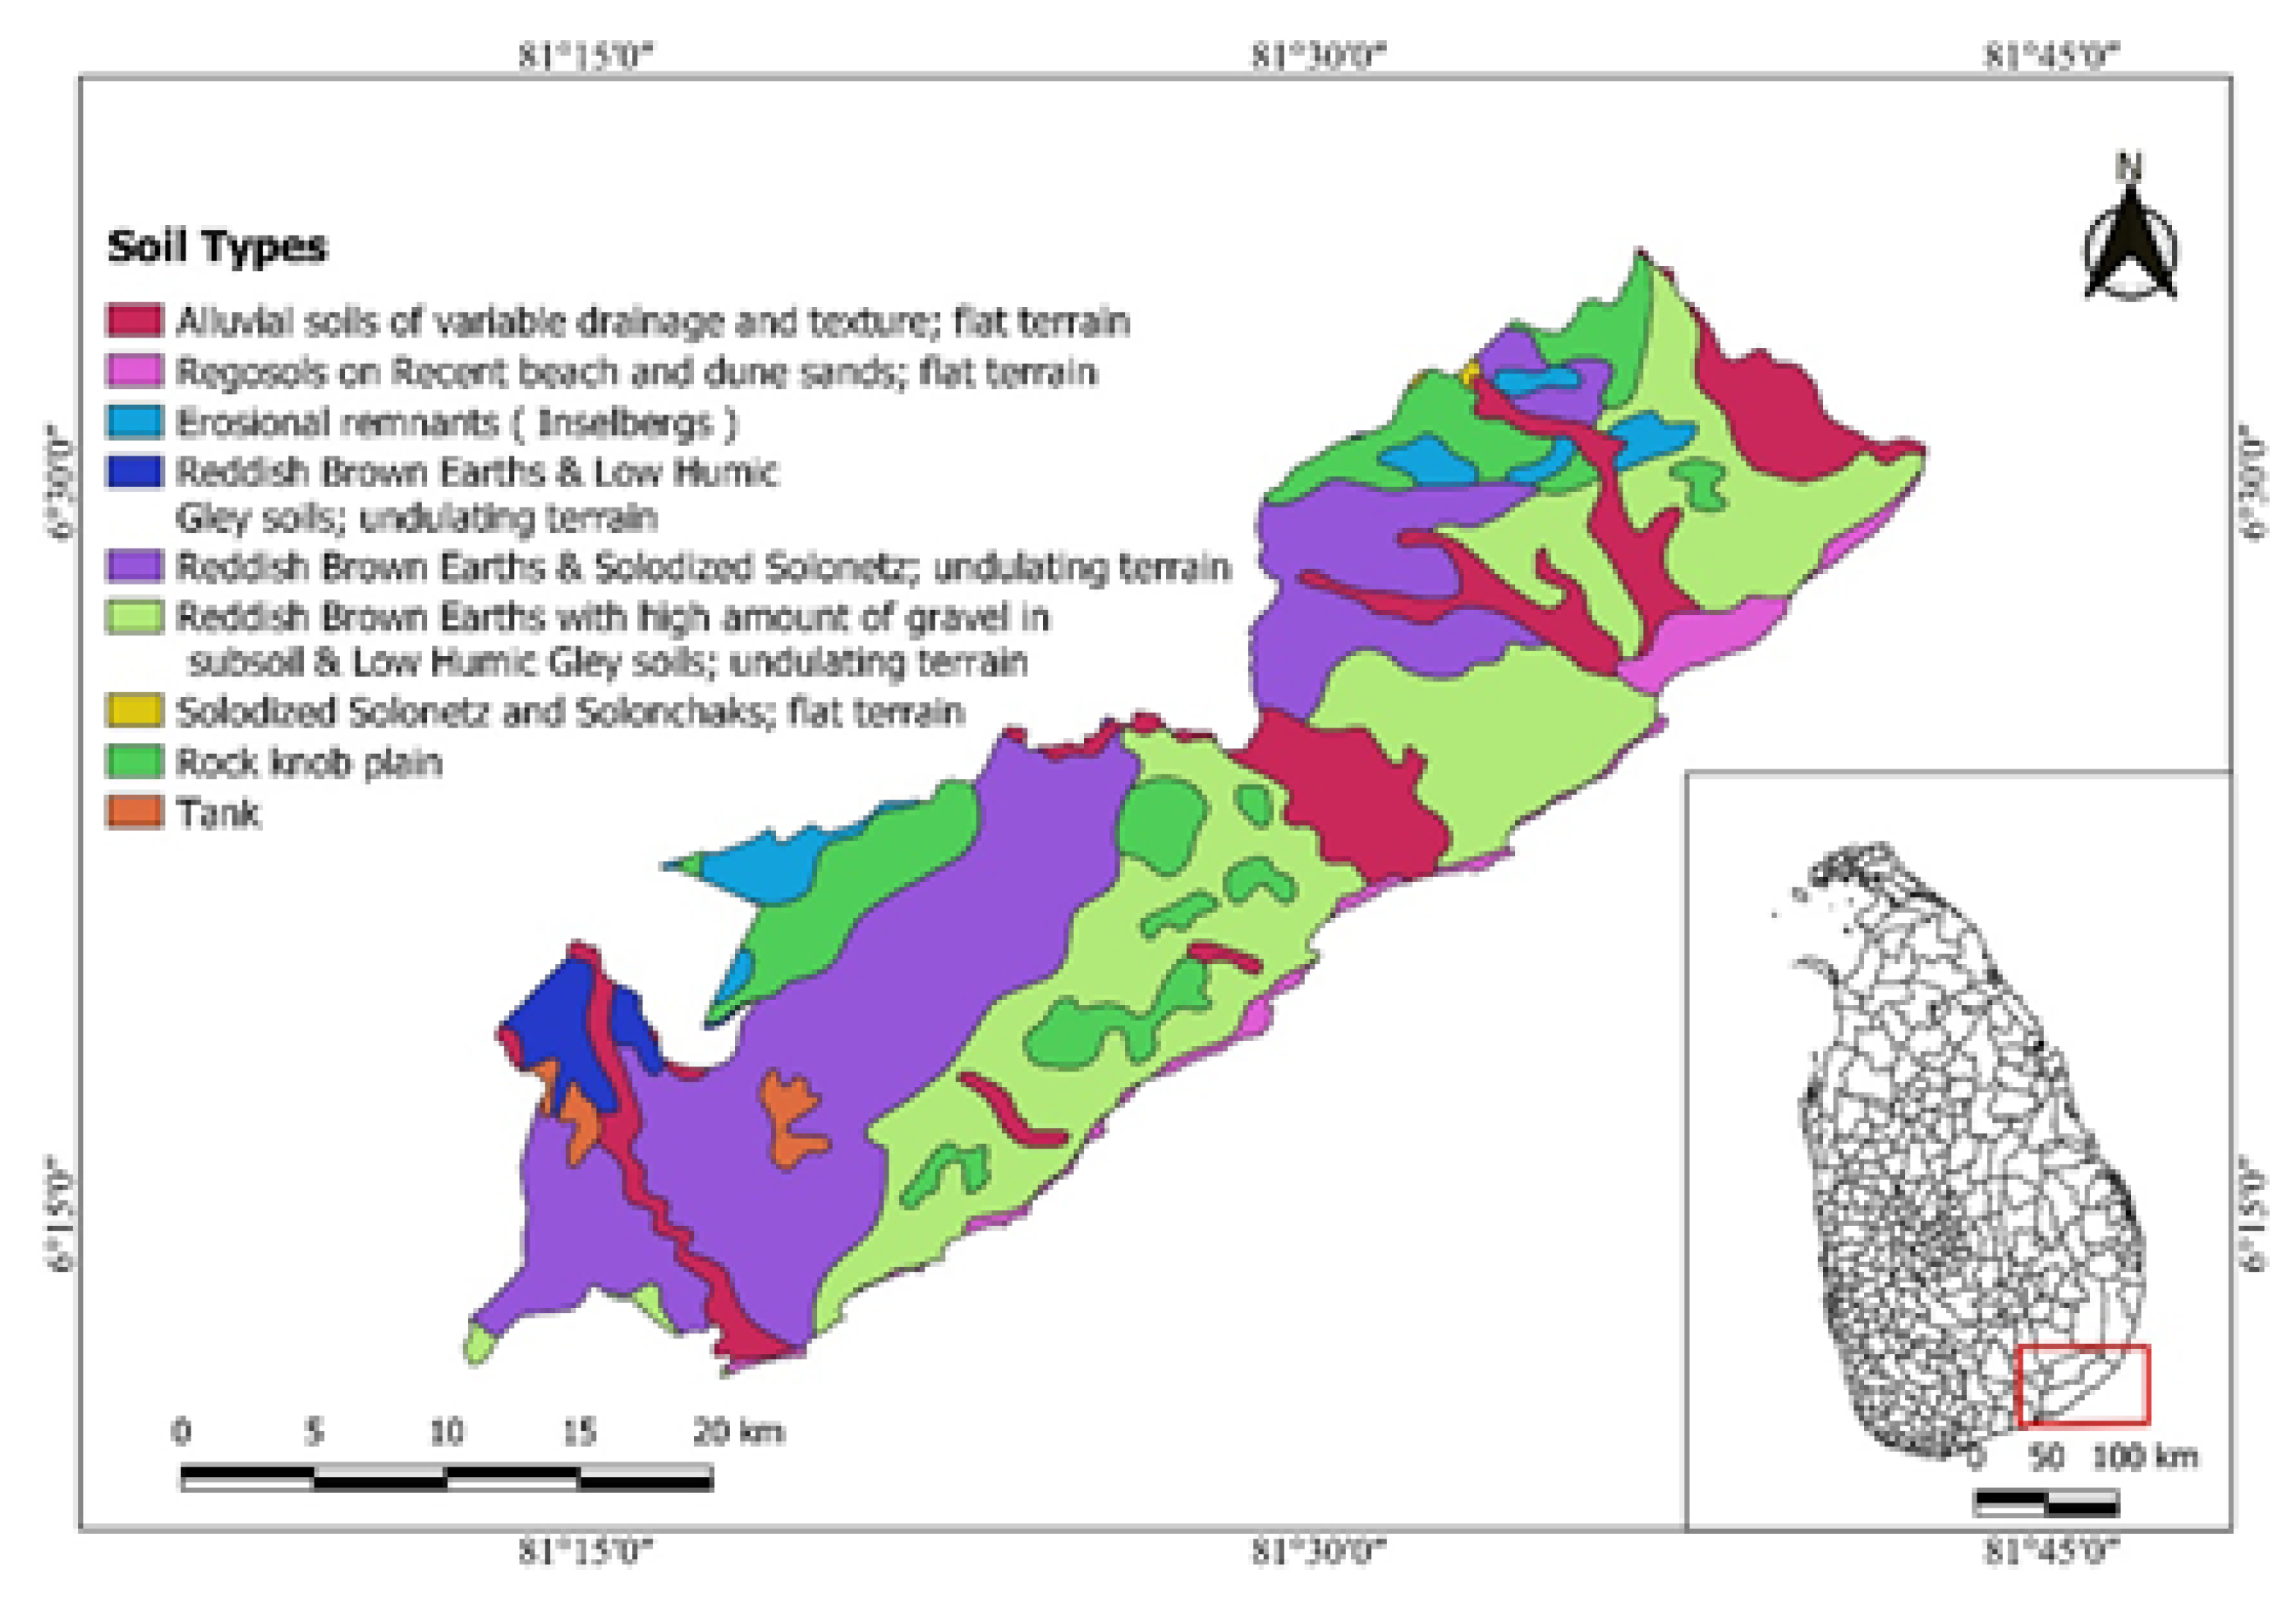
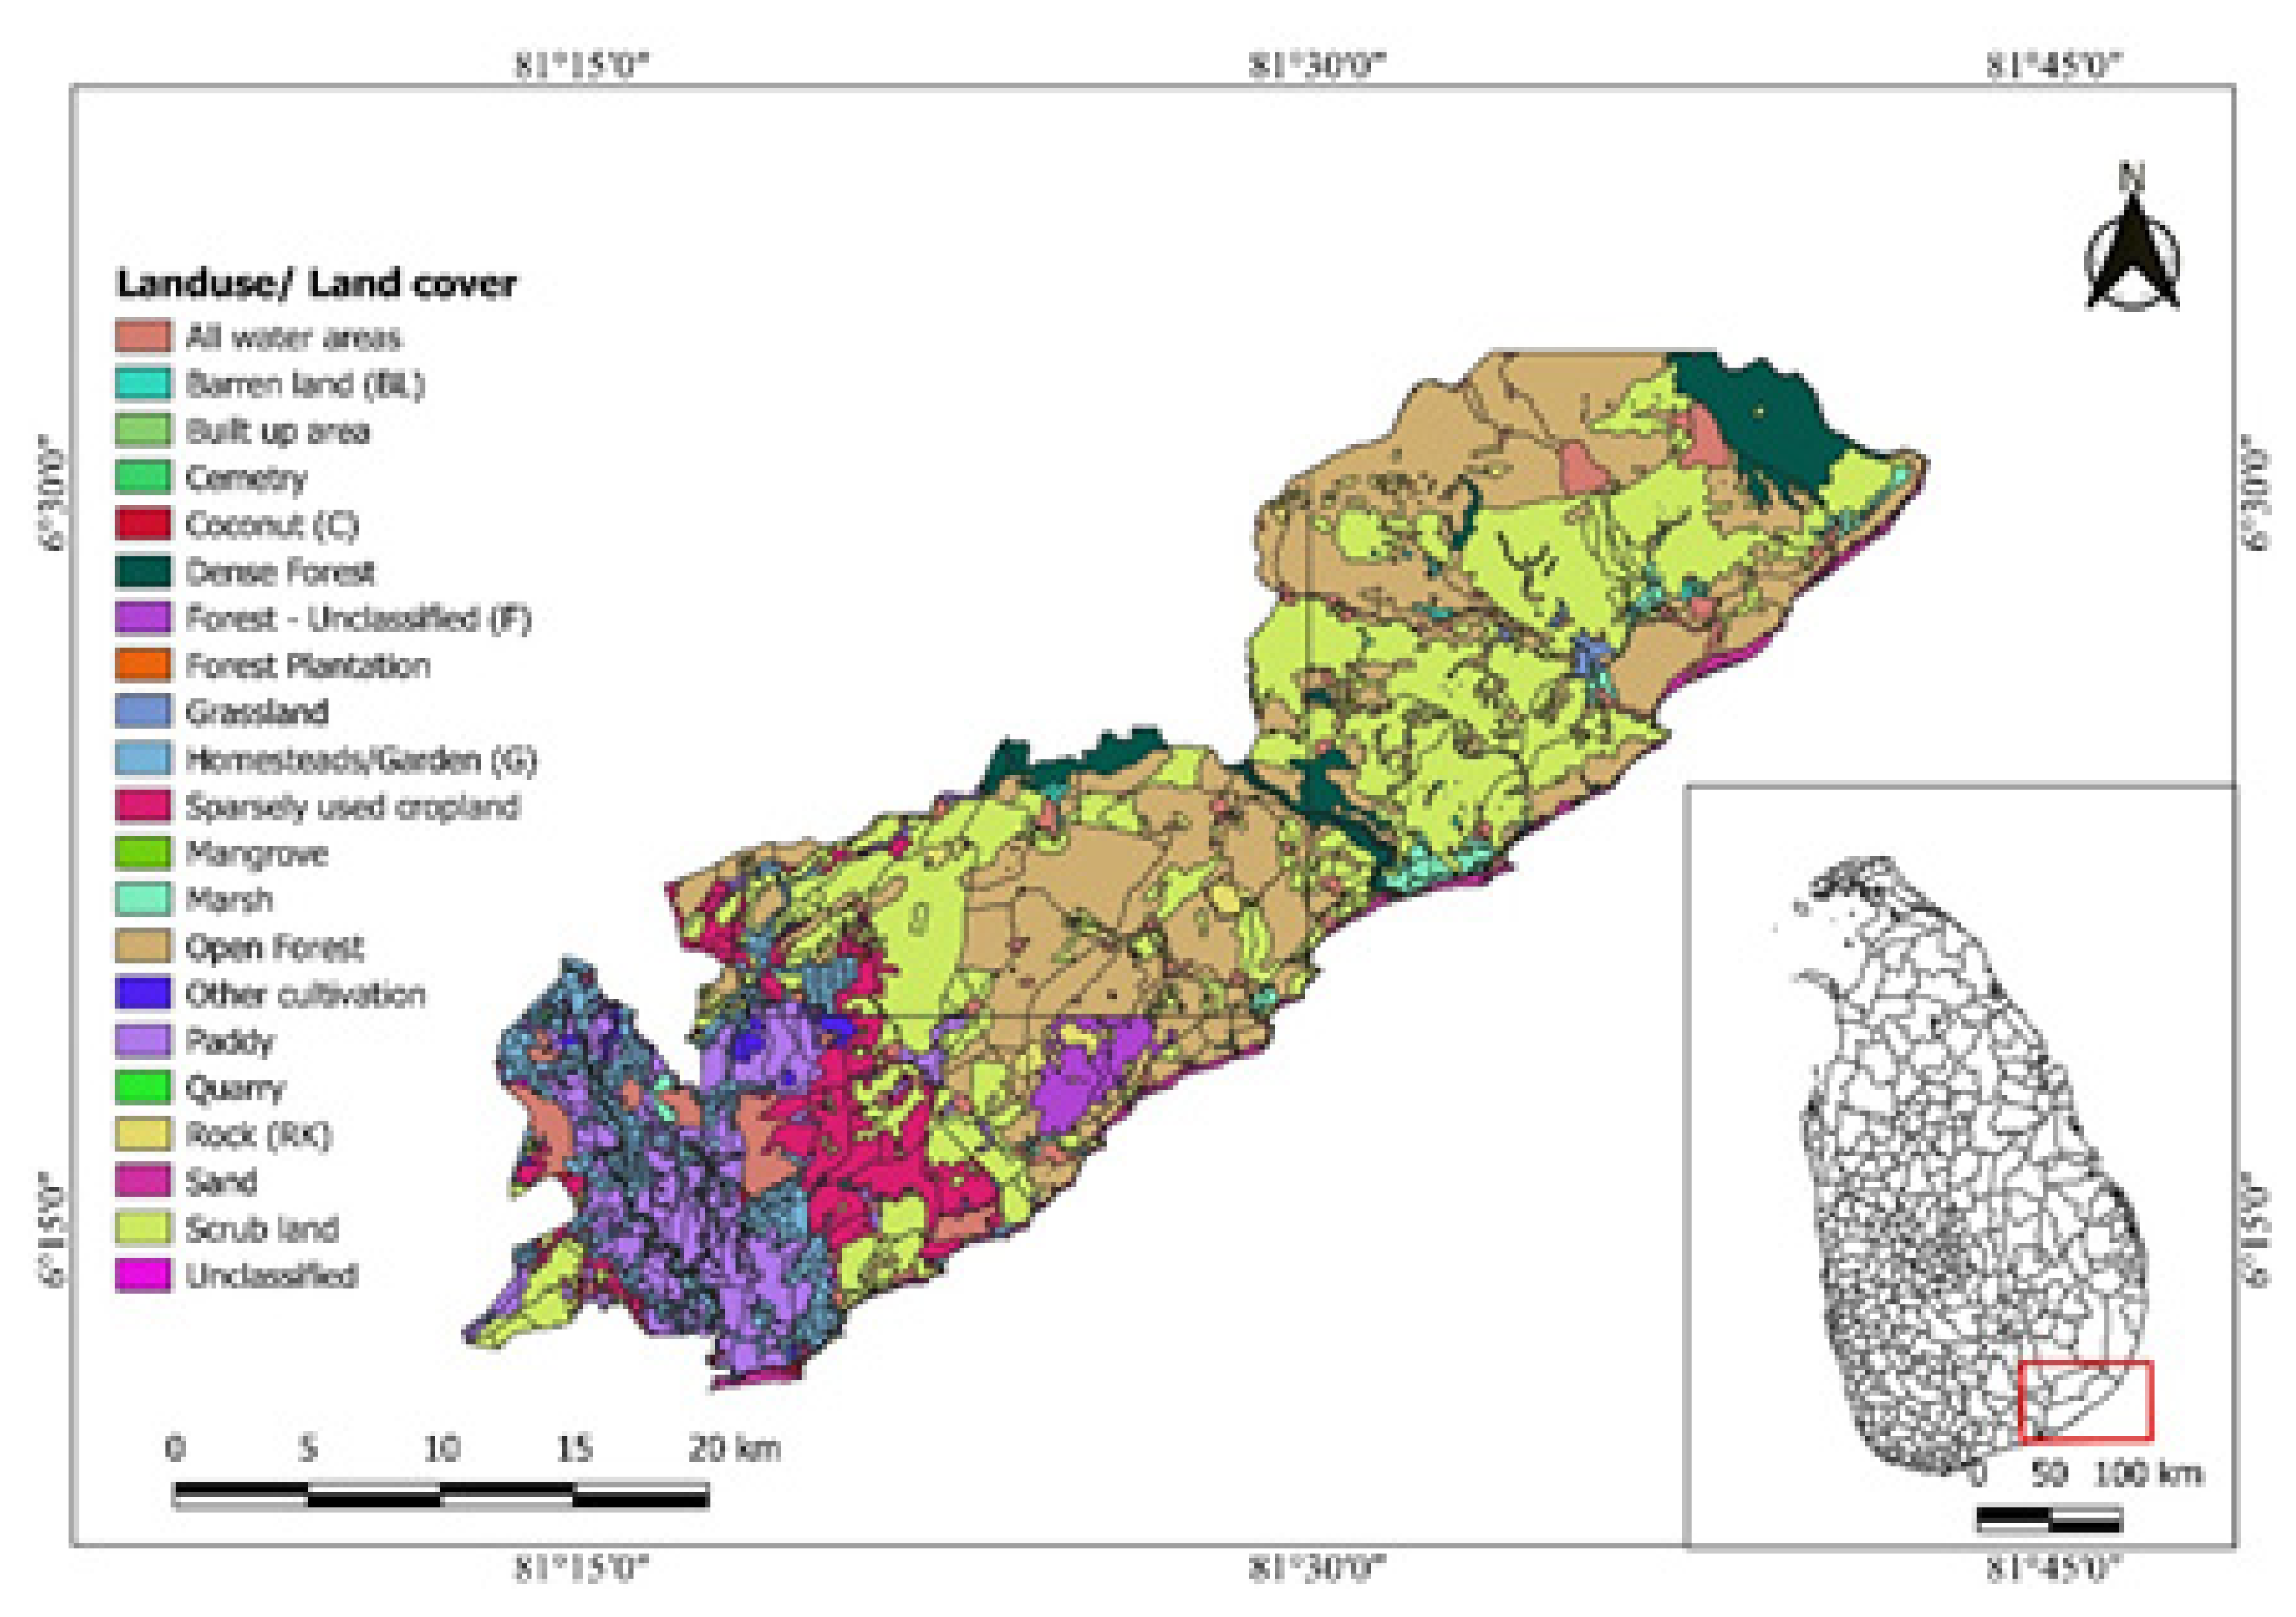
3.4. Soil and Land Use Data
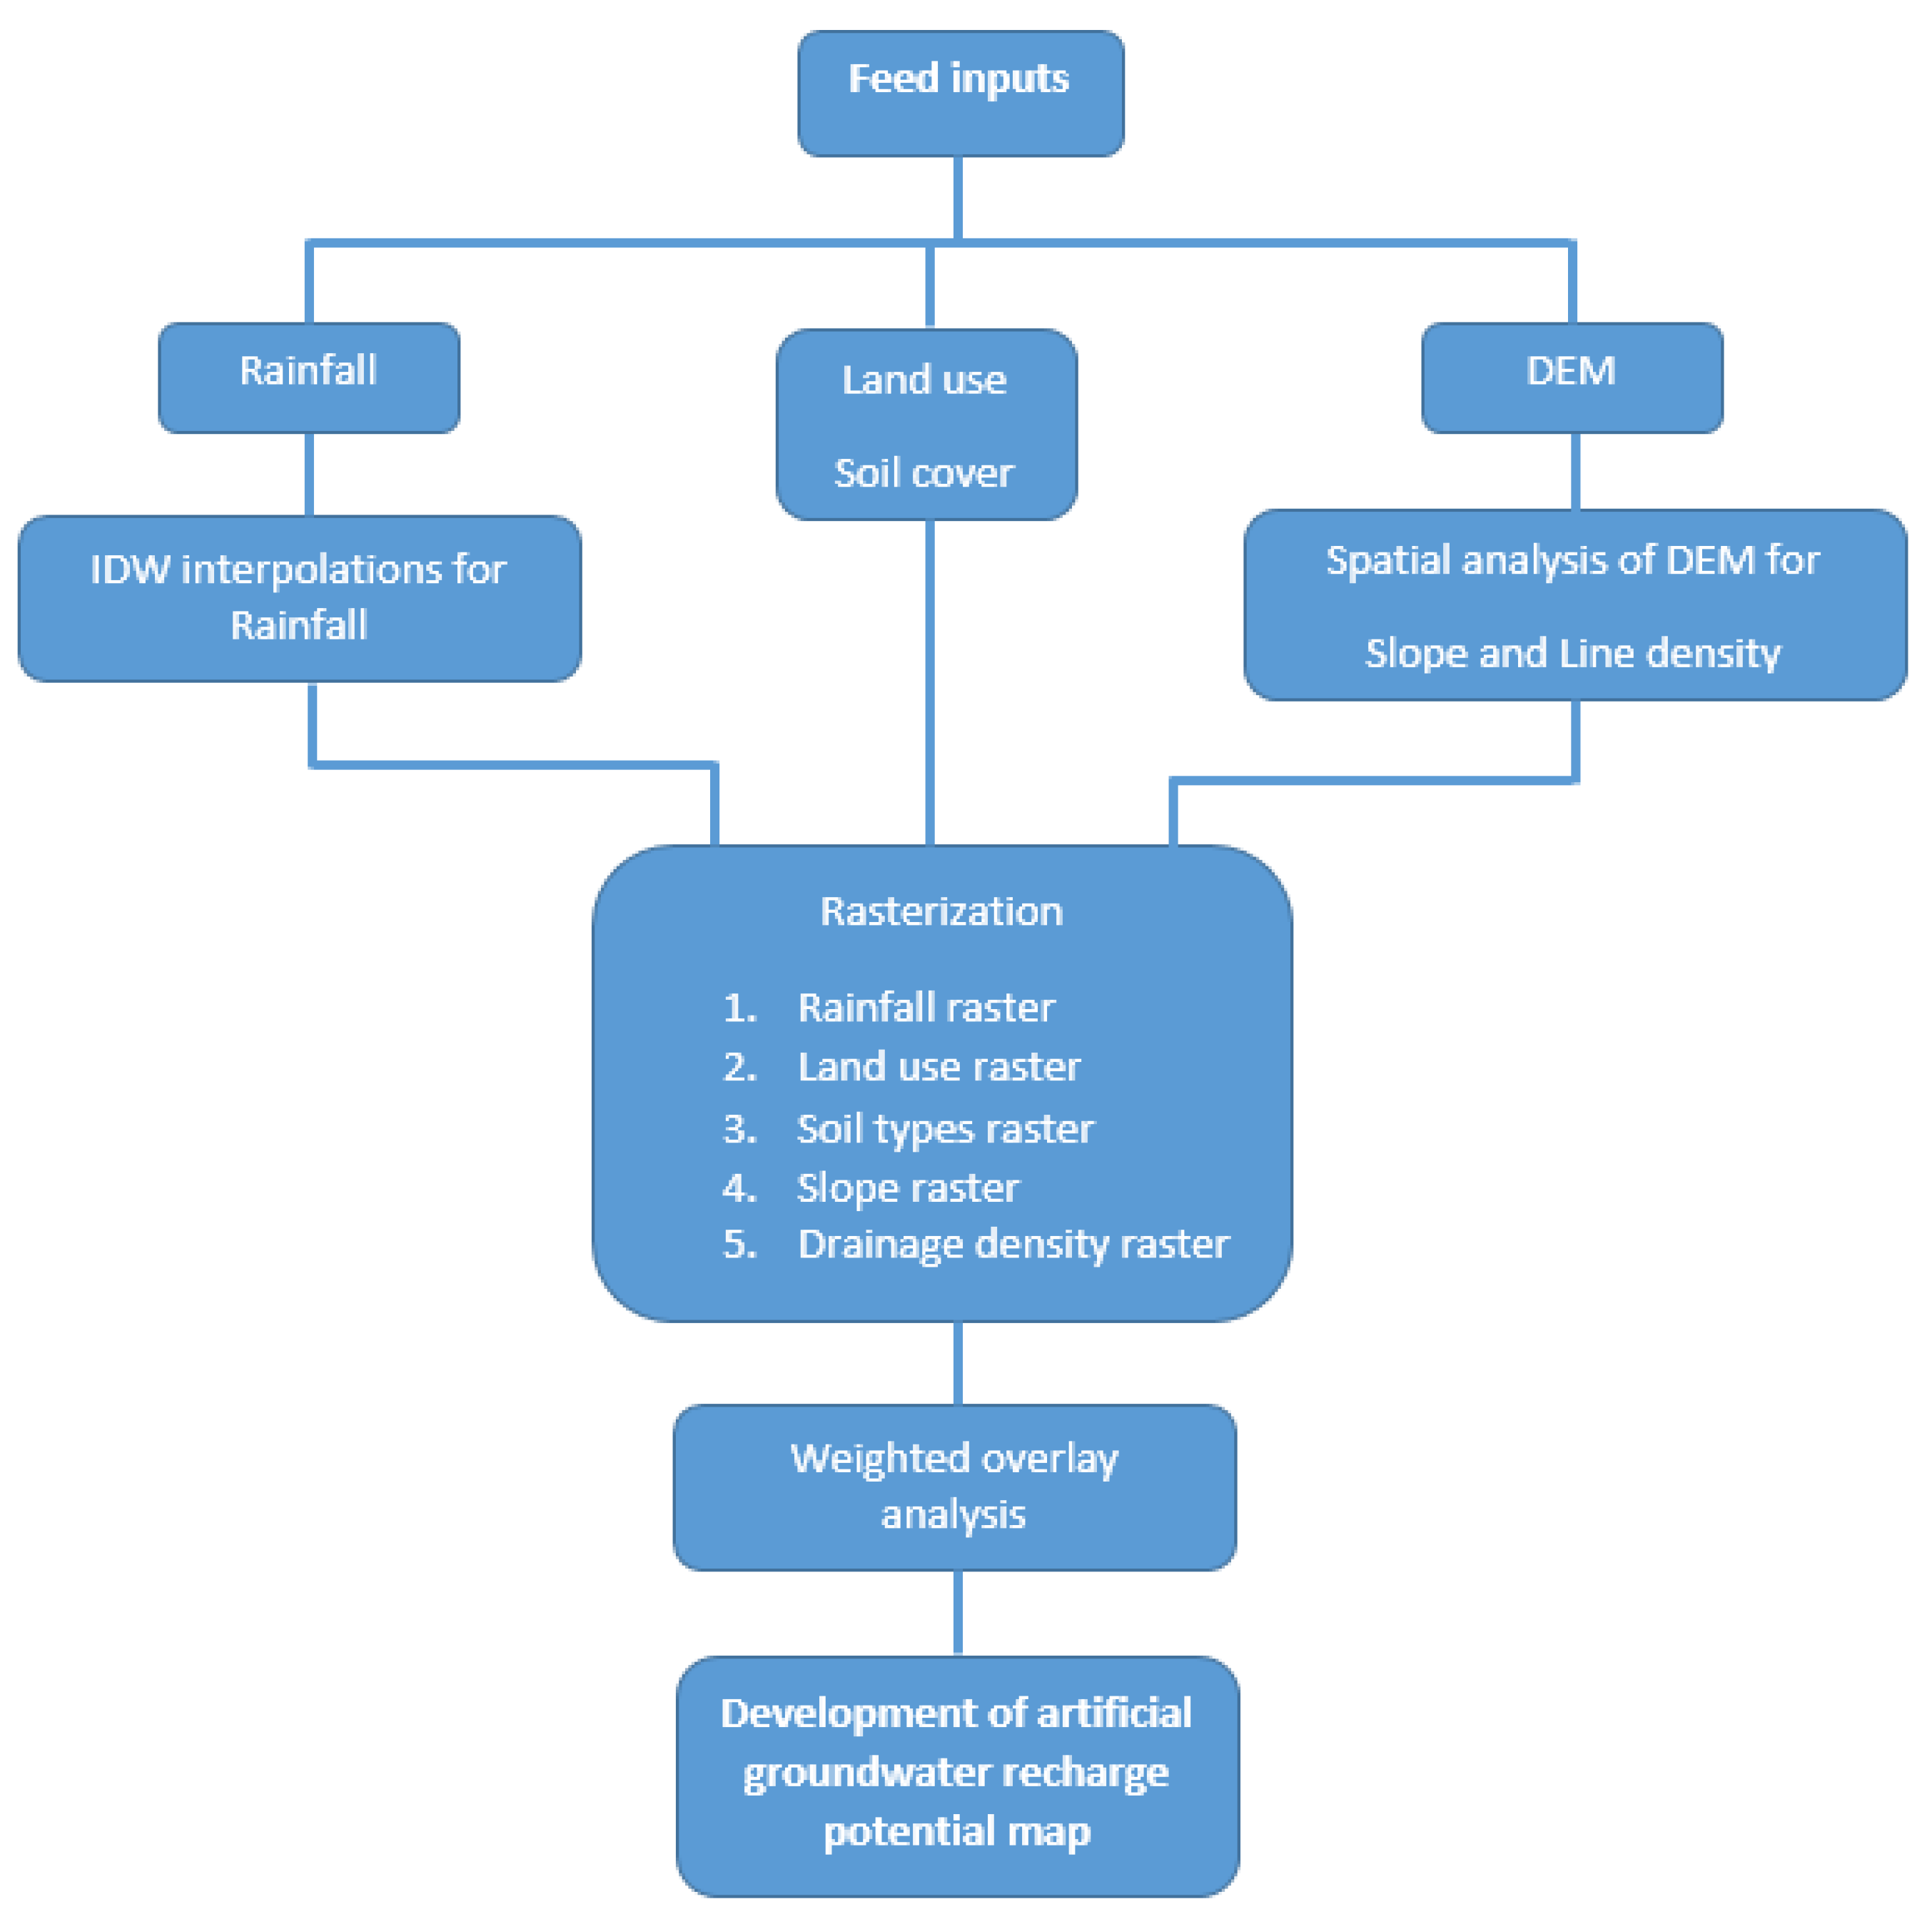
Different soil types have different particle sizes, which can directly control the soil porosity and permeability. Especially, the infiltration capacity of the topsoil is highly dependent on the soil porosity and permeability [26] Therefore, it is essential to analyze the effect of soil characteristics on groundwater recharging potential. Soil-type data were obtained from the Department of Agriculture [27] as a GIS shapefile and extracted the data relevant to the study area. A major part of the study area is covered with reddish-brown earth and the Solodized Solonetz soil type, and reddish-brown earth with a high amount of gravel in the subsoil and low humic gley soils. The distribution of soil types in Tissamaharama DSD is illustrated in Figure 2.
Land use and land cover changes due to anthropogenic activities change the permeability of the top surface, which is a crucial factor in determining groundwater recharge potential [24] Land use–land cover (LULC) data were obtained from the Survey Department of Sri Lanka [28] and input into the GIS environment to create the land use raster layer for the study area. Figure 3 presents the land use–land cover map of the study area. A significant area of the Tissamaharama DSD is covered with forest plantations and open forests. Other than these two types, dense forest areas are also observed in the northern parts of the study area. The main agricultural crop of the Tissamaharama is observed to be paddy, while some sparsely used croplands could also be recognized.

4. Methodology

4.1. Developing the Thematic Layers

The GIS (geographic information system) approach was employed to define potential areas for artificial recharge of groundwater in the Tissamaharama Divisional Secretariat. Five thematic layers were developed considering factors, rainfall, drainage density, slope, land use–land cover, and soil cover. All the collected data were processed with the use of the ArcGIS 10.5 platform (by Environmental Systems Research Institute (ESRI), Redlands, CA, USA) to create the thematic layers for the above parameters.
Since there are only two rain gauging stations (Tissamaharama Irrigation Department station and Weerawila station) in the Tissamaharama DSD area, the spatial variation of the average annual rainfall was estimated by interpolating the average annual rainfall values from those two rain gauging stations. The inverse distance weighting (IDW) method was adopted in this study, given the suitability of this method in representing the rainfall variation over an area when there are data only for a few locations. The IDW interpolation tool is available under the ArcGIS Spatial Analyst tools, where the rainfall data are given as point data and the tool generates the interpolated raster for the rainfall data. To estimate the slope for the area, the SRTM digital elevation model (DEM) was used. The DEM was cropped to the study area using the GIS Shapefile of Tissmaharama DSD, and then the slope tool in the Spatial Analyst tools was used in calculating the slope values as a raster data layer. The drainage density layer was developed by first calculating the stream network based on the SRTM DEM and then adopting the line density tool in Spatial Analyst tools in ArcGIS. The land use–land cover raster data were generated with the land use data obtained from the Survey Department of Sri Lanka, by rasterizing the land use vector layer. Similarly, the soil cover raster layer was generated with the soil cover vector data obtained from the Department of Agriculture, Sri Lanka.

4.2. Weighted Overlay Analysis

The weighted overlay method is a simple analysis technique that has the ability to perform a combined analysis of multi-class geospatial data [5]. The Spatial Analyst tools in ArcGIS were employed in generating the artificial groundwater recharge potential map. The weights will be given based on each factor’s influence on groundwater recharging potential.
Prepared map layers were evaluated, and each layer was distributed to several classes based on the parameter value or type. The weights were assigned relevant to their characteristics referring to the available literature [1,4,15]. The assignment weight of classes was based on their favorability and contribution to the groundwater recharging process. Each layer was reclassified with assigned weights, and layers were integrated by employing the weighted overlay method to generate the potential map for artificial groundwater recharge of the study area, as shown in Equation (1).
P G W R = R W + S W + D W + S C W + L U W
where P G W R is the potential of groundwater recharge (weighted overlay value), R W is the weight of rainfall, S W is the weight of the slope, D W is the weight of drainage density, S C W is the weight of soil cover, and L U W is the weight of land use. The assigned weights for each class of selected thematic layers are given in Table 2.
The overall methodology adopted in this research is presented in Figure 4. Rainfall, land use, soil cover, and DEM were the input sources of the model to develop the potential groundwater recharge map.

5. Results and Discussion

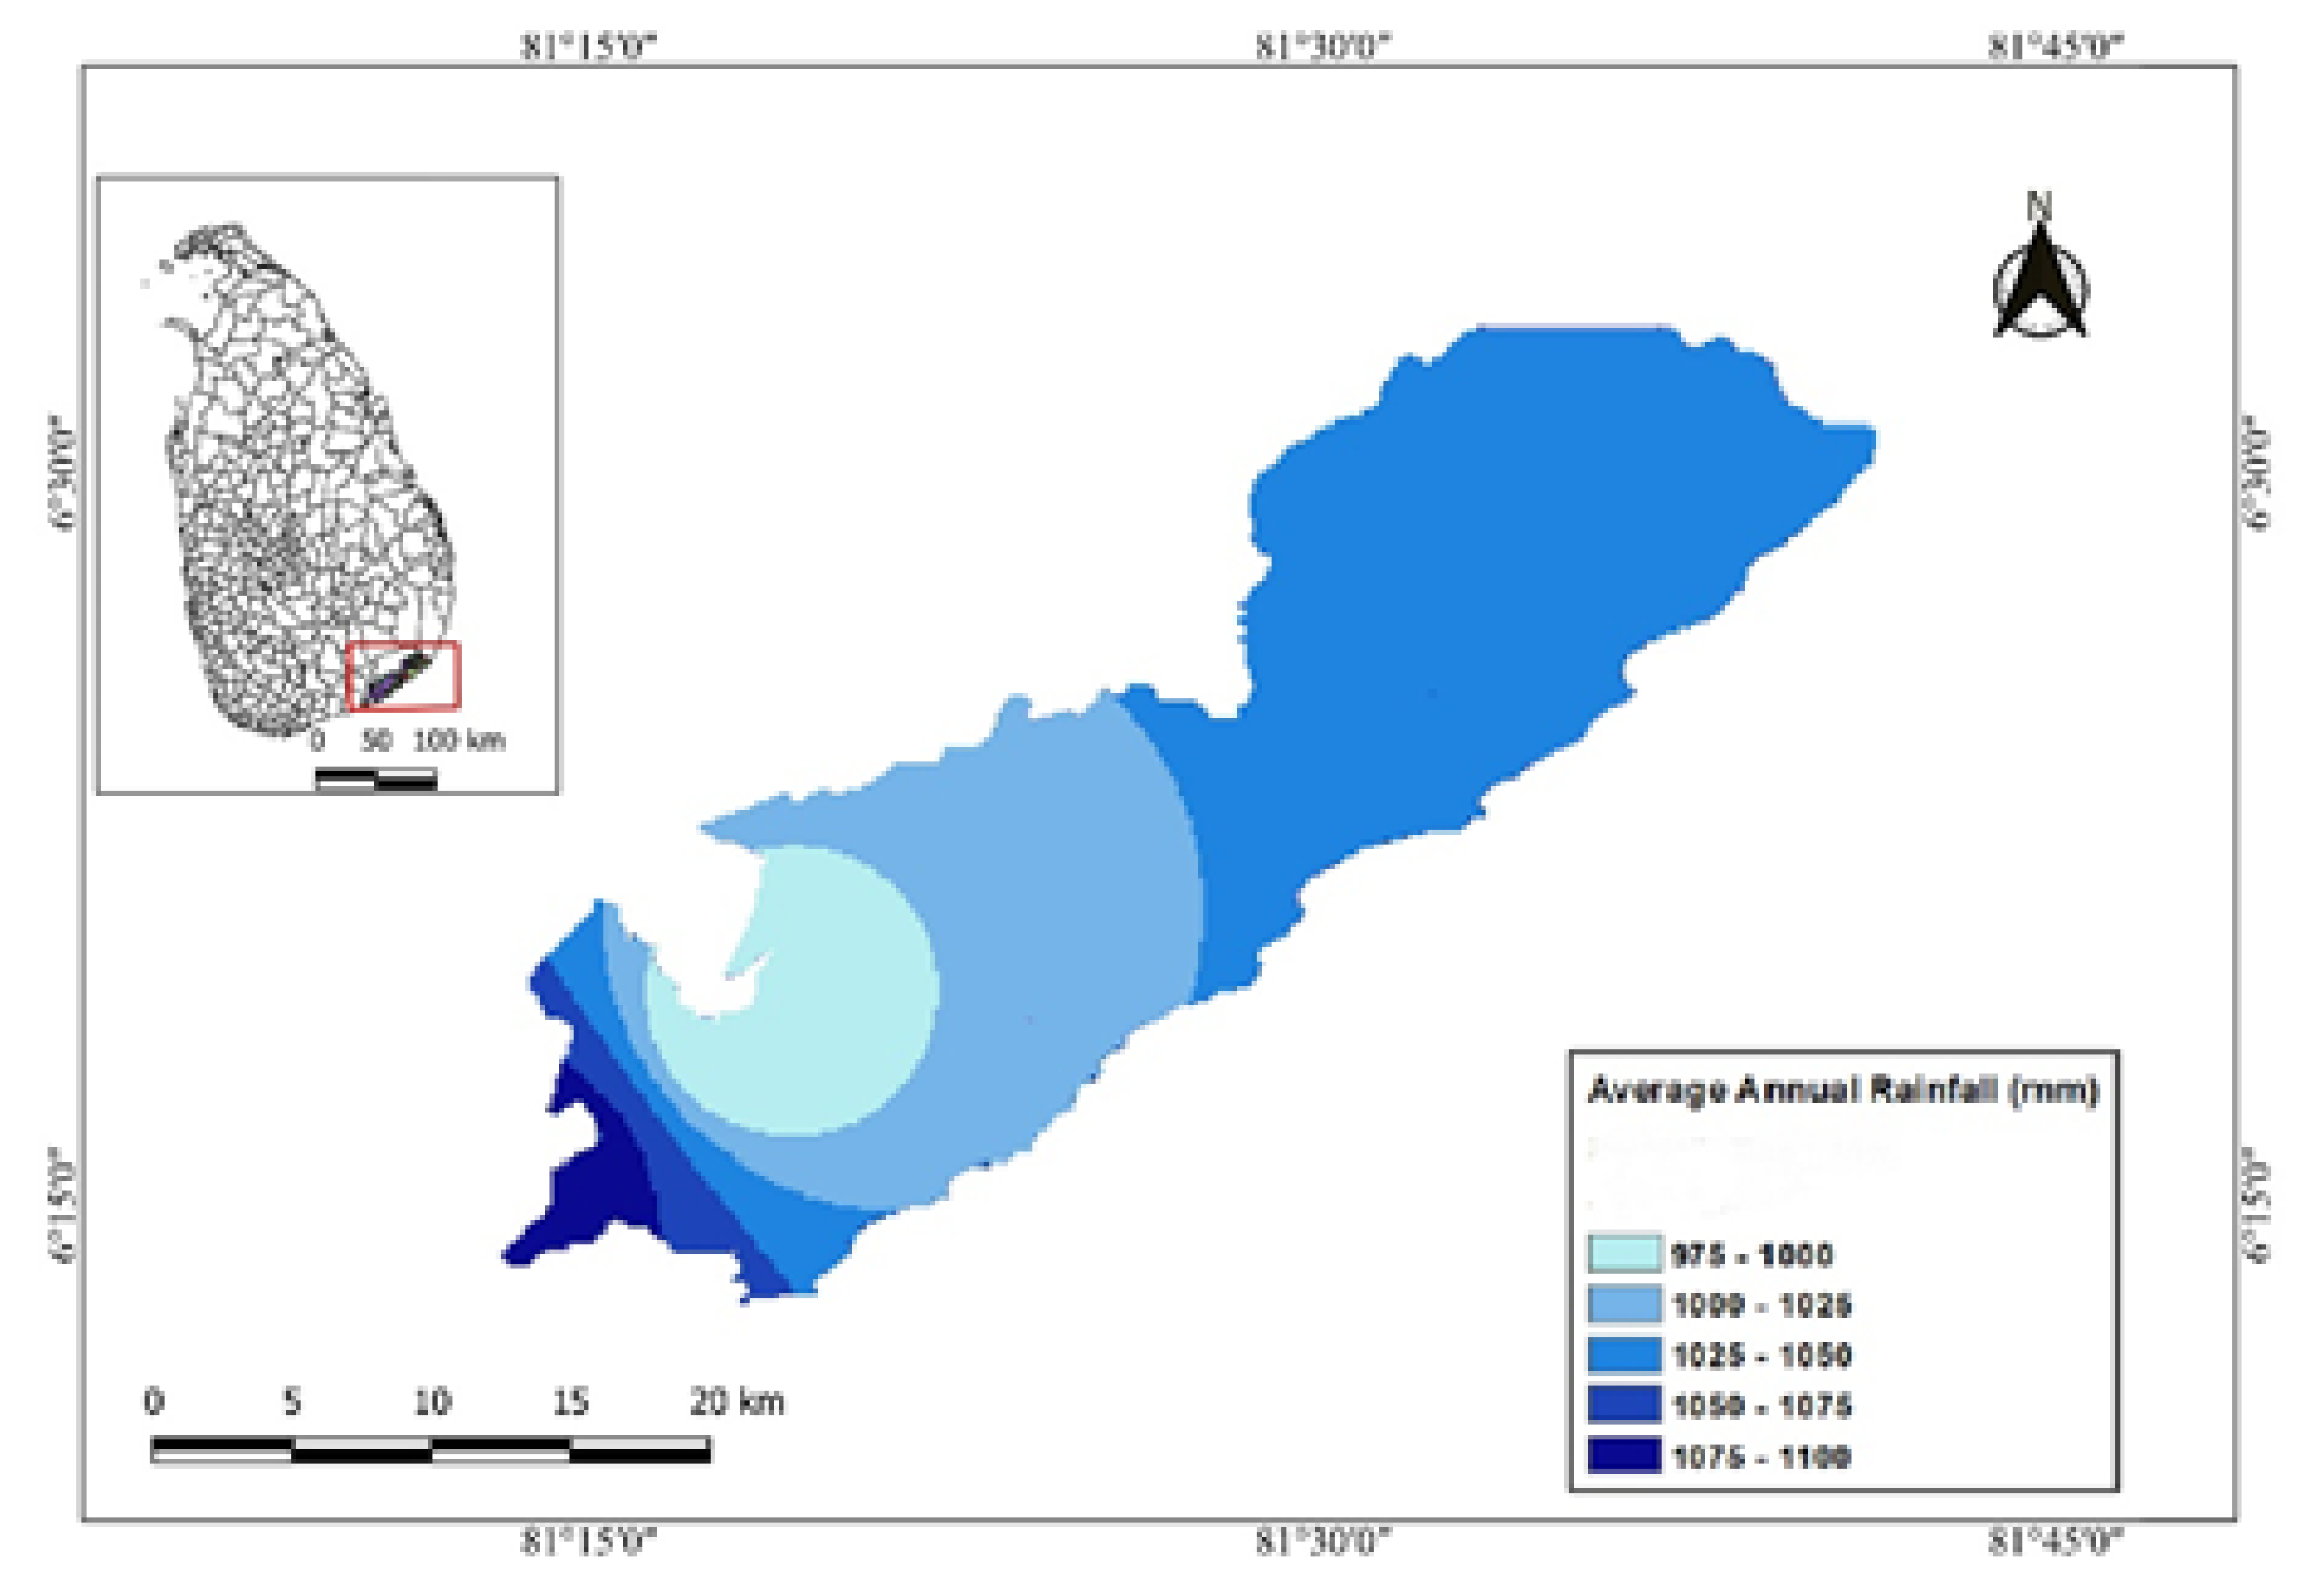
5.1. Average Annual Rainfall Variation in Thissamaharama DSD

The daily rainfall data from 2010 to 2019 were analyzed using the daily rainfall data of two rain gauging stations located within the Tissamaharama DSD. The average annual rainfall of Tissamaharama irrigation and Weerawila stations for the considered period were obtained as 1072.5 mm and 1082.63 mm, respectively. The spatial variation of average annual rainfall obtained by interpolating these rainfall data is shown in Figure 5. As can be seen from Figure 5, the southwestern area of the Tissamaharama DSD receives the maximum annual rainfall, whereas central areas receive the minimum. However, the northeastern areas of the Tissamaharama DSD also receive significant annual rainfall. This area is bound to the famous Yala National Park and sanctuary.

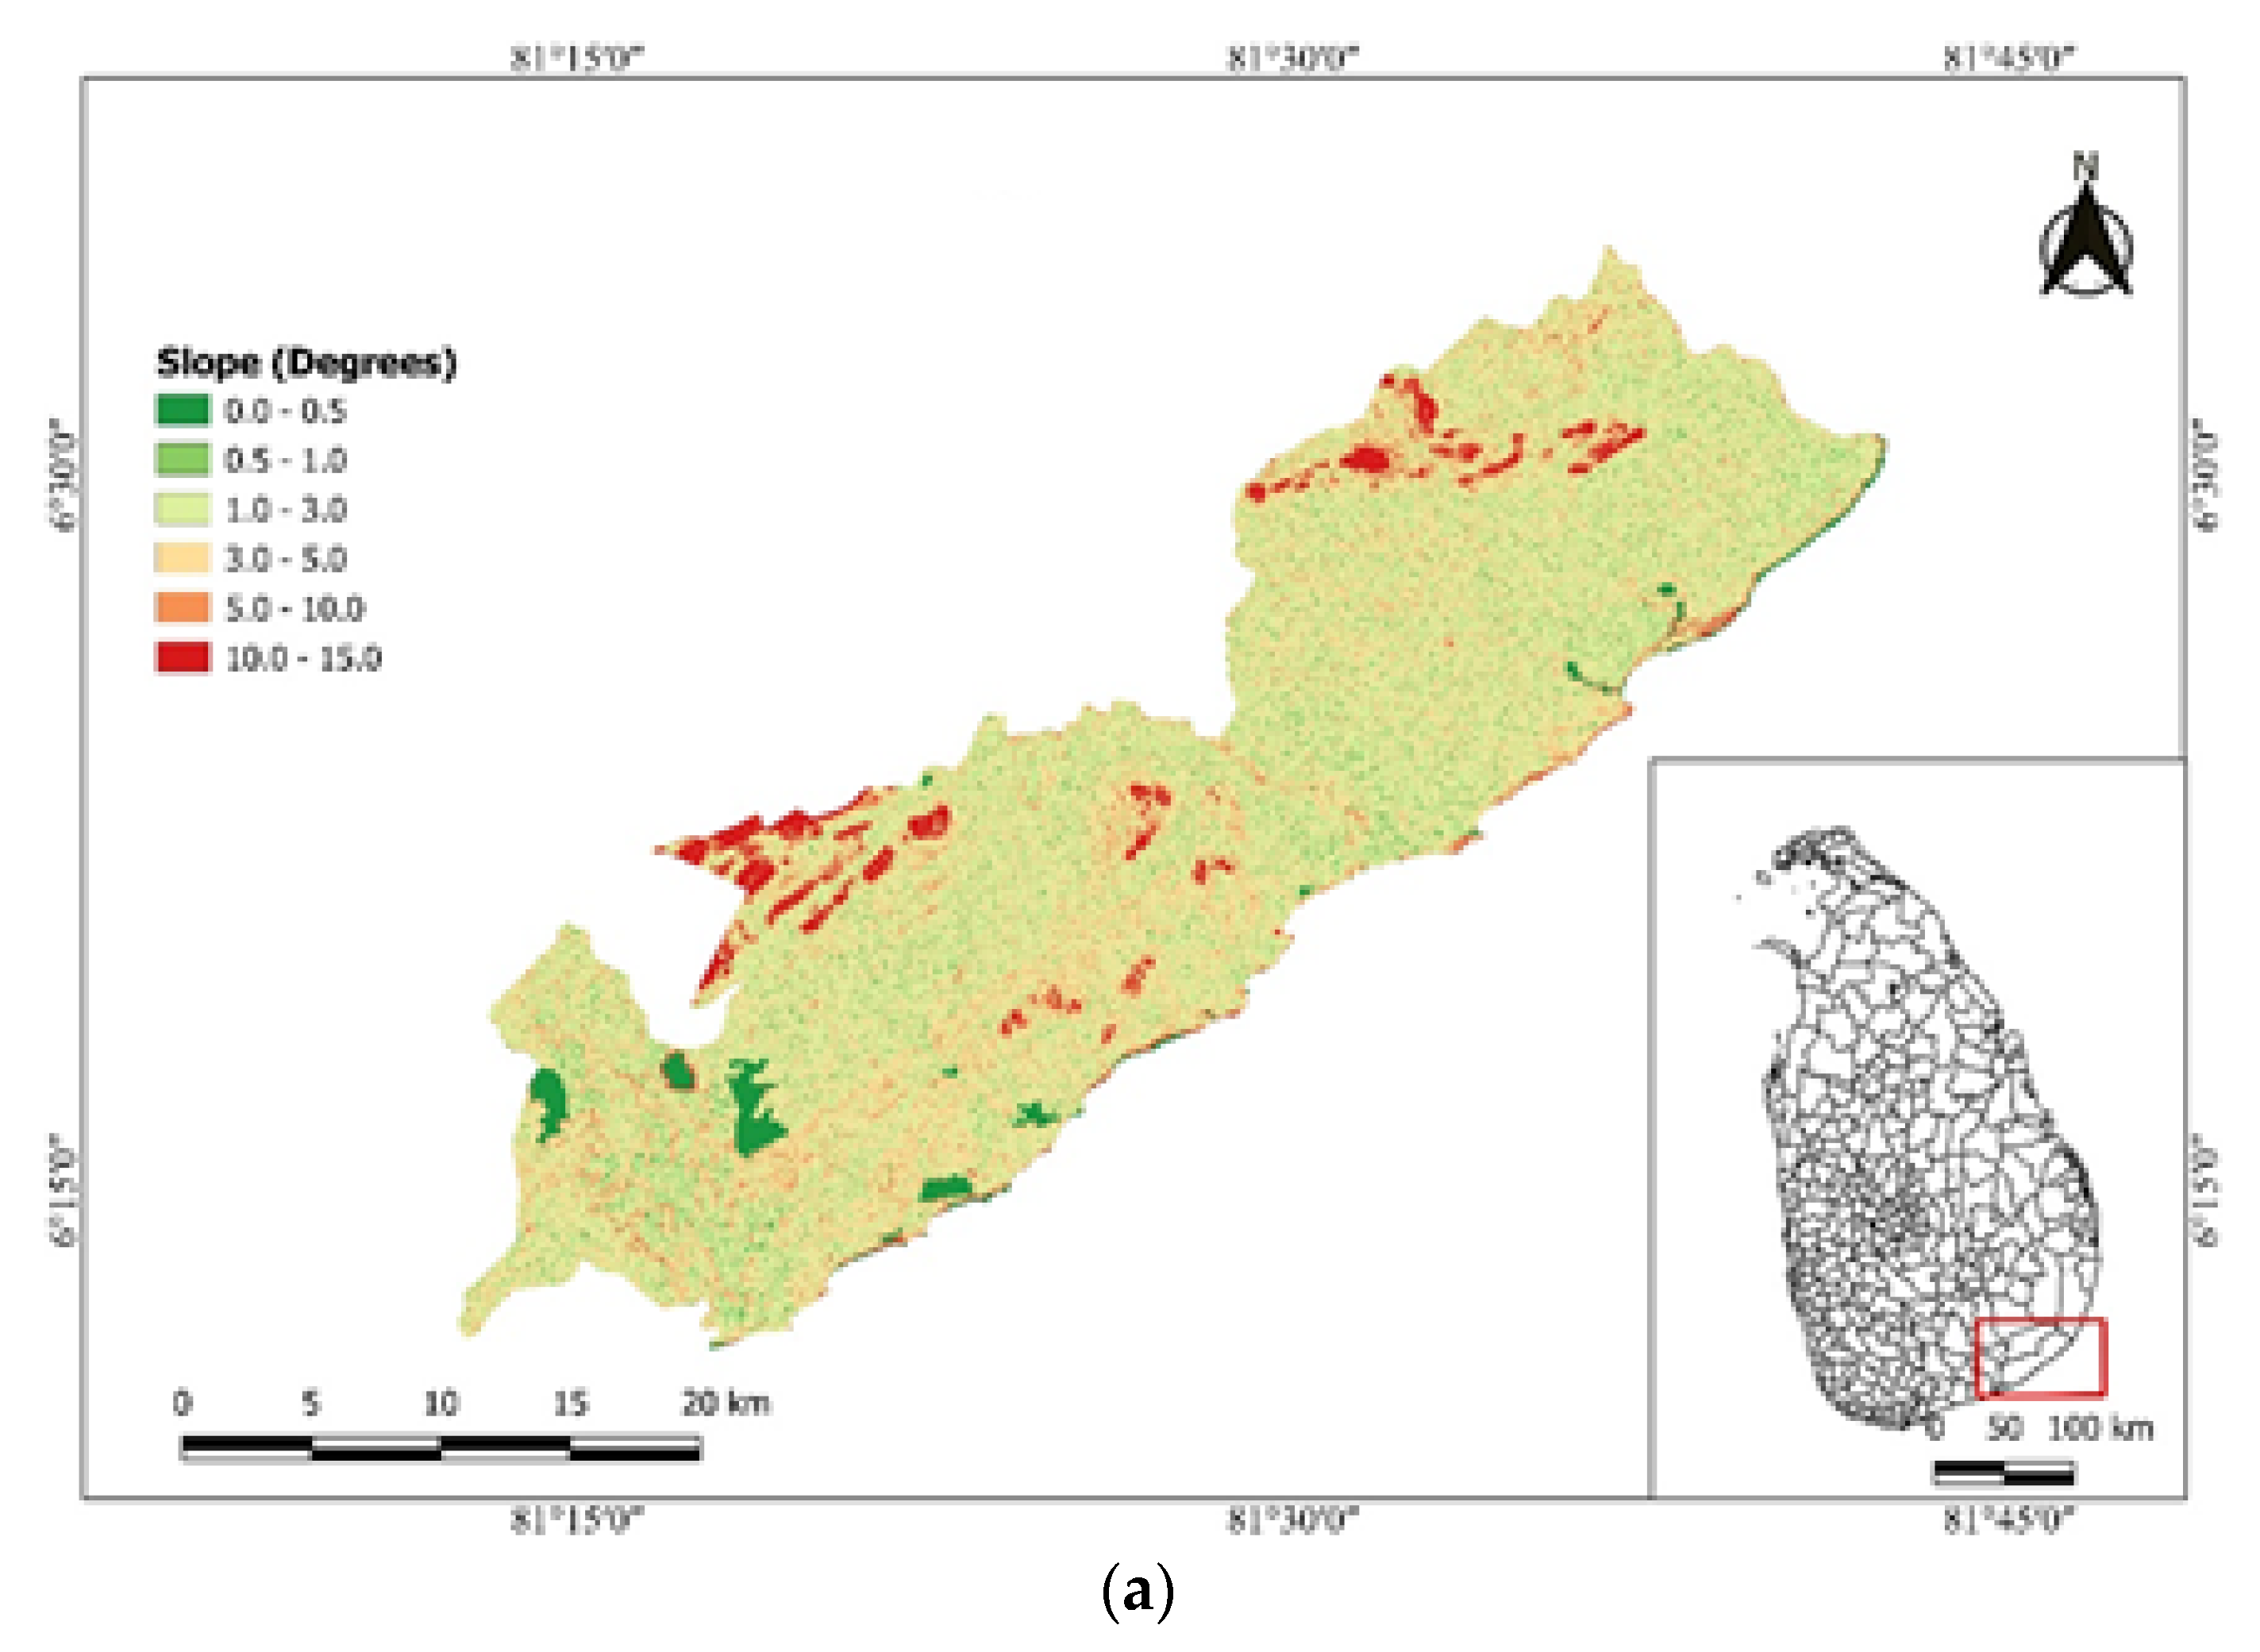
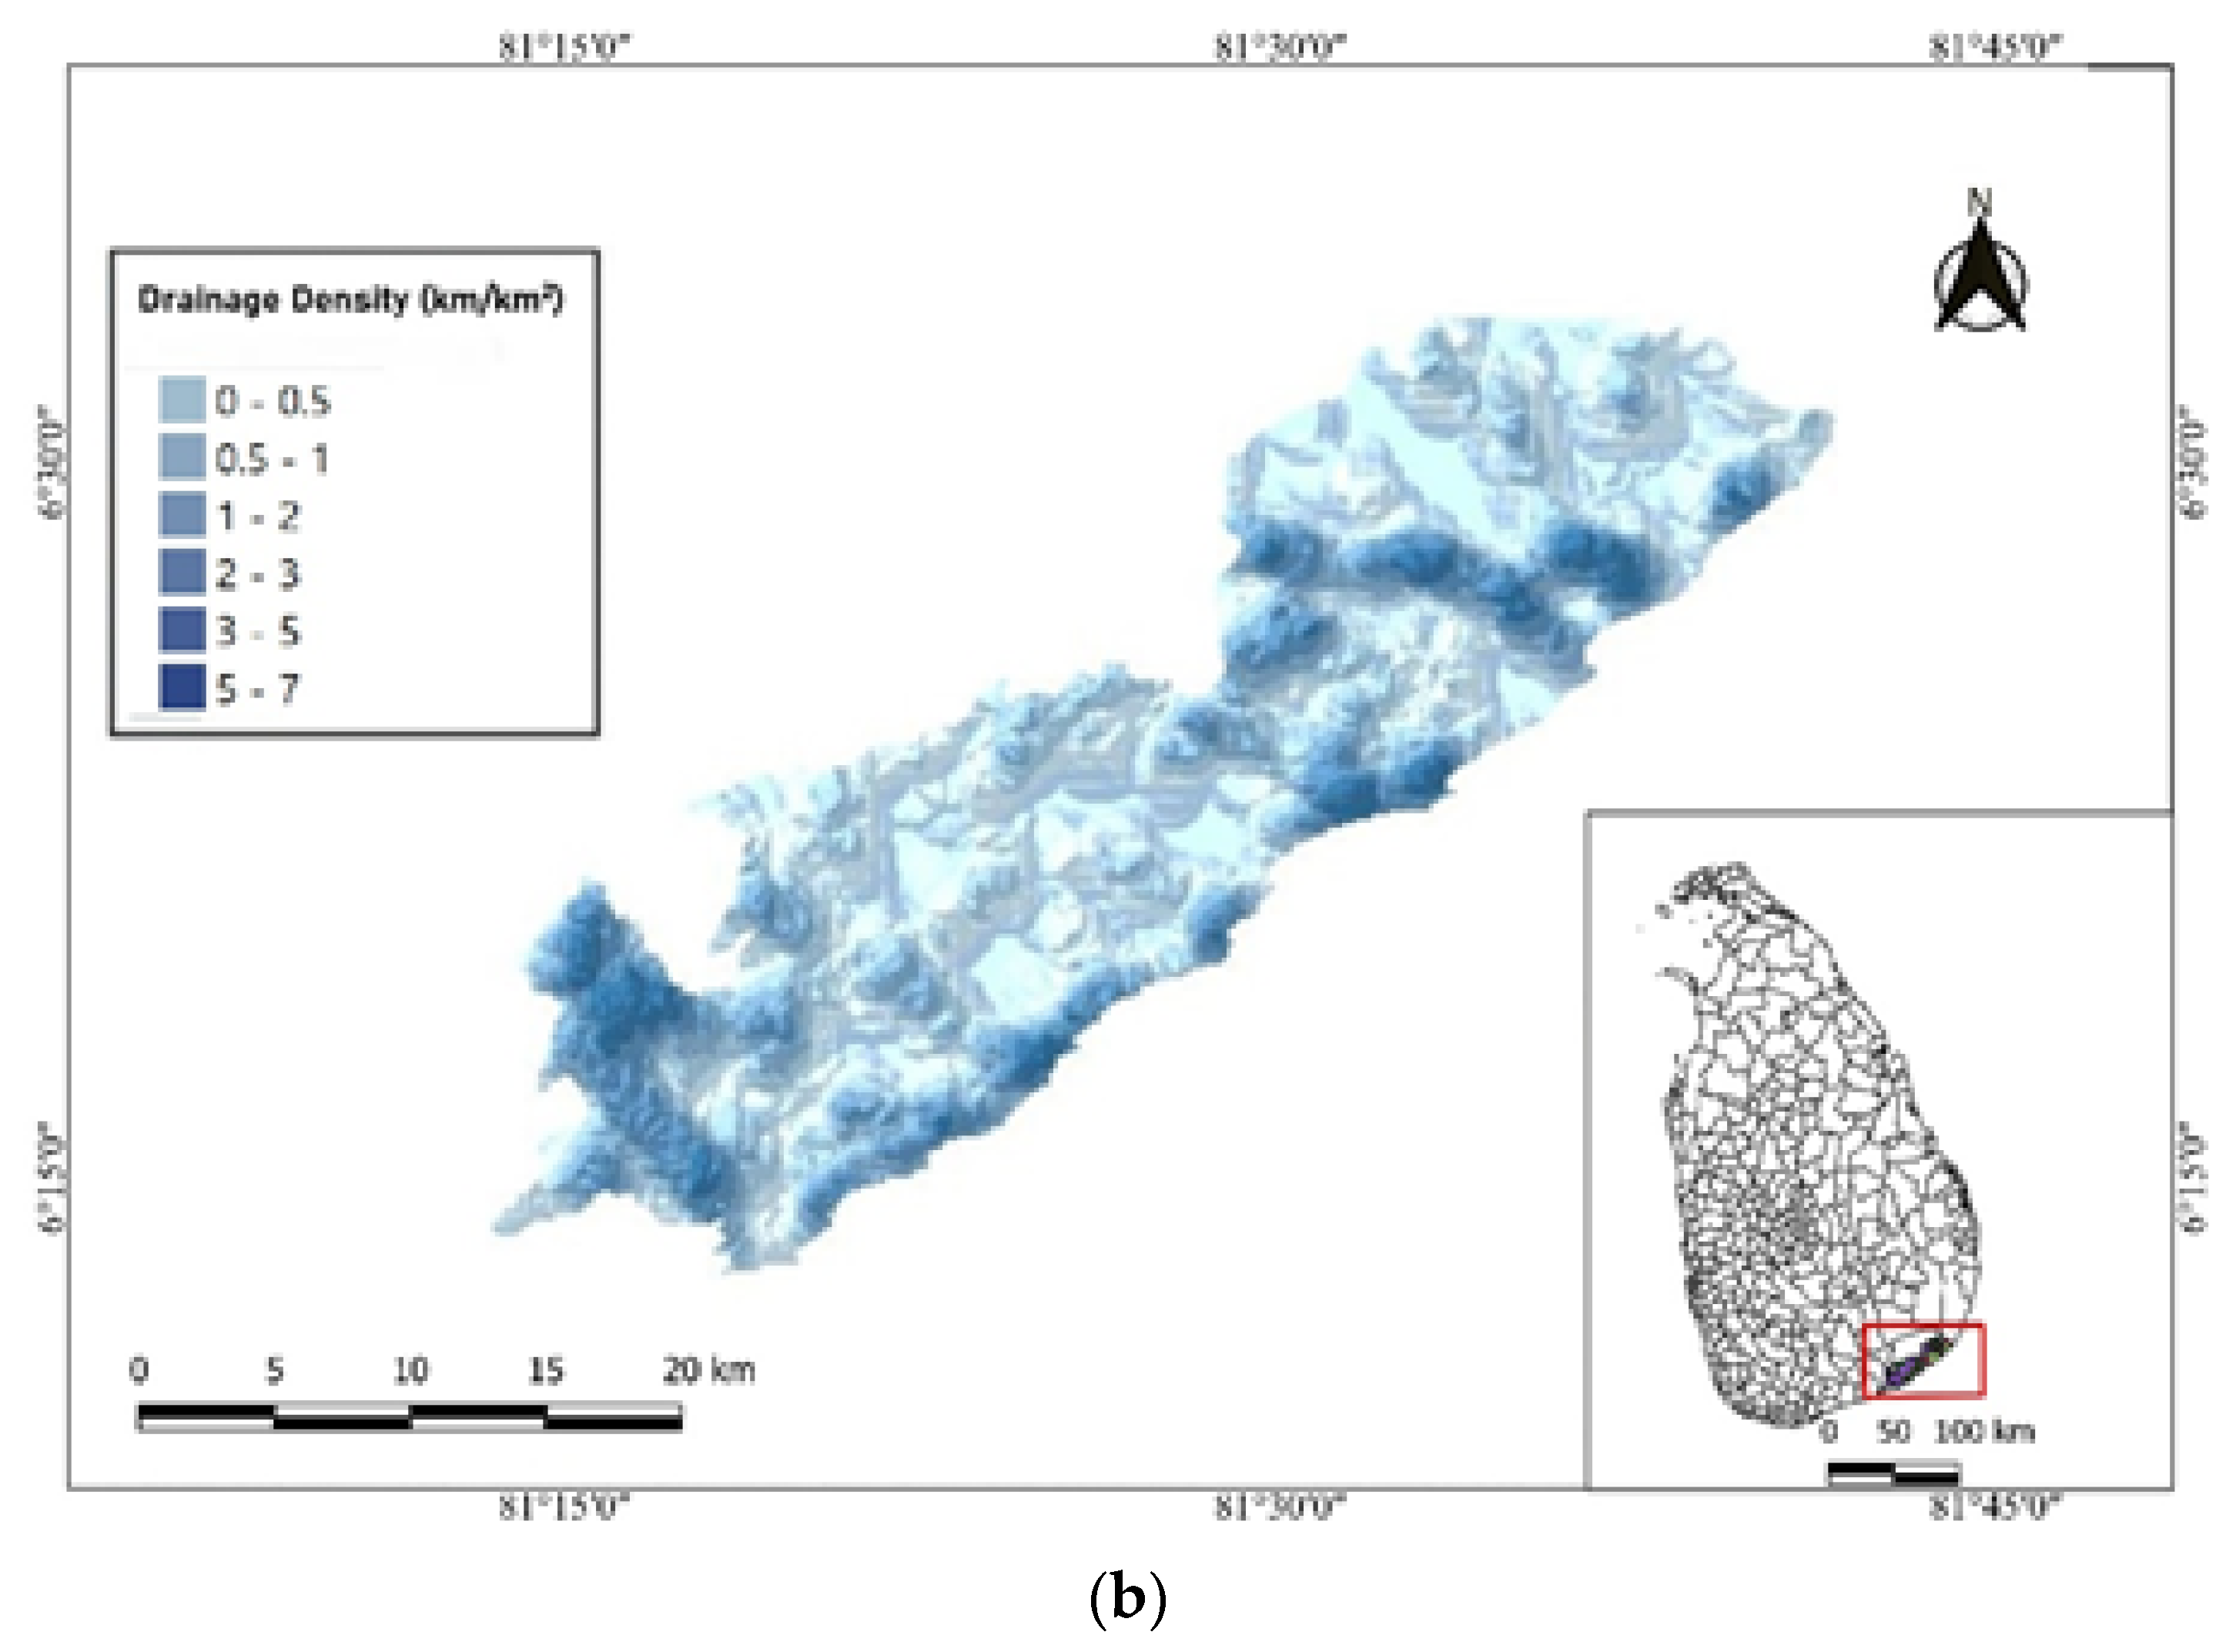
5.2. Variation of Slope and Drainage Density

The spatial variation of slope and drainage density of the Tissamaharama DSD is illustrated in Figure 6a,b, respectively. The maximum slope was observed in the range of 10°–15°. The slope parameter gives a clear idea of the terrain features of the Tissamaharama area. A major part of the study area has a flat terrain with slopes of less than 3°.
The drainage density was calculated as a line density per unit area (km/km2). Higher densities were mostly observed in the southern parts of the study area and also in the areas that are closer to the coast. The results indicate that a higher number of streams are distributed in the southern part and close to the coast.

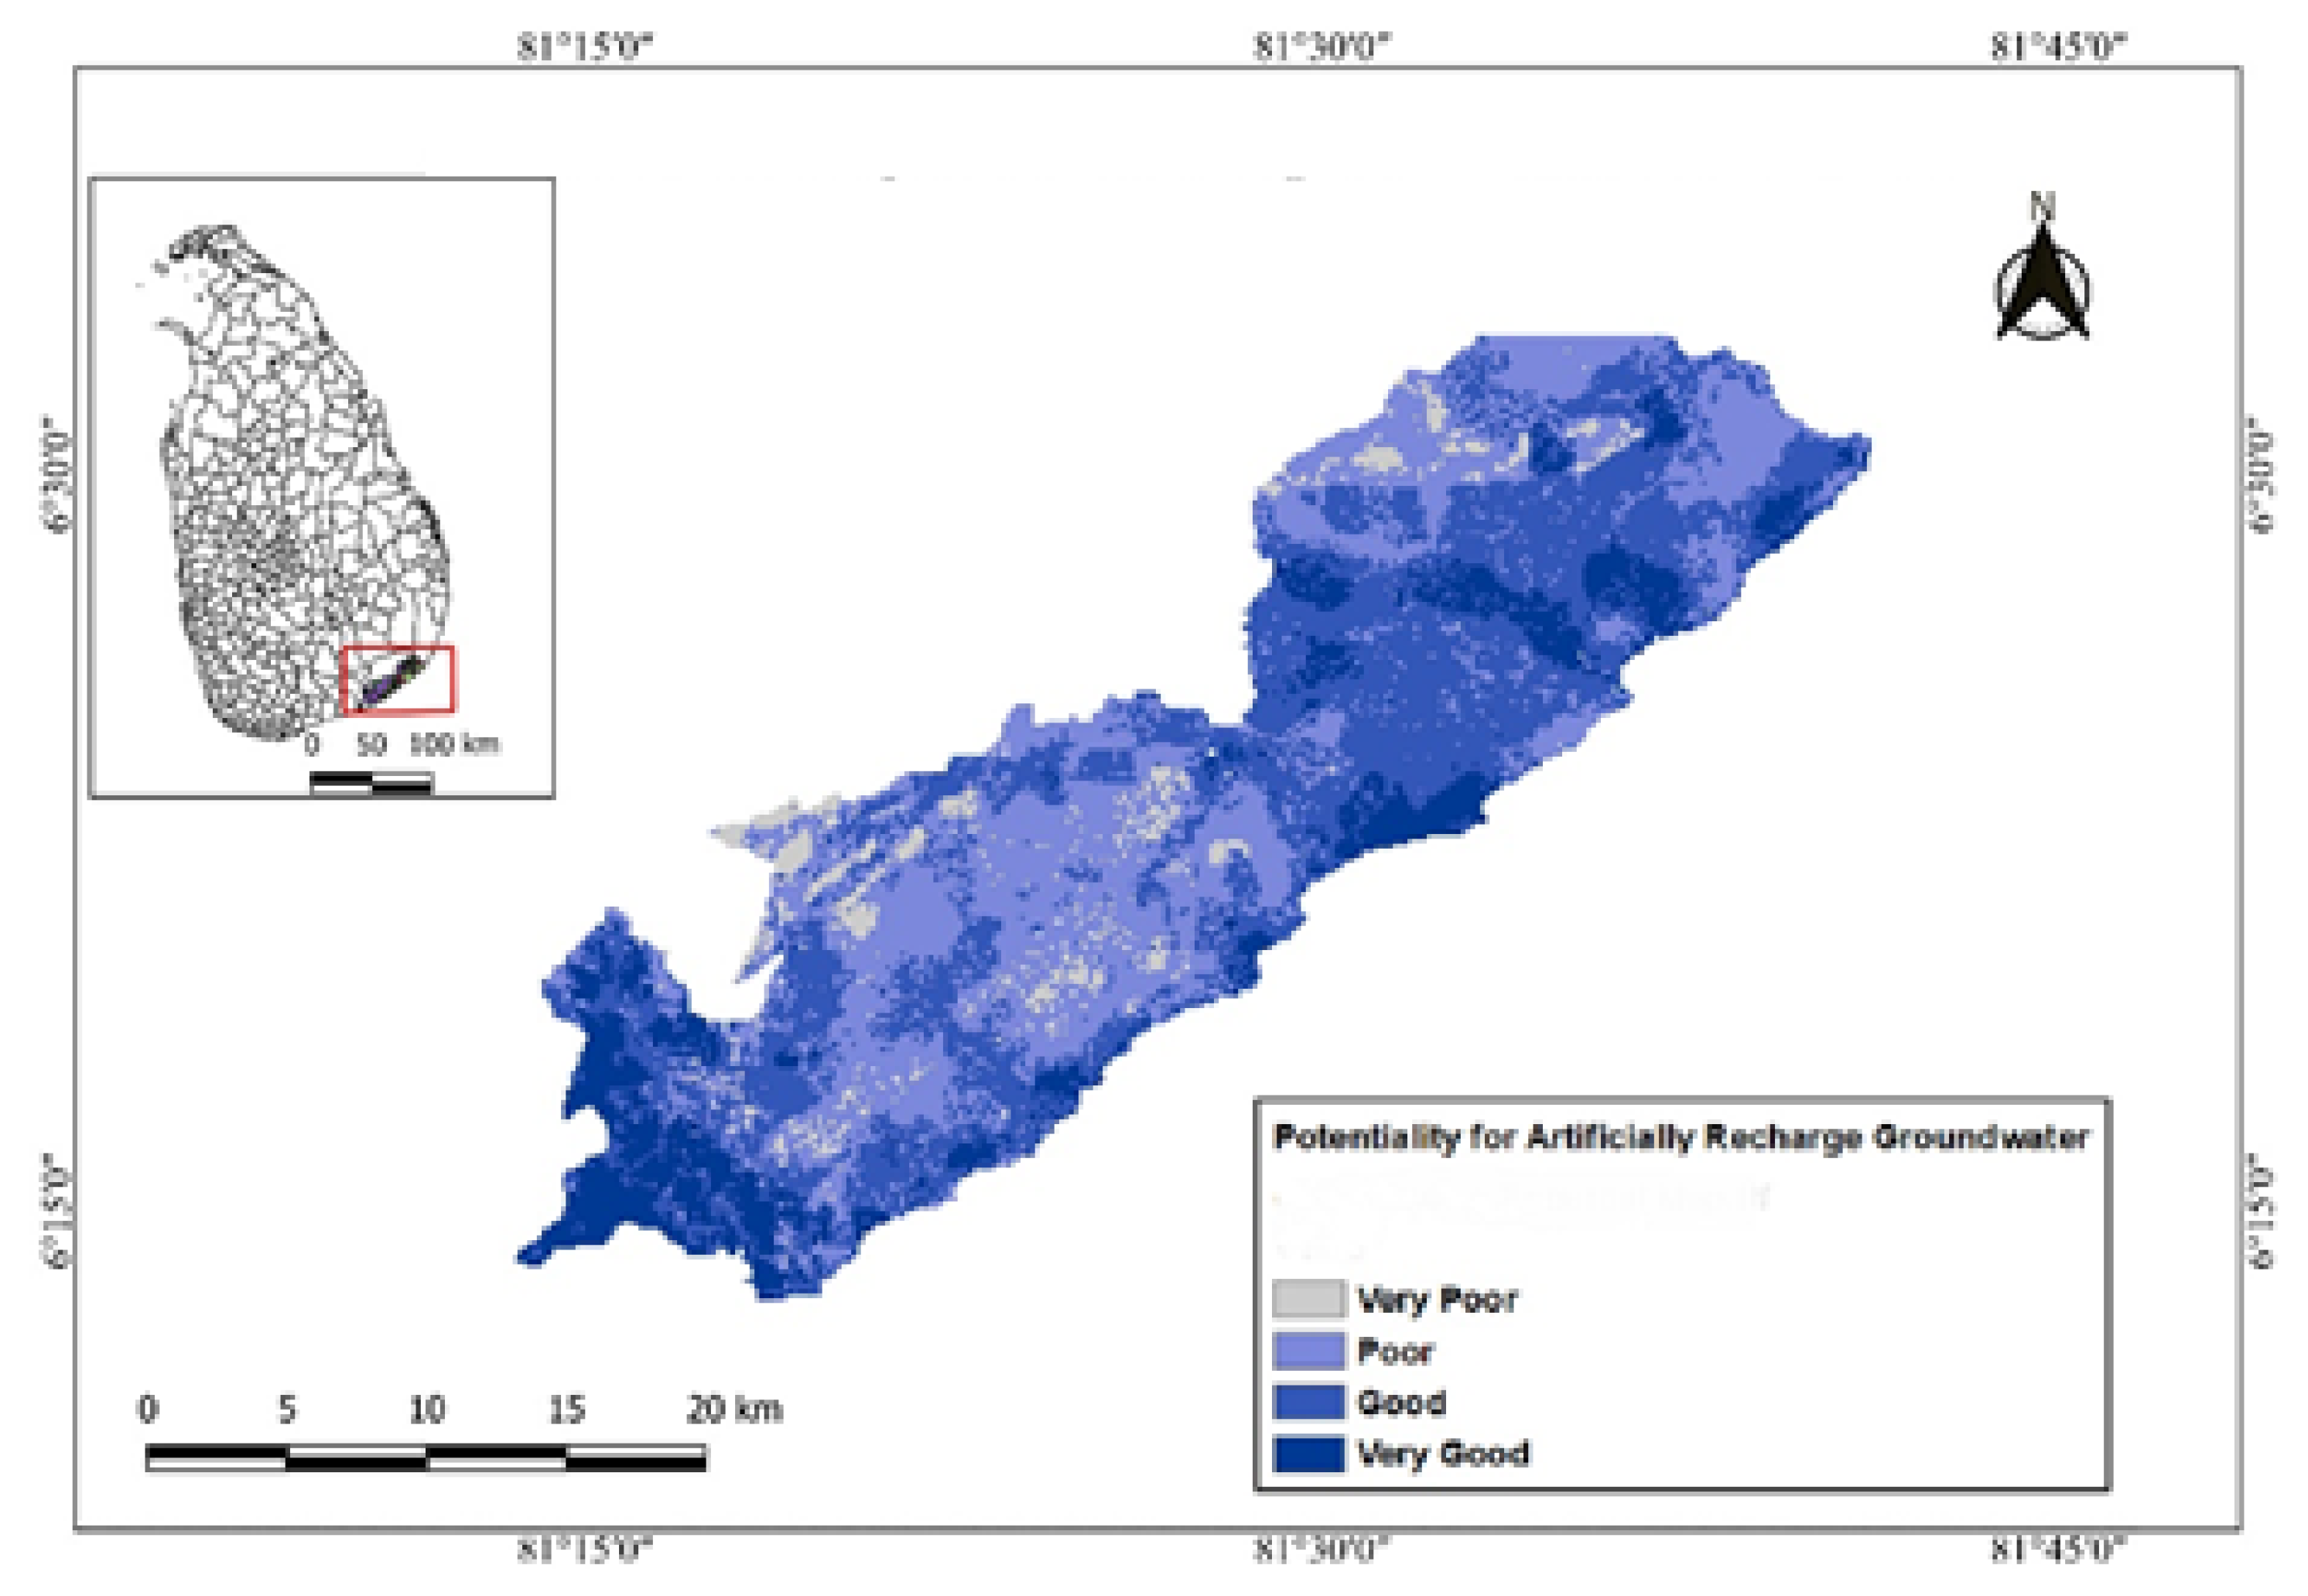
5.3. Groundwater Recharge Potential Zones

The potential groundwater recharge—PGWR (weighted overlay value) is used to categorize the study area into four potential groundwater recharge classes (very good, good, poor, and very poor) as shown in Table 3.
These developed potential groundwater recharge classes, through the weighted overlay procedure considering rainfall, slope, drainage density, soil cover, land use, and land cover characteristics, show the favorability and suitability of the groundwater recharging process. A map of potential zones for artificial groundwater recharge in the Tissamaharama Divisional Secretariat Division is shown in Figure 7. The developed artificial groundwater recharge potential map shows that 14.60% (about 62 km2) of the area of Tissamaharama DSD has very good potential for groundwater recharging while 41.32% (174 km2) has good potential. Areas consisting of strong drainage networks, surface water resources over the flat terrain with a gentle slope, and a covering of highly permeable soil acquire quality potential levels for groundwater recharging. However, 39.03% (164 km2) of the area showed poor potential while 5.05% (about 21 km2) of the area indicated a very poor potential for groundwater recharging. That unfavorable condition may be created due to the lack of rainfall, not having enough surface water resources, steep slopes, and the existence of low-permeability soil cover.
In this study, identifying the potential zones for artificial groundwater recharge was performed depending on the five parameters of rainfall, drainage density, slope, soil cover, land use, and land cover whose characteristics directly affect the procedure of groundwater recharging.
Rainfall is a paramount resource that contributes to the groundwater recharging process. Considering Tissamaharama DSD, annual rainfall is received mainly from October to January from the northeast monsoon rains. The prepared rainfall map of the study area outlines five classes of average annual rainfall varying from 975 mm to 1100 mm. Rainfall directly involves the process of groundwater recharging. Both maximal runoff and high infiltration occur during periods with high-intensity rainfall. Moreover, an enormous volume of water is reserved in surface water bodies with strong recharging of the aquifers in the rainy seasons. Hence, areas with a high intensity of rainfall have more potential for groundwater recharging.
Slope can be considered one of the most influential factors regarding the recharging of groundwater. According to the developed slope map layer of Tissamaharama DSD, most of the study area consists of flat terrain with very low slopes. Flat terrain contributes to a higher potential for groundwater recharging by slowing down the runoff speed and supplying more time for the surface water to infiltrate into the subsurface. Therefore, gentle slopes get a higher weight related to their groundwater recharging potentiality than steeper slopes.
Drainage density can be presented as the total length of the drainage network in a unit area and drainage density in the study area varying from 0 to 7 km/km2 according to the developed drainage density map of Tissamaharama DSD. The areas corresponding to Kirindi Oya and Manik Ganga basins have acquired high drainage densities in the Tissamaharama DSD. Higher drainage density values are an indication of greater percolation levels and reduced surface runoff rates [11]. Therefore, the areas with higher drainage densities have more capacity for artificial groundwater recharging. In contrast, if the area has higher drainage density and steeper slopes, this can retard the potential for recharging, due to the increased rates of runoff caused by the steep slopes, which will reduce the water retaining time and thereby reduce the infiltration amounts. However, in general, Tissamaharama DSD predominantly consists of flat terrain with low slopes. Therefore, in the assigning of weight process, areas with rich drainage density got a high potential and weight as facilitators in those areas of aquifer recharging.
Land cover and land use influence the groundwater recharge potential by affecting the runoff and infiltration capacity of the underlying soils and evapotranspiration [29,30]. Considering the map layer of land use/land cover, 20 classes of land coverings in the Tissamaharama DSD can be identified. A significant amount of the study area is covered with forests. The presence of vegetation increases the infiltration capacity. At the same time, forest areas create unfavorable conditions for groundwater recharging mainly due to the high evapotranspiration rates over forested areas, caused mostly by vegetation with deep roots [31]. Further, excessive interception under forest cover affects the groundwater recharging process by limiting available water for recharging [29]. Therefore, classes with forest vegetation got moderately low weightage in the weight-assigning process relevant to the potential for recharging. Vegetation with shallow roots such as scrubland gives a relatively high contribution to groundwater recharging compared to deep-rooted forest cover. Managed land use areas such as cropland and other cultivational areas have a lower loss of interception. Hence, they gained a moderately higher potential than forests. Paddy lands become beneficial for the groundwater recharge process as they perform like artificial wetlands. A considerable increment of surface water flow in urban areas can be seen by reducing the travel time of flows to streams, and in parallel, the recharging process of groundwater to aquifers decreases. Given this, urbanized areas were given low weights. Areas associated with surface water bodies show great potential for groundwater recharging.
According to the soil cover map of Tissamaharama DSD, nine soil types were observed. The favorability for groundwater recharging depends on the soil characteristics (grain size and shape, void ratio, structural arrangement, and the existence of other foreign matter in the soil, etc.) that define the water-holding capacity of a certain soil, which will influence the groundwater flow as well [1,11]. Soil permeability is directly related to the rates of infiltration and percolation. Early percolation of water is allowed in the reddish-brown earth, and it has good porosity, making better aquifers. The running water of basins forms depositional structures of alluvial soil, which consist of finer sediment and grain size along with a deficient sorting order. Alluvial soil can be identified as considerably positive for groundwater recharging. Beach and dune sand contains high permeability levels. As with runoff water from hilly terrain, erosional remnants have a low potential for groundwater recharging. Moreover, rock surfaces have a restricted potential for recharging.
All five parameters discussed above (rainfall, slope, drainage density, soil cover, land use, and land cover) were assumed to have the same impact on groundwater recharge potential in this study. Therefore, the same weight was incorporated among these parameters. Further studies can be conducted in the direction of identifying the individual importance of these parameters in groundwater recharge. Thus, a sensitivity analysis can be carried out to find the most influencing parameters and assign higher weights for those.

6. Summary and Conclusions

The current research was conducted to identify the potential zones for artificially recharging groundwater in one of the arid regions in Sri Lanka, which has not gained much attention in previous studies. The area is facing water scarcity because of its climate characteristics, location, and other anthropogenic activities. The method was designed to integrate the influence of five selected factors that contribute to the artificial groundwater recharging potential in arid regions, which are rainfall, drainage density, slope, soil cover, and land use–land cover. Then, a weighted overlay analysis was carried out to generate the final groundwater recharge potential map. The GIS approach was adopted to produce thematic layers corresponding to the above factors and to integrate them based on their assigned weights and parameter values. The weights were assigned to classes of each factor depending on their favorability and contribution to the groundwater recharging process. The results of the study illustrate that 14.60% of land in the Tissamaharama DSD has very good potential and 41.32% of the area has a good potential for groundwater recharging. Further, 39.03% of Tissamaharama DSD was found to have poor potential, and 5.05% of the area was revealed to have a very poor potential for groundwater recharging. These favorable potential sites for groundwater recharging were acquired through the factors of better drainage density, especially in Kirindi Oya and Manik Ganga, as well as rich surface water resources over the flat terrain and the covering of highly permeable soil types.
In the proposed method, the five most influential factors for groundwater potential, considering the data availability, were used. However, there can be other factors that contribute to groundwater recharge potential such as subsurface and aquifer characteristics [9] (vadose zone, aquifer thickness, etc.). Therefore, it is recommended to include these factors in future studies. The results of this study can be further verified by using field observations, such as measurements taken using monitoring wells, and analyzed together with the groundwater potential map developed in the study.

Author Contributions

Conceptualization, S.W.; methodology, T.K. and V.B.; software, T.K.; validation, T.K.; formal analysis, T.K. and V.B.; resources, S.W.; data curation, T.K. and V.B.; writing—original draft preparation, T.K. and V.B.; writing—review and editing, S.W., R.S. and U.R.; visualization, T.K. and V.B.; supervision, S.W. and U.R.; project administration, U.R.; All authors have read and agreed to the published version of the manuscript.

Funding

This research received no external funding.

Data Availability Statement

Not applicable.

Acknowledgments

Authors would like to state the support that they have received from the Sri Lanka Institute of Information Technology (SLLIT) in conducting this research work.

Conflicts of Interest

The authors declare no conflict of interest.

References

  1. Senanayake, I.P.; Dissanayake, D.M.D.O.K.; Mayadunna, B.B.; Weerasekera, W.L. An approach to delineate groundwater recharge potential sites in Ambalantota, Sri Lanka using GIS techniques. Geosci. Front. 2016, 7, 115–124. [Google Scholar] [CrossRef] [Green Version]
  2. Bouwer, H. Artificial recharge of groundwater: Hydrogeology and engineering. Hydrogeol. J. 2002, 10, 121–142. [Google Scholar] [CrossRef] [Green Version]
  3. McCracken, M.; Wolf, A.T. Updating the Register of International River Basins of the world. Int. J. Water Resour. Dev. 2019, 35, 732–782. [Google Scholar] [CrossRef]
  4. Ramya, R.; Nanthakumaran, A.; Senanayake, I.P. Identification of artificial groundwater recharge zones in Vavuniya district using remote sensing and GIS. AGRIEAST J. Agric. Sci. 2019, 13, 44–55. [Google Scholar] [CrossRef]
  5. Prabhu, M.V.; Venkateswaran, S. Delineation of Artificial Recharge Zones Using Geospatial Techniques in Sarabanga Sub Basin Cauvery River, Tamil Nadu. Aquat. Procedia 2015, 4, 1265–1274. [Google Scholar] [CrossRef]
  6. Brands, E.; Rajagopal, R.; Eleswarapu, U.; Li, P. Groundwater: Natural and physicalscience perspectives. Int. Encycl. Geogr. 2016. [Google Scholar]
  7. Mokhena, T.; Mochane, M.; Tshwafo, M.; Linganiso, L.; Thekisoe, O.; Songca, S. Groundwater Recharges Technology for Water Resource Management: A Case Study. In Groundwater; IntechOpen: London, UK, 2016; pp. 225–240. [Google Scholar]
  8. Sophocleous, M. Interactions between groundwater and surface water: The state of the science. Hydrogeol. J. 2002, 10, 348. [Google Scholar] [CrossRef]
  9. Rajasekhar, M.; Sudarsana Raju, G.; Sreenivasulu, Y.; Siddi Raju, R. Delineation of groundwater potential zones in semi-arid region of Jilledubanderu river basin, Anantapur District, Andhra Pradesh, India using fuzzy logic, AHP and integrated fuzzy-AHP approaches. HydroResearch 2019, 2, 97–108. [Google Scholar] [CrossRef]
  10. Das, B.; Pal, S.C. Combination of GIS and fuzzy-AHP for delineating groundwater recharge potential zones in the critical Goghat-II block of West Bengal, India. HydroResearch 2019, 2, 21–30. [Google Scholar] [CrossRef]
  11. Abijith, D.; Saravanan, S.; Singh, L.; Jennifer, J.J.; Saranya, T.; Parthasarathy, K.S.S. GIS-based multi-criteria analysis for identification of potential groundwater recharge zones—A case study from Ponnaniyaru watershed, Tamil Nadu, India. HydroResearch 2020, 3, 1–14. [Google Scholar] [CrossRef]
  12. Al-Othman, A.A. Enhancing groundwater recharge in arid region- a case study from central Saudi Arabia. Sci. Res. Essays 2011, 6, 2757–2762. [Google Scholar]
  13. Adeyeye, O.A.; Ikpokonte, E.A.; Arabi, S.A. GIS-based groundwater potential mapping within Dengi area, North Central Nigeria. Egypt. J. Remote Sens. Sp. Sci. 2019, 22, 175–181. [Google Scholar] [CrossRef]
  14. Lakshmi, V.; Reddy, V.K. Identification of Groundwater Potential Zones using GIS and Remote Sensing. Int. J. Pure Appl. Math. 2018, 119, 3195–3210. [Google Scholar]
  15. Jaiswal, R.K.; Mukherjee, S.; Krishnamurthy, J.; Saxena, R. Role of remote sensing and GIS techniques for generation of groundwater prospect zones towards rural development—An approach. Int. J. Remote Sens. 2003, 24, 993–1008. [Google Scholar] [CrossRef]
  16. Somartha, M.; Silva, R.P.; Chaminda, G.H.; Weragoda, G.G.T.; Kumar, S.K. Identifying groundwater recharge zones through MIKE modeling approach: A case study at mid Kelani river, Sri Lanka. In Proceedings of the 6th International Symposium on Advances in Civil and Environmental Engineering Practices for Sustainable Development (ACEPS-2018), Galle, Sri Lanka, 15 March 2018; pp. 247–254. [Google Scholar]
  17. Adimalla, N.; Taloor, A.K. Hydrogeochemical investigation of groundwater quality in the hard rock terrain of South India using Geographic Information System (GIS) and groundwater quality index (GWQI) techniques. Groundw. Sustain. Dev. 2019, 10, 100–288. [Google Scholar] [CrossRef]
  18. Babiker, I.S.; Mohamed; Hiyama, T. Assessing groundwater quality using GIS. Water Resour. Manag. 2006, 21, 699–715. [Google Scholar] [CrossRef]
  19. Nas, B.; Berktay, A. Groundwater quality mapping in urban groundwater using GIS. Environ. Monit. Assess. 2008, 160, 215–227. [Google Scholar] [CrossRef]
  20. Baalousha, H.M. Mapping groundwater contamination risk using GIS and groundwater modelling. A case study from the Gaza Strip, Palestine. Arab. J. Geosci. 2010, 4, 483–494. [Google Scholar] [CrossRef]
  21. Merchant, J.W. GIS-based groundwater pollution hazard assessment: A critical review of the DRASTIC model. Photogramm. Eng. Remote Sens. 1994, 60, 1117–1127. [Google Scholar]
  22. Singh, S.K.; Zeddies, M.; Shankar, U.; Griffiths, G.A. Potential groundwater recharge zones within New Zealand. Geosci. Front. 2019, 10, 1065–1072. [Google Scholar] [CrossRef]
  23. Jagriti Tiwari, R.J.P.S.K.S. Gour River Sub-watersheds Prioritization using Morphometric Parameters: A Remote Sensing and GIS Based Approach. Int. J. Sci. Eng. Technol. Res. 2016, 5. [Google Scholar]
  24. Maity, B.; Mallick, S.K.; Das, P.; Rudra, S. Comparative analysis of groundwater potentiality zone using fuzzy AHP, frequency ratio and Bayesian weights of evidence methods. Appl. Water Sci. 2022, 12, 63. [Google Scholar] [CrossRef]
  25. EarthExplorer. Available online: https://earthexplorer.usgs.gov/ (accessed on 1 November 2022).
  26. Jie, F.; Fei, L.; Li, S.; Hao, K.; Liu, L.; Li, J.; Liu, N. Quantitative effects of vadose zone thickness on delayed recharge of groundwater for an irrigation district in an arid area of Northwest China. J. Hydrol. Reg. Stud. 2022, 40, 101022. [Google Scholar] [CrossRef]
  27. Department of Agriculture Sri lanka. Available online: https://doa.gov.lk/home-page/ (accessed on 1 November 2022).
  28. Survey Department of SriLanka. Available online: https://survey.gov.lk/ (accessed on 1 November 2022).
  29. Chen, X.; Yan, J.F.; Chen, Z.; Luo, G.P.; Song, Q.; Xu, W.Q. A spatial geostatistical analysis of impact of landuse development on groundwater resourcesin the Sangong Oasis Region using remotesensing imagery and data. J. Arid Land 2009, 1, 1–8. [Google Scholar] [CrossRef]
  30. Saravanan, S.; Jacinth, J.J.; Singh, L.; Saranya, T.; Sivaranjani, S. Impact of land-use change on soil erosion in the Coonoor watershed, Nilgiris mountain range, Tamil Nadu, India. Adv. Sci. Technol. Innov. 2019, 109–111. [Google Scholar] [CrossRef]
  31. Tiwari, A.; Ahuja, A.; Vishwakarma, B.D.; Jain, K. Groundwater potential zone (GWPZ) for urban development site suitability analysis in Bhopal, India. J. Indian Soc. Remote Sens. 2019, 47, 1793–1815. [Google Scholar] [CrossRef]
Figure 1. Location of the study area, Tissamaharama DSD in Sri Lanka.
Hydrology 09 00224 g001
Figure 2. Soil type distribution in Tissamaharama DSD.
Hydrology 09 00224 g002
Figure 3. Landuse patterns in Tissamaharama DSD.
Hydrology 09 00224 g003
Figure 4. Overview of the research methodology adopted in the current study.
Hydrology 09 00224 g004
Figure 5. Average annual rainfall map of Tissamaharama DSD.
Hydrology 09 00224 g005
Figure 6. (a) Slope map, and (b) Drainage density map of Tissamaharama DSD.
Hydrology 09 00224 g006aHydrology 09 00224 g006b
Figure 7. Artificial groundwater recharge potential zones in Tissamaharama DSD.
Hydrology 09 00224 g007
Table 1. Rainfall gauging stations within Tissamaharama DSD.
Rainfall Gauging StationLocation Coordinates
Longitude (°)Latitude (°)
Tissamaharama Irrigation81.2939886.292839
Weerawila81.2287726.370483
Table 2. Assigned weights to each class of selected thematic layers, based on their influence on the artificial groundwater recharging.
Map LayerClassWeight
Average annual rainfall (mm)975–10002
1000–10253
1025–10504
1050–10756
1075–11008
Slope (°)0–0.59
0.5–18
1–36
3–54
5–103
10–151
Landuse/Land coverBuilt up area2
Barren land5
Open forest3
Dense forest3
Grassland3
Mangrove6
Marsh land7
Forest plantation3
Scrubland5
Sparsely used croplands5
Forest unclassified3
Cemetery2
Coconut6
Paddy7
Other cultivation5
Water bodies8
Rock2
Sand8
Homesteads/garden2
Quarry2
Soil coverAlluvial soils of variable drainage and texture5
Erosional remnants2
Reddish-brown earths and low humic gley soils; undulating terrain6
Reddish-brown earths and Solodized Solonetz; undulating terrain4
Reddish-brown earths with a high amount of gravel in the subsoil and low humic gley soils; undulating terrain6
Regosols on recent beach and dune sands; flat terrain8
Rock knob plain2
Solodized Solonetz and Solonchaks; flat terrain4
Alluvial soils of variable drainage and texture5
Drainage density (km/km2)0–0.51
0.5–12
1–23
2–35
3–56
5–78
Table 3. Potential groundwater recharge classes.
PGWR (Weighted Overlay Value)Potential Groundwater Recharge Classes
>40Very good
30–40Good
20–30Poor
<20Very poor
Publisher’s Note: MDPI stays neutral with regard to jurisdictional claims in published maps and institutional affiliations.

