4.1. Siling Co Lake Area Changes
The changes in Siling Co lake area from 2003 to 2013 can be classified into three periods (
Figure 2 and
Table 3), namely, a rapidly increasing period from 2003 to 2006, a decreasing and increasing period from 2006 to 2009, and a stably increasing period from 2009 to 2013. The lake area of Siling Co was 2022.73 km
2 in 2003 and 2171.25 km
2 in 2006. From 2003 to 2006, the increase in lake area was 148.52 km
2, with a growth percentage of 7.34% and annual growth rate of 37.13 km
2·year
−1. From 2006 to 2009, the increase in lake area fluctuated. The lake area 25.75 km
2 in 2007 was smaller than that in 2006, whereas the lake area in 2008 increased to the same area as in 2005. However, in 2009, the lake area increased significantly to 2259 km
2. During this period, the growth rate of Siling Co lake area was 4.04%, with an annual growth rate of 21.93 km
2·year
−1. From 2009 to 2013, the lake area increased stably, with a small increase range (0.61%) and slow annual growth (11.8 km
2·year
−1). Overall, Siling Co lake area increased by 295.27 km
2 with a growth rate of 26.84 km
2·year
−1 from 2003 to 2013.
Figure 2.
Annual changes in the lake area of Siling Co from 2003 to 2013.
Figure 2.
Annual changes in the lake area of Siling Co from 2003 to 2013.
Table 3.
The lake area change of Siling Co from 2003 to 2013.
Table 3.
The lake area change of Siling Co from 2003 to 2013.
| Year | Change (km2) | Change Rate (%) | Growth Rate (km2∙year−1) |
|---|
| 2003–2006 | 148.52 | 7.34% | 37.13 |
| 2006–2009 | 87.75 | 4.04% | 21.94 |
| 2009–2013 | 59.00 | 2.61% | 11.8 |
| 2003–2013 | 295.2713 | 14.60% | 26.84 |
4.3. Analysis of Delayed Response
Reference series
X0 and comparison series
Xi in the analysis of delayed response are shown in
Table 4. Based on the delayed time sequence shown in
Table 2, GRA was conducted (
Table 5 and
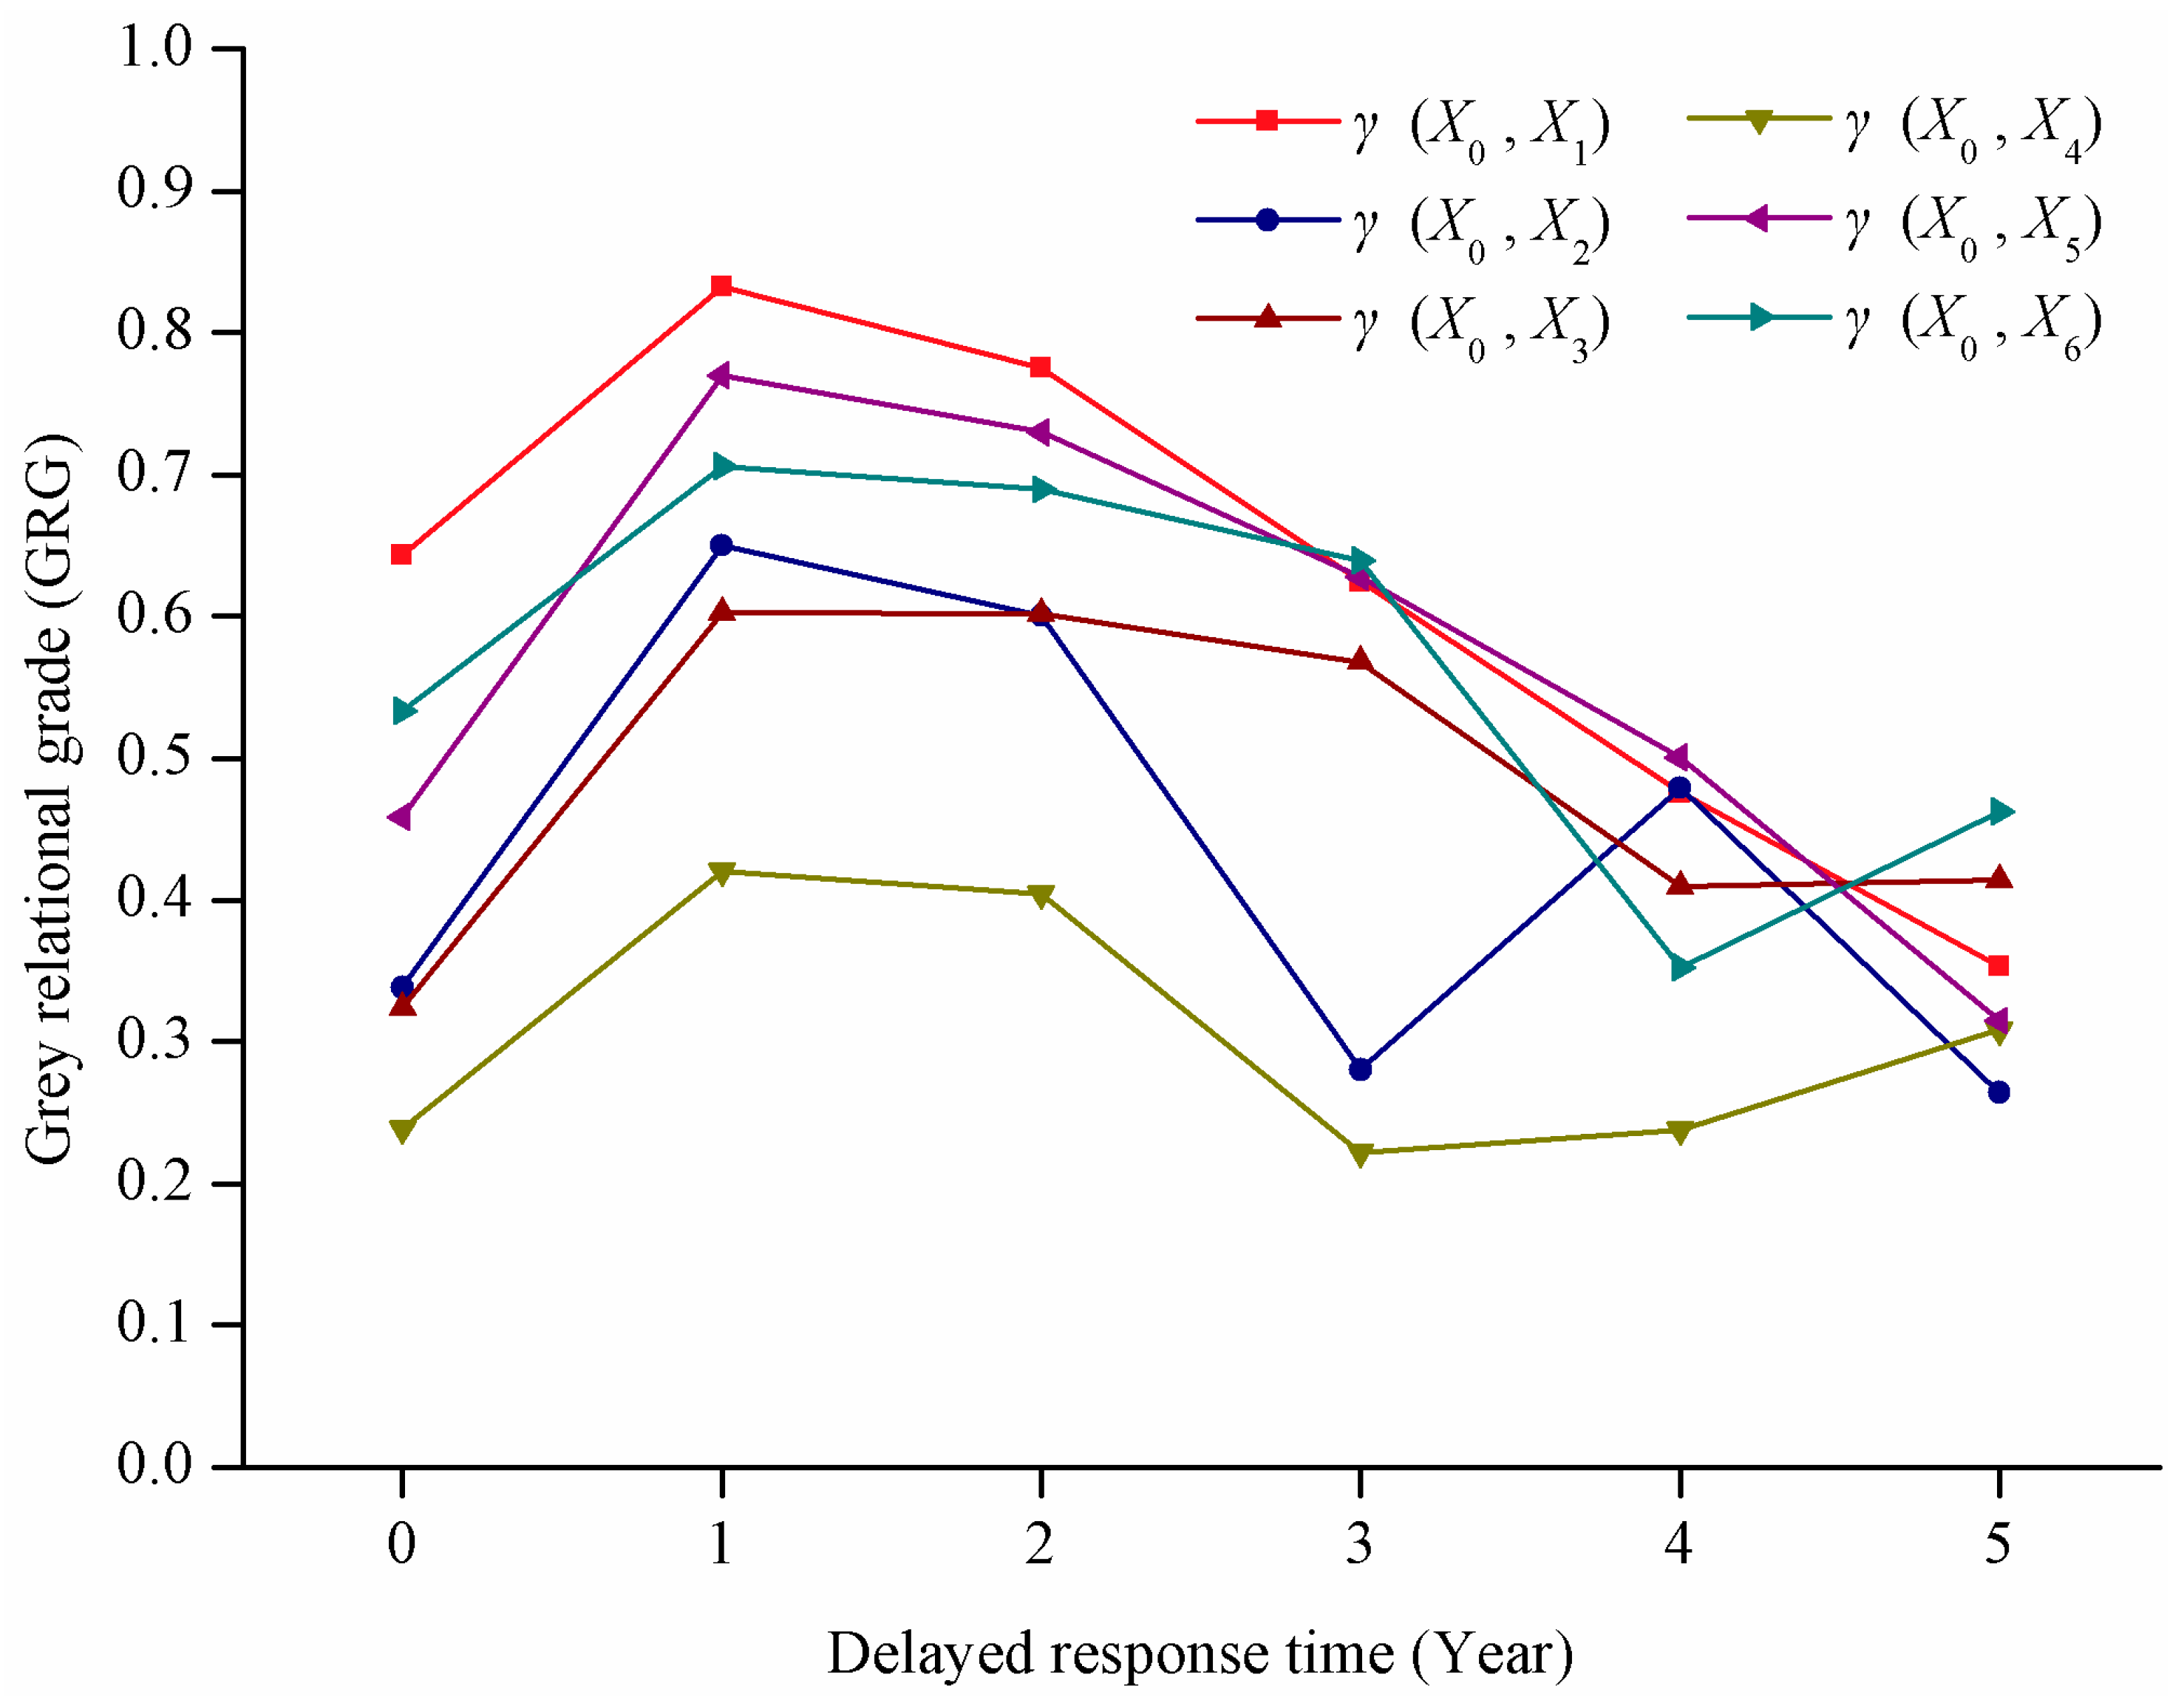
Figure 6). An evident delayed response of the Siling Co lake area to climate change was observed. The maximum GRG of various climate factors fell in the period of “delayed one year” followed by “delayed two years.” This finding indicates that delayed time is a period of time instead of an absolute value. In other words, the delayed response of the Siling Co lake area change to climate change is approximately one to two years.
Table 4.
Series value of GRA.
Table 4.
Series value of GRA.
| X | Items | Factor Series |
|---|
| X0 | Lake area of Siling Co | Reference series |
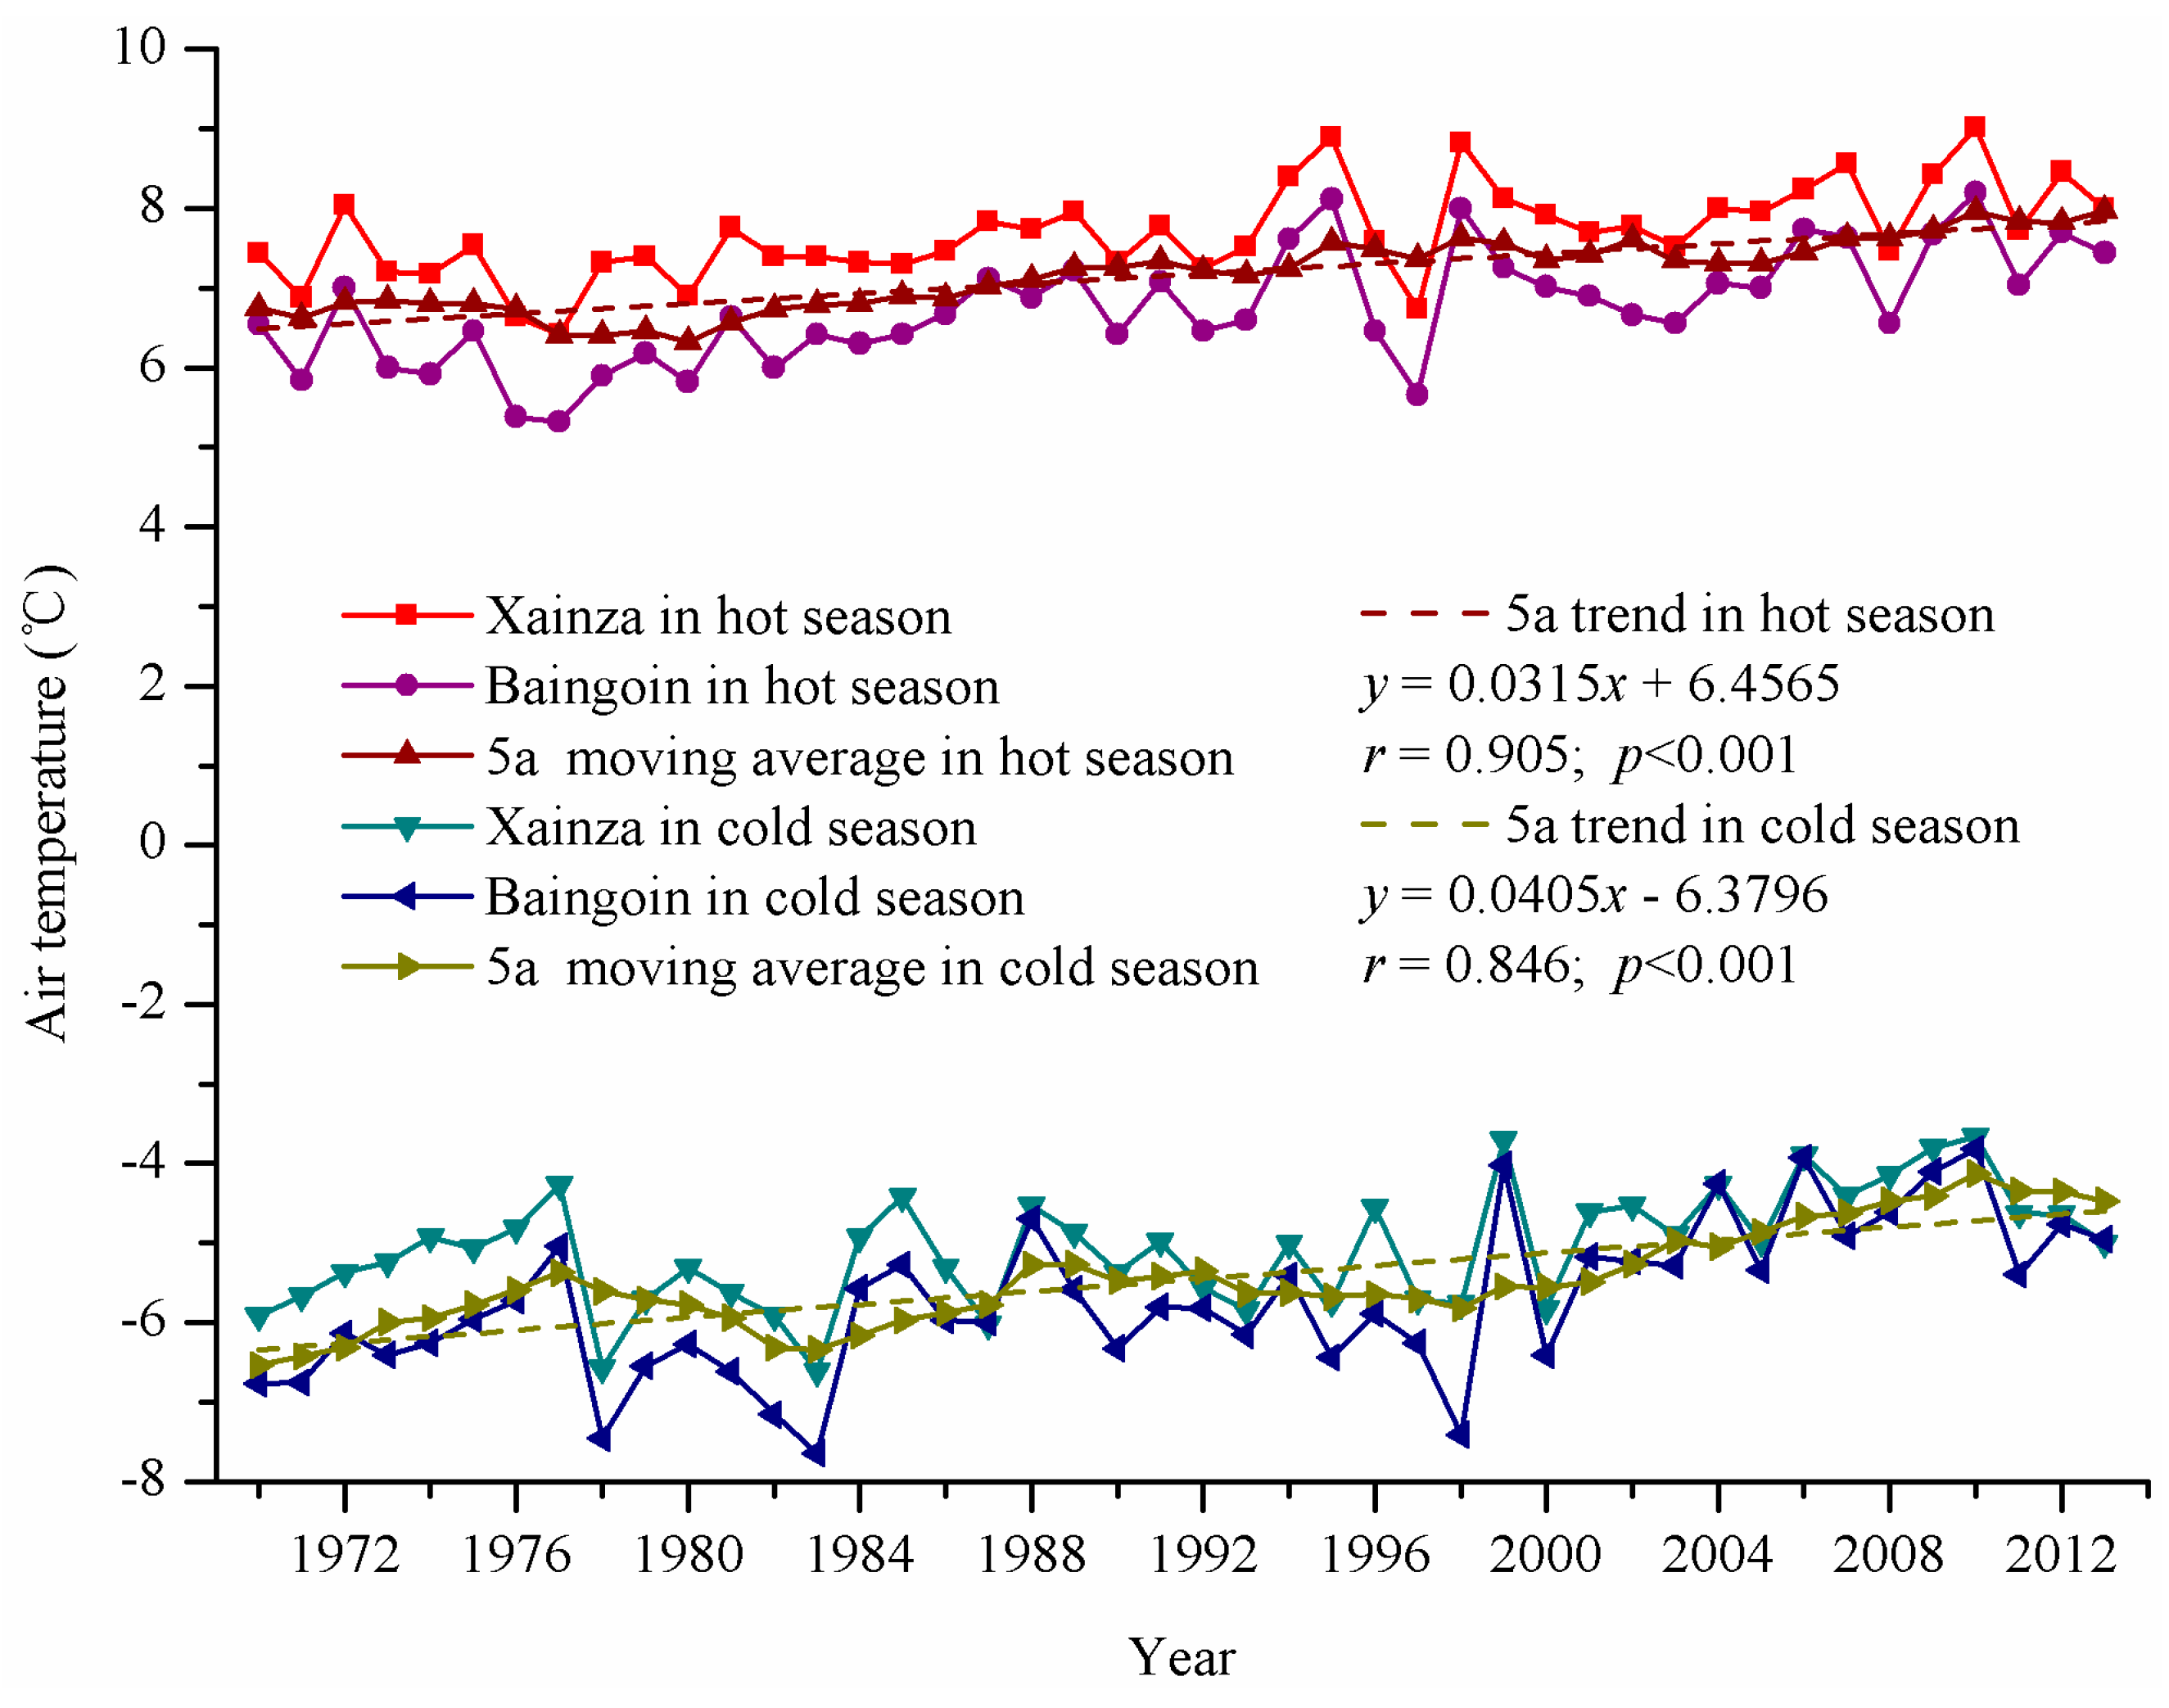
| X1 | Hot season mean air temperature (°C) | Comparison series |
| X2 | Cold season mean air temperature (°C) |
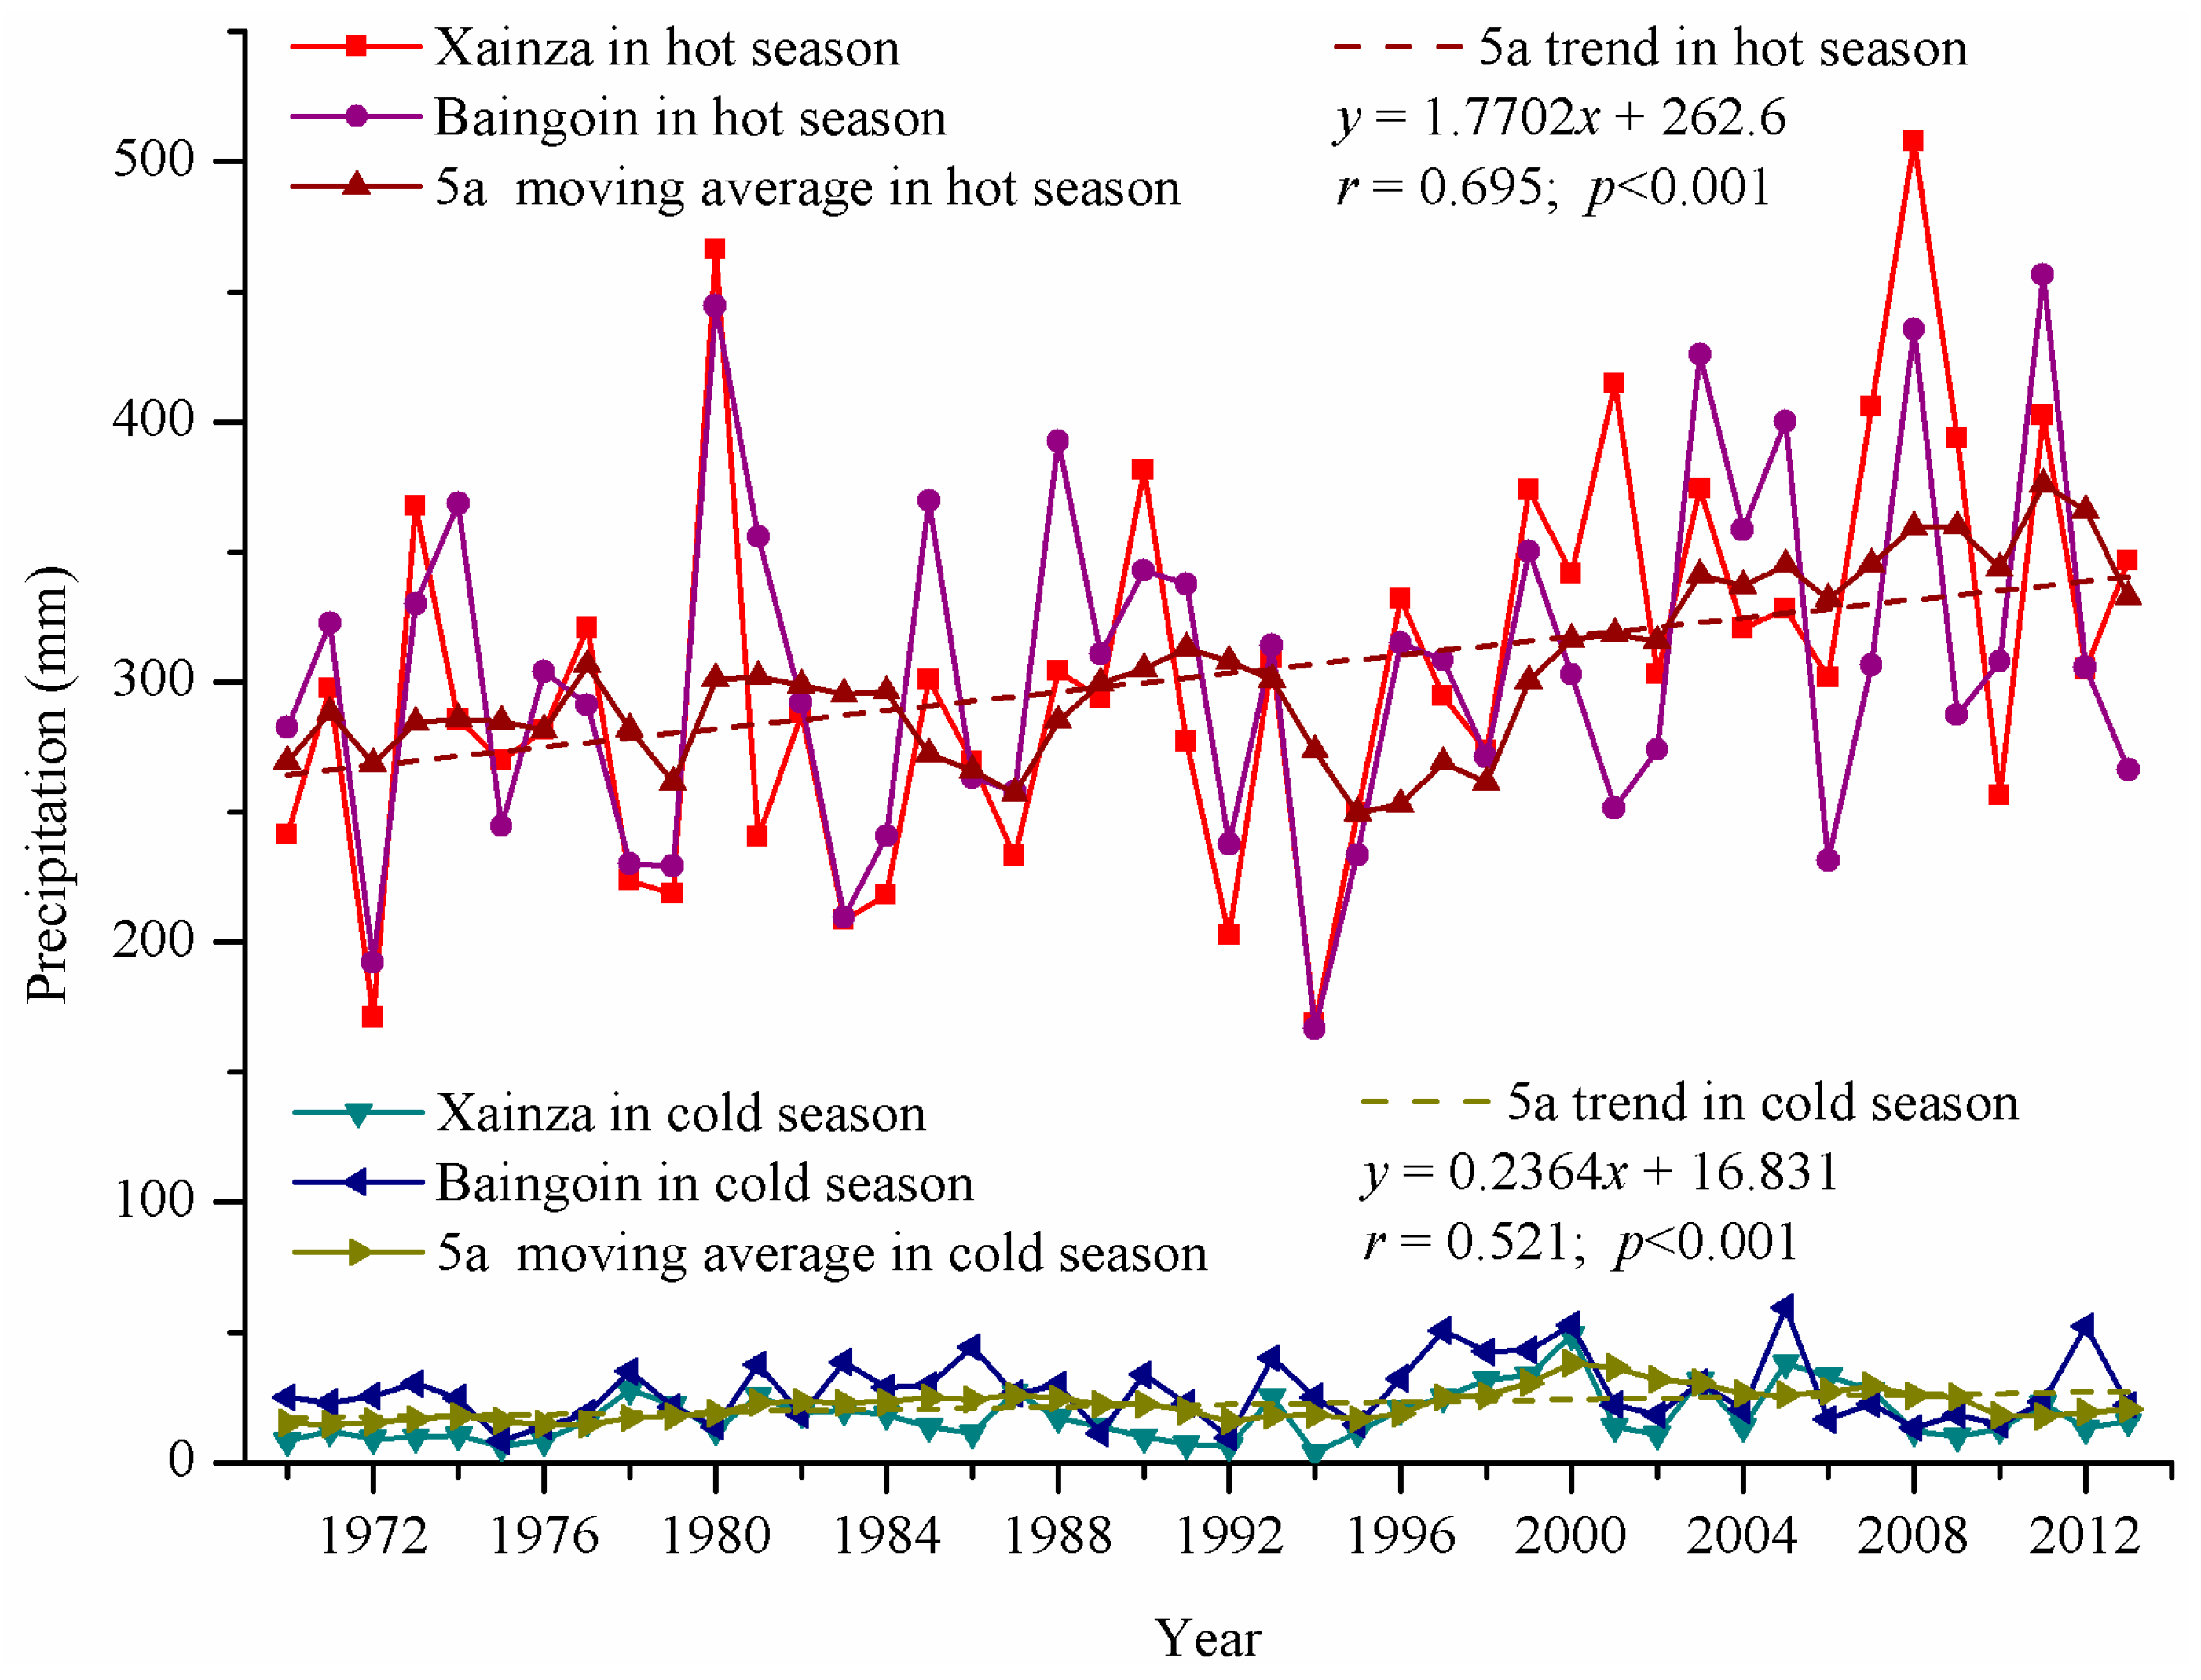
| X3 | Hot season precipitation (mm) |
| X4 | Cold season precipitation (mm) |
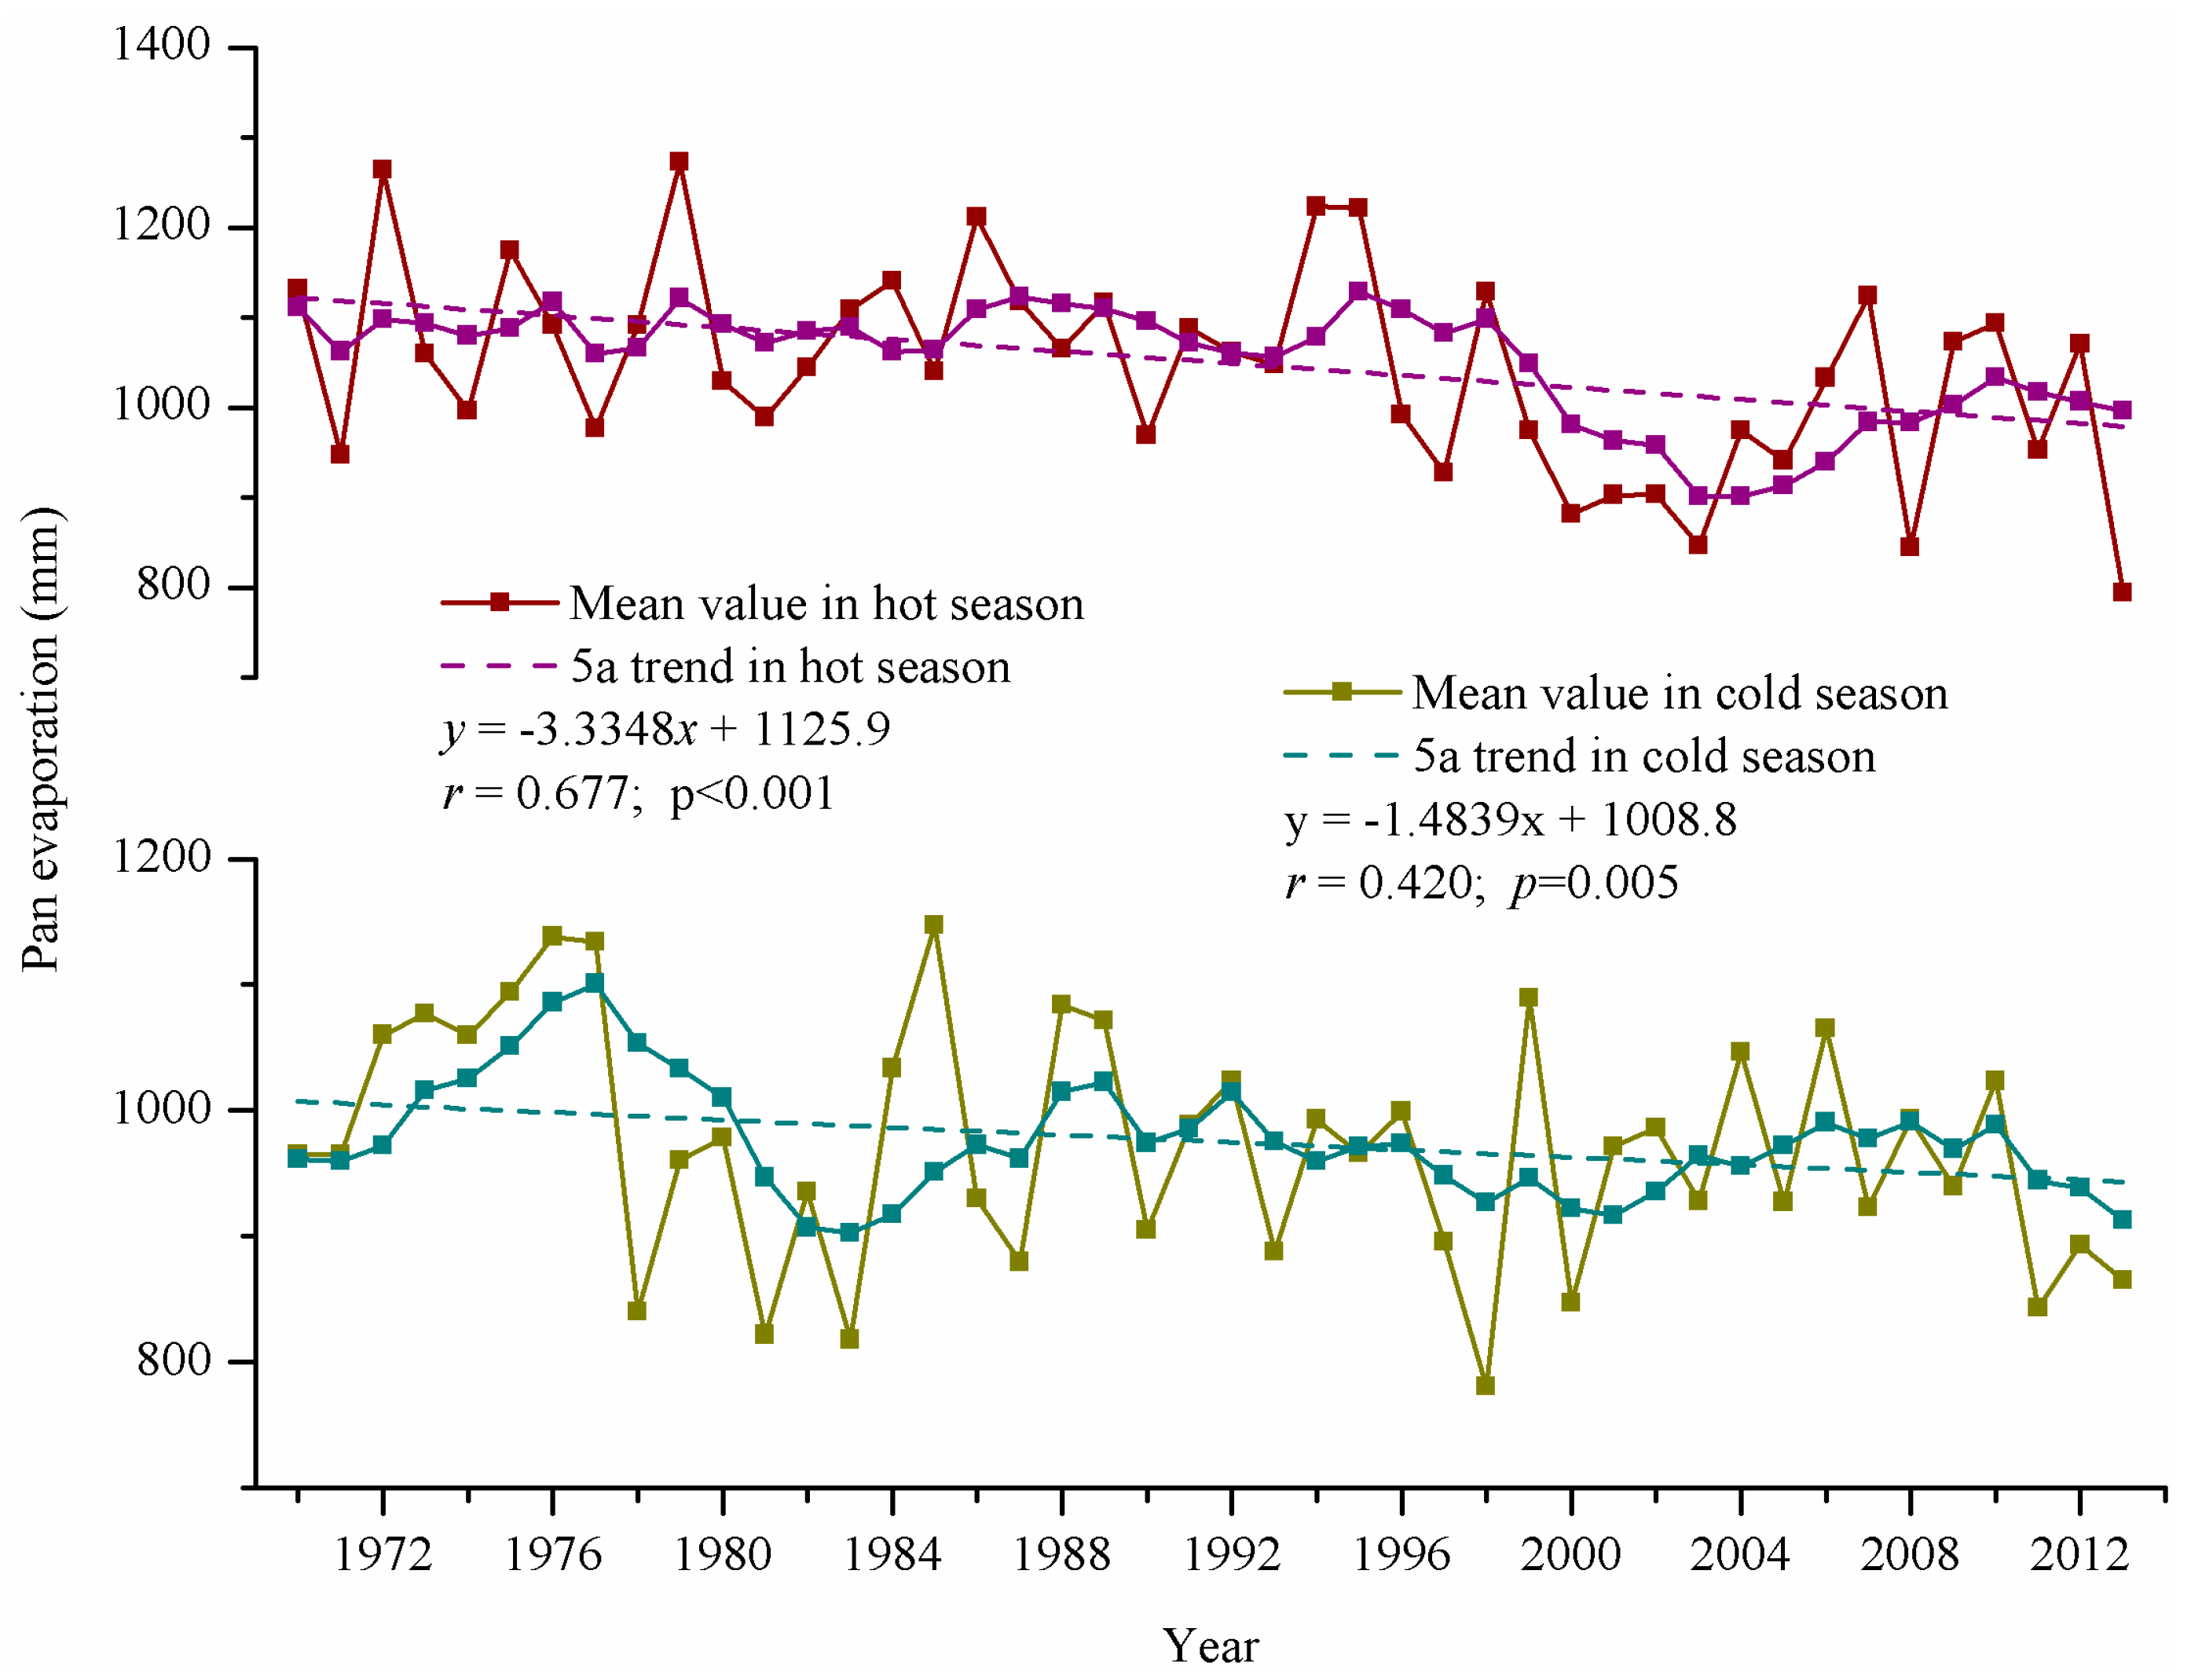
| X5 | Hot season evaporation (mm) |
| X6 | Cold season evaporation (mm) |
As a result of global climatic warming, the Qinghai-Tibetan Plateau glacier has tended to shrink in a comprehensive and accelerating way since the 1990s. According to the statistical comparison between the data of the second glacier inventory (remote sensing data were taken from 2006 to 2010) and the first inventory (remote sensing data were taken from 1950 to 1980) in China, the glacier area of the Qinghai-Tibetan Plateau within Chinese territory and its adjacent regions has retreated by 15% on average [
26].There are 642 glaciers covering about 593.09 km
2 in area and 36.37 km
3 in ice volume in the Sling Co catchment [
10]. From 1990 to 2011, the glacier area in the catchment has reduced by 34.76 km
2, with a retreat ratio of 12.55% and an annual retreat rate of 1.66 km
2·year
−1 [
14].
Table 5.
GRGs between Siling Co lake area and climate factors in different delayed response time.
Table 5.
GRGs between Siling Co lake area and climate factors in different delayed response time.
| GRG | Delayed Response Time (Year) |
|---|
| 0 | 1 | 2 | 3 | 4 | 5 |
|---|
| γ(X0,X1) | 0.6431 | 0.8325 | 0.7755 | 0.6244 | 0.4756 | 0.315 |
| γ(X0,X2) | 0.3384 | 0.6501 | 0.6003 | 0.2803 | 0.4791 | 0.2486 |
| γ(X0,X3) | 0.3239 | 0.6028 | 0.602 | 0.568 | 0.4098 | 0.4531 |
| γ(X0,X4) | 0.2389 | 0.4206 | 0.4041 | 0.222 | 0.238 | 0.2997 |
| γ(X0,X5) | 0.4586 | 0.7698 | 0.7298 | 0.628 | 0.5007 | 0.3148 |
| γ(X0,X6) | 0.5335 | 0.7057 | 0.6896 | 0.6392 | 0.3526 | 0.4627 |
Figure 6.
GRGs of delayed response time of the Siling Co lake area change to climate change.
Figure 6.
GRGs of delayed response time of the Siling Co lake area change to climate change.
Permafrost in the Qinghai-Tibetan Plateau is also highly sensitive to climate change and has experienced significant temperature increases and widespread degradation during the last several decades. The active layer thickness of permafrost has increased 19 cm from 1990s to 2010s [
27]. The ground ice melting is the main character of permafrost degradation [
28]. During the process of permafrost degradation, some of the ground ice gradually melted into water to replenish underground water and increase its runoff. The complexity of hydrological processes makes it difficult to accurately evaluate the contribution of ground ice melting to the expansion of Siling Co. While, according to conservative estimation, the contribution of ground ice melting to regional hydrological cycling is over 1% [
29].
The delayed response of Siling Co lake area changes to climate change has not been previously reported. There is no hydrological station in the Siling Co Catchment, so there is a lack of observed data on the glacier runoff and river runoff in this catchment. Here we use the research results of three inflow lakes in the Qinghai-Tibetan Plateau to explain the delayed response of Siling Co to climate. The lakes are Nam Co, Bankog Co and Qinghai Lake. The supply sources of Nam Co and Qinghai Lake are glacier runoff, river runoff and precipitation. Bankog Co has no supply of glacier runoff. Nam Co and Bankog Co have the similar climate background as Siling Co, and the linear distances to Siling Co are about 129 km and 7 km, respectively. Qinghai Lake is located in the northeast part of the Qinghai-Tibetan Plateau.
In recent years, Nam Co has also shown a trend of lake expansion and rising lake levels (
Table 6). Zhu and Wu estimated that glacial melting from glacial surface reduction since 1970 contributed to 60% of the lake level increase [
30]. The research on glacial mass balance carried out by Yao et al. also indicates that the glacial negative mass balance contributed to 50% of the Nam Co lake level rise [
31].
Table 6.
Characteristics of Siling Co and Nam Co.
Table 6.
Characteristics of Siling Co and Nam Co.
| Contents | Siling Co | Nam Co |
|---|
| Catchment area (km2) | 50,106.2 | 10,680.4 [32] |
| Glacier area in catchment in 2007 (km2) | 267 | 166.2 [30] |
| Lake area in 2013 (km2) | 2320.12 | 2142.27 |
| Lake area growth rate from 2001 to 2013 (km2·year−1) | 29.95 | 12.84 |
The Sling Co lake level rose by 8.2 m while Bankog Co, which is not supplied by glacier runoff, only rose by 0.2 m from 2000 to 2010. Based on this, Meng
et al. estimated that under the same climate background, glacier melting made Sling Co lake level rise by approximately 8 m during the 10 years from 2000 to 2010 [
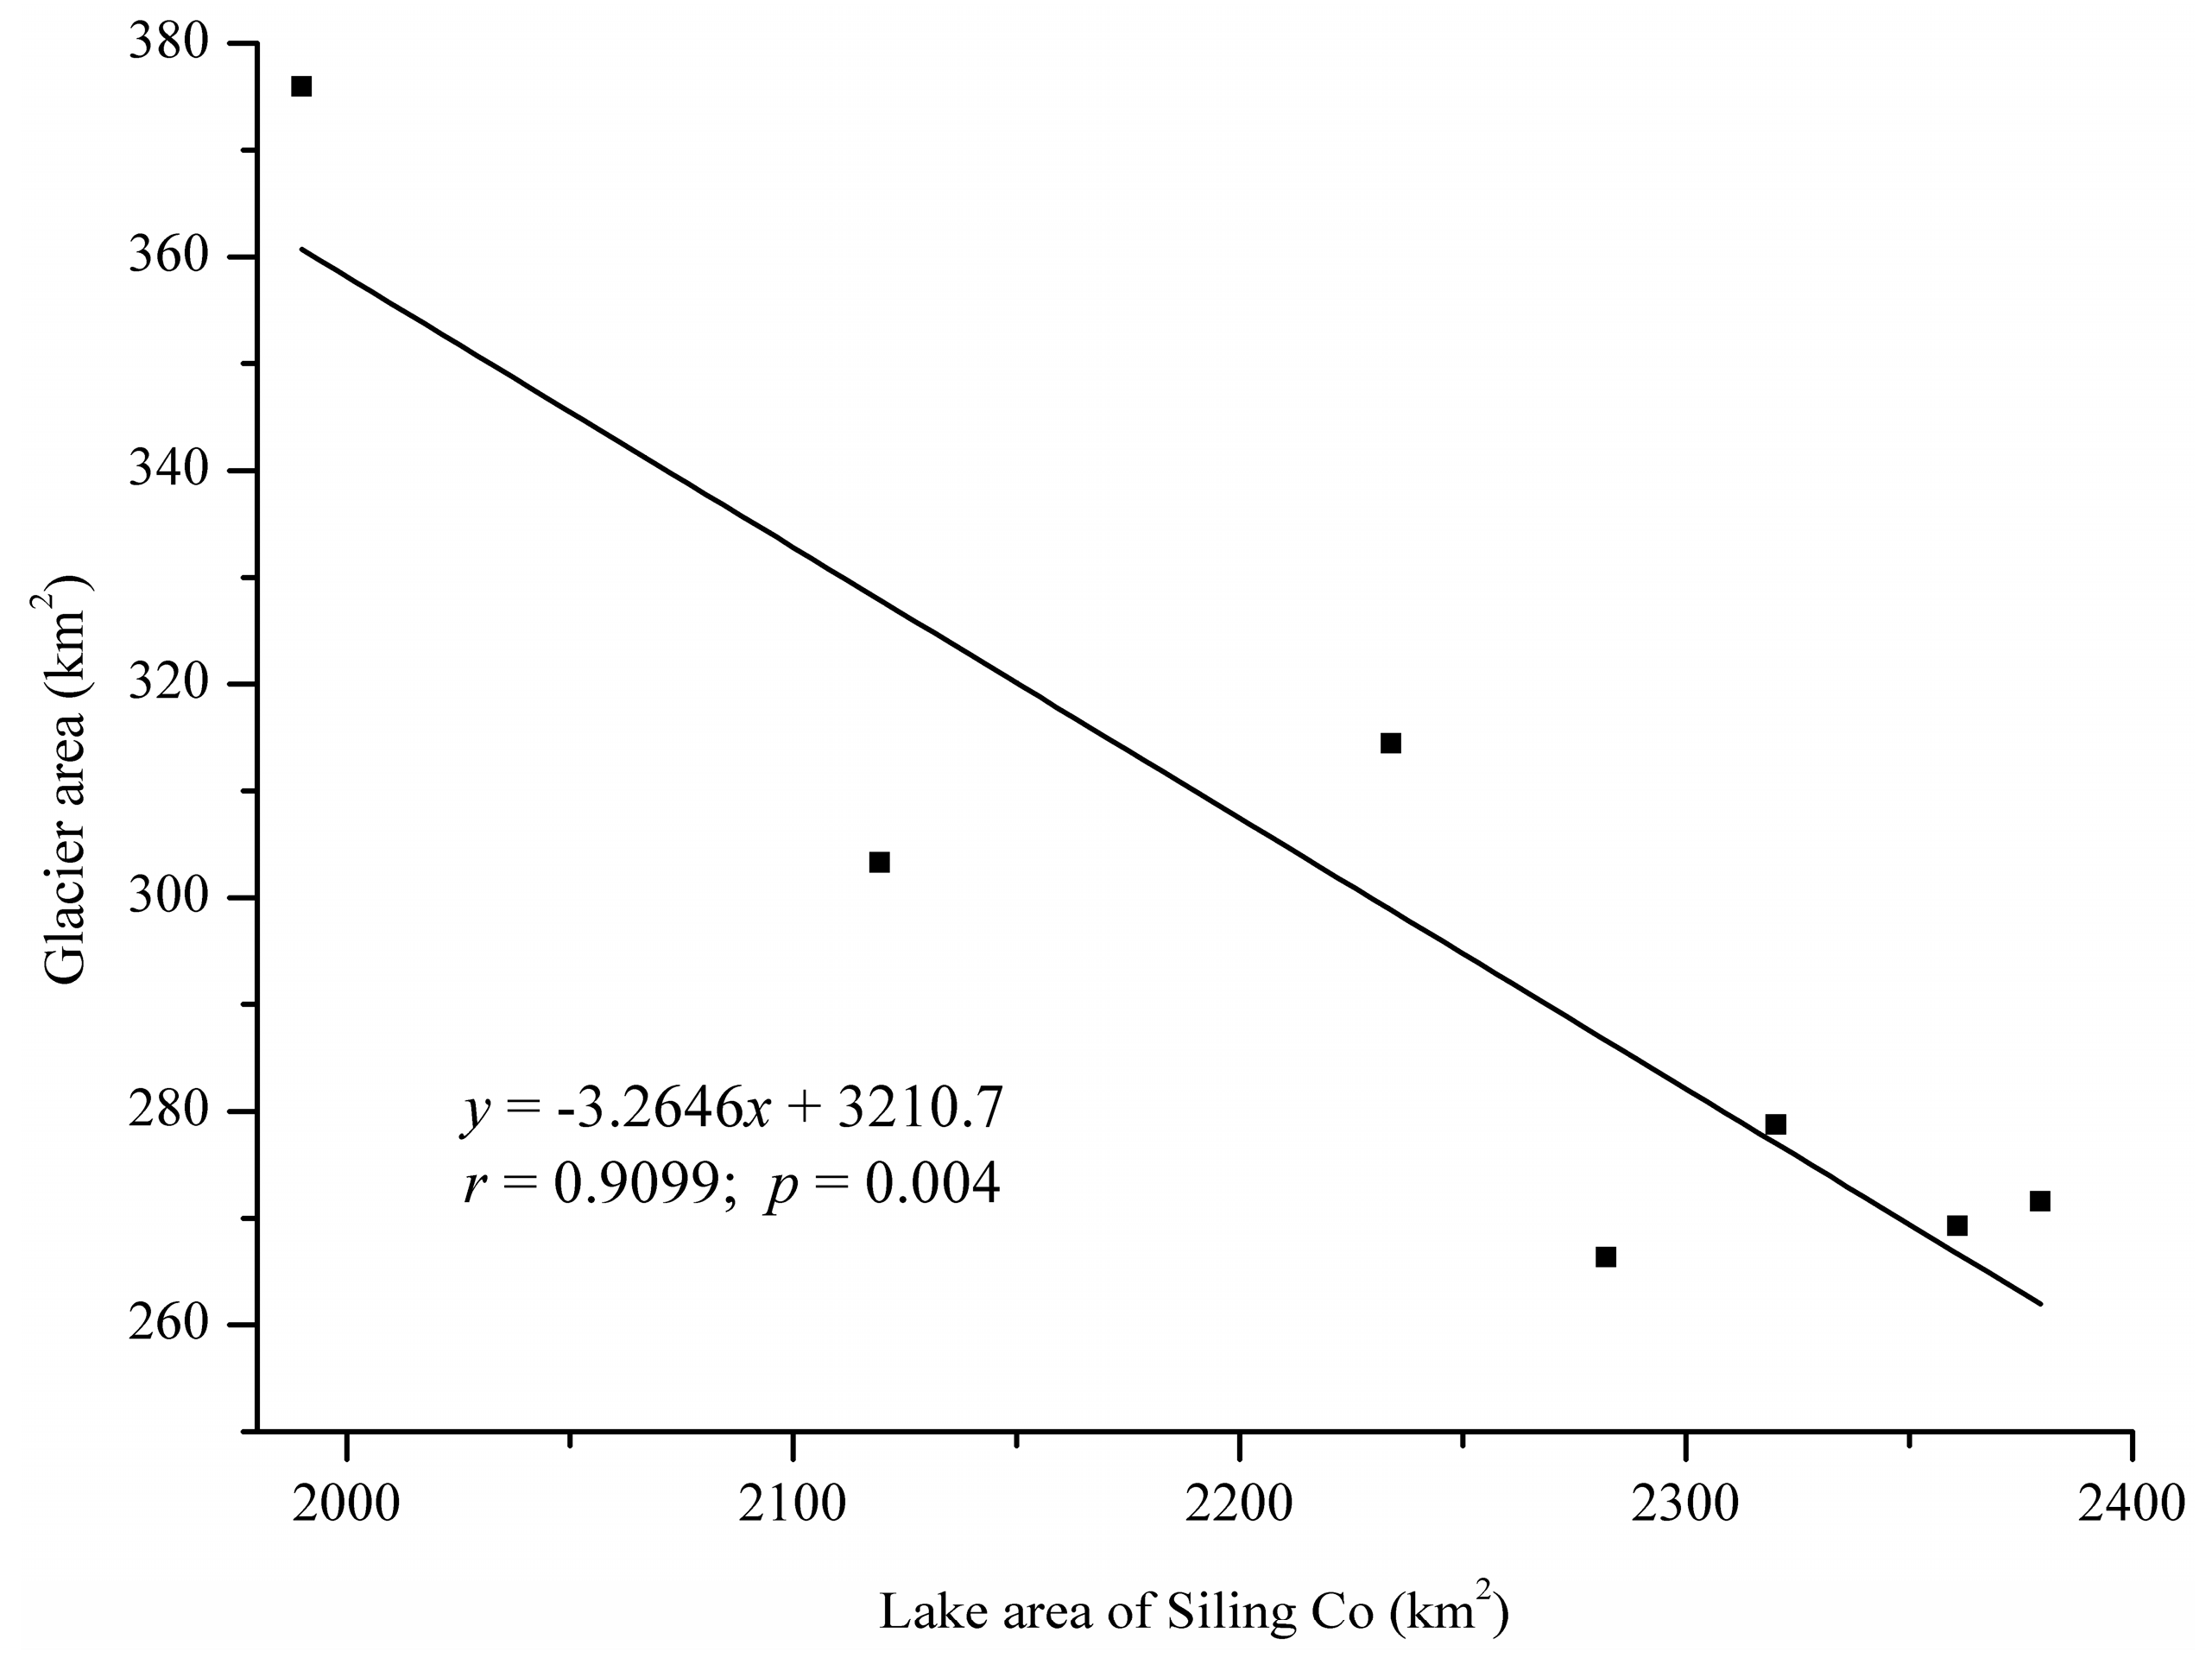
13]. In the meantime, the lake area of Siling Co has a significant linear correlation with the glacier area in the Siling Co catchment from 2001 to 2013 (
Figure 7). Taking the contribution made by glacier runoff to the expansion of Nam Co as reference, it is conservatively estimated that glacier runoff contributes more than 60% to the area expansion of Siling Co.
The correlation analysis of meteorological data and lake level change in Qinghai Lake from 1961 to 2002 conducted by Li indicates that, in the past nearly 42 years, the lake level change has a one year delayed response to the inflow change, and the impact of evaporation in the previous year on lake level is greater than that of the year [
33]. Moreover, the correlation analysis conducted by Bai of lake level change of Qinghai Lake and the precipitation in the previous year shows that there is a correlation coefficient of 0.64 [
34]. It can be concluded that the lake level change of Qinghai Lake has a one year response to the precipitation change; thus the increase of precipitation this year would lead to the rise of lake level the next year.
Figure 7.
Scatter pot of the Siling Co lake area and glacier area.
Figure 7.
Scatter pot of the Siling Co lake area and glacier area.
This research finds that the response of the Siling Co lake area to meteorological factors lags by 1 to 2 years, which is similar to prior research findings [
29,
30]. Through GRA, the authors not only obtain the lag time of lake expansion response to meteorological factors, but also find the main sensitive factors. The GRG sequence of the factors within lag time is the sequence of sensitive factors. On the whole, the response of lake expansion to hot season air temperature comes first. Hot season evaporation, cold season evaporation, cold season air temperature, hot season precipitation and cold season precipitation follow it, respectively. The low response of Siling Co expansion to precipitation also shows that the accelerating glacier melting as a result of rising air temperature is the main factor leading to lake expansion in recent 10 years.
With global warming, glacier melting and permafrost degradation in Qinghai-Tibetan Plateau causes the increment of runoff and the rise of lake level, which brings about new problems to the regulation control and use of water resources. Therefore, we should establish more hydrometric stations to conduct research on hydrological processes and forecast the supply of glacier runoff to surface water and rivers, scientifically plan the use and development of water resource, and have a correct understanding of its regulation and control to surface water and regional climate.


