Article

Occurrence and Toxicological Risk Assessment of Polycyclic Aromatic Hydrocarbons and Heavy Metals in Drinking Water Resources of Southern China

1
College of Marine Sciences, South China Agricultural University, Guangzhou 510642, China
2
Joint Laboratory of Guangdong Province and Hong Kong Region on Marine Bioresource Conservation and Exploitation, South China Agricultural University, Guangzhou 510642, China
*
Author to whom correspondence should be addressed.
Int. J. Environ. Res. Public Health 2018, 15(7), 1422; https://0-doi-org.brum.beds.ac.uk/10.3390/ijerph15071422
Submission received: 5 June 2018 / Revised: 26 June 2018 / Accepted: 5 July 2018 / Published: 6 July 2018

Abstract

:
Polycyclic aromatic hydrocarbons (PAHs) and heavy metals exposure is related to a variety of diseases and cancer development, posing a great health risk to humans. In this study, water samples were collected from nine important water sources in Guangdong, Guangxi and Hainan provinces to determine the degree of PAHs and heavy metals contamination. Overall, the total contents of 16 PAHs and heavy metals were found within the permissible levels. In human health risk assessment, the benzo(a)pyrene equivalent concentration (BaPeq) presented a much lower level than the guideline values announced by Chinese Environmental Protection Agency (CEPA) and United States Environmental Protection Agency (US EPA), demonstrating that the PAHs contamination level in drinking water was mostly acceptable. For heavy metals, the Chronic daily intake (CDI), hazard quotient (HQ) or hazard index (HI) suggested that the water quality in nine water sources was desirable and did not present a risk to human health.

1. Introduction

Water pollution by Polycyclic aromatic hydrocarbons (PAHs) and heavy metals is widespread in many countries worldwide. Excessive human activities and inappropriate disposal of industrial wastes are some of the reasons that lead to their detection in important water resources, including sea water, river water and underground water, which directly affects the quality of drinking water and aquatic organisms [1].
PAHs, a large class of organic pollutants consisting of 2–6 fused aromatic rings without heteroatoms or substitutes, are the earliest known chemical carcinogens [2]. In nature, PAHs exist mainly in bitumen, tar, coal and petroleum, which are mainly enhanced by incomplete combustion of hydrocarbon containing compounds [3]. In the last two decades, PAHs in environment dramatically increased due to anthropogenic activities including exhaust gases from automobiles, aircraft, and various motor vehicles [4,5]. Surface runoff, wastewater discharge and atmospheric deposition are the major ways that PAHs flow into water bodies [6]. As a potent carcinogen, short-term and long-term exposure to PAHs could damage the immune, reproductive, hematopoietic and nervous systems, as well as affect overall human health [3]. Thus, PAHs have attracted worldwide attention and 16 of them were listed as priority pollutants by US EPA [7,8]. With the development of industry, PAHs have also been identified in drinking water resources collected from several major water systems of China, including Yellow River [9], Qiantang River [10] and Pearl River [11], where concentrations generally exceed the US EPA guideline value of 200 ng/L. Drinking water is closely related to human health its safety should be ensured. However, trace amounts of PAHs in water are difficult to remove through conventional water treatment in China. Thus, it is necessary to evaluate the PAH contamination status in drinking water resources of southern China to protect human health [3,10].
Heavy metals are common pollutants in the environment. They are stable, non-biodegradable and accumulative, making them a global problem [12]. Both anthropogenic activities and natural actions contribute to heavy metal abundance in the environment [13,14,15,16]. Solid waste heaps; disposal of metals; agricultural, municipal and industrial waste; animal and human excreta; geological weathering; and leaching of metals from garbage are the main sources of environmental heavy metals [17,18]. Although some heavy metals are necessary for biosynthesis in human, excessive amounts may be toxic, such as nickel (Ni), copper (Cu) and zinc (Zn). Some metals have adverse effects on human even at very low concentrations, including lead (Pb) and chromium (Cr) [19,20]. Due to their toxicity and non-biodegradability, the discharged heavy metals in water seriously threaten aquatic organisms and human health via drinking water as well as food chain pathways [21]. Heavy metal pollution in drinking water is becoming an increasing problem globally. High concentration of Pb was detected in drinking water of Bandar Sunway in Malaysia [22]. In Uganda, concentrations of Cu, cobalt (Co) and Ni in household water samples exceeded UK drinking water thresholds of 200 μg/L [23]. Reports have also shown that high concentrations of Arsenic (As), selenium (Se) and thallium (Tl) were detected in drinking water around China [24].
Drinking water resources are the basis of human existence, which should be safe and unpolluted. Previous studies on PAHs and heavy metals in China mostly focused on their accumulation, transfer and source in wastewater-irrigated soils, especially in North China. There are few studies on PAHs and heavy metals in drinking water resources in southern China [25,26,27]. Major rivers in China were reported to show significantly higher concentrations of pollutants than those in Europe, Australia and the USA [28]. Thus, it is of great importance to investigate the pollution status of PAHs and heavy metals in drinking water resources of southern China. In this study, heavy metals and PAHs concentrations were detected in nine important water sources from Guangdong, Guangxi and Hainan provinces. The potential pollutant sources were identified and a risk assessment was conducted to evaluate the risk relative to PAHs and heavy metals occurrence in drinking water resources in southern China.

2. Materials and Methods

2.1. Sample Collection

Water was sampled from nine resources and reservoirs: Longtang and Chitian reservoirs in Hainan province; Pinggang and Dongjiang tributary water resources in Guangdong province; and Yongjiang, Xunjiang, and Liujiang water resources, Suyan reservoir and Guilin waterworks in Guangxi province. All of them are important drinking water resources in southern China, providing about 5170,000 m3 drinking water per day for more than 18.89 million people. Table 1 show the sampling regions and details. Clean 2.5 L bottles were used to collect water from the surface during June 2013. Three samples (2 L each, n = 27) were collected from the surface water (0–15 cm) of each site. Each sample was collected in duplicate. After sampling, bottles of water were directly transferred to laboratory and store at 4 °C prior to extraction within seven days.

2.2. Chemical Analysis

A mixture of PAH standards, consisting of the 16 USEPA priority PAHs (fluorene (Flur), pyrene (Pyr), fluoranthene (Fla), benzo[k]fluoranthene (BkF), acenaphthylene (Acy), chrysene (Chr), phenanthrene [29], anthracene (Ant), benzo[b]fluoranthene (BbF), dibenz[a,h]anthracene (DBahA), benzo[a]anthracene (BaA), acenaphthene (Acp), indeno[1,2,3-cd]pyrene (Ind) and benzo[a]pyrene (BaP), naphthalene (Nap) and benzo[g,h,i]perylene (BghiP)), was obtained from AccuStandard Inc. (New Haven, CT, USA).
For PAHs analysis, a solid-phase extraction (SPE) system from Supelco was used to extract water samples (1 L each sample). After washing with ethyl acetate (5 mL), 5 mL methanol and deionized water were used to condition the SPE cartridges, respectively. Then, the samples flowed into the cartridges (6 mL/min) under vacuum and eluted with ethyl acetate (3 mL). Anhydrous Na2SO4 was used to remove the water from the extracts, which were reduced by N2 blow-down [10].
A gas chromatograph with mass selected detector (MSD) (Agilent 5975, Agilent Technologies, Santa Clara, CA, USA) was used to analyze all samples. The chromatographic column was a HP-5 (30 m × 0.25 mm i.d. × 0.25 μm film thickness) capillary column (Agilent, USA) with highly purified helium. When the temperature of the injector was 280 °C, 1 μL aliquot sample was injected under splitless mode. The temperature of the column was set initially at 50 °C (3 min), gradually increased to 200 °C (10 °C/min) and then 280 °C (5 °C/min), finally maintained constant at 280 °C for 10 min. To determine the background contamination, field blanks were sampled at the same time. The method blanks and spiked blanks showed that no detectable PAHs in the background. Surrogate standards were used to monitor the matrix effects and procedural performance by adding to the samples [30]. The method detection limits (MDLs) were identified when a peak with a signal-to-noise ratio of 3 was observed. PAH recoveries were studied to illustrate the efficiency. For the 16 USEPA priority PAHs, the average recovery values ranged 86–118%. The relative standard deviations (RSD) were all below 12%.
For heavy metal analysis, water samples were filtered and analyzed directly. Inductively coupled plasma-mass spectrometer (ICP-MS) was applied to analyze heavy metals, including Cu, As, Zn, mercury (Hg), Ni, cadmium (Cd) [31], Pb and Cr. Each sample was analyzed three times. The operating conditions of ICP-MS are as follows: nebulizer gas (argon) flow rate, 0.9 L/min; auxiliary gas (argon) flow rate, 0.3 L/min; plasma (argon) gas flow rate, 15 L/min; reaction gas flow (helium) rate, 4 mL/min; lens voltage, 7.25 V; and ICP RF power, 1100 W. Standard reference materials used for the quality assurance and quality control (QA/QC) were from Chinese Academy of Measurement Science (GBW07401). To characterize the analytical precision, the standard reference solution was measured three times and RSD was calculated. In the standard reference material, the average recoveries of metals analyzed in the study ranged from 93% to 112%.

2.3. Human Health Risk Assessment

2.3.1. CDI for Heavy Metals Indices

Risk assessment is used to estimate the probability of an event and the adverse health effects that may occur within a given period. CDI is the index to evaluate human body intake for heavy metals via contaminant contact [3,32,33].
The formulas are as follows:
Ingestion:
CDI i = C × IR × ED × EF BW × AT
Dermal   contact :   CDI d = C × SA × AF × ABS × ED × EF BW × AT
where CDIi and CDId are daily intake through ingestion and dermal pathway (μg/kg/day), respectively; C represents the concentration of heavy metals (μg/L); IR represents the ingestion rate of water (2 L/day); EF is the abbreviation of exposure frequency and set 350 day/year; ED means exposure duration and the value is 70 years; body weight was abbreviated as BW (65 kg); AT means averaging time (25,550 days); SA means surface area (1.6 m2); AF means adherence factor (37.5 L/m2·day); and ABS is the absorption factor (0.01).

2.3.2. HQ Indices for Heavy Metals

The potential non-cancer risk for heavy metals is expressed by hazard quotient (HQ). Excessive value of HQ (a value of 1) indicates that potential health risk should be concerned. The greater is the value, the greater is the level of concern. Rfd means the reference dose, i.e., the dose that individuals can remain under for long periods without any adverse effects [34,35].
HQ = CDI/Rfd
HI = ∑HQ

2.3.3. Carcinogenic Risk for PAHs

To assess the carcinogenic risk of PAHs, BaP-equivalent concentration (BaP-eq) was calculated from the toxic equivalent factors (TEFs) of the PAH relative to the carcinogenic potency of BaP, which were proposed by LaGoy and Nisbet in 1992 [36].

2.4. Statistical Analysis

Excel 2007 (Microsoft Office, Microsoft, Redmond, WA, USA) was used to calculate the descriptive statistics. SPSS software (version 16, SPSS, Chicago, IL, USA) was applied to the univariate and multivariate statistical analyses, including the inter-metals correlation and principal component analysis (PCA).

3. Results and Discussion

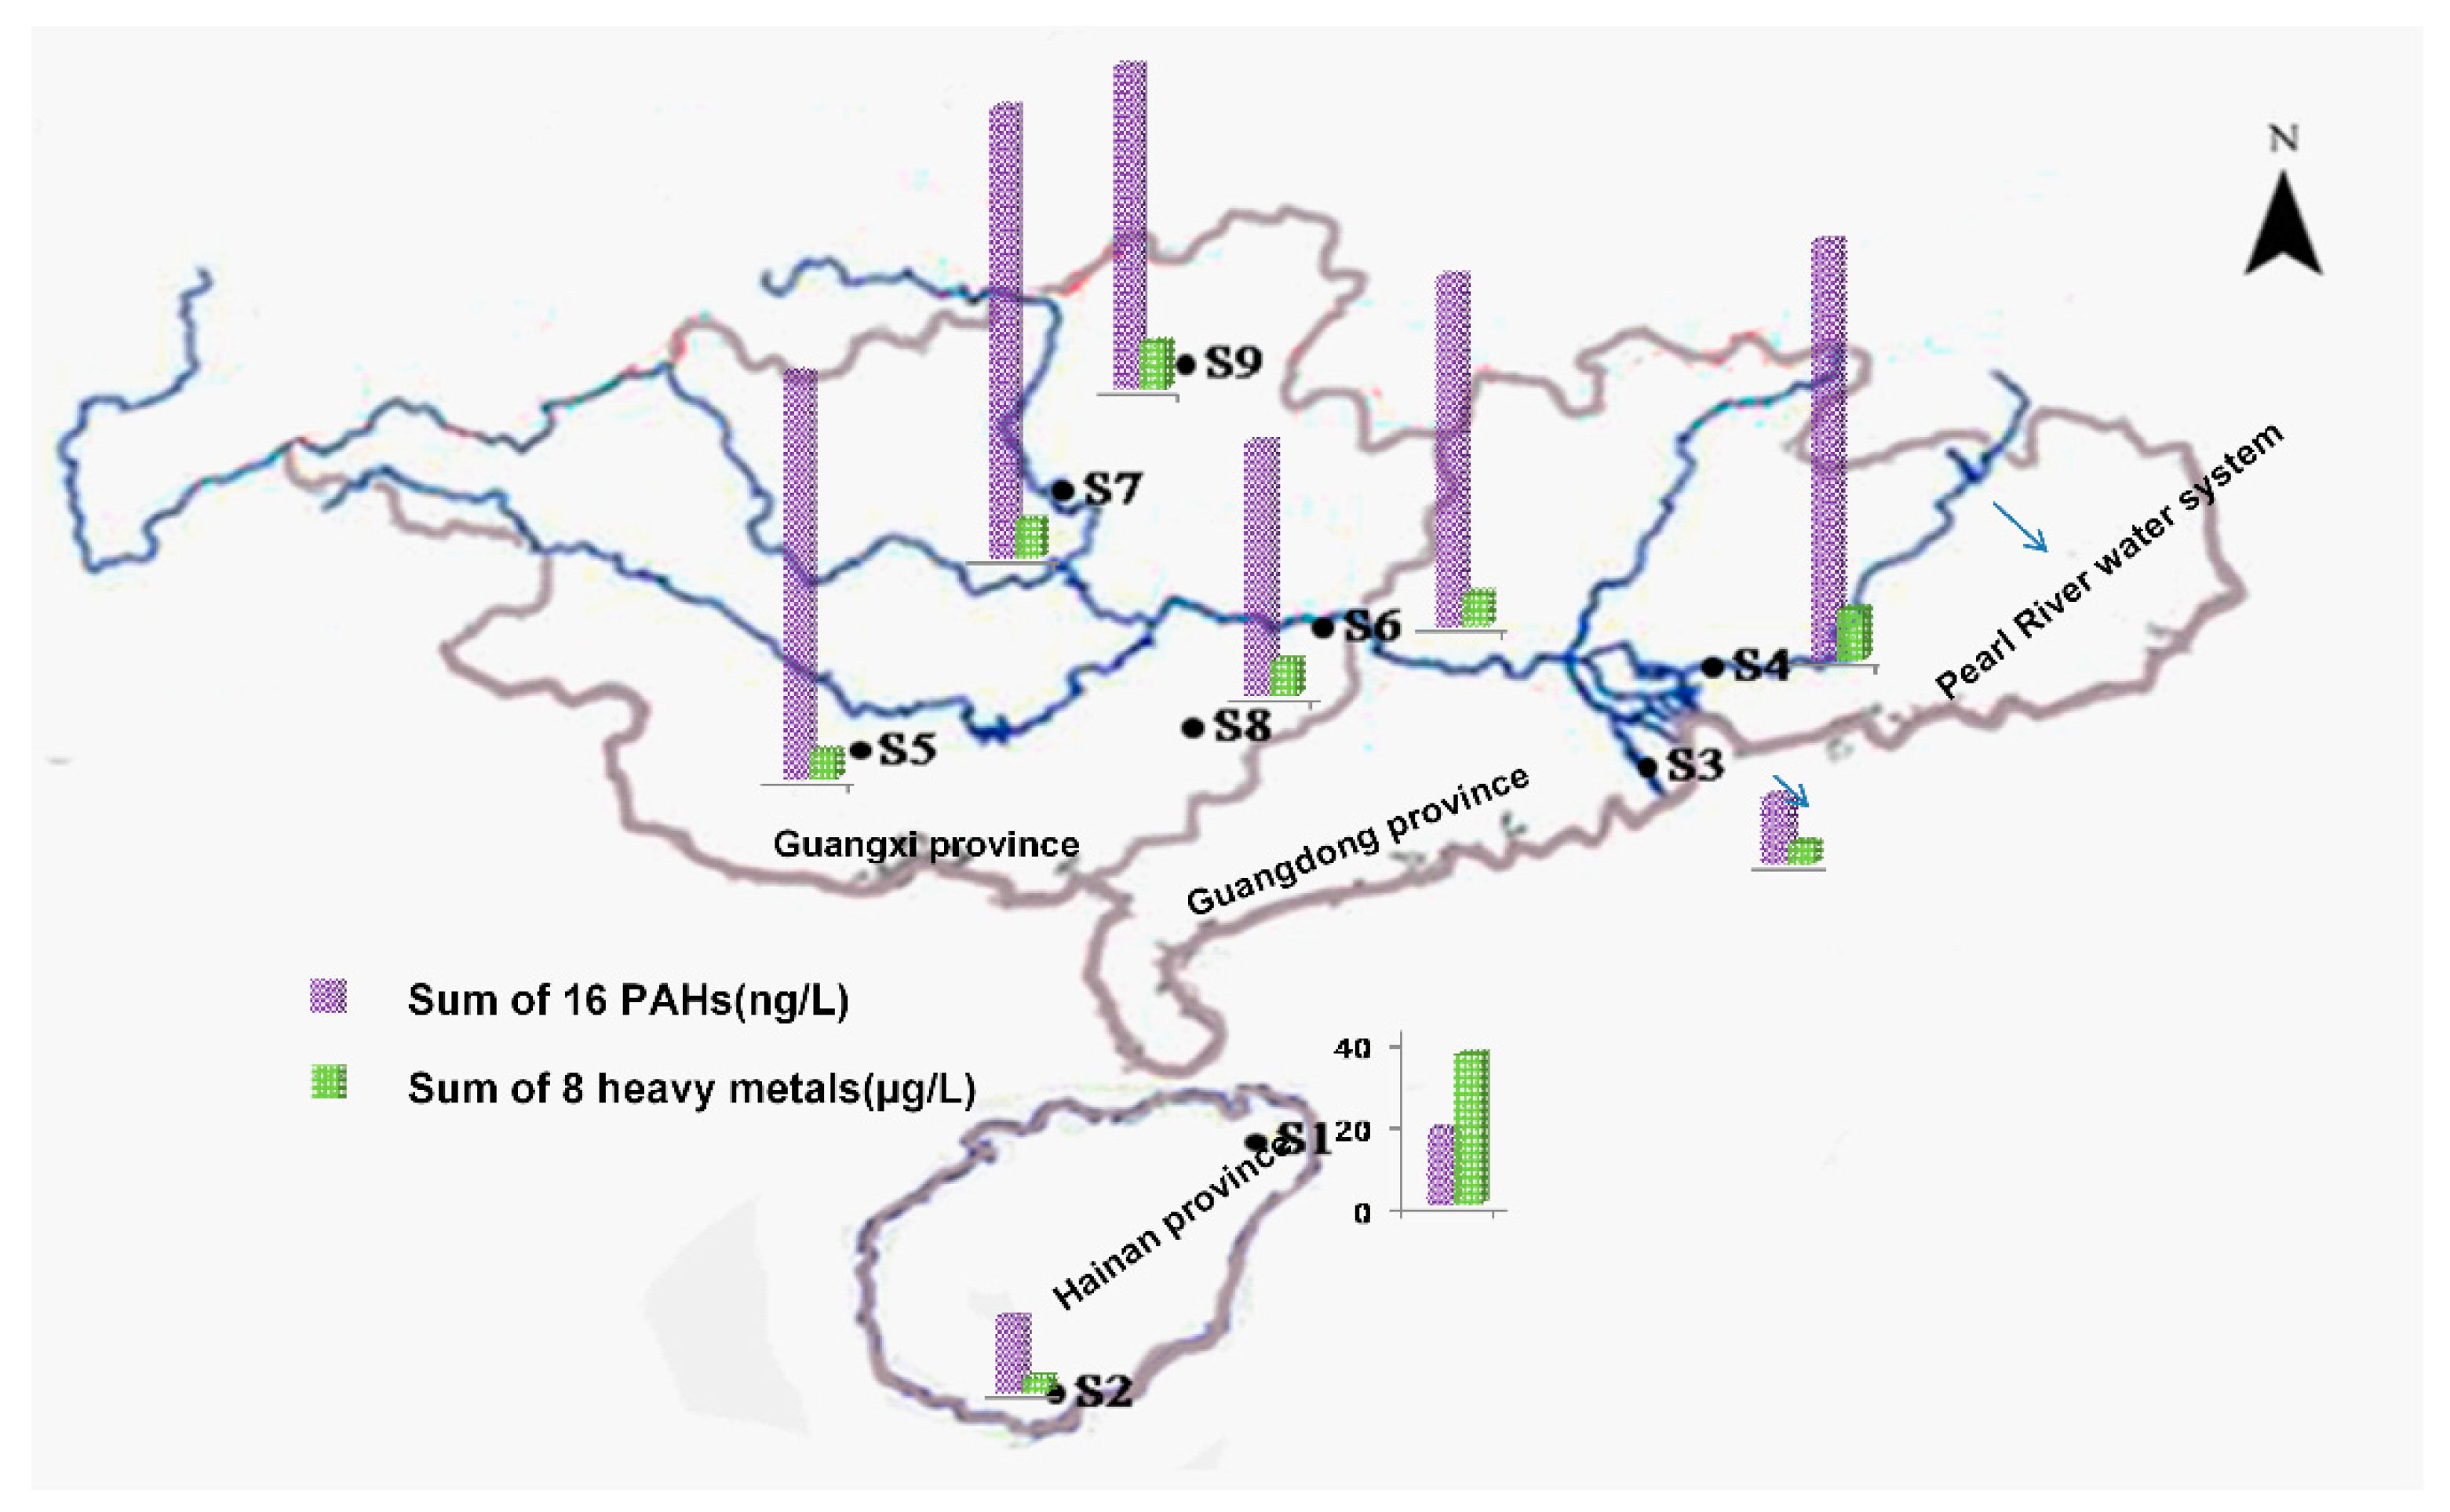
3.1. Concentration and Distribution

Table 2 and Figure 1 show the ranges, mean and median concentrations of PAHs in samples from water resources of southern China. In all samples, only 9 of the 16 PAHs were detected. The total PAH concentrations were in the range from 16.59 to 108.91 ng/L (mean, 65.25 ng/L). The highest PAHs level was detected at Site 7 with 108.91 ng/L (the Liujiang water resource in Guangxi province), followed by Site 4 with 101.78 ng/L (Dongjiang tributary, Guangdong, China) and Site 5 with 98.80 ng/L (Yongjiang, Guangxi, China). While the lowest level was detected at Site 3 (the Pinggang water resource in Guangdong province). Liujiang reservoir is located in Liuzhou City (Guangxi, China), an important industrial base of southern China with leading industries in metallurgy, papermaking and chemical industry. The significant discharge of wastewater may increase the amounts of PAHs at Site 7. Sites 3–9, belonging to the Pearl River water system, had total concentrations that were much lower than those in their downstream, the Pearl River Delta [11]. Furthermore, the concentration of Ant was highest among the 16 priority PAHs, followed by Phe, Flur, Ind, Bap, Acp, Pyr, BaA and DBahA with concentrations of 23.88, 22.33, 21.91, 19.79, 19.73, 19.10, 16.59, and 16.51 ng/L, respectively.
To compare the PAHs levels with other water resources, PAH contamination detected in different rivers around the world are listed in Table 3. In our study, levels of PAHs were similar to the source of the three gorges reservoir (China) [37] and Japaratuba River (Brazil) [38], but much higher than those of Gomti River (India) [39] and even five times higher than the Wyre River (England) [40]. Besides, comparing the PAHs concentrations with those of Yellow River, Yangtze River and Qiantang River indicated that the PAH concentrations in the present study were somewhat low in China.
Table 4 summarizes the contamination status of heavy metals in samples collected from southern China. Based on the obtained data, the order of average concentrations in the water sources were observed as follows: Zn > As > Cr > Ni > Hg > Cu = Pb > Cd. At the nine sampling sites, mean value of total concentrations (sum of the eight heavy metals) was 8.35 µg/L, with a range from 3.44 to 36.63 µg/L. Among the tested heavy metals, Zn was the most abundant, followed by As, Ni, Cu, Hg, Pb, Cr and Cd. Concentrations of all the heavy metals were below the World Health Organization (WHO) permissible limits [21]. Among all of the samples, the highest level of Zn (31.05 µg/L), Hg (1.12 µg/L), Cr (0.436 µg/L), and Pb (0.60 µg/L) was detected at Site 1 (Longtang waterworks), and Cr was only detected at this site; the highest level of Ni (1.32 µg/L) and Cu (0.62 µg/L) was detected at Site 4 (the Dongjiang tributary); and the highest level of As (1.19 µg/L) and Cd (0.007 µg/L) was detected at Site 3 (Pinggang resource) and Site 7 (Liujiang resource), respectively.

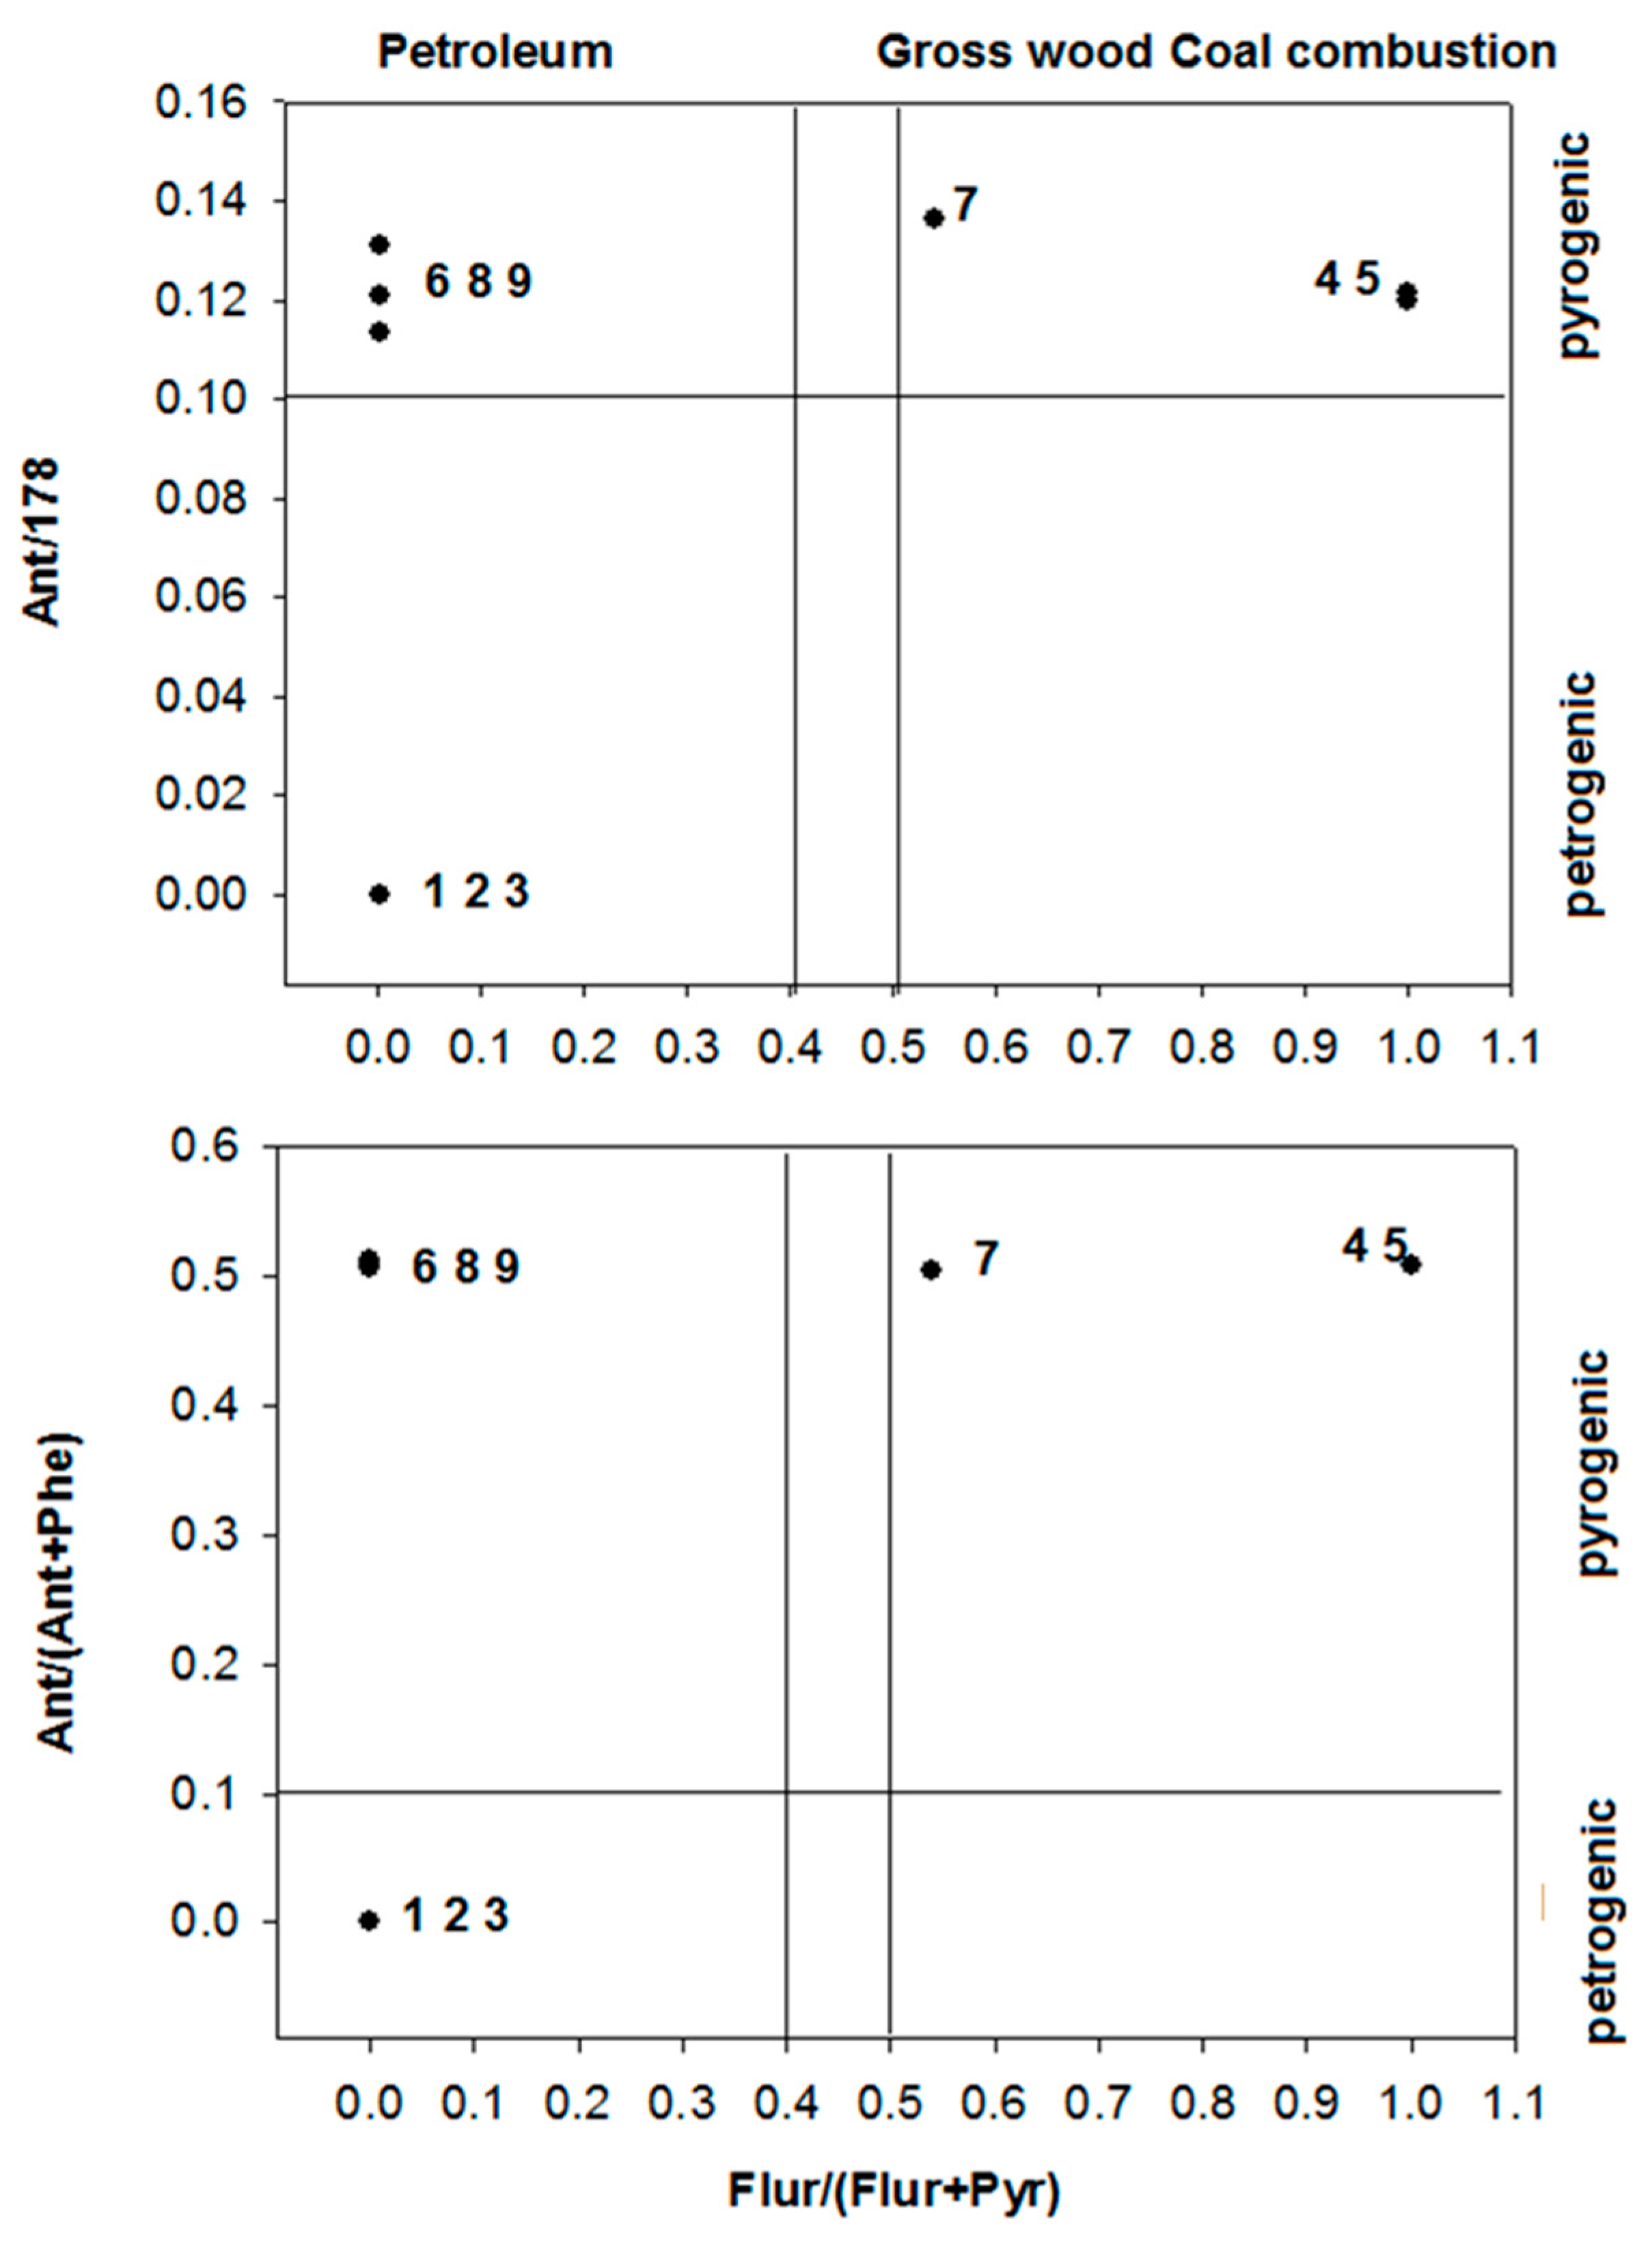
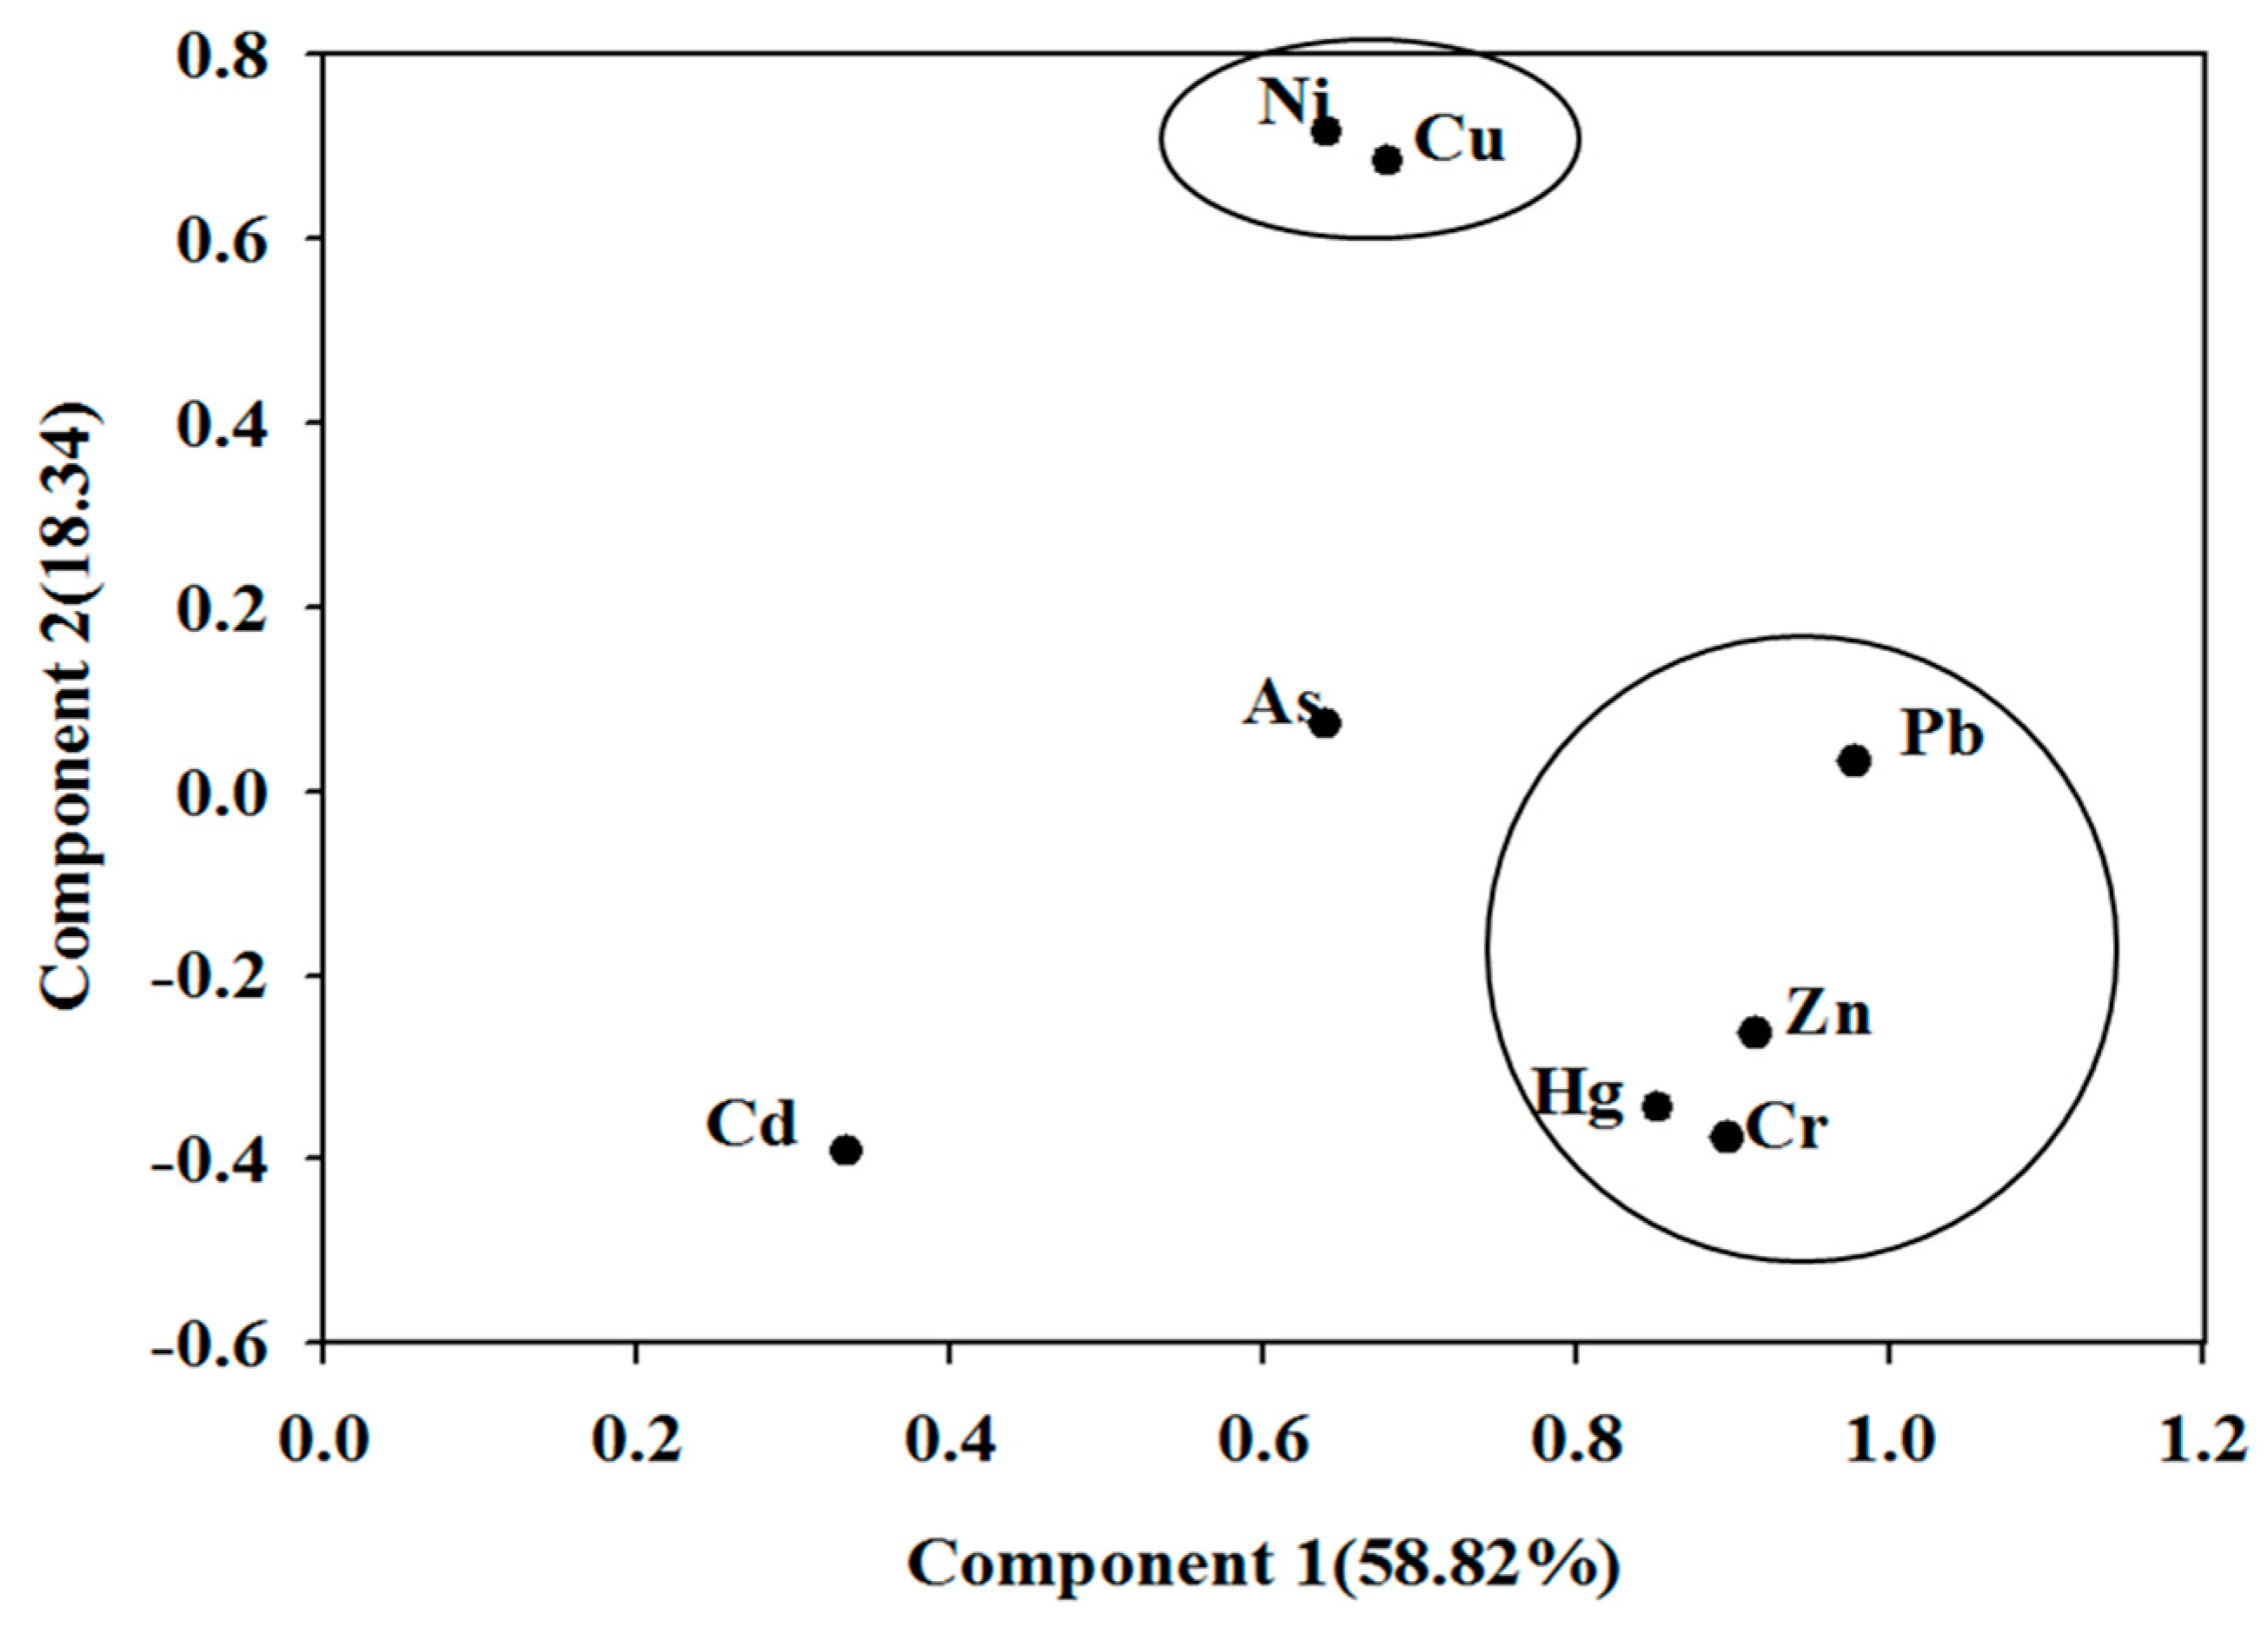
3.2. Profiles and Sources

Different ratios of some PAHs can indicate the sources of pollution, including diagenetic, petrogenic and pyrogenic processes [49]. Ratios such as Ant/178, Ant/(Ant + Phe), Flu/(Flu + Pyr), FlA/(FlA + Pyr) and BaA/(BaA + Chr) are common indices for deducing possible sources [50,51]. In general, petrogenic origin results in Ant/178 and Ant/(Ant + Phe) ratios below 0.1, whereas pyrogenic processes cause higher ratios (≥0.1). Similarly, low Flu/(Flu + Pyr) ratio (<0.4) is related to petrogenic origin while ratio ≥0.5 is produced by wood, grass and coal combustion origins [52]. Ratios of Ant/178 vs. Flu/(Flu + Pyr) and Ant/(Ant + Phe) vs. Flu/(Flu + Pyr) in the water samples from southern China are shown in Figure 2. It could be concluded tha PAH pollution at Sites 1–3 originated from petrogenic possesses; pollution at Sites 4, 5 and 7 mainly generated from coal, grass and wood combustion; and PAHs at Sites 6, 8 and 9 might result from petroleum hydrocarbons.
As for the heavy metals contamination, relationship between metals provided interesting information about their sources and pathways. In all water samples, Cr, Hg, Pb and Zn, which were mainly attributed by industrial activities, revealed a strong positive correlation (r > 0.84). These results suggested that discharging of industry effluents might be the major sources of heavy metals contamination, such as pollutants from printing, smelting, mining, etc. Besides, Cu was strongly and significantly positively correlated with Ni (r = 0.88), as well as related to the concentration of Pb. As for As and Cd, and most other heavy metals, no significant correlations were observed, which might be contributed by the different behavior during transport in most areas of southern China.
PCA, a statistical technique, is commonly applied for reducing the dimensionality of complex data sets and figuring out the key variables relative to the observed differences to preserve the relationships between the original data [53]. Orthogonal principal components (PCs) extracted via PCA are also employed to characterize the maximum variance in the analysis. In this study, two PCs accounting for about 76.16% of the total variance are presented in Figure 3. PC1 was dominated by Cr, Zn, Hg and Pb, which were significantly correlated with each other. The highest concentrations of these metals occurred at Site 1 (Longtang waterworks), as the surrounding rocks predominantly basalt, and SiO2, K2O and Na2O are the main components. Therefore, the source of Cr, Zn, Hg and Pb appears to be anthropogenic from traffic activities, domestic wastewater and industry. Cr might be mainly attributed by industrial activities. For a long time, high concentrations of Pb has been recognized as closely interrelated with the utilization of leaded gasoline in traffic activities [54]. In addition, wide use of composted materials, liquid manure, fertilizers and pesticides in agriculture is blamed for Zn pollution, as well as the industrial sources [55].
Another group is composed of Ni and Cu (PC2), which also had a high loading in PC1, suggesting a mixed source (natural and anthropogenic) contributed to the heavy metals pollution, including the waste released from industries and combustion of fuel. Besides, wastewater from sewage treatment plants, municipal sewage sludge and groundwater near landfill sites probably gave rise to the increased Ni in water [56]. Between the two components, Cd and As were divided almost equally, which also suggested a mixed natural and anthropogenic source. As Cd is a relatively mobile element, usage in glass, plastics, ceramics and paint manufacture mainly account for its enhanced levels in the environment [55].

3.3. Risk Assessment

Total BaPeq calculated from the TEF values of the 16 PAHs ranged from 2 × 10⁻⁵ to 0.02 µg/L in our nine exposure cases. BaPeq values in all of the sample sites were obviously lower than guideline values recommended by the US EPA (200 ng/L) and CEPA (2.8 ng/L) [57,58]. However, most PAHs could induce adverse effects on human health because of their toxicity and carcinogenicity, even at low concentrations. The detection of PAHs suggested contamination in these sample source areas, which should be alerted [58].
Table 5 summarizes the calculated CDI, HQ and HI values of heavy metals for ingestion and dermal absorb of drinking water. In risk assessment, drinking water and dermal absorb pathways were the major assumed routes of heavy metals exposure to human [59]. The average daily intakes of all heavy metals via ingestion were 103 to 104 times higher when compared with the cutaneous absorption, with a maximum of 3.21 × 10⁻⁵ for all heavy metals.
For different exposure pathways, HQ and HI of individual heavy metal were all below 1, which means there are minimal toxic risks caused by drinking water exposure in southern China. In addition, the HQ values of Cr, Cd, Ni, As, Cu, Zn, Pb and Hg tended to be less than those detected in drinking water collected from Kohistan region, northern Pakistan [21]. HQ of individual metal through ingestion was higher than that through dermal absorption (Table 5), denoting that ingestion is the main exposure pathway of heavy metals in drinking water resources The highest risk HI through ingestion was 3.45 × 10⁻² at Site 1 (Longtang waterworks), followed by 2.43 × 10⁻² (Yongjiang resource), 2.39 × 10⁻² (Xunjiang resource), 2.36 × 10⁻² (Pinggang resource), 2.32 × 10⁻² (Dongjiang tributary), and the lowest was 4.86 × 10⁻³ at Suyan reservoir.

4. Conclusions

The contaminations of PAHs and heavy metals in the drinking water resources were relatively low in southern China. Mean concentration of 16 PAHs was 65.25 ng/L, with a range from 16.59 to 108.91 ng/L at the nine sampling sites. The highest PAH contents were detected at the Liujiang water resource in Guangxi province. All concentrations of heavy metals were found within the permissible levels set for the drinking water quality by WHO. The PAH ratios indicated Sites 1–3 had a petrogenic origin for pollution; Sites 4, 5 and 7 were contaminated by PAHs mainly due to combustion of coal, wood and grass; and petroleum combustion probably contributes to the PAHs detection at Sites 6, 8 and 9. The PCA results indicated that Cr, Zn, Hg and Pb in the studied drinking water were dominated by the traffic activities, domestic wastewater and industry. Ni and Cu might originate from natural and anthropogenic sources, such as waste released from industries or combustion of fuel. As and Cd also had a highly mixed source, but different from Ni and Cu.
In all studied regions, the BaPeq concentrations presented a much lower level, compared with the guideline values set by CEPA and USEPA. For heavy metals, the CDI, HQ and HI indices for health risk assessment suggested that the water quality in nine water sources was desirable and did not present a risk to human health.

Author Contributions

Statistical Analysis, M.Y.; Writing—Original Draft Preparation, M.Y.; Sampling, H.N., W.W., Y.H.; and Writing—Review and Editing, J.W.

Funding

This research was funded by Cooperative Project of Joint Laboratory of Guangdong Province and Hong Kong Region on Marine Bioresource Conservation and Exploitation grant number [MBCE201702]; and High Level Talents Program of South China Agricultural University [0A344-8000/218145 and K17021].

Conflicts of Interest

The authors declare no conflict of interest.

References

  1. Amaraneni, S.R. Distribution of pesticides, PAHs and heavy metals in prawn ponds near Kolleru lake wetland, India. Environ. Int. 2006, 32, 294–302. [Google Scholar] [CrossRef] [PubMed]
  2. Carranza-Álvarez, C.; Alonso-Castro, A.J.; Alfaro-De La Torre, M.C.; García-De La Cruz, R.F. Accumulation and Distribution of Heavy Metals in Scirpus americanus and Typha latifolia from an Artificial Lagoon in San Luis Potosí, México. Water Air Soil Pollut. 2007, 188, 297–309. [Google Scholar] [CrossRef]
  3. Wu, B.; Zhang, Y.; Zhang, X.X.; Cheng, S.P. Health risk assessment of polycyclic aromatic hydrocarbons in the source water and drinking water of China: Quantitative analysis based on published monitoring data. Sci. Total Environ. 2011, 112–118, 410–411. [Google Scholar] [CrossRef] [PubMed]
  4. Huang, W.; Wang, Z.; Yan, W. Distribution and sources of polycyclic aromatic hydrocarbons (PAHs) in sediments from Zhanjiang Bay and Leizhou Bay, South China. Mar. Pollut. Bull. 2012, 64, 1962–1969. [Google Scholar] [CrossRef] [PubMed] [Green Version]
  5. Lang, Y.; Wang, N.; Gao, H.; Bai, J. Distribution and risk assessment of polycyclic aromatic hydrocarbons (PAHs) from Liaohe estuarine wetland soils. Environ. Monit. Assess. 2012, 184, 5545–5552. [Google Scholar] [CrossRef] [PubMed]
  6. Qin, N.; He, W.; Kong, X.-Z.; Liu, W.-X.; He, Q.-S.; Yang, B.; Ouyang, H.-L.; Wang, Q.-M.; Xu, F.-L. Ecological risk assessment of polycyclic aromatic hydrocarbons (PAHs) in the water from a large Chinese lake based on multiple indicators. Ecol. Indic. 2013, 24, 599–608. [Google Scholar] [CrossRef]
  7. Hussain, K.; Balachandran, S.; Rafiqul Hoque, R. Sources of polycyclic aromatic hydrocarbons in sediments of the Bharalu River, a tributary of the River Brahmaputra in Guwahati, India. Ecotoxicol. Environ. Saf. 2015, 122, 61–67. [Google Scholar] [CrossRef] [PubMed]
  8. Yang, W.; Lang, Y.; Li, G. Cancer risk of polycyclic aromatic hydrocarbons (PAHs) in the soils from Jiaozhou Bay wetland. Chemosphere 2014, 112, 289–295. [Google Scholar] [CrossRef] [PubMed]
  9. Zhao, X.; Qiu, H.; Zhao, Y.; Shen, J.; Chen, Z.; Chen, J. Distribution of polycyclic aromatic hydrocarbons in surface water from the upper reach of the Yellow River, Northwestern China. Environ. Sci. Pollut. Res. Int. 2015, 22, 6950–6956. [Google Scholar] [CrossRef] [PubMed]
  10. Zhu, L.; Chen, Y.; Zhou, R. Distribution of polycyclic aromatic hydrocarbons in water, sediment and soil in drinking water resource of Zhejiang Province, China. J. Hazard. Mater. 2008, 150, 308–316. [Google Scholar] [CrossRef] [PubMed]
  11. Yu, Y.; Yu, Z.; Wang, Z.; Lin, B.; Li, L.; Chen, X.; Zhu, X.; Xiang, M.; Ma, R. Polycyclic aromatic hydrocarbons (PAHs) in multi-phases from the drinking water source area of the Pearl River Delta (PRD) in South China: Distribution, source apportionment, and risk assessment. Environ. Sci. Pollut. Res. Int. 2018, 25, 12557–12569. [Google Scholar] [CrossRef] [PubMed]
  12. Dou, Y.; Li, J.; Zhao, J.; Hu, B.; Yang, S. Distribution, enrichment and source of heavy metals in surface sediments of the eastern Beibu Bay, South China Sea. Mar. Pollut. Bull. 2013, 67, 137–145. [Google Scholar] [CrossRef] [PubMed]
  13. Nduka, J.K.; Orisakwe, O.E. Water-quality issues in the Niger Delta of Nigeria: A look at heavy metal levels and some physicochemical properties. Environ. Sci. Pollut. Res. Int. 2011, 18, 237–246. [Google Scholar] [CrossRef] [PubMed]
  14. Jordao, C.P.; Pereira, M.G.; Bellato, C.R.; Pereira, J.L.; Matos, A.T. Assessment of water systems for contaminants from domestic and industrial sewages. Environ. Monit. Assess. 2002, 79, 75–100. [Google Scholar] [CrossRef] [PubMed]
  15. Khan, S.; Cao, Q.; Zheng, Y.M.; Huang, Y.Z.; Zhu, Y.G. Health risks of heavy metals in contaminated soils and food crops irrigated with wastewater in Beijing, China. Environ. Pollut. 2008, 152, 686–692. [Google Scholar] [CrossRef] [PubMed] [Green Version]
  16. Rodriguez Martin, J.A.; De Arana, C.; Ramos-Miras, J.J.; Gil, C.; Boluda, R. Impact of 70 years urban growth associated with heavy metal pollution. Environ. Pollut. 2015, 196, 156–163. [Google Scholar] [CrossRef] [PubMed]
  17. Bhuyan, M.S.; Bakar, M.A. Seasonal variation of heavy metals in water and sediments in the Halda River, Chittagong, Bangladesh. Environ. Sci. Pollut. Res. Int. 2017, 24, 27587–27600. [Google Scholar] [CrossRef] [PubMed]
  18. Shanbehzadeh, S.; Vahid Dastjerdi, M.; Hassanzadeh, A.; Kiyanizadeh, T. Heavy metals in water and sediment: A case study of Tembi River. J. Environ. Public Health 2014, 2014, 858720. [Google Scholar] [CrossRef] [PubMed]
  19. Bermudez, G.M.; Jasan, R.; Pla, R.; Pignata, M.L. Heavy metal and trace element concentrations in wheat grains: Assessment of potential non-carcinogenic health hazard through their consumption. J. Hazard. Mater. 2011, 193, 264–271. [Google Scholar] [CrossRef] [PubMed]
  20. Pandey, J.; Pandey, U. Accumulation of heavy metals in dietary vegetables and cultivated soil horizon in organic farming system in relation to atmospheric deposition in a seasonally dry tropical region of India. Environ. Monit. Assess. 2009, 148, 61–74. [Google Scholar] [CrossRef] [PubMed]
  21. Muhammad, S.; Shah, M.T.; Khan, S. Health risk assessment of heavy metals and their source apportionment in drinking water of Kohistan region, northern Pakistan. Microchem. J. 2011, 98, 334–343. [Google Scholar] [CrossRef]
  22. Ab Razak, N.H.; Praveena, S.M.; Aris, A.Z.; Hashim, Z. Drinking water studies: A review on heavy metal, application of biomarker and health risk assessment (a special focus in Malaysia). J. Epidemiol. Glob. Health 2015, 5, 297–310. [Google Scholar] [CrossRef] [PubMed]
  23. Abraham, M.R.; Susan, T.B. Water contamination with heavy metals and trace elements from Kilembe copper mine and tailing sites in Western Uganda; implications for domestic water quality. Chemosphere 2017, 169, 281–287. [Google Scholar] [CrossRef] [PubMed]
  24. Li, S.; Xiao, T.; Zheng, B. Medical geology of arsenic, selenium and thallium in China. Sci. Total Environ. 2012, 421–422, 31–40. [Google Scholar] [CrossRef] [PubMed]
  25. Jin, A.; He, J.; Chen, S.; Huang, G. Distribution and transport of PAHs in soil profiles of different water irrigation areas in Beijing, China. Environ. Sci. Process. Impacts 2014, 16, 1526–1534. [Google Scholar] [CrossRef] [PubMed]
  26. Li, P.; Wang, X.; Allinson, G.; Li, X.; Xiong, X. Risk assessment of heavy metals in soil previously irrigated with industrial wastewater in Shenyang, China. J. Hazard. Mater. 2009, 161, 516–521. [Google Scholar] [CrossRef] [PubMed]
  27. Khan, S.; Aijun, L.; Zhang, S.; Hu, Q.; Zhu, Y.G. Accumulation of polycyclic aromatic hydrocarbons and heavy metals in lettuce grown in the soils contaminated with long-term wastewater irrigation. J. Hazard. Mater. 2008, 152, 506–515. [Google Scholar] [CrossRef] [PubMed] [Green Version]
  28. Han, D.; Currell, M.J. Persistent organic pollutants in China’s surface water systems. Sci. Total Environ. 2017, 580, 602–625. [Google Scholar] [CrossRef] [PubMed]
  29. Day, R.D.; Christopher, S.J.; Becker, P.R.; Whitaker, D.W. Monitoring mercury in the loggerhead sea turtle, Caretta caretta. Environ. Sci. Technol. 2005, 39, 437–446. [Google Scholar] [CrossRef] [PubMed]
  30. Sun, J.H.; Wang, G.L.; Chai, Y.; Zhang, G.; Li, J.; Feng, J. Distribution of polycyclic aromatic hydrocarbons (PAHs) in Henan Reach of the Yellow River, Middle China. Ecotoxicol. Environ. Saf. 2009, 72, 1614–1624. [Google Scholar] [CrossRef] [PubMed]
  31. Hoss, A.G.; Kartha, V.K.; Dong, X.; Latourelle, J.C.; Dumitriu, A.; Hadzi, T.C.; Macdonald, M.E.; Gusella, J.F.; Akbarian, S.; Chen, J.F.; et al. MicroRNAs located in the Hox gene clusters are implicated in huntington’s disease pathogenesis. PLoS Genet. 2014, 10, e1004188. [Google Scholar] [CrossRef] [PubMed]
  32. Zheng, N.; Liu, J.; Wang, Q.; Liang, Z. Health risk assessment of heavy metal exposure to street dust in the zinc smelting district, Northeast of China. Sci. Total Environ. 2010, 408, 726–733. [Google Scholar] [CrossRef] [PubMed]
  33. Zeng, D.; Zhou, S.; Ren, B.; Chen, T. Bioaccumulation of Antimony and Arsenic in Vegetables and Health Risk Assessment in the Superlarge Antimony-Mining Area, China. J. Anal. Methods Chem. 2015. [Google Scholar] [CrossRef] [PubMed]
  34. Huang, M.; Zhou, S.; Sun, B.; Zhao, Q. Heavy metals in wheat grain: Assessment of potential health risk for inhabitants in Kunshan, China. Sci. Total Environ. 2008, 405, 54–61. [Google Scholar] [CrossRef] [PubMed]
  35. Zhu, Y.; Yang, Y.; Liu, M.; Zhang, M.; Wang, J. Concentration, Distribution, Source, and Risk Assessment of PAHs and Heavy Metals in Surface Water from the Three Gorges Reservoir, China. Hum. Ecol. Risk Assess. Int. J. 2014, 21, 1593–1607. [Google Scholar] [CrossRef]
  36. Nisbet, I.C.; LaGoy, P.K. Toxic equivalency factors (TEFs) for polycyclic aromatic hydrocarbons (PAHs). Regul. Toxicol. Pharmacol. 1992, 16, 290–300. [Google Scholar] [CrossRef]
  37. Wang, J.; Bi, Y.; Pfister, G.; Henkelmann, B.; Zhu, K.; Schramm, K.W. Determination of PAH, PCB, and OCP in water from the Three Gorges Reservoir accumulated by semipermeable membrane devices (SPMD). Chemosphere 2009, 75, 1119–1127. [Google Scholar] [CrossRef] [PubMed] [Green Version]
  38. Santos, E.; Souza, M.R.R.; Vilela Junior, A.R.; Soares, L.S.; Frena, M.; Alexandre, M.R. Polycyclic aromatic hydrocarbons (PAH) in superficial water from a tropical estuarine system: Distribution, seasonal variations, sources and ecological risk assessment. Mar. Pollut. Bull. 2018, 127, 352–358. [Google Scholar] [CrossRef] [PubMed]
  39. Malik, A.; Verma, P.; Singh, A.K.; Singh, K.P. Distribution of polycyclic aromatic hydrocarbons in water and bed sediments of the Gomti River, India. Environ. Monit. Assess. 2011, 172, 529–545. [Google Scholar] [CrossRef] [PubMed]
  40. Moeckel, C.; Monteith, D.T.; Llewellyn, N.R.; Henrys, P.A.; Pereira, M.G. Relationship between the concentrations of dissolved organic matter and polycyclic aromatic hydrocarbons in a typical U.K. upland stream. Environ. Sci. Technol. 2014, 48, 130–138. [Google Scholar] [CrossRef] [PubMed] [Green Version]
  41. Kong, X.S.; Qi, S.H.; Oramah, I.T.; Zhang, Y.; He, S.Y. Contamination of polycyclic aromatic hydrocarbons in surface water in underground river of Dashiwei Tiankeng group in karst area, Guangxi. Huan Jing Ke Xue 2011, 32, 1081–1087. [Google Scholar] [PubMed]
  42. Luo, S.X.; Zhu, H.W.; Zhang, X.Y.; Guan, X.M. Distribution and sources of polycyclic aromatic hydrocarbons in surface water from Hongfeng Lake. Resour. Environ. Yangtze Basin 2009, 18, 466–470. [Google Scholar]
  43. Li, G.; Xia, X.; Yang, Z.; Wang, R.; Voulvoulis, N. Distribution and sources of polycyclic aromatic hydrocarbons in the middle and lower reaches of the Yellow River, China. Environ. Pollut. 2006, 144, 985–993. [Google Scholar] [CrossRef] [PubMed]
  44. Feng, C.; Xia, X.; Shen, Z.; Zhou, Z. Distribution and sources of polycyclic aromatic hydrocarbons in Wuhan section of the Yangtze River, China. Environ. Monit. Assess. 2007, 133, 447–458. [Google Scholar] [CrossRef] [PubMed]
  45. Zhao, Z.; Zhang, L.; Deng, J.; Wu, J. The potential effects of phytoplankton on the occurrence of organochlorine pesticides (OCPs) and polycyclic aromatic hydrocarbons (PAHs) in water from Lake Taihu, China. Environ. Sci. Process. Impacts 2015, 17, 1150–1156. [Google Scholar] [CrossRef] [PubMed]
  46. Li, J.; Li, F. Polycyclic aromatic hydrocarbons in the Yellow River estuary: Levels, sources and toxic potency assessment. Mar. Pollut. Bull. 2017, 116, 479–487. [Google Scholar] [CrossRef] [PubMed]
  47. Lü, J.; Xu, R.; Zhang, Q.; Liu, J.; Liao, C.; Wei, F. Primary Investigation of the pollution status of polycyclic aromatic hydrocarbons (PAHs) in water and soil of Xuanwei and Fuyuan, Yunnan Province, China. Chin. Sci. Bull. 2009, 54, 3528–3535. [Google Scholar] [CrossRef]
  48. Montuori, P.; Aurino, S.; Garzonio, F.; Sarnacchiaro, P.; Nardone, A.; Triassi, M. Distribution, sources and ecological risk assessment of polycyclic aromatic hydrocarbons in water and sediments from Tiber River and estuary, Italy. Sci. Total Environ. 2016, 566–567, 1254–1267. [Google Scholar] [CrossRef] [PubMed] [Green Version]
  49. Levengood, J.M.; Schaeffer, D.J. Polycyclic aromatic hydrocarbons in fish and crayfish from the Calumet region of southwestern Lake Michigan. Ecotoxicology 2011, 20, 1411–1421. [Google Scholar] [CrossRef] [PubMed]
  50. Ringuet, J.; Albinet, A.; Leoz-Garziandia, E.; Budzinski, H.; Villenave, E. Diurnal/nocturnal concentrations and sources of particulate-bound PAHs, OPAHs and NPAHs at traffic and suburban sites in the region of Paris (France). Sci. Total Environ. 2012, 437, 297–305. [Google Scholar] [CrossRef] [PubMed]
  51. Li, H.; Chen, J.; Jiang, L. Elevated critical micelle concentration in soil–water system and its implication on PAH removal and surfactant selecting. Environ. Earth Sci. 2014. [Google Scholar] [CrossRef]
  52. Xue, B.; Wang, Y.; Zhang, D.; Zhang, J.; Leng, B.; Huang, W.; Chen, Z. Concentration, distribution and sources of polycyclic aromatic hydrocarbons (PAHs) in surface sediments from Lijiang River, South China. Bull. Environ. Contam. Toxicol. 2013, 90, 446–450. [Google Scholar] [CrossRef] [PubMed]
  53. Li, Y.; Huang, W.; Pan, J.; Ye, Q.; Lin, S.; Feng, S.; Xie, S.; Zeng, H.; Chen, R. Rapid detection of nasopharyngeal cancer using Raman spectroscopy and multivariate statistical analysis. Mol. Clin. Oncol. 2015, 3, 375–380. [Google Scholar] [CrossRef] [PubMed]
  54. Kondo, A.; Hamonangan, E.; Soda, S.; Kaga, A.; Inoue, Y.; Eguchi, M.; Yasaka, Y. Impacts of converting from leaded to unleaded gasoline on ambient lead concentrations in Jakarta metropolitan area. J. Environ. Sci. 2007, 19, 709–713. [Google Scholar] [CrossRef]
  55. Srinivasa Gowd, S.; Govil, P.K. Distribution of heavy metals in surface water of Ranipet industrial area in Tamil Nadu, India. Environ. Monit. Assess. 2008, 136, 197–207. [Google Scholar] [CrossRef] [PubMed]
  56. Nagarajan, R.; Thirumalaisamy, S.; Lakshumanan, E. Impact of leachate on groundwater pollution due to non-engineered municipal solid waste landfill sites of erode city, Tamil Nadu, India. Iran. J. Environ. Health Sci. Eng. 2012, 9, 35. [Google Scholar] [CrossRef] [PubMed]
  57. Kuo, C.Y.; Hsu, Y.W.; Lee, H.S. Study of human exposure to particulate PAHs using personal air samplers. Arch. Environ. Contam. Toxicol. 2003, 44, 454–459. [Google Scholar] [CrossRef] [PubMed]
  58. Ma, Y.G.; Cheng, J.P.; Jiao, F.; Duo, K.X.; Rong, Z.; Li, M.; Wang, W.H. Distribution, sources, and potential risk of polycyclic aromatic hydrocarbons (PAHs) in drinking water resources from Henan Province in middle of China. Environ. Monit. Assess. 2008, 146, 127–138. [Google Scholar] [CrossRef] [PubMed]
  59. Li, Y.; Liu, J.; Cao, Z.; Lin, C.; Yang, Z. Spatial distribution and health risk of heavy metals and polycyclic aromatic hydrocarbons (PAHs) in the water of the Luanhe River Basin, China. Environ. Monit. Assess. 2010, 163, 1–13. [Google Scholar] [CrossRef] [PubMed]
Figure 1. Sampling sites and concentrations of PAHs and heavy metals in the study area. The vertical axis is marked for Site 1.
Ijerph 15 01422 g001
Figure 2. PAH cross plots for the ratios of Ant/178 vs. Flu/(Flu + Pyr) and Ant/(Ant + Phe) vs. Flu/(Flu + Pyr).
Ijerph 15 01422 g002
Figure 3. Loading plots of the first two components obtained for the concentrations of heavy metals in the water samples.
Ijerph 15 01422 g003
Table 1. Detailed descriptions of the sampling sites.
NO.Sample SiteType of WaterDaily Production (m3)Number of Population
S1Longtang waterworksDrinking water of Haikou city290,0001.77 million
S2Chitian reservoirDrinking water resource of Sanya city150,0000.57 million
S3Pinggang reservoirDrinking water resource of Zhuhai and Macau1,000,0002.15 million
S4Dongjiang reservoirDrinking water resource of Dongguan2,400,0006.95 million
S5Yongjiang reservoirDrinking water resource of Nanning1,120,0003.45 million
S6Xunjiang reservoirDrinking water resource of WuzhouNA0.53 million
S7Liujiang reservoirDrinking water resource of LiuzhouNA1.40 million
S8Suyan reservoirDrinking water resource of Yulin110,0001.10 million
S9Guilin waterworksDrinking water of Guilin100,0000.97 million
NA, not available.
Table 2. PAHs concentrations in source water (n = 27) of southern China.
PAH CompoundsRange (ng/L)Mean (ng/L)Mid (ng/L)
Acpnd–19.7312.8218.99
Flurnd–22.337.06nd
Phend–23.8714.2320.52
Antnd–24.2914.721.31
Pyrnd–19.106.29nd
BaAnd–16.591.84nd
BaPnd–19.792.2nd
Indnd–21.912.43nd
DBahAnd-16.513.67nd
∑PAHs16.59–108.9165.2560.82
nd—not detected; Acp—acenaphthene; Flur—fluorene; Phe—phenanthrene; Ant—anthracene; Pyr—pyrene; BaA—benzo[a]anthracene; BaP—benzo[a]pyrene; Ind—indeno[1,2,3-cd]pyrene; DBahA—dibenz[a,h]anthracene.
Table 3. List of sources of PAHs concentrations in source water and drinking water in the world.
LocationType of WaterPAHsPAHs Range (ng/L)ReferenceDate of Sampling
Chongqing and Hubei province, ChinaThe three gorges reservoir1613.8–97.2[37]2008
Gansu Province, ChinaYellow River16548–2598[9]2013
Guangdong Province, ChinaPearl River Delta1692.8–324[11]2016
Guangxi Province, ChinaUnderground River of Dashiwei1654.7–192.0[41]NA
Guizhou Province, ChinaHongfeng Lake16167.1–336.4[42]2005
Henan Province, ChinaYellow River15185–2182[43]2004
Hubei Province, ChinaWuhan reach of Yangtze River11242–6235[44]2005
Jiangsu Province, ChinaLake Taihu1645.4–232.74[45]2010
Shandong Province, ChinaYellow River Estuary168.51–402.84[46]2013
Yunnan Province, ChinaGroundwater and Kuaize River1358.0–275.5[47]2007
Zhejiang Province, ChinaQiantang River1570.3–1844[10]2005–2006
EnglandWyre River282.7–20[40]2010–2011
ItalyTiber River161.75–608[48]2014–2015
BrazilJaparatuba River164.4–119[38]2016–2017
IndiaGomti River160.06–84.21[39]2004–2006
NA, not available.
Table 4. Heavy metal concentrations in source water (n = 27) of southern China.
Heavy MetalsRange (µg/L)Mean (µg/L)Mid (µg/L)
Crnd–0.440.48nd
Nind–0.690.360.25
Cund–0.620.1nd
Znnd–0.764.260.23
As0.25–1.430.971.15
Cdnd–0.007ndnd
Hg0.102–1.120.320.21
Pbnd–0.600.1nd
∑HMs3.44–36.638.3511.17
nd, not detected.
Table 5. Summary of ingestion and dermal risk values for heavy metals in water.
CDIiHQiCDIdHQd
Cr2.56 × 10−30.00–5.12 × 10−30.00–4.51 × 10−70.00–3.01 × 10⁻⁵
Ni0.00–7.77 × 10−30.00–3.89 × 10−40.00–1.37 × 10−60.00–2.54 × 10⁻⁷
Cu0.00–3.66 × 10−30.00–9.14 × 10−50.00–6.44 × 10−70.00–5.37 × 10⁻⁸
Zn0.00–0.01820.00–6.08 × 10−40.00–3.21 × 10−50.00–5.35 × 10⁻⁷
As1.44 × 10−3–8.39 × 10−34.81 × 10−3–2.80 × 10−22.54 × 10−7–1.48 × 10−62.07 × 10−6–1.20 × 10⁻⁵
Cd0.00–4.11 × 10−50.00–8.22 × 10−50.00–7.24 × 10−90.00–1.45 × 10⁻⁶
Hg5.99 × 10−4–6.58 × 10−34.28 × 10−5–4.70 × 10−41.05 × 10−7–1.159 × 10−63.52 × 10−7–3.86 × 10⁻⁶
Pb0.00–3.53 × 10−30.00–9.80 × 10−60.00–6.21 × 10−70.00–6.67 × 10⁻⁷
HI 4.86 × 10⁻³–3.45 × 10⁻² 5.08 × 10⁻⁶–4.87 × 10⁻⁵

