Development of a System Measurement Model of the Brazilian Hospital Accreditation System

 , ,
, , 
Abstract
:1. Introduction
1.1. Motivations
1.2. Literature Review
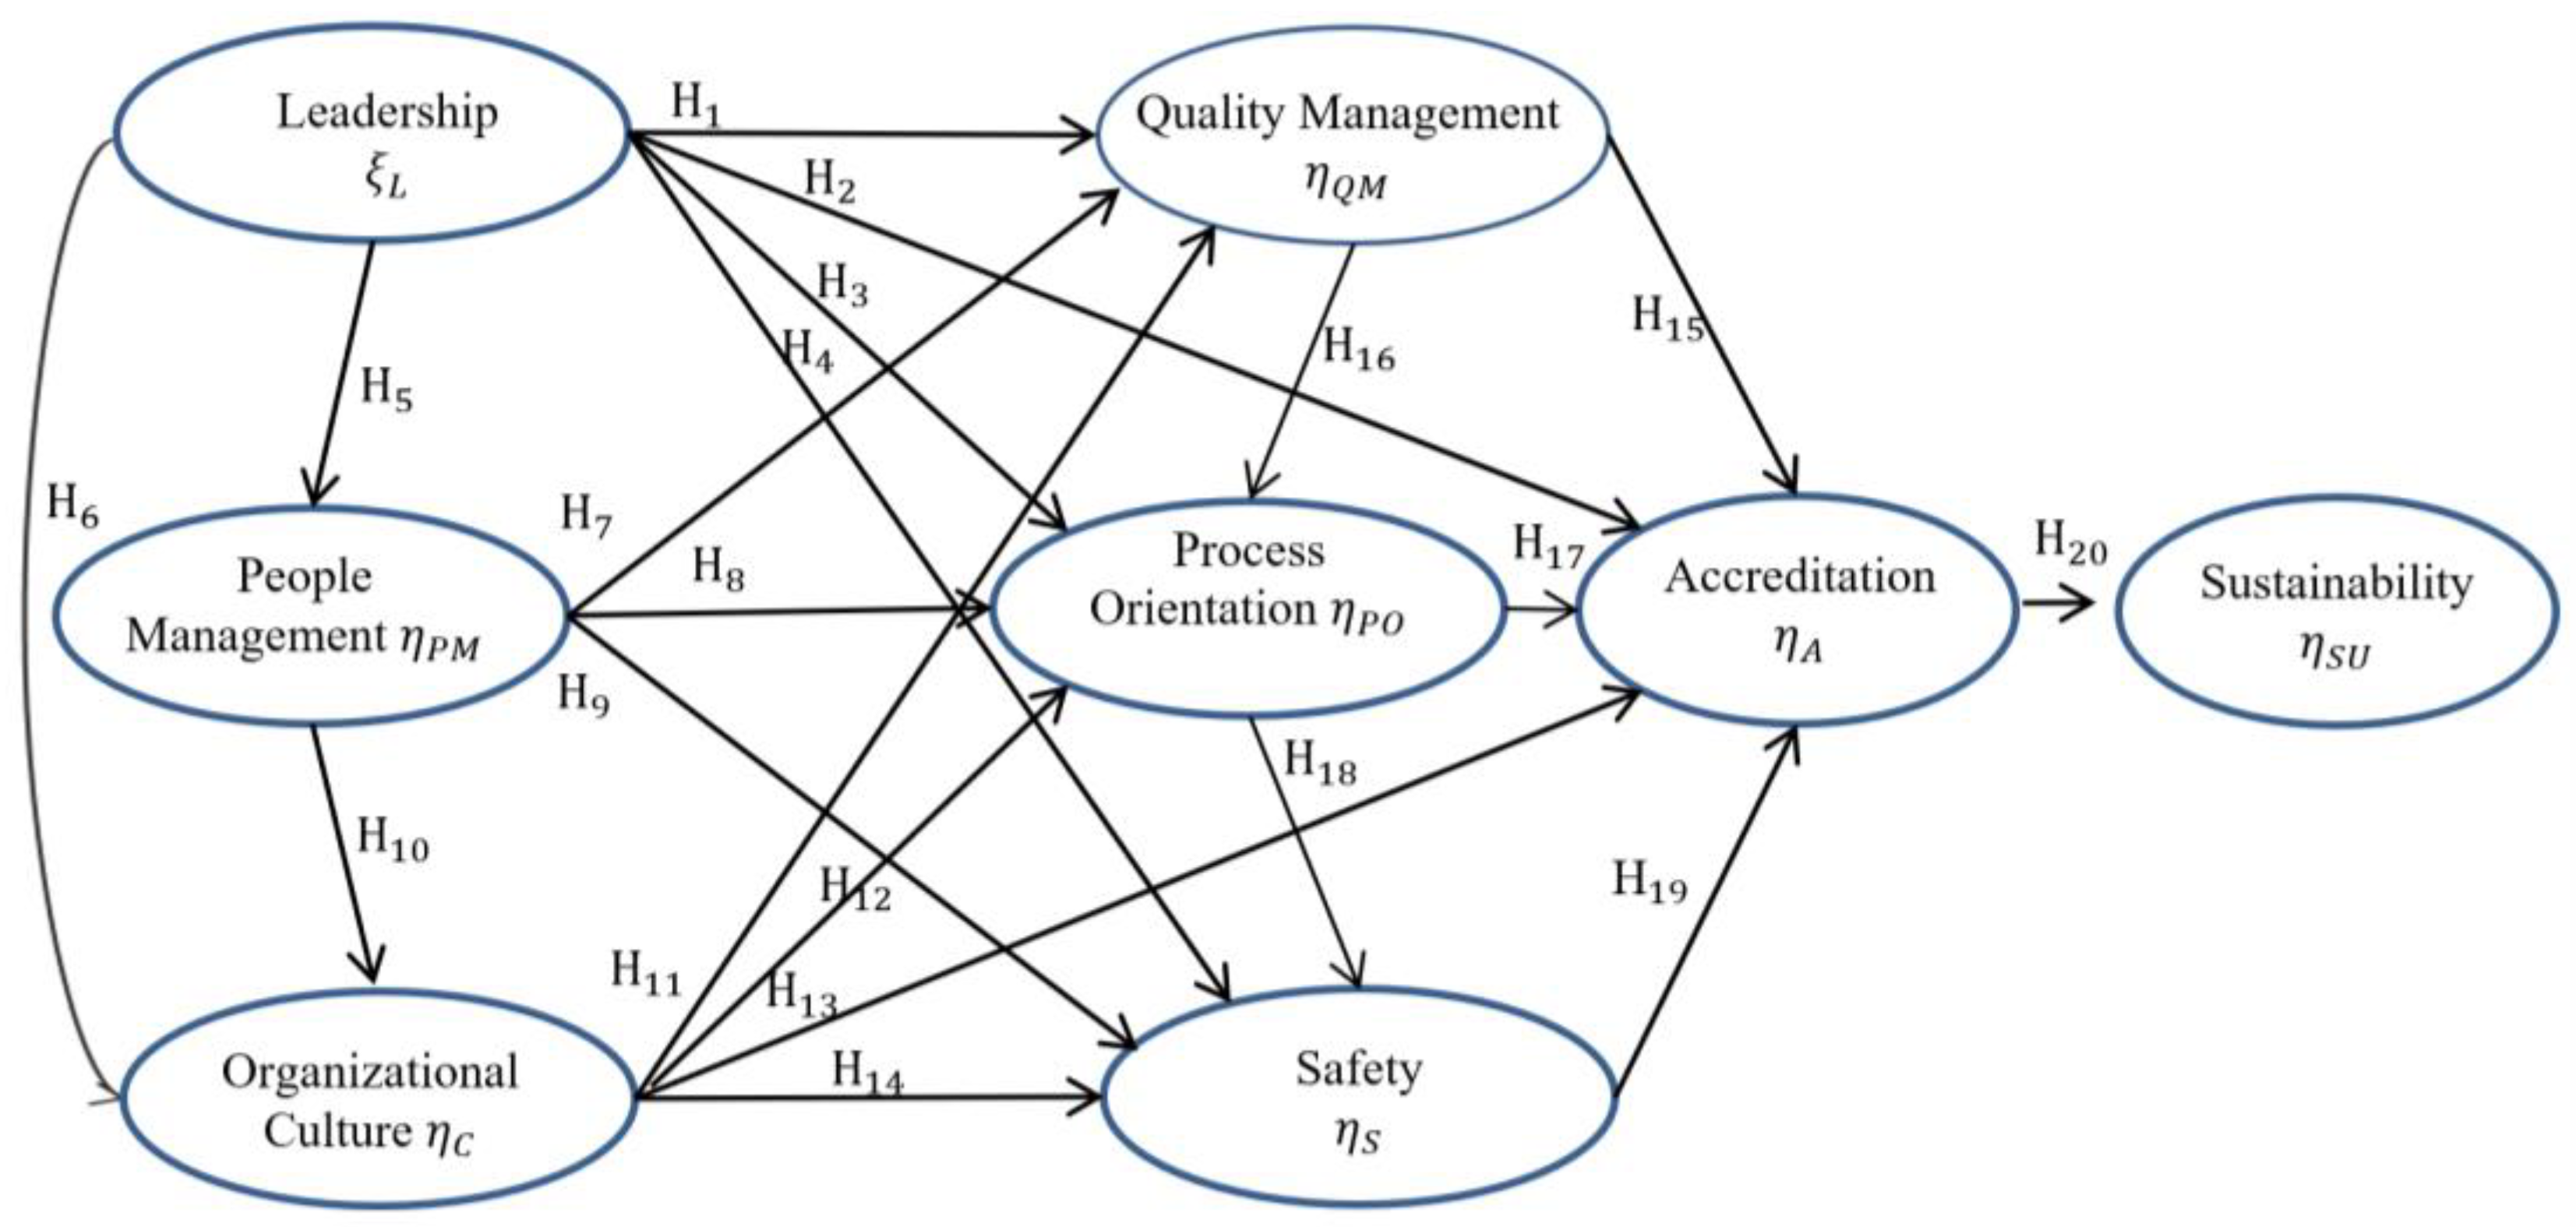
- Leadership Construct (L): Refers to the commitment of the senior management, traditionally considered one of the most powerful bodies in quality control. This force is capable of building, defending, and supporting a context that leads to high organizational performance, individual development, and organizational learning, crucial factors towards quality development inside an organization [1,9,10,13,22,24,25,26,27,28,29,30,31,32,33].
- Sustainability Construct (SU): This construct defines the organization’s ability to deal with challenges and variations that occur over longer periods of time, using a process of continuous improvement. This construct is directly linked to the adoption of quality practices that present more desirable results in the work processes, patient safety, and financial stability of the organization. It considers aspects related to the capacity an organization has to develop, maintain, and constructively promote a more positive performance in work practices, presenting constant improvements in its processes and management system [6,17,18,19,27,33,34,35].
- People Management Construct (PM): The main aspect considered in this construct is on how well the organization engages, manages and develops its work force. This construct also relates to how the organization administers its mission, strategy, and action plans in order to use all of its human potential. The capacity of an organization to evaluate the needs of its team, creating a high performance work environment is also considered in this scope. Several authors have been searching to analyze the relationship between this construct and other variables such as performance of employees [27,29,30,33,35,36,37,38], continuous improvement [10,25,29,35,36], setting goals [6], and control [6,32].
- Organizational Culture Construct (C): Refers to the “state” or set of characteristics that describe the desire to pursue a course of action focused on the final goal [9]. Organizational culture has a significant effect on the successful implementation of accreditation. Such culture is inherent of the institution and therefore is not a characteristic of its individuals [22]. Other authors have also been addressing the relationship between this construct and other variables such as organizational commitment [10,22,39], continuous education [29,30,31,40,41], performance [22,39], and environment [31,40].
- Quality Management Construct (QM): The literature indicates that health institutions employ quality practices related to customer satisfaction, process control, competitive benchmarking, and to the existence of a quality team [26,32], which relates to the existence of an integrated team focused on patient safety through well-defined processes. There have also been studies that assert the relationship between this construct and other variables such as: quality department [27,30,35], continuous improvement [10,29,32,35,36], quality of information available [27,36,41], and process quality standards [6,40].
- Process Orientation Construct (PO): The literature treats process orientation as activities related to the existence of well-defined processes in all activities of an institution with focus on health sectors, personnel management, and in senior management. Protocols, internationally standardized processes, cooperation, measurement, data analysis, and continuous improvement are addressed in this construct. Process orientation involves points related to constructs that were identified in the literature. Some authors have been analyzing the relationship between this construct and other variables such as processes [1,10,34,40] and process management [1,13,29,30,32,42].
- Safety Construct (S): This construct deals with a fundamental factor, especially when dealing with Brazilian hospital services. In the literature, safety is referred to as the common perceptions the members of an organization have regarding their policies and safety practices, which are directly influenced by senior management. Recently, health care operation management researchers such as McFadden, Stock, and Gowen [25] have developed empirical tests on a theoretical model that evaluates the impact of safety in service quality. Several authors have approached this construct in different aspects such as climate safety practices, patient safety, safety management, senior management engagement, and interactivity [22,25,40].
- Accreditation Construct (A): This construct refers to the methodology used in Brazilian accreditation, a voluntary evaluation method that aims to ensure the quality of health services through patterns previously defined by the Brazilian Method of Hospital Accreditation (ONA). This construct refers to how an organization uses accreditation to improve the quality of their services, or how an organization establishes its processes based on a set of predetermined patterns [30].
2. Materials and Methods
2.1. Research Hypotheses
- = Observed regression coefficient.
- = True regression coefficient.
- = Reliability of the independent variable.
2.2. Data Collection and Management
2.3. Evaluation of the Measurement Model
2.4. Evaluation of the Structural Model
3. Results
3.1. Cross Validation and Power Assessment
3.2. Validation of the Sustainability Structural Model in Accredited Organizations
4. Discussion
4.1. Theoretical and Practical Implications
4.2. Limitations and Research Extensions
5. Conclusions
Supplementary Materials
Author Contributions
Funding
Acknowledgments
Conflicts of Interest
References
- Kunkel, S.; Rosenqvist, U.; Westerling, R. The structure of quality systems is important to the process and outcome, an empirical study of 386 hospital departments in Sweden. BMC Health Serv. Res. 2007, 7, 104. [Google Scholar] [CrossRef] [PubMed]
- Greenfield, D.; Pawsey, M.; Hinchcliff, R.; Moldovan, M.; Braithwaite, J. The standard of healthcare accreditation standards: A review of empirical research underpinning their development and impact. BMC Health Serv. Res. 2012, 12. [Google Scholar] [CrossRef] [PubMed]
- Shaw, C.D.; Braithwaite, J.; Moldovan, M.; Nicklin, W.; Grgic, I.; Fortune, T.; Whittaker, S. Profiling health-care accreditation organizations: An international survey. Int. J. Qual. Health Care 2013, 25, 222–231. [Google Scholar] [CrossRef] [PubMed]
- Feldman, L.B.; Cunha, I.C.K.O. Identification of result evaluation criteria for nursing service in hospital accreditation programs. Rev. Lat. Am. Enferm. 2006, 14, 540–545. [Google Scholar] [CrossRef]
- Greenfield, D.; Hinchcliff, R.; Westbrook, M.; Jones, D.; Low, L.; Johnston, B.; Banks, M.; Pawsey, M.; Moldovan, M.; Westbrook, J.; et al. An empirical test of accreditation patient journey surveys: Randomized trial. Int. J. Qual. Health Care 2012, 24, 495–500. [Google Scholar] [CrossRef] [PubMed]
- Goldstein, S.M.; Naor, M. Linking publicness to operations management practices: A study of quality management practices in hospitals. J. Oper. Manag. 2005, 23, 209–228. [Google Scholar] [CrossRef]
- Greenfield, D.; Braithwaite, J. Health sector accreditation research: A systematic review. Int. J. Qual. Health Care 2008, 20, 172–183. [Google Scholar] [CrossRef] [PubMed]
- Groene, O.; Klazinga, N.; Wagner, C.; Arah, O.A.; Thompson, A.; Bruneau, C.; Sũol, R. Investigating organizational quality improvement systems, patient empowerment, organizational culture, professional involvement and the quality of care in European hospitals: The “Deepening our Understanding of Quality Improvement in Europe (DUQuE)” proje. BMC Health Serv. Res. 2010, 10, 281. [Google Scholar] [CrossRef] [PubMed] [Green Version]
- Ashill, N.J.; Carruthers, J.; Krisjanous, J. The effect of management commitment to service quality on frontline employees’ affective and performance outcome: An empirical investigation of the New Zealand public healthcare sector. Int. J. Nonprofit Volunt. Sect. Mark. 2006, 11, 271–287. [Google Scholar] [CrossRef]
- Awuor, E.O.; Kinuthia, D.M. Total Quality Management Practices in Selected Private Hospitals in Nairobi, Kenya. Eur. J. Bus. Manag. 2013, 5, 33–44. [Google Scholar]
- Tjeldvoll, A. Change leadership in universities: The Confucian dimension. J. High. Educ. Policy Manag. 2011, 33, 219–230. [Google Scholar] [CrossRef]
- Chang, S.J.; Hsiao, H.C.; Huang, L.H.; Chang, H. Taiwan quality indicator project and hospital productivity growth. Omega 2011, 39, 14–22. [Google Scholar] [CrossRef]
- Claver, E.; Tarí, J.J.; Molina, J.F. Critical factors and results of quality management: An empirical study. Total Qual. Manag. Bus. Excell. 2003, 14, 91–118. [Google Scholar] [CrossRef]
- Corrêa, J.É.; Turrioni, J.B.; De Paiva, A.P.; De Carvalho Paes, V.; Balestrassi, P.P.; Papandrea, P.J.; De Carvalho Gonçalves, E.D. The influence of accreditation on the sustainability of organizations with the Brazilian accreditation methodology. J. Healthc. Eng. 2018, 2018, 5–9. [Google Scholar] [CrossRef] [PubMed]
- ONA. ONA—Organização Nacional de Acreditação—Histórico. Available online: http://www.webcitation.org/732fgNQce (accessed on 9 October 2018).
- Slaghuis, S.S.; Strating, M.M.; Bal, R.A.; Nieboer, A.P. A framework and a measurement instrument for sustainability of work practices in long-term care. BMC Health Serv. Res. 2011, 11, 314. [Google Scholar] [CrossRef] [PubMed] [Green Version]
- Slaghuis, S.S.; Strating, M.M.H.; Bal, R.A.; Nieboer, A.P. A measurement instrument for spread of quality improvement in healthcare. Int. J. Qual. Health Care 2013, 25, 125–131. [Google Scholar] [CrossRef] [PubMed] [Green Version]
- Parand, A.; Benn, J.; Burnett, S.; Pinto, A.; Vincent, C. Strategies for sustaining a quality improvement collaborative and its patient safety gains. Int. J. Qual. Health Care 2012, 24, 380–390. [Google Scholar] [CrossRef] [PubMed] [Green Version]
- Scheirer, M.A. Is sustainability possible? A review and commentary on empirical studies of program sustainability. Am. J. Eval. 2005, 26, 320–347. [Google Scholar] [CrossRef]
- Ibrahim, J.; Macphail, A.; Chadwick, L.; Jeffcott, S. Interns’ perceptions of performance feedback. Med. Educ. 2014, 48, 417–429. [Google Scholar] [CrossRef] [PubMed]
- El-Jardali, F.; Hemadeh, R.; Jaafar, M.; Sagherian, L.; El-Skaff, R.; Mdeihly, R.; Jamal, D.; Ataya, N. The Impact of Accreditation of Primary Healthcare centers: Successes, Challenges and Policy Implictions as Perceived by Healthcare Providers and Director in Lebanon. BMC Health Serv. Res. 2014, 14, 86. [Google Scholar] [CrossRef] [PubMed]
- Woo, J.-S.; Kim, Y.-H.; Yoon, B.-J.; Lee, H.-J.; Kim, H.-S.; Choi, Y.-J.; Han, W.-J.; Yoon, S.-J. The Effects of Accreditation Program to the Leadership, Organizational Culture, Hospital Management Activities and Performances—Focused on Perception of Accredited Hospital Professions. Korea J. Hosp. Manag. 2013, 18, 33–56. [Google Scholar]
- Hair, J.F.; Gabriel, M.L.D.D.S.; Patel, V.K. AMOS Covariance-Based Structural Equation Modeling (CB-SEM): Guidelines on its Application as a Marketing Research Tool. Rev. Bras. Mark. 2014, 13, 44–55. [Google Scholar] [CrossRef]
- Li, L.X. Relationships Between Determinants of Hospital Quality Management and Service Quality Performance a Path Analytic Model. Omega 1997, 25, 535–545. [Google Scholar] [CrossRef]
- McFadden, K.L.; Stock, G.N.; Gowen, C.R. Leadership, safety climate, and continuous quality improvement: Impact on process quality and patient safety. Health Care Manag. Rev. 2015, 40, 24–34. [Google Scholar] [CrossRef] [PubMed]
- Meyer, S.M.; Collier, D.A. An empirical test of the causal relationships in the Baldridge Health Care Pilot Criteria. J. Oper. Manag. 2001, 19, 403–426. [Google Scholar] [CrossRef]
- Xiong, J.; He, Z.; Ke, B.; Zhang, M. Development and validation of a measurement instrument for assessing quality management practices in hospitals: An exploratory study. Total Qual. Manag. Bus. Excell. 2015, 37–41. [Google Scholar] [CrossRef]
- Lee, S.C.; Suh, Y.H.; Han, S.S. Causal relationship among Baldrige health care criteria in Korean university hospitals. J. Korean Soc. Qual. Manag. 2007, 35, 1–15. [Google Scholar]
- Douglas, T.J.; Fredendall, L.D. Evaluating the deming management model of total quality in services. Decis. Sci. 2004, 35, 393–422. [Google Scholar] [CrossRef]
- El-jardali, F.; Jamal, D.; Dimassi, H.; Ammar, W.; Tchaghchaghian, V. The impact of hospital accreditation on quality of care: Perception of Lebanese nurses. Int. J. Qual. Health Care 2008, 20, 363–371. [Google Scholar] [CrossRef] [PubMed]
- Faye, A.; Fournier, P.; Diop, I.; Philibert, A.; Morestin, F.; Dumont, A. Developing a tool to measure satisfaction among health professionals in sub-Saharan Africa. Hum. Resour. Health 2013, 11, 30. [Google Scholar] [CrossRef] [PubMed]
- Gowen, C.R.; Mcfadden, K.L.; Hoobler, J.M.; Tallon, W.J. Exploring the efficacy of healthcare quality practices, employee commitment, and employee control. J. Oper. Manag. 2006, 24, 765–778. [Google Scholar] [CrossRef]
- Lee, K.; Wan, T.T.H.; Kwon, H. The relationship between healthcare information system and cost in hospital. Pers. Ubiquit. Comput. 2013, 17, 1395–1400. [Google Scholar] [CrossRef]
- Kunst, P.; Lemmink, J. Quality management and business performance in hospitals: A search for success parameters. Total Qual. Manag. 2010, 11, 1123–1133. [Google Scholar] [CrossRef]
- Li, L.; Benton, W.C.; Leong, G.K. The impact of strategic operations management decisions on community hospital performance. J. Oper. Manag. 2002, 20, 389–408. [Google Scholar] [CrossRef]
- Choi, W.; Rho, M.J.; Park, J.; Kim, K.-J.; Kwon, Y.D.; Choi, I.Y. Information system success model for customer relationship management system in health promotion centers. Healthc. Inform. Res. 2013, 19, 110–120. [Google Scholar] [CrossRef] [PubMed]
- Phichitchaisopa, N.; Naenna, T. Factors affecting the adoption of healthcare information technology. Excli J. 2013, 12, 413–436. [Google Scholar] [CrossRef] [PubMed]
- Li, L.; Benton, W. Hospital capacity management decisions: Emphasis on cost control and quality enhancement. Eur. J. Oper. Res. 2003, 146, 596–614. [Google Scholar] [CrossRef]
- Wilkinson, A.; Bacon, N.; Redman, T.; Snell, S. The SAGE Handbook of Human Resource Management; Sage Publications: Thousand Oaks, CA, USA, 2009; Volume 616. [Google Scholar]
- Boyer, K.K.; Gardner, J.W.; Schweikhart, S. Process quality improvement: An examination of general vs. outcome-specific climate and practices in hospitals. J. Oper. Manag. 2012, 30, 325–339. [Google Scholar] [CrossRef]
- Cheng, Y.-M. Extending the expectation-confirmation model with quality and flow to explore nurses’ continued blended e-learning intention. Inf. Technol. People 2014, 27, 230–258. [Google Scholar] [CrossRef]
- Lee, D. Implementation of quality programs in health care organizations. Serv. Bus. 2012, 6, 387–404. [Google Scholar] [CrossRef]
- Marôco, J. Análise de Equações Estruturais: Fundamentos Teóricos, Software & Aplicações, 2nd ed.; Report Number: Pêro Pinheiro, Portugal, 2014; ISBN 978-989-96763-3-6. [Google Scholar]
- Kline, R.B. Principles and Practice of Structural Equation Modeling, 4th ed.; The Guilford Press: New York, NY, USA, 2011; ISBN 978-1-4625-2334-4. [Google Scholar]
- Bollen, K.A. A new incremental fit index for general structural equation models. Sociol. Methods Res. 1989, 17, 303–306. [Google Scholar] [CrossRef]
- Hair, F.; Sarstedt, M.; Hopkins, L.; Kuppelwieser, G.V. Partial least squares structural equation modeling (PLS-SEM): An emerging tool in business research. Eur. Bus. Rev. 2014, 26, 106–121. [Google Scholar] [CrossRef]
- Anderson, J.C.; Gerbing, D.W. Structural equation modeling in practice: A review and recommended two-step approach. Psychol. Bull. 1988, 103, 411–423. [Google Scholar] [CrossRef]
- Kou, T.-C.; Lee, B.C.Y.; Wei, C.-F. The role of product lean launch in customer relationships and performance in the high-tech manufacturing industry. Int. J. Oper. Prod. Manag. 2015, 35, 1207–1223. [Google Scholar] [CrossRef]
- Forza, C. Survey research in operations management: A process-based perspective. Int. J. Oper. Prod. Manag. 2002, 22, 152–194. [Google Scholar] [CrossRef]
- Hair, J.F.; Black, W.C.; Babin, B.J.; Anderson, R.E.; Tatham, R.L. Análise Multivariada de Dados, 6th ed.; Bookman: Porto Alegre, Brazil, 2009; ISBN 9788577804023. [Google Scholar]
- Alwin, D.F. Margins of Error: A Study of Reliability in Survey Measurement; John Wiley & Sons, Inc.: Hoboken, NJ, USA, 2007; ISBN 9780470081488. [Google Scholar]
- Vieira, A.L. ABC do LISREL Interactivo—Um Exemplo Prático de Modelações em Equações Estruturais; Sílabo: Lisboa, Portugal, 2009; ISBN 978-972-618-530-7. [Google Scholar]
- Asparouhov, T.; Muthén, B. Exploratory Structural Equation Modeling. Struct. Equ. Model. A Multidiscip. J. 2009, 16, 397–438. [Google Scholar] [CrossRef] [Green Version]
- Steenkamp, J.B.E.M.; van Trijp, H.C.M. The use of lisrel in validating marketing constructs. Int. J. Res. Mark. 1991, 8, 283–299. [Google Scholar] [CrossRef]
- Diamantopoulos, A.; Siguaw, J.A. Introducing LISREL: A Guide for the Uninitiated; Sage Publications: London, UK, 2000; ISBN 0761951717. [Google Scholar]
- Crosby, L.A.; Evans, K.R.; Cowles, D. Relationship quality in services selling: An interpersonal influence perspective. J. Mark. 1990, 54, 68–81. [Google Scholar] [CrossRef]


| Construct | Questions | Variables | Cronbach’s Alpha | Factors | Estimate (γ) | Standardized Solution (sd) | t-Value (t) | Communalities Sum of % Var |
|---|---|---|---|---|---|---|---|---|
| Leadership (L) | Q12 | L1 | 0.8443 | F1: Leadership performance | 1.04 | 1.07 | 16.13 | 0.754 |
| Q13 | L2 | 0.8455 | ||||||
| Q14 | L3 | 0.8394 | F2: Leadership involvement | 0.70 | 0.88 | 14.14 | ||
| Q15 | L4 | 0.8436 | ||||||
| Q16 | L5 | 0.8439 | ||||||
| Q17 | L6 | 0.8449 | ||||||
| Sustainability (SU) | Q18 | SU1 | 0.8414 | F1: Sustainable performance | 1.00 | 0.91 | 1.00 | 0.785 |
| Q13 | SU6 | 0.845 | ||||||
| Q21 | SU4 | 0.8482 | F2: Commitment | 0.82 | 0.92 | 8.58 | ||
| Q22 | SU5 | 0.8411 | ||||||
| Q19 | SU2 | 0.8428 | F3: Achievement of goals | 0.95 | 1.00 | 7.53 | ||
| Q20 | SU3 | 0.8398 | ||||||
| People Management (PM) | Q24 | PM1 | 0.8393 | F1: Information of professionals | 1.00 | 0.83 | 9.83 | 0.770 |
| Q28 | PM5 | 0.8427 | ||||||
| Q25 | PM2 | 0.8421 | F2: Personal valuation | 0.80 | 1.10 | 12.07 | ||
| Q26 | PM3 | 0.837 | ||||||
| Q 27 | PM4 | 0.8362 | ||||||
| Organizational Culture (C) | Q29 | C1 | 0.8444 | F1: Organizational Commitment | 1.00 | 0.71 | - | 0.814 |
| Q31 | C3 | 0.8389 | ||||||
| Q30 | C2 | 0.8402 | F2: Performance | 0.62 | 1.42 | 10.48 | ||
| Q32 | C4 | 0.8337 | ||||||
| Q33 | C5 | 0.8403 | ||||||
| Quality Management (QM) | Q34 | QM1 | 0.8402 | F1: Quality team involvement | 1.00 | 0.71 | - | 0.769 |
| Q37 | QM4 | 0.8384 | ||||||
| Q38 | QM5 | 0.8354 | ||||||
| Q35 | QM2 | 0.8472 | F2: Quality Indicators | 0.62 | 1.42 | 10.48 | ||
| Q36 | QM3 | 0.8407 | ||||||
| Process Orientation (PO) | Q39 | PO1 | 0.8408 | F1: Process orientation | 1.00 | 0.82 | - | 0.820 |
| Q40 | PO2 | 0.8441 | ||||||
| Q41 | PO3 | 0.8392 | ||||||
| Q42 | PO4 | 0.8407 | ||||||
| Safety (S) | Q43 | S1 | 0.8404 | F1: Safety culture | 1.00 | 1.39 | - | 0.810 |
| Q44 | S2 | 0.8396 | ||||||
| Q45 | S3 | 0.8367 | ||||||
| Q46 | S4 | 0.8383 | F2: Risks | 0.61 | 0.46 | 8.55 | ||
| Q47 | S5 | 0.8393 | ||||||
| Accreditation (A) | Q48 | A1 | 0.8459 | F1: Accreditation | 0.88 | 0.60 | 5.63 | 0.865 |
| Q49 | A2 | 0.8433 | ||||||
| Q50 | A3 | 0.8418 | ||||||
| Q51 | A4 | 0.8394 |
| Index Type | Index Indicator | Initial Model Result | Calibrated Model Result | Simulated Model Result | Reference Value |
|---|---|---|---|---|---|
| Absolute Adjustment | X2—Chi-square | 701.28 | 182.63 | 179.422 | p-value > 0.05 |
| Degree of freedom (df) | 75 | 77 | 74 | Higher than one | |
| Normed Chi-square: X2/df | 9.35 | 2.27 | 2.42 | 1 and 3: good Fit > 5 = bad | |
| Goodness-of-fit index (GFI) | 0.777 | 1.212 | 0.968 | ≥0.90 | |
| Root Mean Square Residual (RMR) | 0.119 | 0.436 | 0.359 | ≤0.05 | |
| Standardized Root Mean Residual (SRMR) | 0.113 | 0.256 | 0.566 | ≥0.1 | |
| Incremental adjustment | Normed Fit Index (NFI) | 0.749 | 0.939 | 0.925 | ≥0.9 |
| Comparative Fit Index (CFI) | 0.767 | 0.967 | 0.927 | ≥0.9 | |
| Parsimonious adjustment | Adjusted Goodness of Fit Index (AGFI) | 0.644 | 1.330 | 0.909 | ≥0.9 |
| Parsimony Normed Fit Index (PNFI) | 0.535 | 0.835 | 0.875 | Biggest value: best fit | |
| Parsimony Goodness-of-fit index (PGFI) | 0.486 | 0.477 | 0.455 | ≤0.67 being 0.5 a good fit | |
| Population adjustment | Root Mean square error of approximation (RMSEA) | 0.170 | 0.412 | 0.494 | 0.03 to 0.08, being 0.05 a good fit |
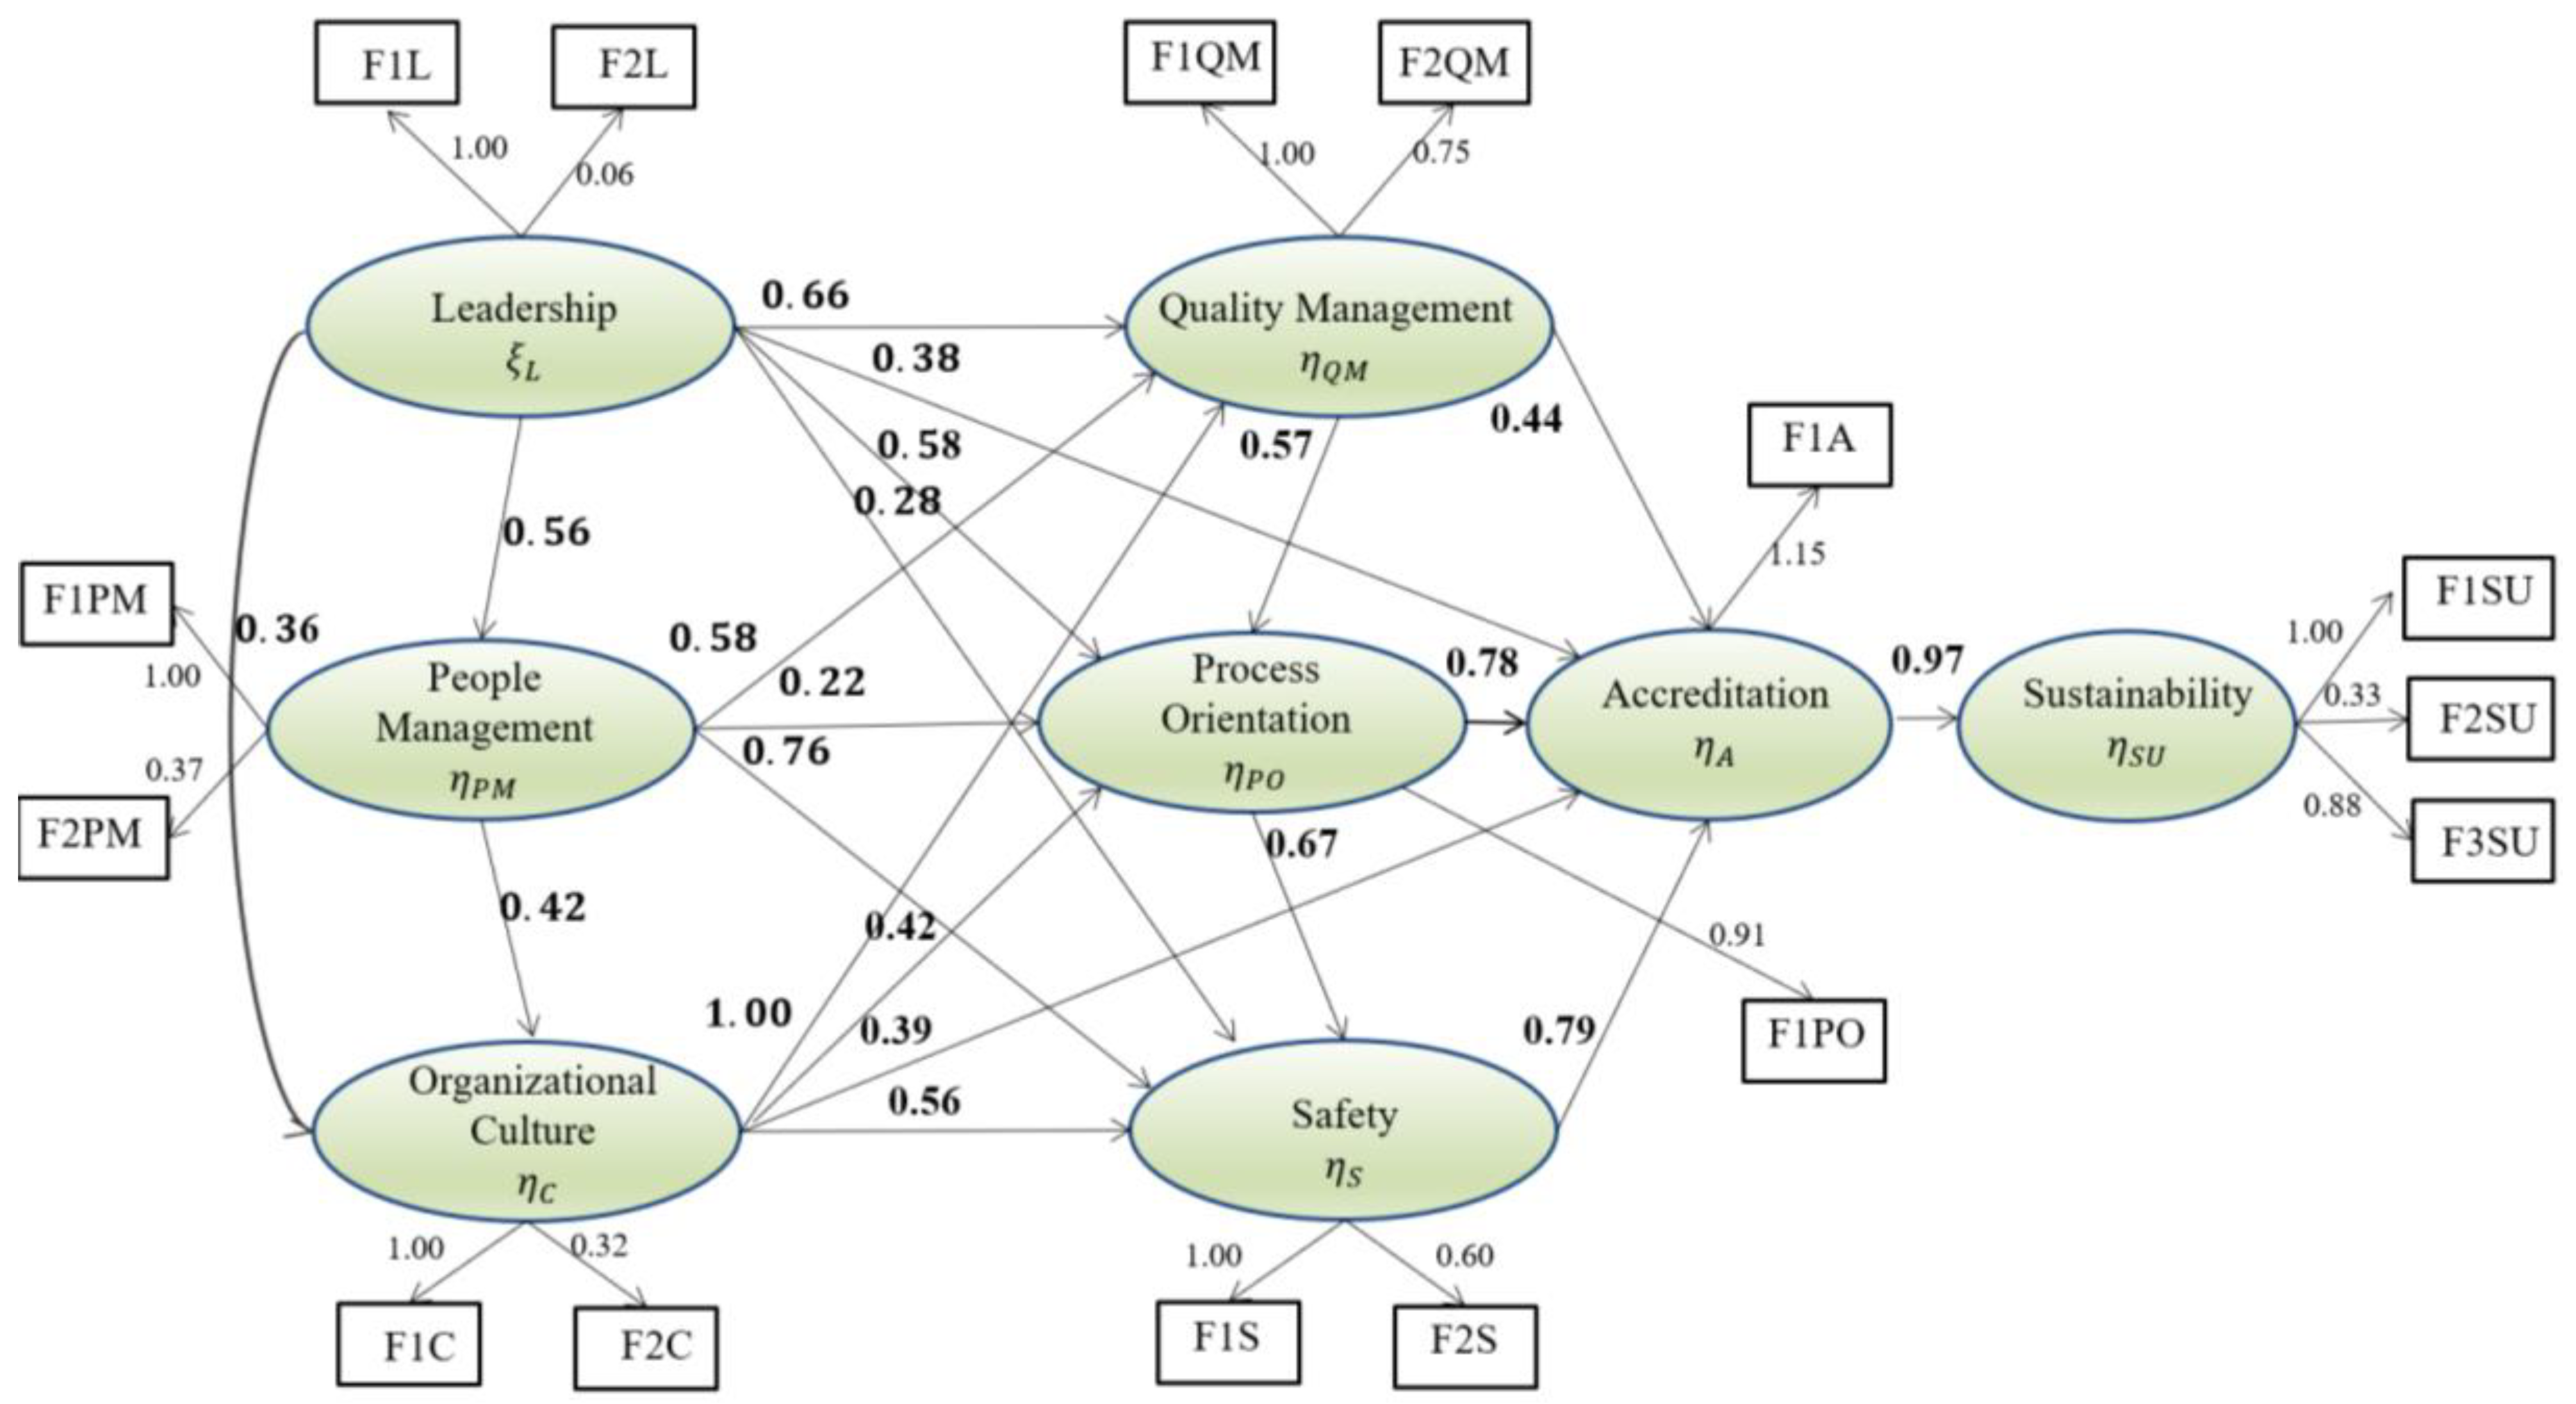
| Structural Equations | ||||||
|---|---|---|---|---|---|---|
| Relationships | Error Var | R2 | Composed Reliability | Extracted Variance | ||
| L |  | QM-A-PO-S-PM–C | 0.90 | 0.66 | 0.90 | 0.66 |
| PM | | QM-PO–S-C | 0.81 | 0.56 | 0.81 | 0.56 |
| C | | QM-PO-A-S | 0.91 | 0.75 | 0.91 | 0.75 |
| QM | | A–PO | 3.15 | 0.54 | 3.15 | 0.54 |
| PO | | A–S | 1.37 | 0.69 | 1.37 | 0.69 |
| S | | A | 0.98 | 0.98 | 0.98 | 0.98 |
| A | | SU | 1.07 | 1.07 | 1.07 | 1.07 |
| Covariance Matrix for the Latent Variables | ||||||
|---|---|---|---|---|---|---|
| PM | C | QM | PO | S | A | |
| PM | 0.384 | |||||
| C | 0.396 | 0.777 | ||||
| QM | 1.119 | 0.906 | 5.935 | |||
| PO | 0.583 | 0.477 | 2.068 | 1.000 | ||
| S | 0.521 | 0.436 | 1.462 | 0.668 | 0.277 | |
| A | 0.537 | 0.435 | 2.407 | 0.927 | 0.656 | 1.000 |
| SU | 0.785 | 0.636 | 0.519 | 1.355 | 0.959 | 1.462 |
| L | 0.339 | 0.433 | 1.216 | 0.650 | 0.505 | 0.593 |
© 2018 by the authors. Licensee MDPI, Basel, Switzerland. This article is an open access article distributed under the terms and conditions of the Creative Commons Attribution (CC BY) license (http://creativecommons.org/licenses/by/4.0/).
Share and Cite
Corrêa, J.É.; Turrioni, J.B.; Mello, C.H.P.; Santos, A.C.O.; Da Silva, C.E.S.; De Almeida, F.A. Development of a System Measurement Model of the Brazilian Hospital Accreditation System. Int. J. Environ. Res. Public Health 2018, 15, 2520. https://0-doi-org.brum.beds.ac.uk/10.3390/ijerph15112520
Corrêa JÉ, Turrioni JB, Mello CHP, Santos ACO, Da Silva CES, De Almeida FA. Development of a System Measurement Model of the Brazilian Hospital Accreditation System. International Journal of Environmental Research and Public Health. 2018; 15(11):2520. https://0-doi-org.brum.beds.ac.uk/10.3390/ijerph15112520
Chicago/Turabian StyleCorrêa, João Éderson, João Batista Turrioni, Carlos Henrique Pereira Mello, Ana Carolina Oliveira Santos, Carlos Eduardo Sanches Da Silva, and Fabrício Alves De Almeida. 2018. "Development of a System Measurement Model of the Brazilian Hospital Accreditation System" International Journal of Environmental Research and Public Health 15, no. 11: 2520. https://0-doi-org.brum.beds.ac.uk/10.3390/ijerph15112520