PM2.5-Bound Toxic Elements in an Urban City in East China: Concentrations, Sources, and Health Risks

 ,
,
Abstract
:1. Introduction
2. Methodology
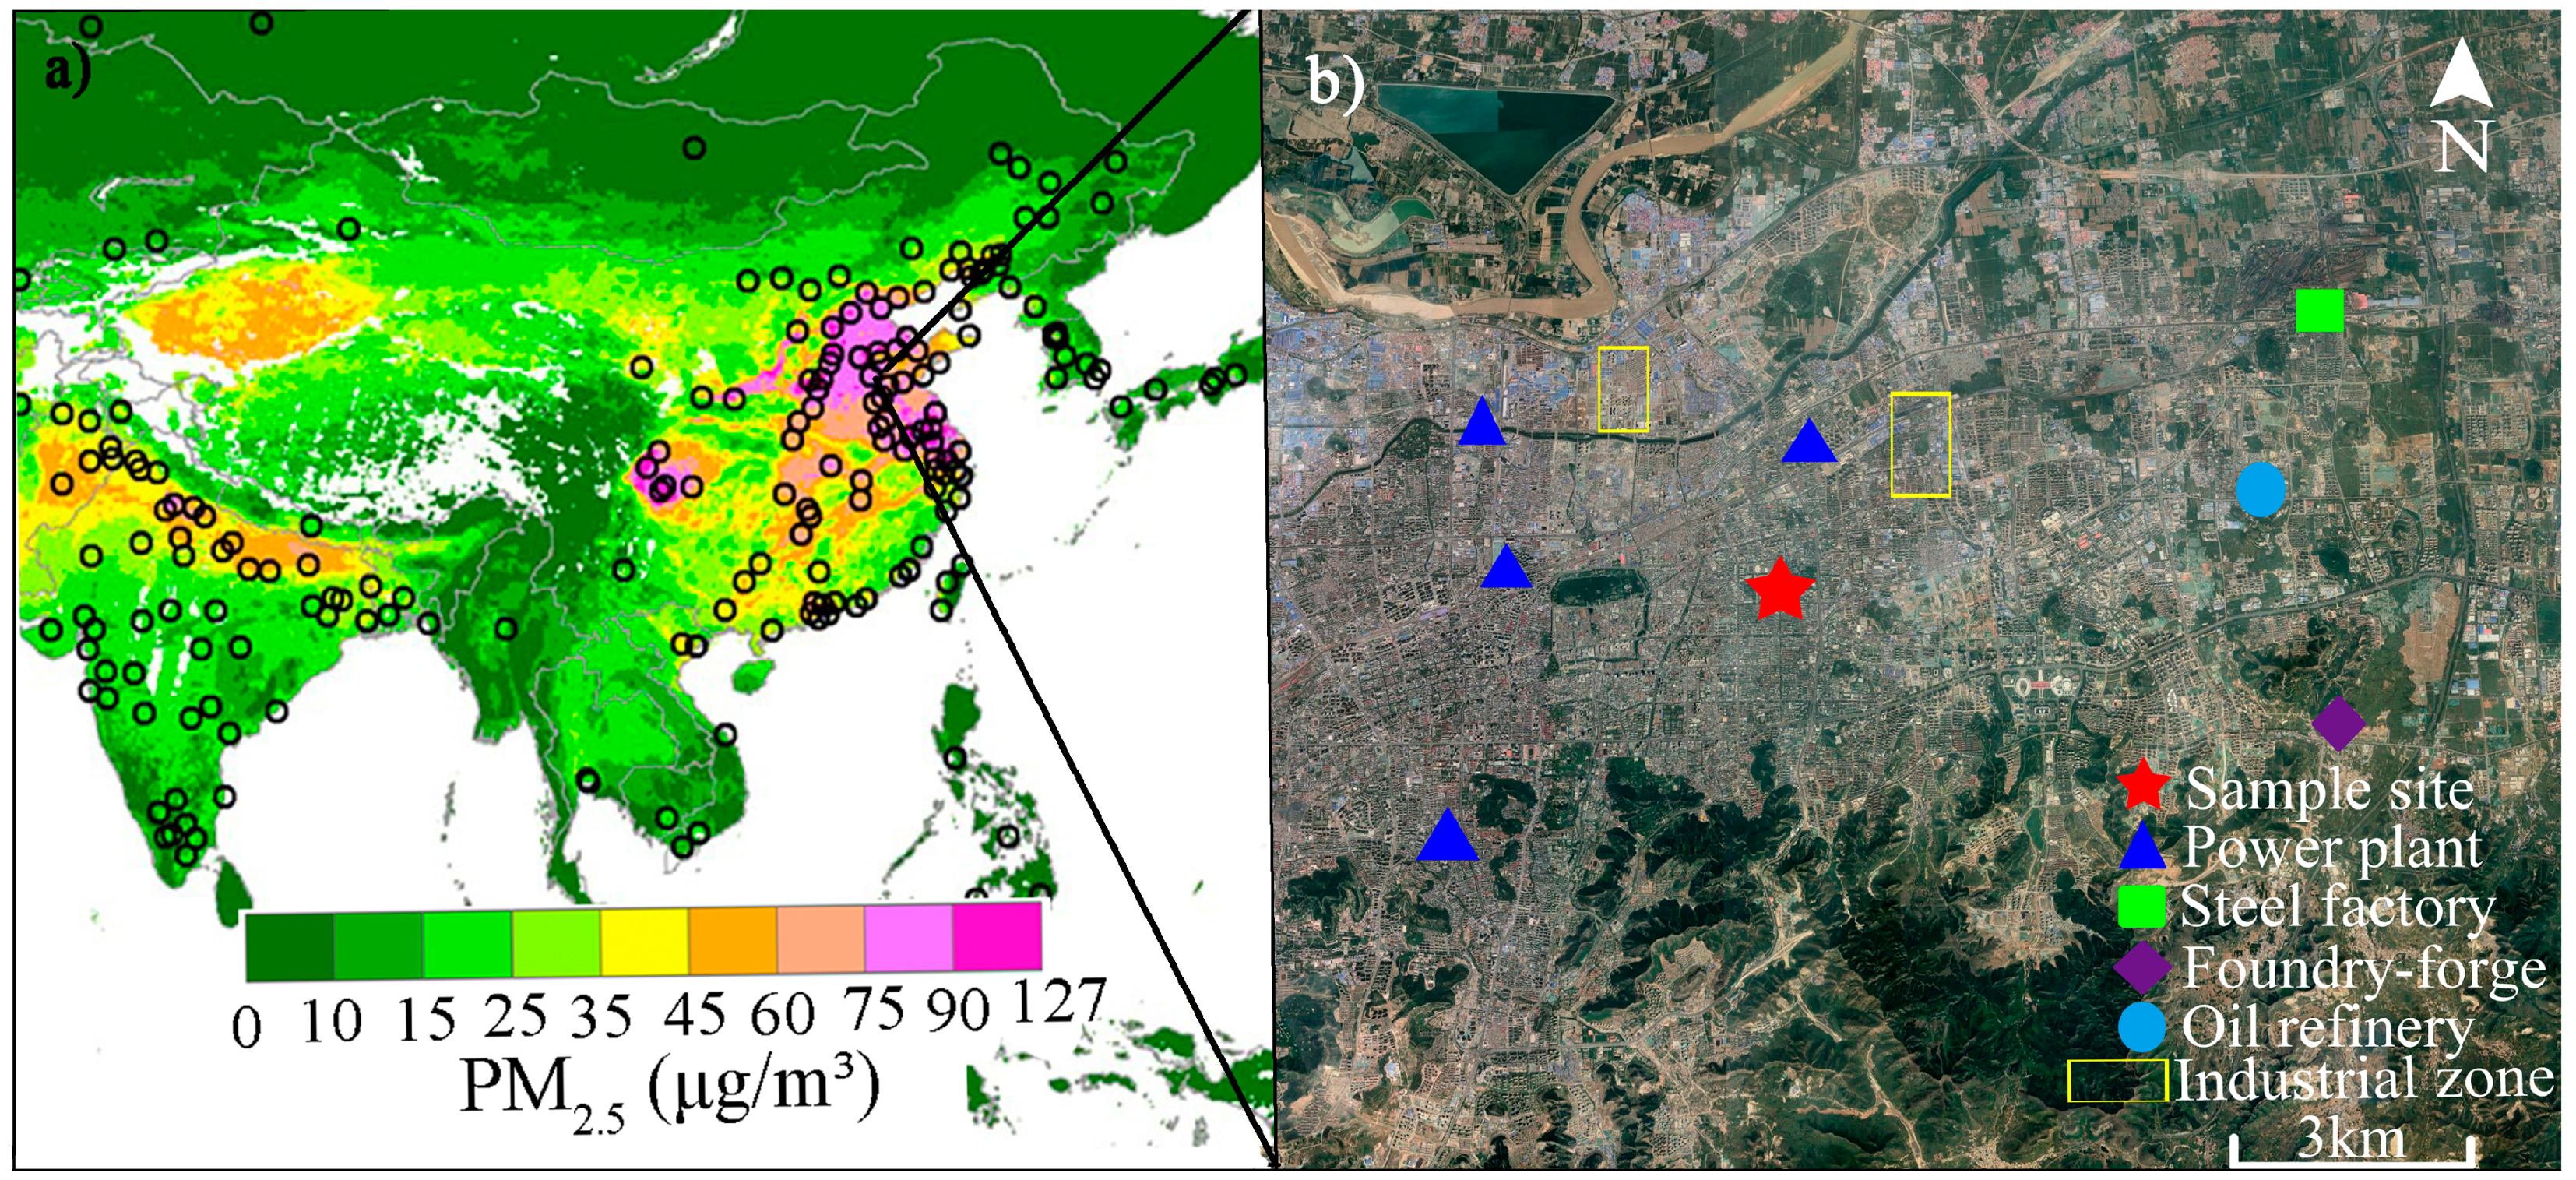
2.1. Sampling
2.2. Laboratory Analysis
2.3. PMF Source Apportionment
2.4. Health Risk Assessment
3. Results and Discussion
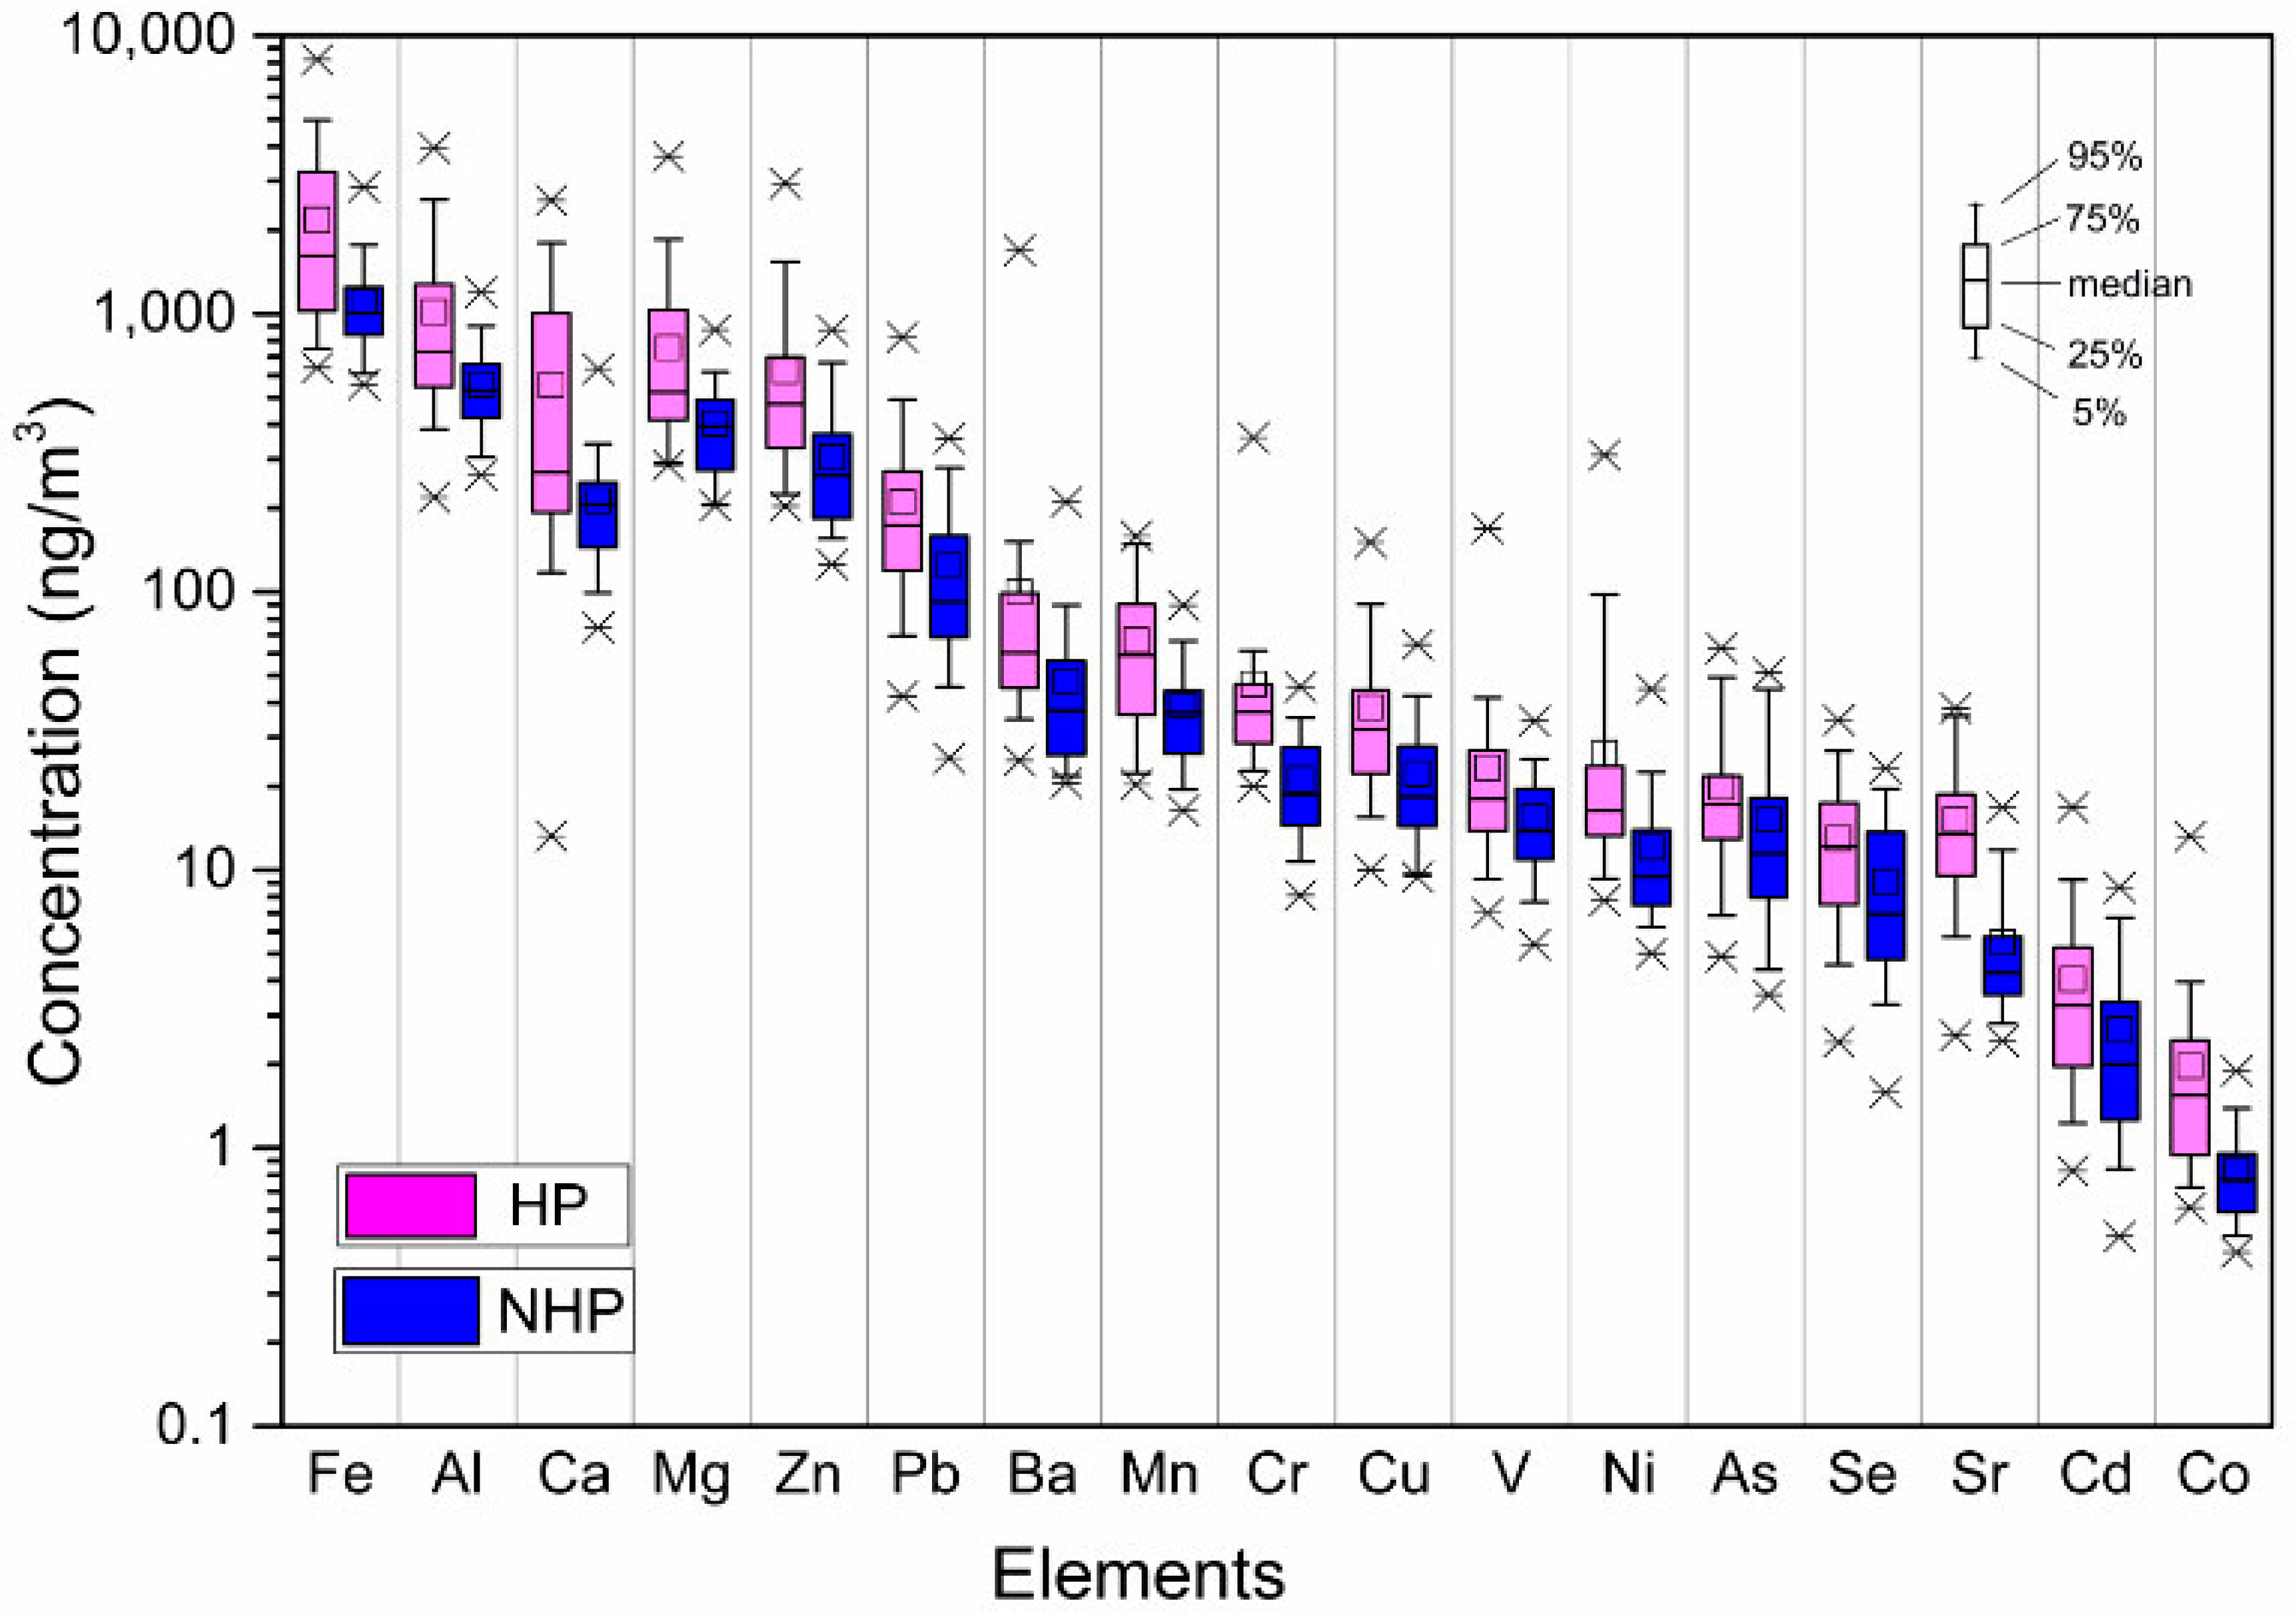
3.1. PM2.5 and Element Concentrations
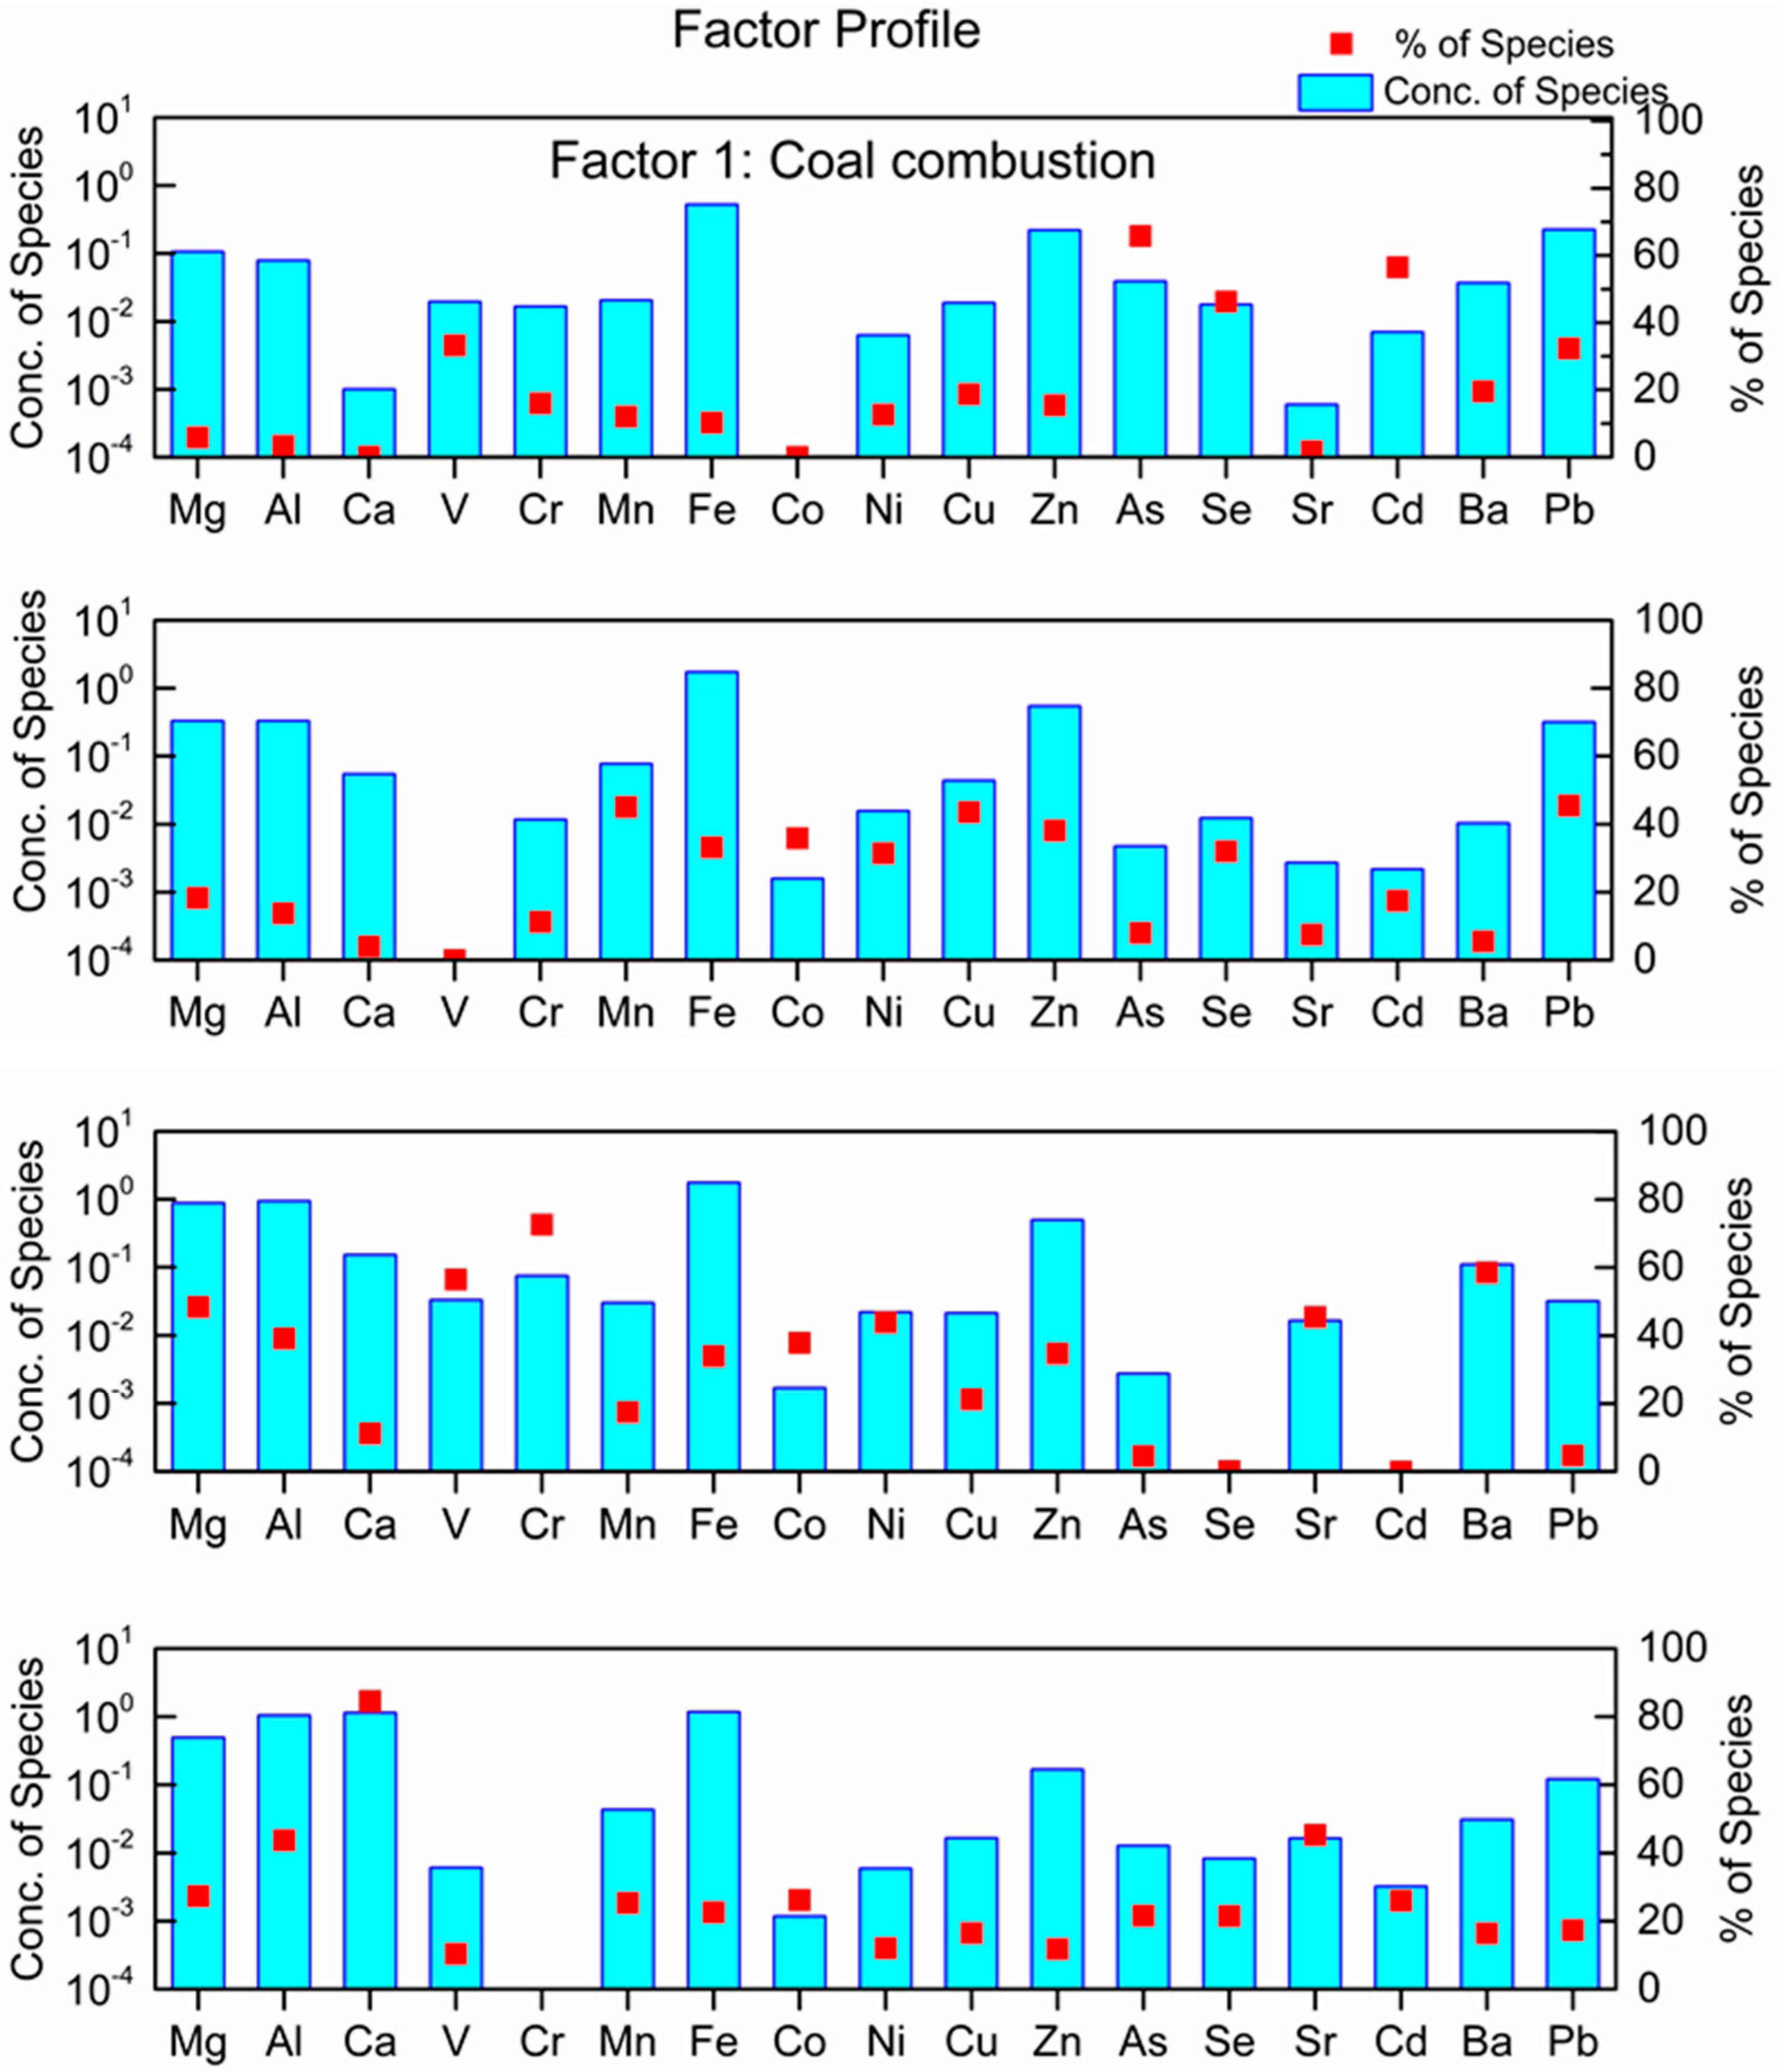
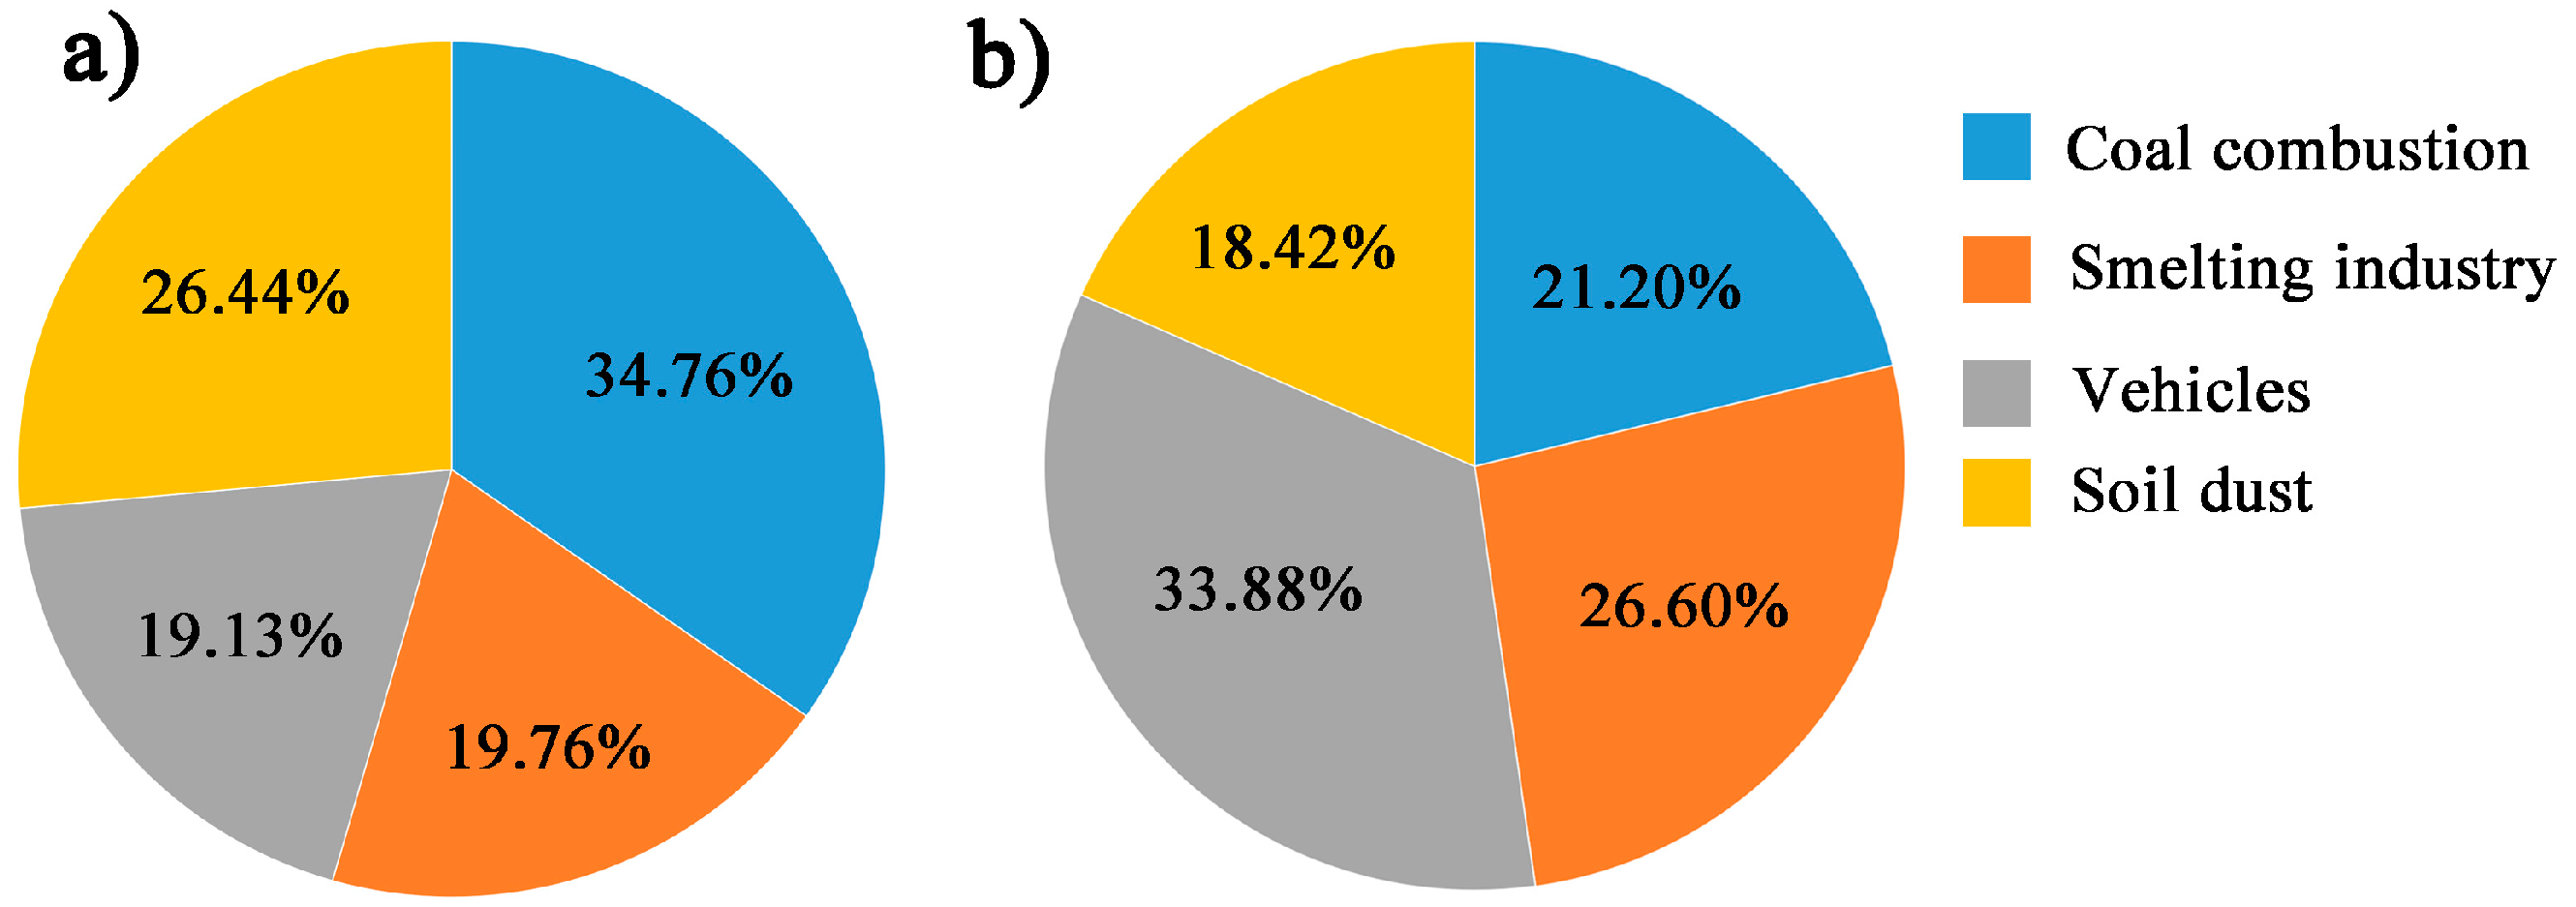
3.2. Source Apportionment
3.3. Health Risk Assessment
3.3.1. Health Risks of Individual Toxic Elements
3.3.2. Health Risks Associated with Each Sources
4. Conclusions
Author Contributions
Funding
Acknowledgments
Conflicts of Interest
References
- Huang, Y.; Li, J.; Xu, Y.; Xu, W.; Zhong, G.; Liu, X.; Zhang, G. Polychlorinated naphthalenes in the air over the equatorial Indian Ocean: Occurrence, potential sources, and toxicity. Mar. Pollut. Bull. 2016, 107, 240–244. [Google Scholar] [CrossRef] [PubMed] [Green Version]
- Lu, F.; Xu, D.; Cheng, Y.; Dong, S.; Guo, C.; Jiang, X.; Zheng, X. Systematic review and meta-analysis of the adverse health effects of ambient PM2.5 and PM10 pollution in the Chinese population. Environ. Res. 2015, 136, 196–204. [Google Scholar] [CrossRef] [PubMed]
- Cao, C.; Jiang, W.; Wang, B.; Fang, J.; Lang, J.; Tian, G.; Jiang, J.; Zhu, T.F. Inhalable microorganisms in Beijing’s PM2.5 and PM10 pollutants during a severe smog event. Environ. Sci. Technol. 2014, 48, 1499–1507. [Google Scholar] [CrossRef] [PubMed]
- Masiol, M.; Squizzato, S.; Rampazzo, G.; Pavoni, B. Source apportionment of PM2.5 at multiple sites in Venice (Italy): Spatial variability and the role of weather. Atmos. Environ. 2014, 98, 78–88. [Google Scholar] [CrossRef]
- Chen, L.C.; Lippmann, M. Effects of metals within ambient air particulate matter (PM) on human health. Inhal. Toxicol. 2009, 21, 1–31. [Google Scholar] [CrossRef] [PubMed]
- Lee, P.-K.; Youm, S.-J.; Jo, H.Y. Heavy metal concentrations and contamination levels from Asian dust and identification of sources: A case-study. Chemosphere 2013, 91, 1018–1025. [Google Scholar] [CrossRef] [PubMed]
- Franklin, M.; Koutrakis, P.; Schwartz, J. The role of particle composition on the association between PM2.5 and mortality. Epidemiology 2008, 19, 680–689. [Google Scholar] [CrossRef] [PubMed]
- Song, C.; He, J.; Wu, L.; Jin, T.; Chen, X.; Li, R.; Ren, P.; Zhang, L.; Mao, H. Health burden attributable to ambient PM2.5 in China. Environ. Pollut. 2017, 223, 575–586. [Google Scholar] [CrossRef]
- Kim, Y.; Ha, E.-H.; Park, H.; Ha, M.; Kim, Y.; Hong, Y.-C.; Kim, E.-J.; Kim, B.-N. Prenatal lead and cadmium co-exposure and infant neurodevelopment at 6 months of age: The Mothers and Children’s Environmental Health (MOCEH) study. Neurotoxicology 2013, 35, 15–22. [Google Scholar] [CrossRef]
- Mielke, H.W.; Laidlaw, M.A.; Gonzales, C. Lead (Pb) legacy from vehicle traffic in eight California urbanized areas: Continuing influence of lead dust on children’s health. Sci. Total Environ. 2010, 408, 3965–3975. [Google Scholar] [CrossRef]
- Abdul, K.S.M.; Jayasinghe, S.S.; Chandana, E.P.; Jayasumana, C.; De Silva, P.M.C. Arsenic and human health effects: A review. Environ. Toxicol. Pharmacol. 2015, 40, 828–846. [Google Scholar] [CrossRef] [PubMed]
- Roh, T.; Steinmaus, C.; Marshall, G.; Ferreccio, C.; Liaw, J.; Smith, A.H. Age at Exposure to Arsenic in Water and Mortality 30–40 Years After Exposure Cessation. Am. J. Epidemiol. 2018, 187, 2297–2305. [Google Scholar] [CrossRef] [PubMed]
- Reuben, A.; Caspi, A.; Belsky, D.W.; Broadbent, J.; Harrington, H.; Sugden, K.; Houts, R.M.; Ramrakha, S.; Poulton, R.; Moffitt, T.E. Association of childhood blood lead levels with cognitive function and socioeconomic status at age 38 years and with IQ change and socioeconomic mobility between childhood and adulthood. JAMA 2017, 317, 1244–1251. [Google Scholar] [CrossRef] [PubMed]
- Obeng-Gyasi, E. Lead exposure and oxidative stress—A life course approach in US adults. Toxics 2018, 6, 42. [Google Scholar] [CrossRef]
- Aldabe, J.; Elustondo, D.; Santamaría, C.; Lasheras, E.; Pandolfi, M.; Alastuey, A.; Querol, X.; Santamaría, J.M. Chemical characterisation and source apportionment of PM2.5 and PM10 at rural, urban and traffic sites in Navarra (North of Spain). Atmos. Res. 2011, 102, 191–205. [Google Scholar] [CrossRef]
- Chen, Y.; Zheng, M.; Edgerton, E.S.; Ke, L.; Sheng, G.; Fu, J. PM2.5 source apportionment in the southeastern U.S.: Spatial and seasonal variations during 2001–2005. J. Geophys. Res. Atmos. 2012, 117. [Google Scholar] [CrossRef]
- Fu, Q.; Zhuang, G.; Li, J.; Huang, K.; Wang, Q.; Zhang, R.; Fu, J.; Lu, T.; Chen, M.; Wang, Q. Source, long-range transport, and characteristics of a heavy dust pollution event in Shanghai. J. Geophys. Res. Atmos. 2010, 115. [Google Scholar] [CrossRef] [Green Version]
- Zhang, R.; Jing, J.; Tao, J.; Hsu, S.-C.; Wang, G.; Cao, J.; Lee, C.S.L.; Zhu, L.; Chen, Z.; Zhao, Y. Chemical characterization and source apportionment of PM2.5 in Beijing: Seasonal perspective. Atmos. Chem. Phys. 2013, 13, 7053–7074. [Google Scholar] [CrossRef]
- Weagle, C.L.; Snider, G.; Li, C.; van Donkelaar, A.; Philip, S.; Bissonnette, P.; Burke, J.; Jackson, J.; Latimer, R.; Stone, E. Global Sources of Fine Particulate Matter: Interpretation of PM2.5 Chemical Composition Observed by SPARTAN using a Global Chemical Transport Model. Environ. Sci. Technol. 2018, 52, 11670–11681. [Google Scholar] [CrossRef]
- Guo, H.; Cheng, T.; Gu, X.; Wang, Y.; Chen, H.; Bao, F.; Shi, S.; Xu, B.; Wang, W.; Zuo, X. Assessment of PM2.5 concentrations and exposure throughout China using ground observations. Sci. Total Environ. 2017, 601, 1024–1030. [Google Scholar] [CrossRef]
- Liu, X.; Zhai, Y.; Zhu, Y.; Liu, Y.; Chen, H.; Li, P.; Peng, C.; Xu, B.; Li, C.; Zeng, G. Mass concentration and health risk assessment of heavy metals in size-segregated airborne particulate matter in Changsha. Sci. Total Environ. 2015, 517, 215–221. [Google Scholar] [CrossRef] [PubMed]
- Deng, X.; Zhang, F.; Rui, W.; Long, F.; Wang, L.; Feng, Z.; Chen, D.; Ding, W. PM2.5-induced oxidative stress triggers autophagy in human lung epithelial A549 cells. Toxicol. In Vitro 2013, 27, 1762–1770. [Google Scholar] [CrossRef] [PubMed]
- Zhang, F.; Wang, Z.W.; Cheng, H.R.; Lv, X.P.; Gong, W.; Wang, X.M.; Zhang, G. Seasonal variations and chemical characteristics of PM(2.5) in Wuhan, central China. Sci. Total Environ. 2015, 518–519, 97–105. [Google Scholar]
- Li, T.; Wang, Y.; Li, W.; Chen, J.; Wang, T.; Wang, W. Concentrations and solubility of trace elements in fine particles at a mountain site, southern China: Regional sources and cloud processing. Atmos. Chem. Phys. 2015, 15. [Google Scholar] [CrossRef]
- Cahill, T.A.; Cliff, S.S.; Perry, K.D.; Jimenez-Cruz, M.; Bench, G.; Grant, P.; Ueda, D.; Shackelford, J.F.; Dunlap, M.; Meier, M. Analysis of Aerosols from the World Trade Center Collapse Site, New York, October 2 to October 30, 2001. Aerosol Sci. Technol. 2004, 38, 165–183. [Google Scholar] [CrossRef] [Green Version]
- Duan, J.; Tan, J. Atmospheric heavy metals and arsenic in China: Situation, sources and control policies. Atmos. Environ. 2013, 74, 93–101. [Google Scholar] [CrossRef]
- Chen, P.; Bi, X.; Zhang, J.; Wu, J.; Feng, Y. Assessment of heavy metal pollution characteristics and human health risk of exposure to ambient PM2.5 in Tianjin, China. Particuology 2015, 20, 104–109. [Google Scholar] [CrossRef]
- Yang, L.X.; Wang, D.C.; Cheng, S.H.; Wang, Z.; Zhou, Y.; Zhou, X.H.; Wang, W.X. Influence of meteorological conditions and particulate matter on visual range impairment in Jinan, China. Sci. Total Environ. 2007, 383, 164–173. [Google Scholar] [CrossRef]
- Gu, J.; Du, S.; Han, D.; Hou, L.; Yi, J.; Xu, J.; Liu, G.; Han, B.; Yang, G.; Bai, Z.P. Major chemical compositions, possible sources, and mass closure analysis of PM2.5 in Jinan, China. Air Qual. Atmos. Health 2014, 7, 251–262. [Google Scholar] [CrossRef]
- Han, L.; Zhou, W.; Pickett, S.T.; Li, W.; Li, L. An optimum city size? The scaling relationship for urban population and fine particulate (PM2.5) concentration. Environ. Pollut. 2016, 208, 96–101. [Google Scholar] [CrossRef]
- Paatero, P. Least squares formulation of robust non-negative factor analysis. Chemom. Intell. Lab. Syst. 1997, 37, 23–35. [Google Scholar] [CrossRef]
- Paatero, P.; Tapper, U. Positive matrix factorization: A non-negative factor model with optimal utilization of error estimates of data values. Environmetrics 1994, 5, 111–126. [Google Scholar] [CrossRef]
- Paatero, P. End User’s Guide to Multilinear Engine Applications; University of Helsinki: Helsinki, Finland, 2007. [Google Scholar]
- United States Environmental Protection Agency. Risk Assessment Guidance for Superfund. Volume I: Human Health Evaluation Manual (Part A); EPA/540/1-89/002; United States Environmental Protection Agency: Washington, DC, USA, 1989.
- Liu, P.; Lei, Y.; Ren, H.; Gao, J.; Xu, H.; Shen, Z.; Zhang, Q.; Zheng, C.; Liu, H.; Zhang, R.; Pan, H. Seasonal Variation and Health Risk Assessment of Heavy Metals in PM2.5 during Winter and Summer over Xi’an, China. Atmosphere 2017, 8, 91. [Google Scholar]
- US EPA. Risk Assessment Guidance for Superfund Volume I: Human Health Evaluation Manual (Part E, Supplemental Guidance for Dermal Risk Assessment); EPA/540/R/99/005. OSWER 9285. 7-02EP PB99-963312; Environmental Protection Agency: Washington, DC, USA, 2004.
- US EPA. Risk Assessment Guidance for Superfund: Volume I: Human Health Evaluation Manual (Part F, Supplmenetal Guidance for Inhalation Risk Assessment); Environmental Protection Agency: Washington, DC, USA, 2009.
- US EPA. Regional Screening Levels (RSLs)—Generic Tables. Available online: http://www.epa.gov/region9/superfund/prg/index.html (accessed on 1 January 2019).
- Xu, C.; Wei, M.; Chen, J.; Zhu, C.; Li, J.; Xu, X.; Wang, W.; Zhang, Q.; Ding, A.; Kan, H. Profile of inhalable bacteria in PM2.5 at Mt. Tai, China: Abundance, community, and influence of air mass trajectories. Ecotoxicol. Environ. Saf. 2019, 168, 110–119. [Google Scholar] [CrossRef] [PubMed]
- Gao, Y.; Ji, H. Microscopic morphology and seasonal variation of health effect arising from heavy metals in PM2.5 and PM10: One-year measurement in a densely populated area of urban Beijing. Atmos. Res. 2018, 212, 213–226. [Google Scholar] [CrossRef]
- Lai, S.; Zhao, Y.; Ding, A.; Zhang, Y.; Song, T.; Zheng, J.; Ho, K.F.; Lee, S.-C.; Zhong, L. Characterization of PM2.5 and the major chemical components during a 1-year campaign in rural Guangzhou, Southern China. Atmos. Res. 2016, 167, 208–215. [Google Scholar] [CrossRef]
- Liu, C.; Henderson, B.H.; Wang, D.; Yang, X.; Peng, Z.-R. A land use regression application into assessing spatial variation of intra-urban fine particulate matter (PM2.5) and nitrogen dioxide (NO2) concentrations in City of Shanghai, China. Sci. Total Environ. 2016, 565, 607–615. [Google Scholar] [CrossRef]
- Qie, G.; Wang, Y.; Wu, C.; Mao, H.; Zhang, P.; Li, T.; Li, Y.; Talbot, R.; Hou, C.; Yue, T. Distribution and sources of particulate mercury and other trace elements in PM2.5 and PM10 atop Mount Tai, China. J. Environ. Manag. 2018, 215, 195–205. [Google Scholar] [CrossRef]
- Ming, L.; Jin, L.; Li, J.; Fu, P.; Yang, W.; Liu, D.; Zhang, G.; Wang, Z.; Li, X. PM2.5 in the Yangtze River Delta, China: Chemical compositions, seasonal variations, and regional pollution events. Environ. Pollut. 2017, 223, 200–212. [Google Scholar] [CrossRef]
- Lee, B.-K.; Hieu, N.T. Seasonal variation and sources of heavy metals in atmospheric aerosols in a residential area of Ulsan, Korea. Aerosol Air Qual. Res. 2011, 11, 679–688. [Google Scholar] [CrossRef]
- Khan, M.F.; Hirano, K.; Masunaga, S. Quantifying the sources of hazardous elements of suspended particulate matter aerosol collected in Yokohama, Japan. Atmos. Environ. 2010, 44, 2646–2657. [Google Scholar] [CrossRef]
- Gao, J.; Peng, X.; Chen, G.; Xu, J.; Shi, G.-L.; Zhang, Y.-C.; Feng, Y.-C. Insights into the chemical characterization and sources of PM2.5 in Beijing at a 1-h time resolution. Sci. Total Environ. 2016, 542, 162–171. [Google Scholar] [CrossRef] [PubMed]
- Das, R.; Khezri, B.; Srivastava, B.; Datta, S.; Sikdar, P.K.; Webster, R.D.; Wang, X. Trace element composition of PM2.5 and PM10 from Kolkata—A heavily polluted Indian metropolis. Atmos. Pollut. Res. 2015, 6, 742–750. [Google Scholar] [CrossRef]
- Xie, R.K.; Seip, H.M.; Wibetoe, G.; Nori, S.; Mcleod, C.W. Heavy coal combustion as the dominant source of particulate pollution in Taiyuan, China, corroborated by high concentrations of arsenic and selenium in PM10. Sci. Total Environ. 2006, 370, 409–415. [Google Scholar] [CrossRef]
- Yang, J.Y.; Jin-Yong, K.; Ji-Young, J.; Gun-Woo, L.; Soo-Hwan, K.; Dong-Chun, S.; Young-Wook, L. Exposure and Toxicity Assessment of Ultrafine Particles from Nearby Traffic in Urban Air in Seoul, Korea. Environmental Health & Toxicology 2013, 28, e2013007. [Google Scholar]
- Kfoury, A.; Ledoux, F.; Roche, C.; Delmaire, G.; Roussel, G.; Courcot, D. PM2.5 source apportionment in a French urban coastal site under steelworks emission influences using constrained non-negative matrix factorization receptor model. J. Environ. Sci. 2016, 40, 114–128. [Google Scholar] [CrossRef]
- Dall’Osto, M.; Querol, X.; Amato, F.; Karanasiou, A. Hourly elemental concentrations in PM2.5 aerosols sampled simultaneously at urban background and road site during SAPUSS—Diurnal variations and PMF receptor modelling. Atmos. Chem. Phys. 2013, 13, 4375–4392. [Google Scholar] [CrossRef]
- Wang, X.; Bi, X.; Sheng, G.; Fu, J. Chemical Composition and Sources of PM10 and PM2.5 Aerosols in Guangzhou, China. Environ. Monit. Assess. 2006, 119, 425–439. [Google Scholar] [CrossRef]
- Zereini, F.; Alt, F.; Messerschmidt, J.; Wiseman, C.; Feldmann, I.; Von, B.A.; Müller, J.; Liebl, K.; Püttmann, W. Concentration and distribution of heavy metals in urban airborne particulate matter in Frankfurt am Main, Germany. Environ. Sci. Technol. 2005, 39, 2983–2989. [Google Scholar] [CrossRef]
- Sternbeck, J.; Sjödin, Å.; Andréasson, K. Metal emissions from road traffic and the influence of resuspension—Results from two tunnel studies. Atmos. Environ. 2002, 36, 4735–4744. [Google Scholar] [CrossRef]
- Li, Z.; Hopke, P.K.; Husain, L.; Qureshi, S.; Dutkiewicz, V.A.; Schwab, J.J.; Drewnick, F.; Demerjian, K.L. Sources of fine particle composition in New York city. Atmos. Environ. 2004, 38, 6521–6529. [Google Scholar] [CrossRef]
- Wang, X.; Bi, X.; Sheng, G.; Fu, J. Hospital indoor PM10/PM2.5 and associated trace elements in Guangzhou, China. Sci. Total Environ. 2006, 366, 124–135. [Google Scholar] [CrossRef] [PubMed]
- Liu, B.; Wu, J.; Zhang, J.; Wang, L.; Yang, J.; Liang, D.; Dai, Q.; Bi, X.; Feng, Y.; Zhang, Y. Characterization and source apportionment of PM2.5 based on error estimation from EPA PMF 5.0 model at a medium city in China. Environ. Pollut. 2017, 222, 10–22. [Google Scholar] [CrossRef] [PubMed]
- Watson, J.G.; Chow, J.C. Source characterization of major emission sources in the imperial and Mexicali Valleys along the US/Mexico border. Sci. Total Environ. 2001, 276, 33–47. [Google Scholar] [CrossRef]
- Megido, L.; Suárez-Peña, B.; Negral, L.; Castrillón, L.; Fernández-Nava, Y. Suburban air quality: Human health hazard assessment of potentially toxic elements in PM10. Chemosphere 2017, 177, 284–291. [Google Scholar] [CrossRef] [PubMed]
- Hu, X.; Zhang, Y.; Ding, Z.; Wang, T.; Lian, H.; Sun, Y.; Wu, J. Bioaccessibility and health risk of arsenic and heavy metals (Cd, Co, Cr, Cu, Ni, Pb, Zn and Mn) in TSP and PM2.5 in Nanjing, China. Atmos. Environ. 2012, 57, 146–152. [Google Scholar] [CrossRef]
- Liu, P.; Wang, X.; Fan, J.; Xiao, W.; Wang, Y. Effects of air pollution on hospital emergency room visits for respiratory diseases: Urban-suburban differences in eastern China. Int. J. Environ. Res. Public Health 2016, 13, 341. [Google Scholar] [CrossRef]


| Elements | HQing | HQinh | ||
|---|---|---|---|---|
| Adults | Children | Adults | Children | |
| Cr | 0.393 | 0.831 | 0.359 | 0.540 |
| Mn | 0.015 | 0.315 | 1.10 | 1.65 |
| Ni | 0.062 | 0.131 | 0.406 | 0.610 |
| Cu | 0.234 | 0.496 | ND | ND |
| Zn | 0.063 | 0.132 | ND | ND |
| As | 2.59 | 5.49 | 1.19 | 1.79 |
| Cd | 0.166 | 0.352 | 0.069 | 0.100 |
| Pb | 1.65 | 3.49 | ND | ND |
| Elements | CRing | CRinh | ||
|---|---|---|---|---|
| Adults | Children | Adults | Children | |
| Cr | 1.94 × 10⁻⁴ | 4.27 × 10⁻⁴ | 8.62 × 10⁻⁵ | 2.15 × 10⁻⁵ |
| Ni | 3.79 × 10⁻⁴ | 8.37 × 10⁻⁴ | 3.34 × 10⁻⁶ | 8.36 × 10⁻⁷ |
| As | 3.83 × 10⁻⁴ | 8.46 × 10⁻⁴ | 2.64 × 10⁻⁵ | 6.60 × 10⁻⁶ |
| Cd | ND | ND | 2.14 × 10⁻⁶ | 5.34 × 10⁻⁷ |
| Pb | ND | ND | 7.17 × 10⁻⁷ | 1.79 × 10⁻⁷ |
| Sources | Non-Carcinogenic Risk | Carcinogenic Risk | ||
|---|---|---|---|---|
| HQing | HQinh | CRing | CRinh | |
| Coal combustion | 2.46 | 1.07 | 3.31 × 10⁻⁴ | 3.30 × 10⁻⁵ |
| Smelting industry | 1.18 | 0.77 | 1.72E × 10−4 | 1.36 × 10⁻⁵ |
| Vehicles | 0.58 | 0.69 | 3.25E × 10−4 | 6.54 × 10⁻⁵ |
| Soil dust | 0.95 | 0.60 | 1.28 × 10⁻⁴ | 6.78 × 10⁻⁶ |
© 2019 by the authors. Licensee MDPI, Basel, Switzerland. This article is an open access article distributed under the terms and conditions of the Creative Commons Attribution (CC BY) license (http://creativecommons.org/licenses/by/4.0/).
Share and Cite
Du, L.; Wang, Y.; Wu, Z.; Hou, C.; Mao, H.; Li, T.; Nie, X. PM2.5-Bound Toxic Elements in an Urban City in East China: Concentrations, Sources, and Health Risks. Int. J. Environ. Res. Public Health 2019, 16, 164. https://0-doi-org.brum.beds.ac.uk/10.3390/ijerph16010164
Du L, Wang Y, Wu Z, Hou C, Mao H, Li T, Nie X. PM2.5-Bound Toxic Elements in an Urban City in East China: Concentrations, Sources, and Health Risks. International Journal of Environmental Research and Public Health. 2019; 16(1):164. https://0-doi-org.brum.beds.ac.uk/10.3390/ijerph16010164
Chicago/Turabian StyleDu, Lili, Yan Wang, Zhicheng Wu, Chenxiao Hou, Huiting Mao, Tao Li, and Xiaoling Nie. 2019. "PM2.5-Bound Toxic Elements in an Urban City in East China: Concentrations, Sources, and Health Risks" International Journal of Environmental Research and Public Health 16, no. 1: 164. https://0-doi-org.brum.beds.ac.uk/10.3390/ijerph16010164