Article

Association between Mortality and Short-Term Exposure to Particles, Ozone and Nitrogen Dioxide in Stockholm, Sweden

by
Henrik Olstrup
1,*,
Christer Johansson
1,2,
Bertil Forsberg
3 and
Christofer Åström
3
1
Atmospheric Science Unit, Department of Environmental Science and Analytical Chemistry, Stockholm University, 11418 Stockholm, Sweden
2
Environment and Health Administration, SLB, Box 8136, 104 20 Stockholm, Sweden
3
Section of Sustainable Health, Department of Public Health and Clinical Medicine, Umeå University, 90187 Umeå, Sweden
*
Author to whom correspondence should be addressed.
Int. J. Environ. Res. Public Health 2019, 16(6), 1028; https://0-doi-org.brum.beds.ac.uk/10.3390/ijerph16061028
Submission received: 18 February 2019 / Revised: 19 March 2019 / Accepted: 19 March 2019 / Published: 21 March 2019
(This article belongs to the Special Issue Ultrafine Particles Exposure and Health)

Abstract

:
In this study, the effects on daily mortality in Stockholm associated with short-term exposure to ultrafine particles (measured as number of particles with a diameter larger than 4 nm, PNC4), black carbon (BC) and coarse particles (PM2.5–10) have been compared with the effects from more common traffic-pollution indicators (PM10, PM2.5 and NO2) and O3 during the period 2000–2016. Air pollution exposure was estimated from measurements at a 20 m high building in central Stockholm. The associations between daily mortality lagged up to two days (lag 02) and the different air pollutants were modelled by using Poisson regression. The pollutants with the strongest indications of an independent effect on daily mortality were O3, PM2.5–10 and PM10. In the single-pollutant model, an interquartile range (IQR) increase in O3 was associated with an increase in daily mortality of 2.0% (95% CI: 1.1–3.0) for lag 01 and 1.9% (95% CI: 1.0–2.9) for lag 02. An IQR increase in PM2.5–10 was associated with an increase in daily mortality of 0.8% (95% CI: 0.1–1.5) for lag 01 and 1.1% (95% CI: 0.4–1.8) for lag 02. PM10 was associated with a significant increase only at lag 02, with 0.8% (95% CI: 0.08–1.4) increase in daily mortality associated with an IQR increase in the concentration. NO2 exhibits negative associations with mortality. The significant excess risk associated with O3 remained significant in two-pollutant models after adjustments for PM2.5–10, BC and NO2. The significant excess risk associated with PM2.5–10 remained significant in a two-pollutant model after adjustment for NO2. The significantly negative associations for NO2 remained significant in two-pollutant models after adjustments for PM2.5–10, O3 and BC. A potential reason for these findings, where statistically significant excess risks were found for O3, PM2.5–10 and PM10, but not for NO2, PM2.5, PNC4 and BC, is behavioral factors that lead to misclassification in the exposure. The concentrations of O3 and PM2.5–10 are in general highest during sunny and dry days during the spring, when exposure to outdoor air tend to increase, while the opposite applies to NO2, PNC4 and BC, with the highest concentrations during the short winter days with cold weather, when people are less exposed to outdoor air.

1. Introduction

For PM10, PM2.5, NO2 and O3, the short-term health effects in terms of increased daily mortality have been investigated in many studies. Results from original studies have also been combined in meta-analyzes. For NO2, a significant association between short-term exposure and mortality, based on 60 studies from different parts of the world, was described in Mills et al. [1]. In this study, two-pollutant models showed that the association between daily mortality and exposure to NO2 was largely independent of PM mass. Bell et al. [2] performed a meta-analysis of the short-term health effects related to exposure to O3, based on 144 effect estimates from 39 time-series studies from different parts of the world, providing evidence of an association between O3 exposure and daily mortality. A systematic review and a meta-analysis of the short-term health effects related to PM2.5 and PM10 in the Chinese population was performed by Lu et al. [3]. In this study, the excess risks of non-accidental mortality, cardiovascular mortality and respiratory mortality exhibited statistically significant (95% CI) risk increases for exposure to both PM2.5 and PM10.
In contrast to the above mentioned air pollutants, when considering the health effects associated with exposure to ultrafine particles (UFP), BC and coarse particles, there are relatively few epidemiological studies that have investigated the short-term effects on daily mortality. In a meta-analysis by Atkinson et al. [4], the majority of the associations between short-term exposure to PNC and mortality were positive but non-significant. In this meta-analysis, the included studies used different size-distributions and modes, varying in the range of 3 nm to 0.49 μm [4]. In Samoli et al. [5], the daily mortality in London associated with exposure to an IQR increase of four different size-distributions of ultrafine particles (diameter < 0.6 μm) showed no positive significant associations. The UFIREG study from Central Europe [6] found positive but non-significant associations between short-term respiratory mortality and exposure to UFP (20–100 nm). Also the UF & Health study [7], including Nordic, Central European and Mediterranean cities, found weak (non-significant) evidence of an association between UFP (an increase in 10,000 particles cm−3) and total and cause-specific daily mortality. In Chen et al. [8], pooled associations between UFP (particle number count in the ultrafine range (≤100 nm), or total particle number count ≤3000 nm, as a proxy for UFP) and total and cardiovascular mortality were overall positive, and generally stronger at high compared to low air temperatures. On days with high air temperatures (>75th percentile), an increase in 10,000 particles cm−3 was associated with a significant increase in cardiovascular mortality [8]. A study including three Spanish cities found positive but non-significant associations between primary UFP and total daily mortality in Barcelona and Tenerife, while in Huelva, an association between total daily mortality and secondary UFP was found [9]. In the Ruhr Area in Germany, size-specific PNC (PNC<100 and PNC100–750) was for some specific lags significantly associated with daily mortality, and with the strongest positive associations between PNC100–750 and natural daily mortality [10]. To sum up, research has not been able to conclusively establish a link between short-term UFP exposure and daily mortality. These uncertain results might be attributed to the different origins of UFP in the cities involved in the studies, or even to the different origin of UFP for different days in a city [11].
For particles in the coarse fraction (PM2.5–10), the health effects are less investigated in comparison with both PM2.5 and PM10 and UFP. Particles in the coarse fraction (2.5–10 µm in diameter) are mainly formed by mechanical grinding and resuspension of solid materials. In the cities, these particles can consist of both crustal and organic materials from the asphalt, rubber from tires and metals from studded tires and brakes. The short-term effects on mortality associated with exposure to PM2.5–10 have been analyzed in a review study from 2005 [12]. Some of the studies that were analyzed showed statistically significant associations between short-term mortality effects and a 10 µg m−3 increase in PM2.5–10. The effects were largest in studies from arid regions, where the PM2.5–10 concentrations were relatively high. However, for long-term studies on mortality effects, no associations were found for PM2.5–10. In another systemic review and meta-analysis from 2014 [13], focusing on the health effects associated with exposure to PM2.5–10, significant associations between short-term exposure to PM2.5–10 and mortality were found, with more robust relationships for respiratory compared to cardiovascular endpoints. The associations were highly heterogeneous, but with differences related to geographic region and the average PM2.5–10 concentrations. After adjustments for publication bias and PM2.5 exposure, the effects associated with PM2.5–10 became weaker and less precise, but the positive effects remained for short-term exposure. For long-term exposure associated with PM2.5–10, evidence of increased mortality was found, but after adjustment for PM2.5 exposure, these associations were non-significant [13].
The purpose of this study was to compare the excess risks of daily mortality associated with potentially relevant traffic pollution indicators, namely UFP (PNC4), BC and PM2.5–10, and compare these results with the excess risks of the more established indicators, namely PM10, PM2.5 and NO2, as well as with O3. We have examined the associations between daily mortality and exposure to NO2, O3, PM2.5, PM10, PM2.5–10, PNC4 and BC, based on data from an urban background measuring station in Stockholm during the period 2000–2016.

2. Materials and Methods

This study covers the city of Stockholm with a population of approximately 0.8–0.9 million people over the period 2000–2016. Population data were obtained from the Swedish Central Bureau of Statistics. Natural cause mortality data were obtained from the National Cause of Death Register. Natural cause mortality was defined on the basis of the underlying cause of death (ICD-10: A00–R99), and these data included the daily number of deaths from natural causes occurring among the registered population.
Air pollution exposure was estimated from central measurements made on the roof-top of a 20 m high building in central Stockholm. The monitoring station is part of the city’s regulatory air pollution control network, and equipped with reference (or equivalent) instruments for regulated pollutants according to the EU air quality directive for NO2, O3, PM2.5 and PM10 (Table A1). The O3 measurements are based on daily maximum 8-h mean. In addition, it includes measurements of unregulated black carbon (BC), total particle number concentrations (PNC4), and the coarse fraction (PM2.5–10), estimated by subtracting PM2.5 from PM10. Different instruments have been used to measure BC. However, when the hourly mean values of two different BC measurements techniques in Stockholm were compared in 2006, the R-values were 0.87 and 0.95, respectively, at the two measurement sites [14]. For the measurements of ultrafine particles (PNC4 and PNC7), an instrument was used that registered all particles larger than 7 nm (PNC7) during the period from May 2001 until November 2013. From March 2008 to the end of the period (December 2016), another instrument was used to record particles larger than 4 nm (PNC4). By applying a linear regression between PNC4 and PNC7 during overlapping periods, measured PNC7 was used to construct a more complete time-series of PNC4. The mean value of the measured concentrations of PNC4 was 8650 cm−3, with a root mean square error (RMSE) of 1355 cm−3 in relation to the modeled PNC4 values, based on the linear regression with PNC7 (see Figure A2 in Appendix A). Several plots illustrating the daily and monthly mean concentrations during 2000–2016, and the correlations between different pairs of the analyzed air pollutants, have been performed by using the “Openair” package [15].
The associations between different air pollutants and the daily mortality were modelled by using a quasi-Poisson regression model with a logistic link function. The model estimated the effect of an IQR increase of air pollutants on daily mortality for lag 01 and 02, while controlling for other time-varying factors by assuming a linear additive effect on a logarithmic scale:
Log(Yi) = Intercept + f(APi) + f(Wi) + DOWi + (long-term trend)
where APi is the concentration of a specific or a combination of air pollutants on day i, Wi is variables controlling for the weather on day i, more specifically maximum temperature and snowfall, DOWi is the day of week, and the long-time trend is a smooth function varying over time to capture any long-term and seasonal patterns in mortality. The smooth function used was a penalized regression spline restricted to 5 d.f. (degrees of freedom) per year. Snowfall has been included, since it is a risk factor for daily mortality, as described in Auger et al. (2017) [16]. All pollutants were modelled by assuming a linear relationship with daily mortality. Air pollutants were first modelled in single-pollutant models (Figure 4), and traffic-related pollutants with effect estimates with a p-value smaller than 0.2 were included in multi-pollutant models together with O3 (Figures 5–7). We also investigated the correlation matrix (Figure 3), and included pollutants that were negatively correlated, or positively correlated, but with opposite effects in the single-pollutant model (Figure 4).
Temperature were adjusted for by using two different smooth functions corresponding to the different lag-windows of 0–2 and 3–10. The model allowed for the use of 4 d.f. for each function. In the sensitivity analysis, we added models allowing for 8 d.f. in the smooth temperature functions as well as adding another temperature variable with temperatures from lag 11–20. In addition, we used an indicator variable to identify if the modelled PNC4 data (see Figure A2) generated different risk estimates in comparison with the measured data.

3. Results

3.1. Descriptive Data

The descriptive data are presented in Table 1. An overview of the temporal variation of the daily mean concentrations of air pollutants and daily mortality in Stockholm is given in Figure A1 in Appendix A. For most pollutants, data capture is high, >80% (Table 1); the exceptions are BC (53%) and PNC (70%).
There were also pronounced seasonal variations in the concentrations, as shown in Figure 1 and Figure 2. NO2, PNC and BC exhibited the highest concentrations during winter (October to March) and lowest in summer (June–July), whereas PM10, PM2.5, PM2.5–10 and O3 exhibited peak concentrations during late winter to early summer (March–May).
Figure 3 shows the correlations between all pairs of data for the measured air pollutants. High correlations (R > 0.6) were found between pairs of NO2, PNC7, PNC4 and PNC, reflecting their common origins. Likewise the pairs PM10-PM2.5, PM10-PM2.5–10 and BC-PM2.5 showed high correlations. O3 showed negative correlations with NO2, PNC and BC. Note that the R-values in Figure 3 are given in percent.

3.2. The Calculated Excess Risks

Figure 4, Figure 5, Figure 6 and Figure 7 show the calculated excess risks for daily mortality associated with an IQR increase of the measured pollutants in Stockholm during 2000–2016. The IQR values for the measured pollutants are presented in Table 1. Figure 4 shows single-pollutant models, where the excess risks for lag 01 and 02 associated with an IQR increase of the different pollutants are presented. Lag 01 and 02 represent a lagging effect of the same and the previous day, and the same and the previous two days, respectively. Figure 5, Figure 6 and Figure 7 show multi-pollutant models, where the effects of the modeled pollutants are adjusted for each other. All multi-pollutant models are based on lag 02.
In the single-pollutant model (Figure 4), O3 exhibits significant excess risks of 2.0% (95% CI: 1.1–3.0) for lag 01 and 1.9% (95% CI: 1.0–2.9) for lag 02 associated with an IQR increase in concentration. PM2.5–10 exhibits significant excess risks of 0.8% (95% CI: 0.1–1.5) for lag 01 and 1.1% (95% CI: 0.4–1.8) for lag 02 associated with an IQR increase in concentration. PM10 exhibits a significant excess risk of 0.8% (95% CI: 0.08–1.4) for lag 02 associated with an IQR increase in concentration. NO2 exhibits negative risks of −1.6% (95% CI: −0.6–−2.7) for lag 01 and −1.5% (95% CI: −0.5–−2.5) for lag 02 associated with an IQR increase in concentration. The other risk estimates in the single-pollutant model are not statistically significant.
In the multi-pollutant models (Figure 5, Figure 6 and Figure 7), the risk estimates in the single-pollutant model have been adjusted for the effects of some other pollutants. Pollutants that were negatively correlated (see Figure 3), or positively correlated, but with opposite effects in the single-pollutant model (Figure 4) have been used in the multi-pollutant models. For O3, the significant effect for lag02 in the single-pollutant model remained significant in two-pollutant models after adjustments for PM2.5–10, BC and NO2 (Figure 4, Figure 5, Figure 6 and Figure 7). For PM2.5–10, the significant effect for lag02 in the single-pollutant model remained significant in the two-pollutant after adjustment for NO2, and also after adjustments for both O3 and NO2 together (Figure 5). The significantly negative effect associated with NO2 for lag02 in the single-pollutant model remained significant in two-pollutant models after adjustments for PM2.5–10, BC and O3 (Figure 5, Figure 6 and Figure 7). The significantly negative effect associated with NO2 also remained significant after adjustment for both PM2.5–10 and O3 together (Figure 7). Modelling the effect of PNC4, while adjusting for O3, increased the effect estimate by 23%, while remaining non-significant. The estimated effect of PM2.5 was to some degree affected by the introduction of NO2 in the model, where the negative, non-significant estimate for PM2.5 (p-value: 0.95) changed to a small positive effect, while remaining non-significant (p-value: 0.65).

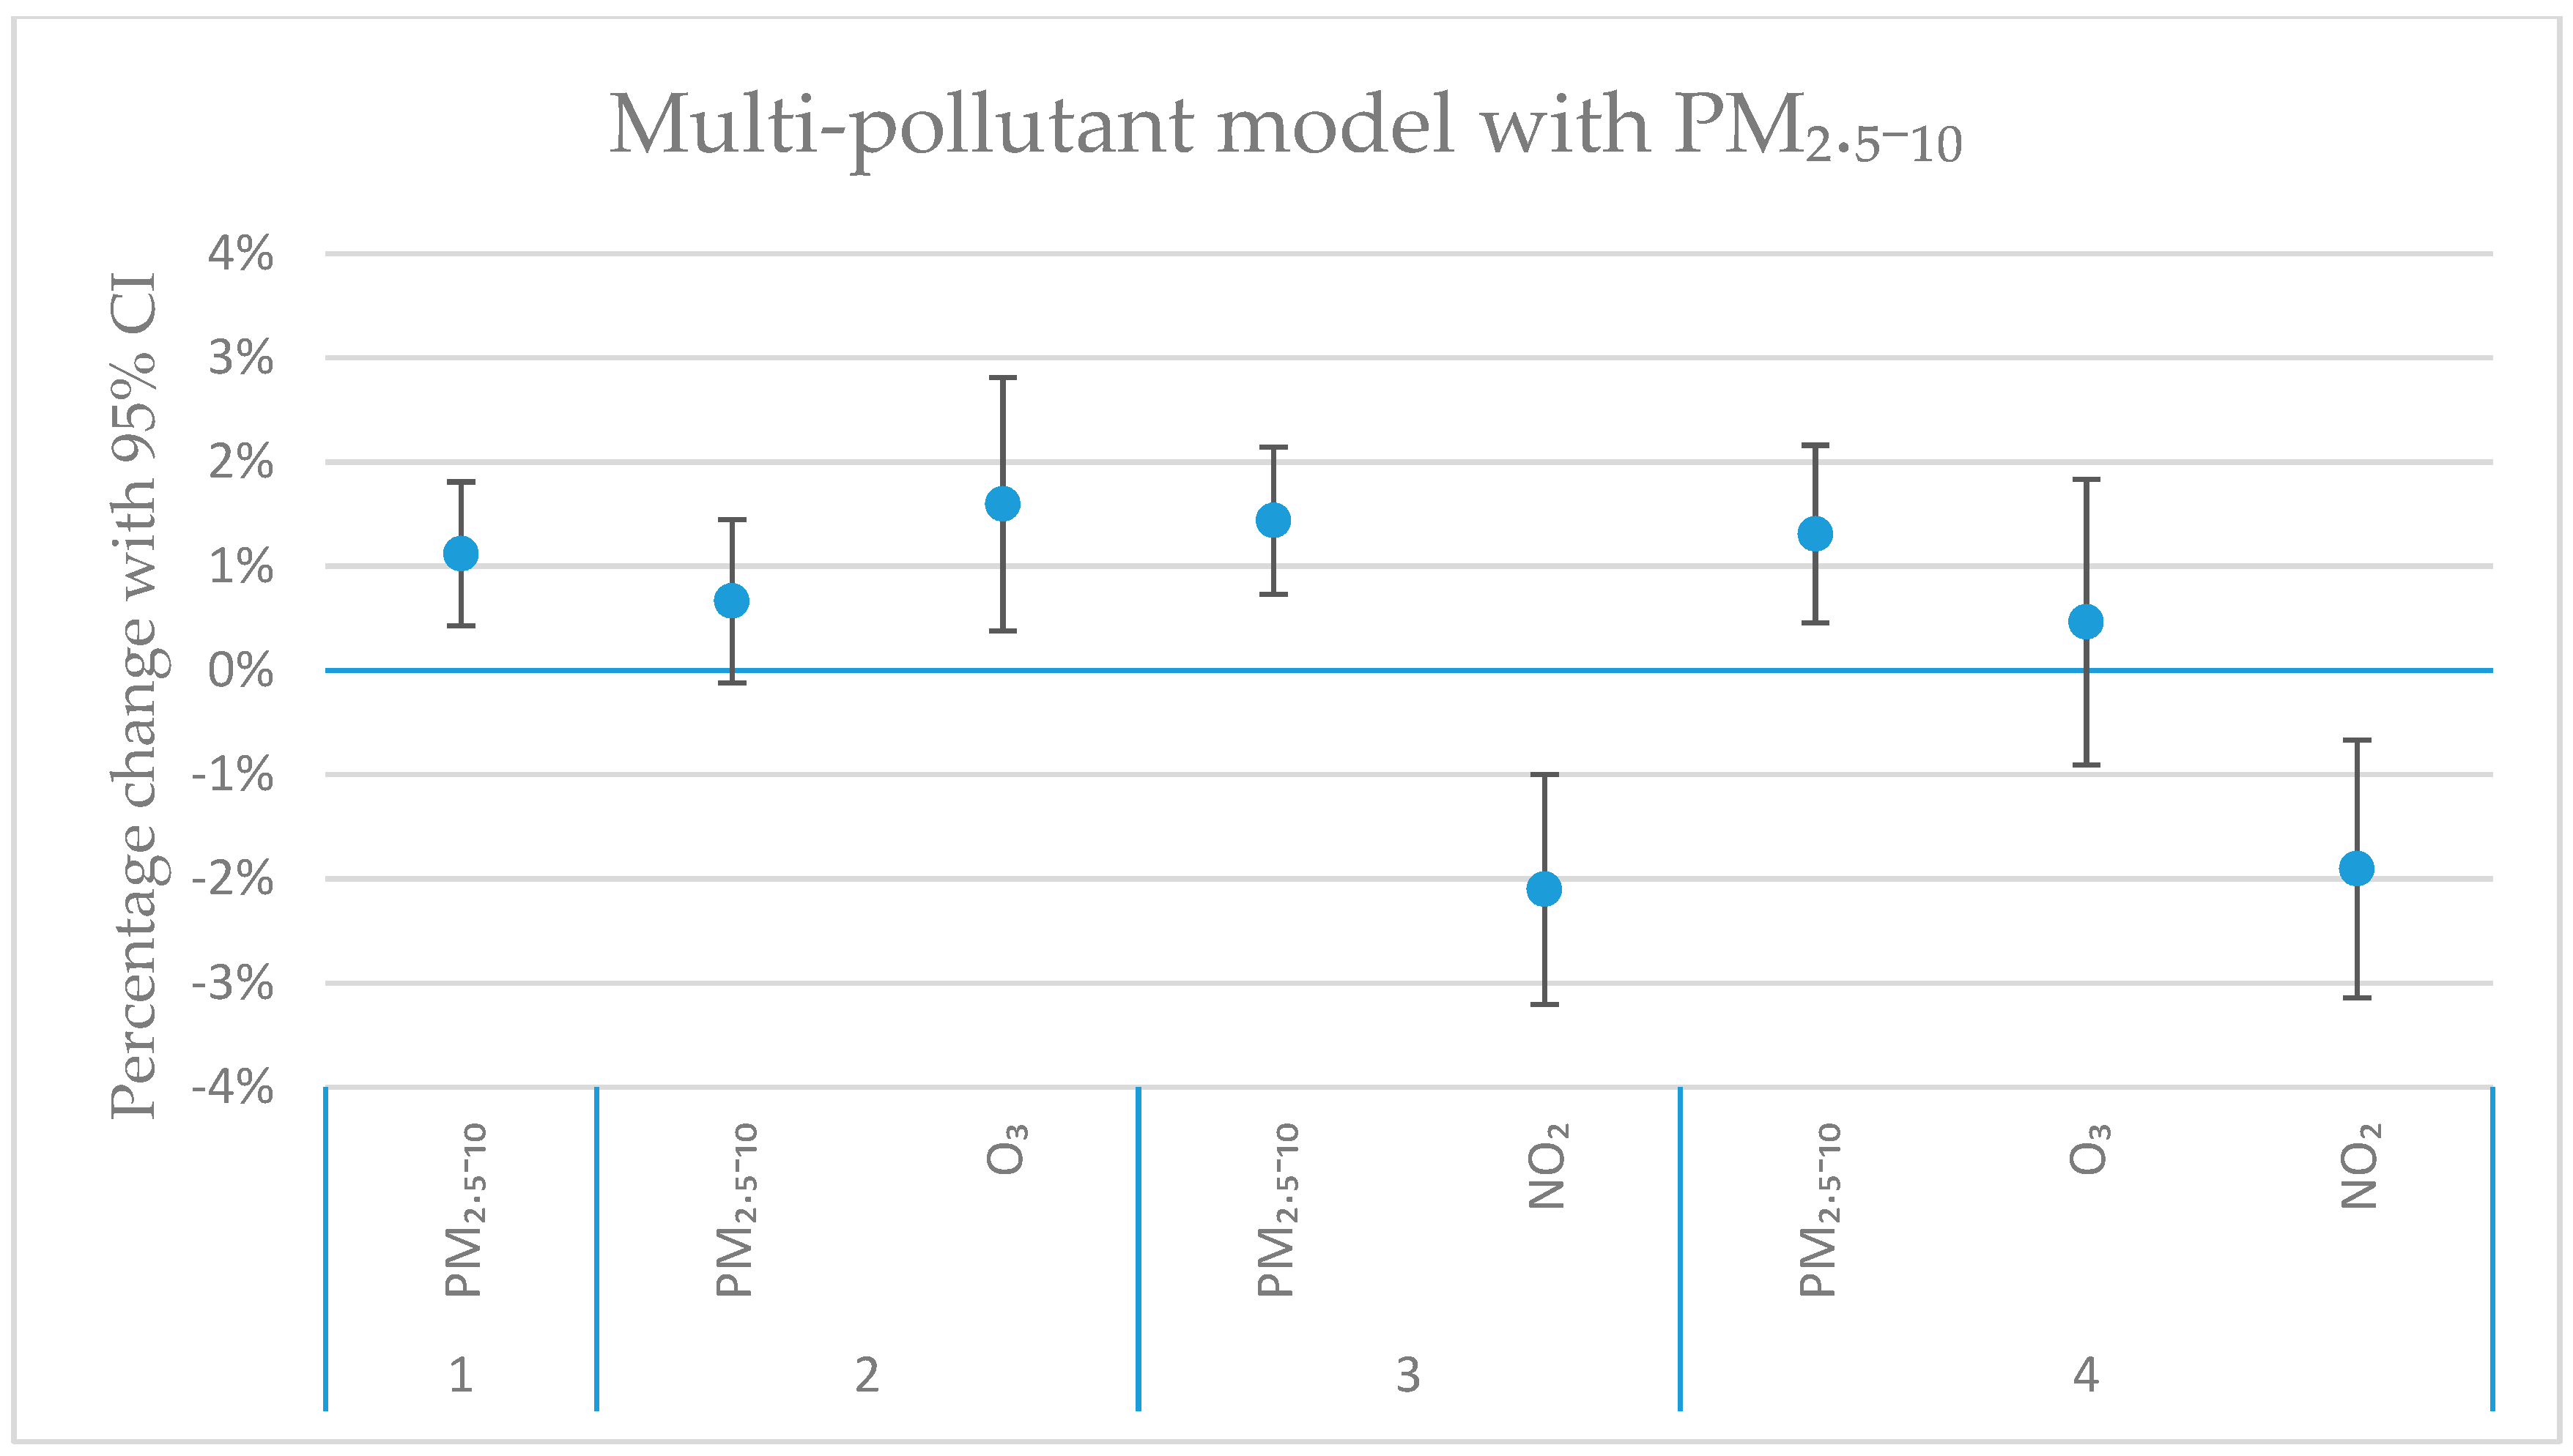
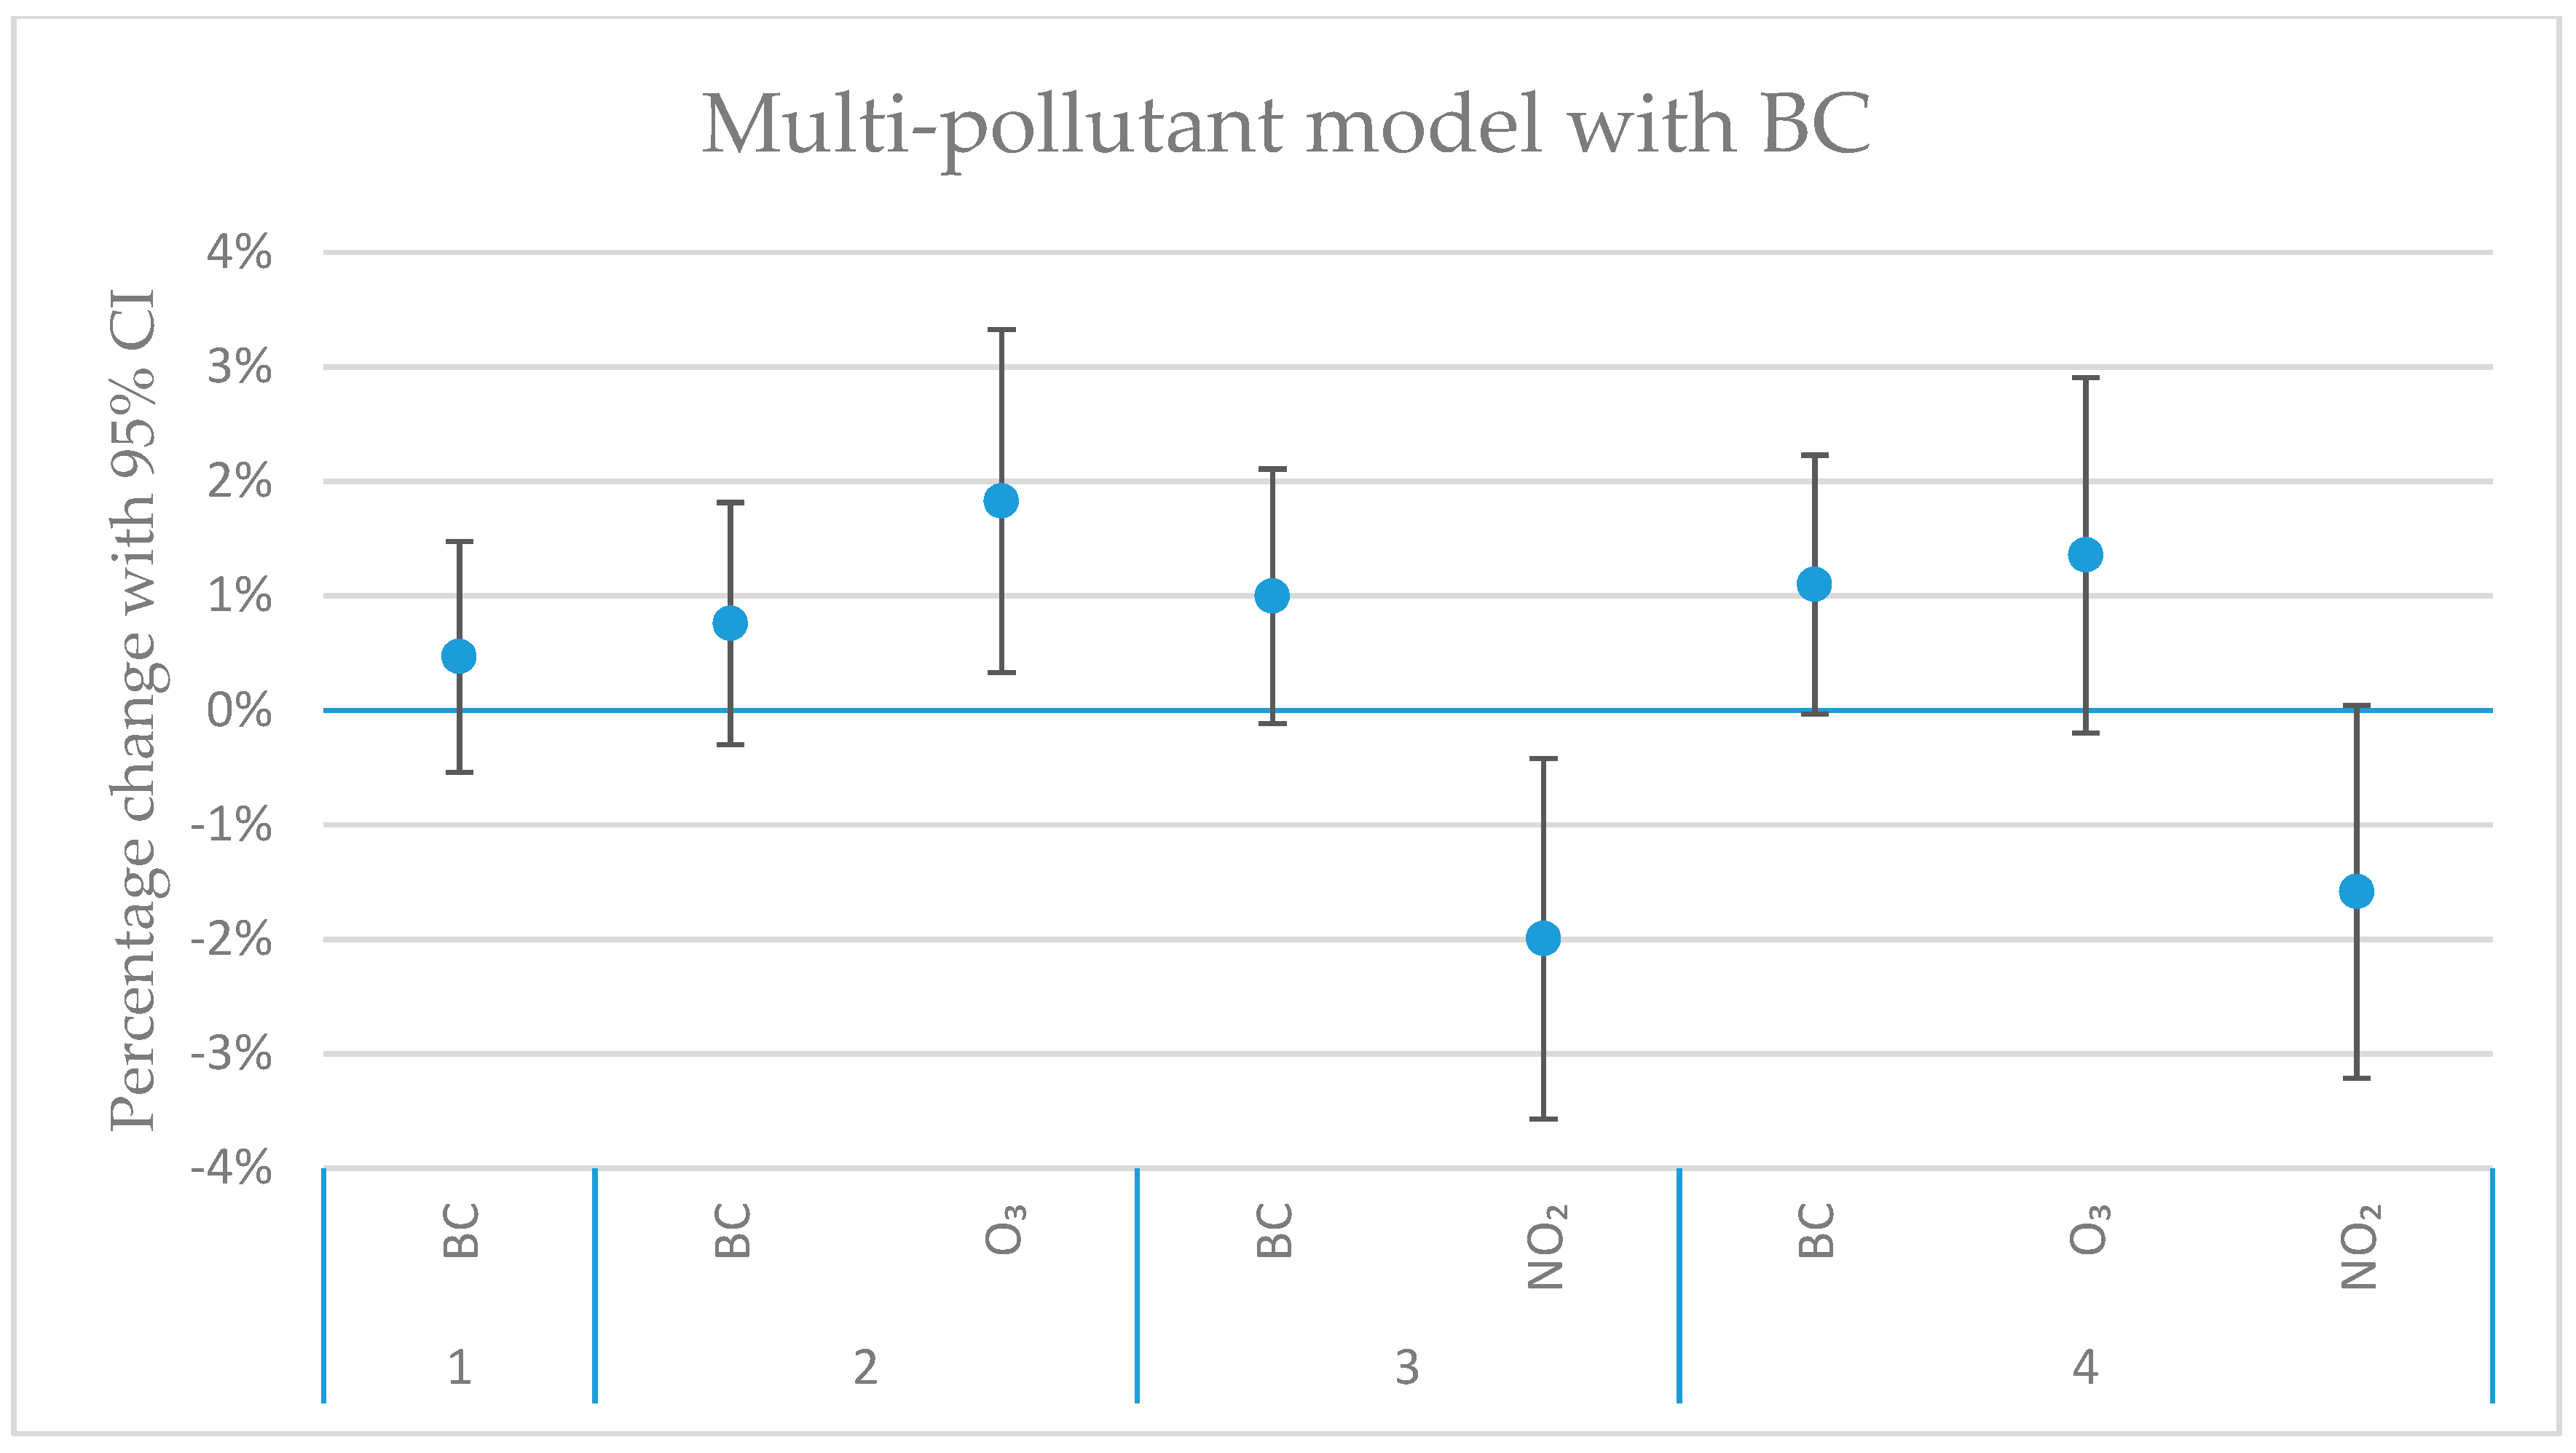
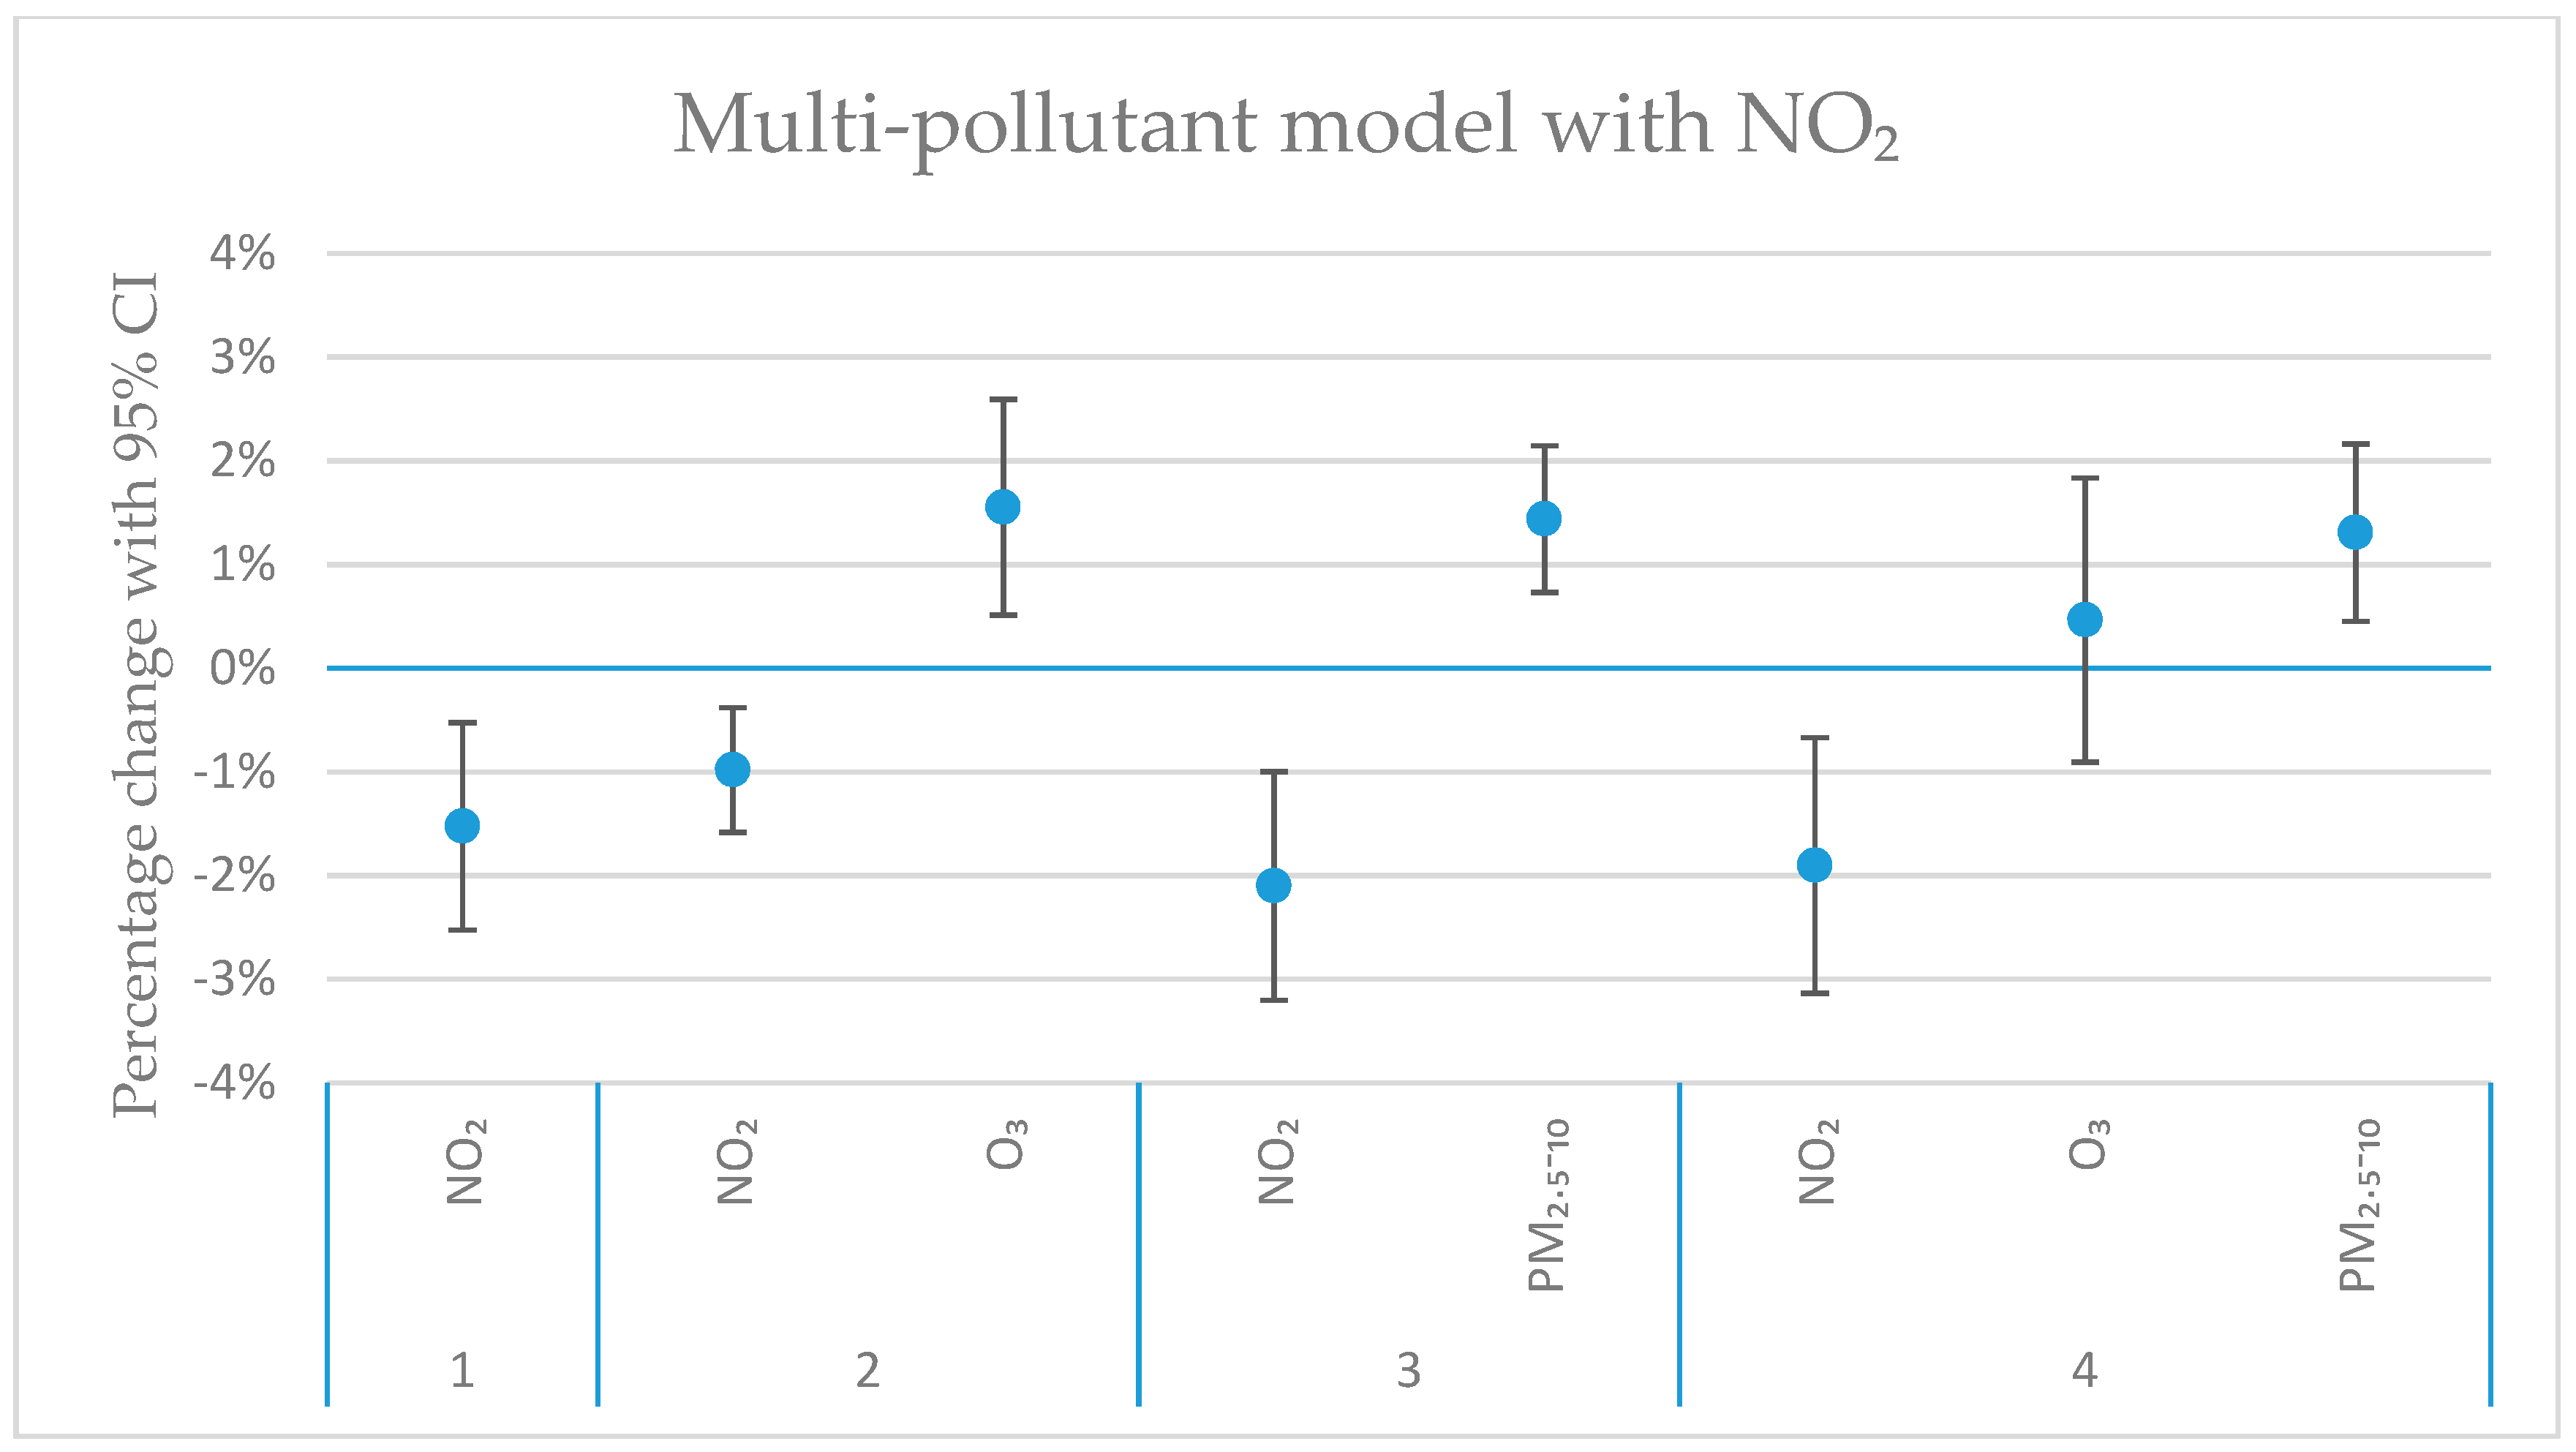
3.3. Sensitivity Analysis

In the sensitivity analysis, we allowed for more flexible temperature associations. Increasing the number of d.f. allowed in the temperature function lowered the p-values for mainly PM10 and PM2.5. However, adding a temperature variable, adjusting for a longer time-frame of 11–20 days prior, rendered the PM variables insignificant. The other air pollution variables were essentially unaffected by inclusion of a longer temperature adjustment. The reasons for these patterns are unknown, but resuspension of road dust depends on complex changes in weather conditions, e.g., from periods with rain or snow to dry weather, which could also affect mortality.
The investigation of the modelled PNC4 data (Figure A2) found that there was no difference between the estimates generated by the modelled and the measured data. Consequently, the lack of statistically significant excess risks associated with PNC4 is not caused by the use of the modelled PNC4 data, based on the linear regression with PNC7 (Figure A2).

4. Discussion

4.1. Local and Non-Local Sources

This study includes pollutants that are relatively good indicators of different local and non-local sources. NO2, PNC are all mainly influenced by local vehicle exhaust emissions [17,18], and are therefore highly correlated, as shown in Figure 3. BC is also emitted mainly from local vehicle exhaust, but is also influenced by long-range transport [14], making the correlation with NO2 and PNC somewhat smaller. The coarse particle fraction, PM2.5–10, is mainly due to local road-dust suspension [17], and since PM10 largely consists of coarse particles, it is highly correlated with PM2.5–10. PM2.5 is dominated by long-range transported secondary particles, and shows low correlations with pollutants like NO2, PNC and PM2.5–10, mainly influenced by local sources. However, PM2.5 shows higher correlations with BC and PM10 due to some influence of long-range transport on these compounds. And finally, the O3 concentrations in the city depend mainly on the long-distance transport, but are to some degree also influenced by the chemical reactions involving nitrogen monoxide (NO). The O3 concentrations are therefore reduced when primary exhaust concentrations are high during stagnant conditions.
It should be noted that the influence on PM10 of local vehicle generated road-dust suspension is relatively large in Stockholm compared to many other cities in Europe. Even though also NO2 and PNC originate from local road traffic, the temporal correlations with road dust is very low (Figure 3). The reason for this is that road-dust suspension is highly influenced by the wetness of the road surfaces, as shown earlier by Johansson et al. [17]. So, in summary, the mix of pollutants included in this study are indicators of local road traffic emissions from vehicle exhaust and local non-exhaust particles, non-local secondary particulate matter and photochemical pollutants (O3).

4.2. Representativeness of One Central Monitoring Station for Population Exposure

Clearly, the possibility to quantify any associations between mortality and different pollutants depends on how well the exposure can be quantified. In this study, we have used one single urban background site, assuming that the temporal variability at this site reflects the temporal variability of the exposure in the population. A high temporal correlation between ambient concentrations at different measuring sites within a city means that one centrally located measuring station should be enough in order to estimate the short-term variations in pollutant concentrations in time-series studies, even though it is inadequate when it comes to estimate the long-term health effects, due to the spatial gradients in exposure concentrations [17,19].
Since PM2.5 are mainly influenced by non-local sources, spatial variations in ambient concentrations are small, and temporal variations will be very similar everywhere in the city. This has also been verified earlier for Stockholm in the TRAPCA study by Cyrys et al. [20], and it is also well known from other studies (see e.g., review by Monn [21]). O3 concentrations in Stockholm are also mainly influenced by long-range transport, even though there is some impact of the titration by NOx (photochemical removal) close to densely trafficked roads with high emissions of NOx. There is no local photochemical production of O3 in Stockholm.
For pollutants like PNC, BC and NO2, with road traffic emissions being the main source, the temporal variability in the concentrations may be expected to be quite similar everywhere in the city, as traffic intensities usually show similar temporal variations along different roads in the city. High temporal correlations (R ≈ 0.8) between traffic sites have been observed for PNC in Helsinki (Buzorius et al. [22]), and between 24-h mean concentrations of PNC at central sites and homes in Amsterdam, Athens, Birmingham and Helsinki, with a median correlation for PNC per city in the range of 0.67 and 0.76, as shown in Puustinen et al. [23]. Likewise, Cyrys et al. [19], found high correlations (R > 0.80) for PNC when they compared four different measurement stations in Augsburg. However, the variability of the concentrations of PNC in different cities may not be driven by the same emissions sources and atmospheric processes, and the PNC variability does not always indicate the impact of road traffic on air quality [24]. The variability in PNC depends on meteorology and on the size of the smallest particles considered due to the increasing influence of particle dynamics on particles smaller than 20 nm. Model calculations of PNC in Stockholm by Gidhagen et al. [18] showed that episodic losses of nanoparticles due to coagulation and dry deposition, some kilometers downwind of major roads, rise in connection with low wind speed and suppressed turbulent mixing. Similar results was found by Karl et al. [25], based on model calculations of PNC in Oslo, Helsinki and Rotterdam. Removal due to coagulation and deposition may thus lead to different temporal variations in different parts of a city. Moreover, for particles smaller than 100 nm, the formation is highly temperature dependent, as has been shown for Stockholm, where the number of particles, normalized by NOx, increases with decreasing temperature [26]. In addition, exposures in microenvironments, like indoors, might be very important for the daily exposure doses of PNC (Kumar et al. [27]). And for BC, the spatiotemporal variability was not found to be very high in Stockholm; different urban sites were poorly correlated even for daily averages (R < 0.70) [14], indicating that a single central measurement site would lead to misclassifications in the exposure.
Consequently, this means that the central monitor should reflect day-to-day variations in the exposure to ambient PM2.5 and O3, but may be less good for BC and PNC.

4.3. The Estimated Excess Risks and Explanatory Factors

In both epidemiological and clinical studies, short-term exposure to air pollutants has been demonstrated to increase the mortality related to cardiovascular and respiratory diseases. Regarding short-term mortality related to PM, there are several potential biological mechanisms behind this relationship. Exposure to PM in both the coarse (PM2.5–10) and the fine (PM2.5) fraction induces oxidative stress and inflammation. Exposure to PM2.5 can also affect the autonomic nervous system, and can thereby cause alterations in the autonomic control of the heart, which is also a risk factor for cardiovascular mortality [28].
The results presented in the single-pollutant model in Figure 4 show statistically significant positive excess risks for O3 and PM2.5–10 and PM10, but with no positive significant excess risks associated with exposure to the other pollutants. However, when comparing these coefficients with the results from similar studies, there are similarities regarding the results. In Meister et al. [29], a stronger effect on daily mortality (lag01) from PM2.5–10 in comparison with PM2.5 was found for Stockholm, based on data from 2000 to 2008.
In this study, statistically significant excess risks for O3 were found for both lag 01 and lag 02 in the single-pollutant model, and the excess risks remained significant in all two-pollutant models. However, this phenomenon is in line with other studies that have done similar analyzes. In Raza et al. [30], where short-term effects of air pollution on out-of-hospital cardiac arrest in Stockholm were analyzed, significant effects were observed for O3, but not for PM2.5, PM2.5–10, NOx and NO2. In another study performed in Stockholm, where short-term exposure to ozone and mortality in subjects with and without previous cardiovascular disease was analyzed, significant associations were found for O3, and these associations remained basically unchanged in two-pollutant models with NO2 and PM10 [31].
The results in Figure 4 exhibit a tangible pattern, with significant excess risks for O3, PM2.5–10 and PM10, but with non-significant excess risks for all the exhaust-related pollutants. In Stockholm, the mass of PM10 consists largely of mechanically generated particles from road abrasion, and since PM10 and PM2.5–10 are highly correlated (R = 0.81), their sources are thus also largely the same.
There are some possible reasons for the robust associations between exposure to O3, PM2.5–10 and PM10, and the daily mortality. Besides the established harmful effects, one possible reason may be that the measurement data for O3, PM2.5–10 and PM10 reflect the exposure better than for the other pollutants due to behavioral factors. Increased O3 concentrations coincides with sunny and warm days in spring and summer when people spend more time outdoors and allow windows to be opened to a greater extent. This will increase the exposure and thereby contribute to the significant excess risks. The concentrations of PM2.5–10 and PM10 also tend to increase during sunny days in spring and early summer due to suspension from dry roadways, which will then cause a higher exposure during these days. Contrariwise, the exhaust-related emissions tend to be lowest when the outdoor activities tend to be highest and vice versa, which possibly can contribute to the absence of significant positive associations for all exhaust-related pollutants (NO2, PM2.5, PNC4 and BC) in Figure 4. In this way, the exposure misclassification may work in different directions for different pollutants. The uncommon result for NO2 could also partly be explained by the high contribution from local sources resulting in larger weather influences. Large spatial variation in combination with the use of one centrally located measuring station may also increase the exposure misclassification for NO2, if the average exposure levels vary differently than at the central monitoring station. Negative associations between NO2 and cardiovascular mortality were also observed for the northernmost cities of Stockholm and Helsinki in the APHEA2 Study [32]. Even though the problem with behavioral factors has been discussed also for southern European cities (Chiusolo et al. [33]), it is probably not as pronounced as in the northern European cities, where the contrast in weather between summer and winter is much more pronounced, which can contribute to the negative associations observed in Stockholm and Helsinki.

4.4. Strengths and Limitations of This Study

A strength of this study is that we have an extensive dataset with continuous measurements of many pollutants that are good indicators of different sources: local vehicle exhaust and non-exhaust emissions, non-local secondary particles and an important gaseous oxidant (O3). Another strength is that we use high quality mortality data from the National Cause of Death Register.
The most obvious limitation of this study is that the measured concentrations are obtained from one centrally located measuring station, which potentially creates exposure misclassifications among the population. Another limitation of the study is the poor data capture for PNC4 and PNC7, where a simple linear regression during overlapping periods has been used to construct a complete time series of PNC4. However, the calculated RMSE between the measured and the modeled PNC4 concentrations is relatively small in comparison with the mean value of PNC4 during this overlapping period, and the investigation of the modelled PNC4 data found that there was no difference between the estimates generated by the modelled and the measured data. Another limitation is that we have used particle counters that include nanoparticles, which may be subject to large variability due to dynamic processes like coagulation and condensation/evaporation, and also due to dry deposition. By including only particles larger than e.g., 20 nm, the influence of particle dynamics and deposition may be avoided and make the exposure estimate using a single site more representative for the population.

5. Conclusions

The conclusion of this study is that the excess risks associated with exposure to exhaust emissions (NO2, PM2.5, BC and PNC4) exhibit much more uncertain relationships in comparison with O3, PM2.5–10 and PM10. The results, where significant associations were found only for O3, PM2.5–10 and PM10 are, however, in line with other studies from Stockholm which have analyzed similar relationships. The spatial and temporal variations associated with pollutants of local origin can make it harder to estimate population exposure based on one centrally located measuring station. However, the potential reason for the result findings, where statistically significant positive excess risks were found for O3, PM2.5–10 and PM10, but not for NO2, PM2.5, PNC4 and BC, is probably to a large part caused by behavioral factors. The concentrations of O3 and PM2.5–10 are in general high during sunny days, when outdoor activities tend to increase, while the opposite applies to NO2, PM2.5, PNC4 and BC, with the highest concentrations during the winter months.

Author Contributions

The study was planned by all authors. The draft manuscript has been written by H.O. and has been revised and approved by all authors. The figures performed in OpenAir have been made by C.J. The statistical analyses have been performed by C.Å.

Funding

This project was partly funded by ERA-PLANET (www.era-planet.eu), trans-national project SMURBS (www.smurbs.eu) (Grant Agreement n. 689443) under the EU Horizon 2020 Framework Programme. Bertil Forsberg and Christofer Åström were supported by the Swedish Clean Air and Climate research program (SCAC) funded by the Swedish Environmental Protection Agency.

Conflicts of Interest

The authors declare no conflict of interest.

Appendix A

Table A1. Description of the measurement methods and the instruments that have been used to measure the pollutants.
PollutantMethodInstrument
NO2ChemiluminescenceAC32M, Environnement S.A., France
O3UV absorptionO342M, Environnement S.A., France
PM10GravimetricTEOM 1400A, Thermo Fisher Scientific, USA
PM2.5GravimetricTEOM 1400A, Thermo Fisher Scientific, USA
BCTransmission of light through a filter Aethalometers 8100, AE31, AE33, Magee Scientific Corporation, USA
PNC4 and PNC7Optical countingCondensation particle counter, Model 3752/3022, TSI incorporated, USA
Figure A1. Daily mean concentrations of PM10, PM2.5, PM2.5–10, BC, O3, NOx and NO2 (µg m−3), and total particle number count (PNC) (>4 nm, cm−3), and the daily number of deaths in Stockholm during the period 2000–2016.
Ijerph 16 01028 g0a1
Figure A2. Correlation between PNC4 and PNC7 at an urban background site (Torkel Knutssonsgatan) in central Stockholm. The mean value of the measured concentrations of PNC4 is 8650 cm−3, with a root mean square error (RMSE) of 1355 cm−3 in relation to the modeled PNC4 values, based on the linear regression with PNC7.
Ijerph 16 01028 g0a2

References

  1. Mills, I.C.; Atkinson, R.W.; Anderson, H.R.; Maynard, R.L.; Strachan, D.P. Distinguishing the associations between daily mortality and hospital admissions and nitrogen dioxide from those of particulate matter: A systematic review and meta-analysis. BMJ Open 2016, 6, e010751. [Google Scholar] [CrossRef] [PubMed]
  2. Bell, M.L.; Dominici, F.; Samet, J.M. A meta-analysis of time-series studies of ozone and mortality with comparison to the national morbidity, mortality, and air pollution study. Epidemiology 2005, 16, 436–445. [Google Scholar] [CrossRef] [PubMed]
  3. Lu, F.; Xu, D.; Cheng, Y.; Dong, S.; Guo, C.; Jiang, X.; Zheng, X. Systematic review and meta-analysis of the adverse health effects of ambient PM2.5 and PM10 pollution in the Chinese population. Environ. Res. 2015, 136, 196–204. [Google Scholar] [CrossRef] [PubMed]
  4. Atkinson, R.W.; Mills, I.C.; Walton, H.A.; Anderson, H.R. Fine particle components and health—A systematic review and meta-analysis of epidemiological time series studies of daily mortality and hospital admissions. J. Expo. Sci. Environ. Epidemiol. 2015, 25, 208–214. [Google Scholar] [CrossRef] [PubMed]
  5. Samoli, E.; Atkinson, R.W.; Analitis, A.; Fuller, G.W.; Beddows, D.; Green, D.C.; Mudway, I.S.; Harrison, R.M.; Anderson, H.R.; Kelly, F.J. Differential health effects of short-term exposure to source-specific particles in London, U.K. Environ. Int. 2016, 97, 246–253. [Google Scholar] [CrossRef] [PubMed]
  6. Lanzinger, S.; Schneider, A.; Breitner, S.; Stafoggia, M.; Erzen, I.; Dostal, M.; Pastorkova, A.; Bastian, S.; Cyrys, J.; Zscheppang, A.; et al. Associations between ultrafine and fine particles and mortality in five central European cities—Results from the UFIREG study. Environ. Int. 2016, 88, 44–52. [Google Scholar] [CrossRef] [PubMed]
  7. Stafoggia, M.; Schneider, A.; Cyrys, J.; Samoli, E.; Andersen, Z.J.; Bedada, G.B.; Bellander, T.; Cattani, G.; Eleftheriadis, K.; Faustini, A.; et al. Association between short-term exposure to ultrafine particles and mortality in eight European urban areas. Epidemiology 2017, 28, 172–180. [Google Scholar] [CrossRef] [PubMed]
  8. Chen, K.; Wolf, K.; Breitner, S.; Gasparrini, A.; Stafoggia, M.; Samoli, E.; Andersen, Z.J.; Bero-Bedada, G.; Bellander, T.; Henniq, F.; et al. Two-way effect modifications of air pollution and air temperature on total natural and cardiovascular mortality in eight European urban areas. Environ. Int. 2018, 116, 186–196. [Google Scholar] [CrossRef]
  9. Tobías, A.; Rivas, I.; Reche, C.; Alastuey, A.; Rodríguez, S.; Fernández-Camacho, R.; Sanchez de la Campa, A.M.; de la Rosa, J.; Sunyer, J.; Querol, X.; et al. Short-term effects of ultrafine particles on daily mortality by primary vehicle exhaust versus secondary origin in three Spanish cities. Environ. Int. 2018, 111, 144–151. [Google Scholar] [CrossRef]
  10. Hennig, F.; Quass, U.; Hellack, B.; Küpper, M.; Kuhlbusch, T.A.J.; Stafoggia, M.; Hoffmann, B. Ultrafine and fine particle number and surface area concentrations and daily cause-specific mortality in the Ruhr Area, Germany, 2009–2014. Environ. Health Perspect. 2018, 15, 126. [Google Scholar] [CrossRef]
  11. HEI: Review Panel on Ultrafine Particles. Understanding the Health Effects of Ambient Ultrafine Particles; HEI Perspectives 3; Health Effects Institute: Boston, MA, USA, 2013. [Google Scholar]
  12. Brunekreef, B.; Forsberg, B. Epidemiological evidence of effects of coarse airborne particles on health. Eur. Respir. J. 2005, 26, 309–318. [Google Scholar] [CrossRef] [Green Version]
  13. Adar, S.D.; Filigrana, P.A.; Clements, N.; Peel, J.L. Ambient Coarse Particulate and Human Health: A Systematic Review and Meta-Analysis. Curr. Envir. Health Rpt. 2014, 1, 258–274. [Google Scholar] [CrossRef] [PubMed]
  14. Krecl, P.; Targino, A.C.; Johansson, C. Spatiotemporal distribution of light-absorbing carbon and its relationship to other atmospheric pollutants in Stockholm. Atmos. Chem. Phys. 2011, 11, 11553–11567. [Google Scholar] [CrossRef] [Green Version]
  15. Carslaw, D.C.; Ropkins, K. Openair—An R package for air quality data analysis. Environ. Model. Softw. 2012, 27–28, 52–61. [Google Scholar] [CrossRef]
  16. Auger, N.; Potter, B.J.; Smargiassi, A.; Bilodeau-Bertrand, M.; Paris, C.; Kosatsky, T. Association between quantity and duration of snowfall and risk of myocardial infarction. CMAJ 2017, 189, E235–E242. [Google Scholar] [CrossRef] [PubMed] [Green Version]
  17. Johansson, C.; Norman, M.; Gidhagen, L. Spatial & temporal variations of PM10 and particle number concentrations in urban air. Environ. Monit. Assess. 2007, 127, 477–487. [Google Scholar] [CrossRef]
  18. Gidhagen, L.; Johansson, C.; Langner, J.; Foltescu, V.L. Urban scale modeling of particle number concentration in Stockholm. Atmos. Environ. 2005, 39, 1711–1725. [Google Scholar] [CrossRef]
  19. Cyrys, J.; Pitz, M.; Heinrich, J.; Wichmann, H.-E.; Peters, A. Spatial and temporal variation of particle number concentration in Augsburg, Germany. Sci. Total Environ. 2008, 401, 168–175. [Google Scholar] [CrossRef] [PubMed] [Green Version]
  20. Cyrys, J.; Heinrich, J.; Meliefste, K.; Lewne, M.; Hoek, G.; Bellander, T.; Gehring, U.; Fischer, P.; van Vliet, P.; Brauer, M.; et al. Comparison between different traffic related particle indicators: Elemental carbon (EC), PM2.5 mass and absorbance. J. Expo. Anal. Environ. Epidemiol. 2003, 13, 134–143. [Google Scholar] [CrossRef] [PubMed]
  21. Monn, C. Exposure assessment of air pollutants: A review on spatial heterogenity and indoor/outdoor/personal exposure to suspended particulate matter, nitrogen dioxide and ozone. Atmos. Environ. 2001, 35, 1–32. [Google Scholar] [CrossRef]
  22. Buzorius, G.; Hämeri, K.; Pekkanen, J.; Kulmala, M. Spatial variation of aerosol number concentration in Helsinki city. Atmos. Environ. 1999, 33, 553–565. [Google Scholar] [CrossRef]
  23. Puustinen, A.; Hämeri, K.; Pekkanen, J.; Kulmala, M.; de Hartog, J.; Meliefste, K.; ten Brink, H.; Kos, G.; Katsouyanni, K.; Karakatsani, A.; et al. Spatial variation of particle number and mass over four European cities. Atmos. Environ. 2007, 41, 6622–6636. [Google Scholar] [CrossRef]
  24. Reche, C.; Querol, X.; Alastuey, A.; Viana, M.; Pey, J.; Moreno, T.; Rodriguez, S.; Gonzalez, Y.; Fernandez-Camacho, R.; de lar Rosa, J.; et al. New considerations for PM, Black Carbon and particle number concentration for air quality monitoring across different European cities. Atmos. Chem. Phys. 2011, 11, 6207–6227. [Google Scholar] [CrossRef] [Green Version]
  25. Karl, M.; Kukkonen, J.; Keuken, M.P.; Lützenkirchen, S.; Pirjola, L.; Hussein, T. Modeling and measurements of urban aerosol processes on the neighborhood scale in Rotterdam, Oslo and Helsinki. Atmos. Chem. Phys. 2016, 16, 4817–4835. [Google Scholar] [CrossRef] [Green Version]
  26. Olivares, G.; Johansson, C.; Ström, J.; Hansson, H.C. The role of ambient temperature for particle number concentrations in a street canyon. Atmos. Environ. 2007, 41, 2145–2155. [Google Scholar] [CrossRef]
  27. Kumar, P.; Morawska, L.; Birmili, W.; Paasonen, P.; Hu, M.; Kulmala, M. Ultrafine particles in cities. Environ. Int. 2014, 66, 1–10. [Google Scholar] [CrossRef] [PubMed] [Green Version]
  28. Fiordelisi, A.; Piscitelli, P.; Trimarco, B.; Coscioni, E.; Iaccarino, G.; Sorriento, D. The mechanisms of air pollution and particulate matter in cardiovascular diseases. Heart Fail. Rev. 2017, 22, 337–347. [Google Scholar] [CrossRef] [PubMed]
  29. Meister, K.; Johansson, C.; Forsberg, J. Estimated short-term effects of coarse particles on daily mortality in Stockholm, Sweden. Environ. Health Perspect. 2012, 120, 431–436. [Google Scholar] [CrossRef] [PubMed]
  30. Raza, A.; Bellander, B.; Bero-Bedada, G.; Dahlquist, M.; Hollenberg, J.; Jonsson, M.; Lind, T.; Rosenqvist, M.; Svensson, L.; Ljungman, P.L. Short-term effects of air pollution on out-of-hospital cardiac arrest in Stockholm. Eur. Heart J. 2014, 35, 861–867. [Google Scholar] [CrossRef] [PubMed]
  31. Bedada, G.B.; Raza, A.; Forsberg, B.; Lind, T.; Ljungman, P.; Pershagen, G.; Bellander, T. Short-term exposure to ozone and mortality in subjects with and without previous cardiovascular disease. Epidemiology 2016, 27, 663–669. [Google Scholar] [CrossRef]
  32. Samoli, E.; Aga, E.; Touloumi, G.; Nisiotis, K.; Forsberg, B.; Lefranc, A.; Pekkanen, J.; Wojtyniak, B.; Schindler, C.; Niciu, E.; et al. Short-term effects of nitrogen dioxide on mortality: An analysis within the APHEA project. Eur. Respir. J. 2006, 27, 1129–1138. [Google Scholar] [CrossRef] [PubMed]
  33. Chiusolo, M.; Cadum, E.; Stafoggia, M.; Galassi, C.; Berti, G.; Faustini, A.; Bisanti, L.; Vigotti, M.A.; Dessi, M.P.; Cernigliaro, A.; et al. Short-term effects of nitrogen dioxide on mortality and susceptibility factors in 10 Italian cities: The EpiAir Study. Environ. Health Perspect. 2011, 119, 1233–1238. [Google Scholar] [CrossRef] [PubMed]
Figure 1. Normalized monthly mean concentrations of BC, NO2 and PNC for the measurements in central Stockholm during 2000–2016.
Ijerph 16 01028 g001
Figure 2. Normalized monthly mean concentrations of PM10, PM2.5, PM2.5–10 and O3 for the measurements in central Stockholm during 2000–2016.
Ijerph 16 01028 g002
Figure 3. Correlation matrix showing pairwise Pearson correlation coefficients as percentage values. The correlations are illustrated by shapes (ellipses), colors and the numeric value. The ellipses are visual representations of the scatter plots. With a perfect positive correlation, a line at 45 degrees positive slope is drawn. For zero correlation, the shape becomes a circle.
Ijerph 16 01028 g003
Figure 4. The estimated change in daily mortality (with 95% CI) for an IQR increase in concentration (lag01 and lag02) to the different air pollutants in a single-pollutant model.
Ijerph 16 01028 g004
Figure 5. The estimated change in daily mortality (with 95% CI) for an IQR increase in concentration (lag02) to PM2.5–10, O3 and NO2 in a multi-pollutant model. Model 1 (furthest to the left) represents the single-pollutant estimate of PM2.5–10. Model 2 and 3 represent two-pollutant models, with O3 (Model 2), and with NO2 (Model 3). In Model 4, both PM2.5–10, O3 and NO2 are included.
Ijerph 16 01028 g005
Figure 6. The estimated change in daily mortality (with 95% CI) for an IQR increase in concentration (lag02) of BC, O3 and NO2 in a multi-pollutant model. Model 1 (furthest to the left) represents the single-pollutant estimate of BC. Model 2 and 3 represent two-pollutant models, with O3 (Model 2), and with NO2 (Model 3). In Model 4, both BC, O3 and NO2 are included.
Ijerph 16 01028 g006
Figure 7. The estimated change in daily mortality (with 95% CI) for an IQR increase in concentration (lag02) of NO2, O3 and PM2.5–10 in a multi-pollutant model. Model 1 (furthest to the left) represents the single-pollutant estimate of NO2. Model 2 and 3 represent two-pollutant models, with O3 (Model 2), and with PM2.5–10 (Model 3). In Model 4, both NO2, O3 and PM2.5–10 are included.
Ijerph 16 01028 g007
Table 1. Summary statistics of the daily data from 2000–2016 that were used for the study.
VariableMean (IQR)#Days (% Valid Data)
Mortality (N per day)18.5 (15.2)6210 (100%)
Maximum temperature (°C)11.4 (15.0)6210 (100%)
O3 (daily maximum 8-h mean) (µg m−3)51.2 (25.2)6133 (99%)
PM2.5 (µg m−3)6.5 (4.8)5358 (86%)
PM10 (µg m−3)14.5 (8.7)5999 (97%)
PM2.5–10 (µg m−3)8.0 (5.5)5352 (86%)
NO2 (µg m−3)14.4 (9.9)6101 (98%)
BC (µg m−3)0.6 (0.5)3316 (53%)
PNC4 nm (cm−3)6793 (3484)2727 (44%)
PNC7 nm (cm−3)8701 (4997)1860 (30%)
PNC# nm (cm−3)9177 (5354)4328 (70%)
# Calculated PNC4 based on regression of PNC4 against PNC7 (Figure A1).

