Evaluating the Spatial Accessibility and Distribution Balance of Multi-Level Medical Service Facilities


Abstract
:1. Introduction
2. Study Area and Datasets
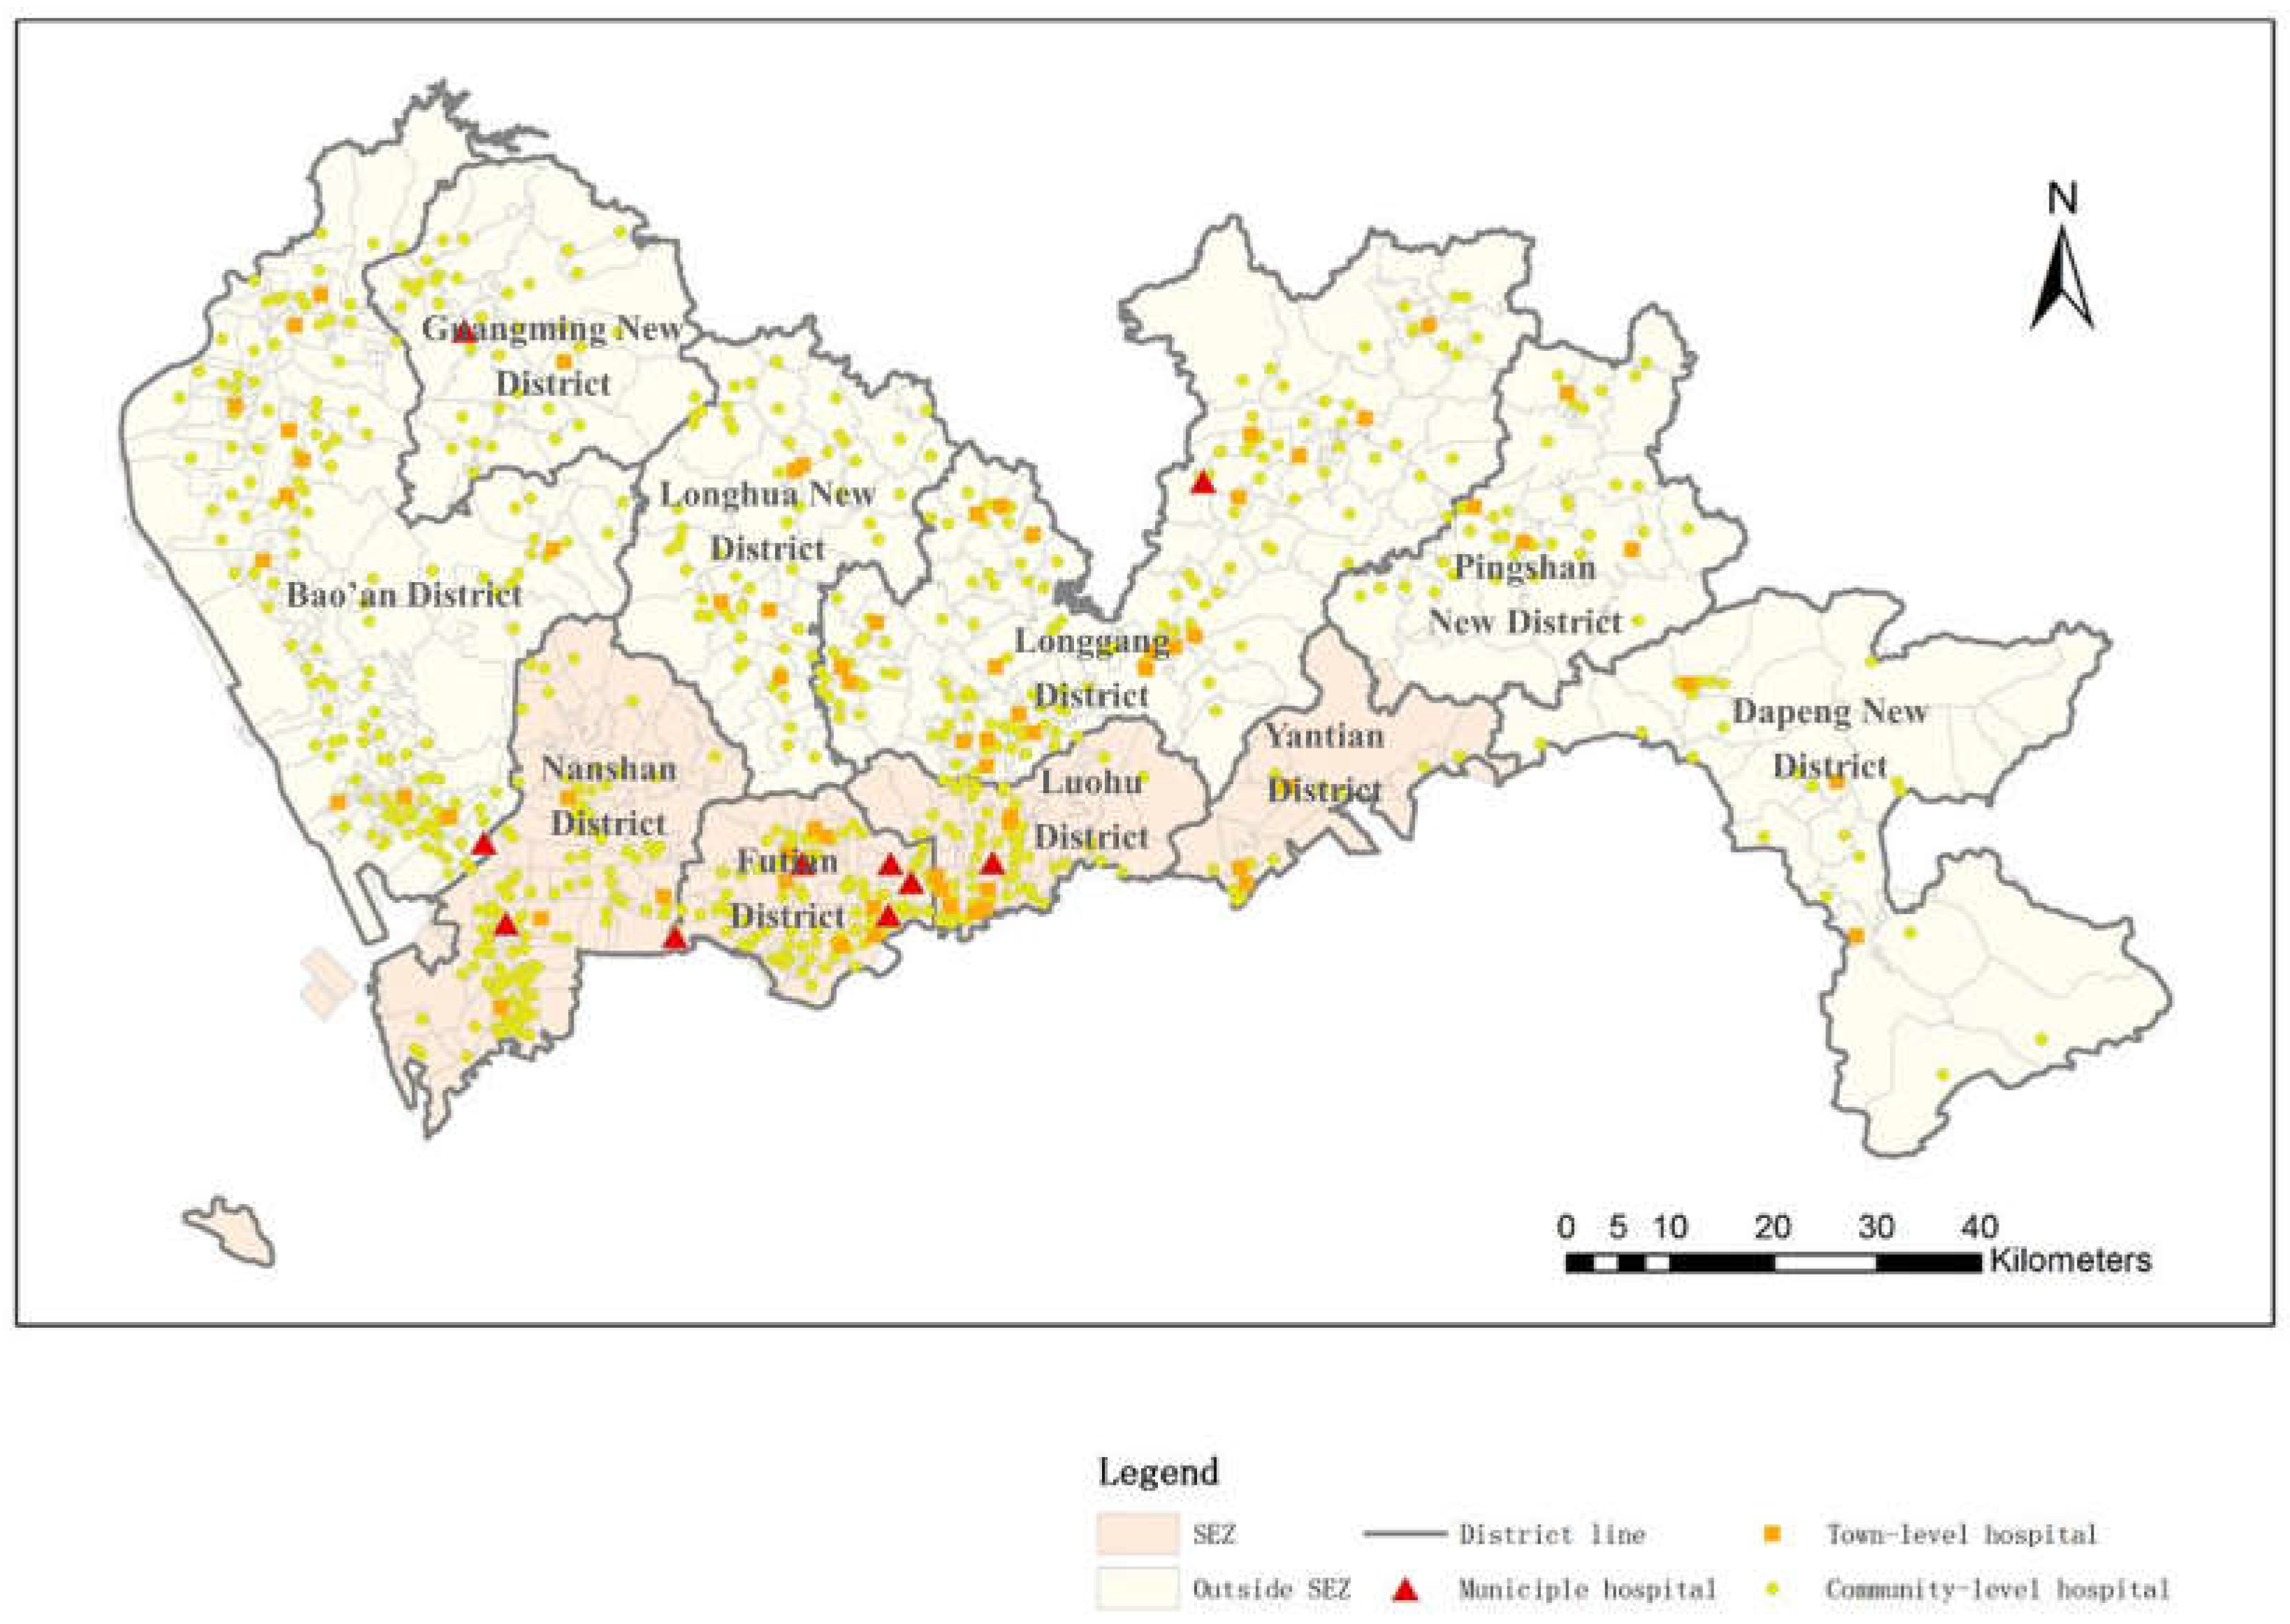
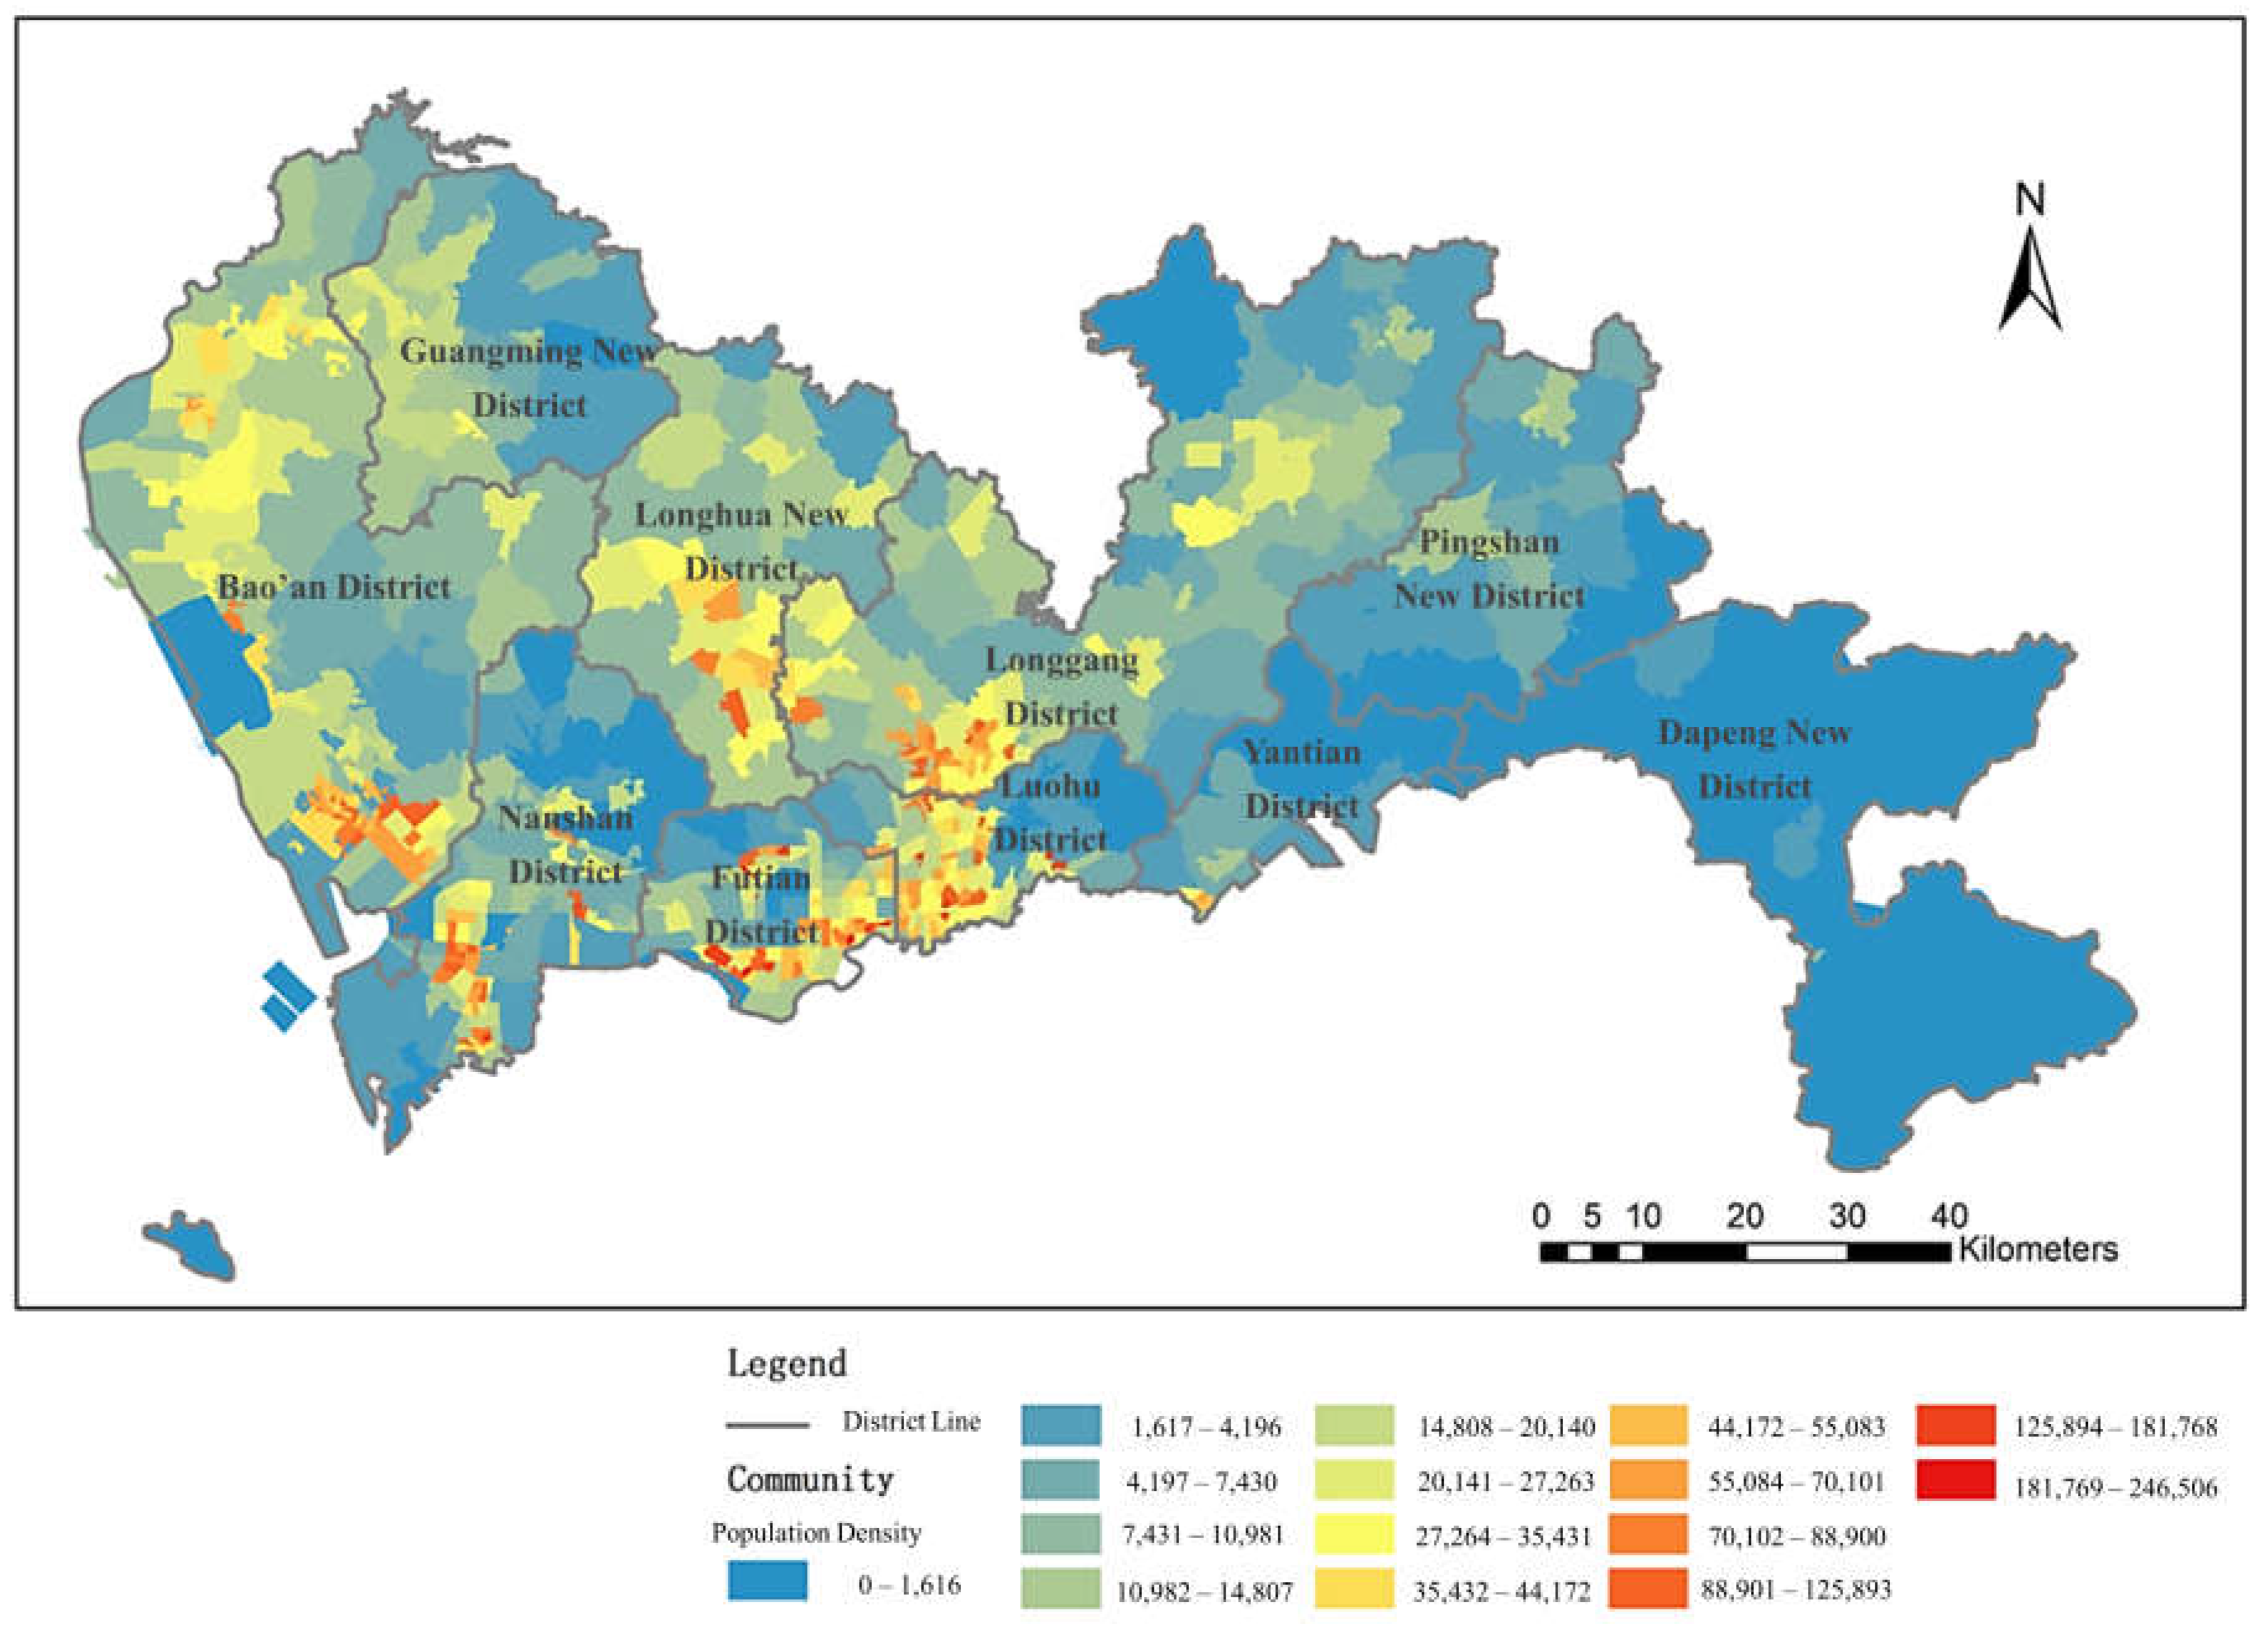
2.1. Study Area
2.2. Datasets
3. Methodology
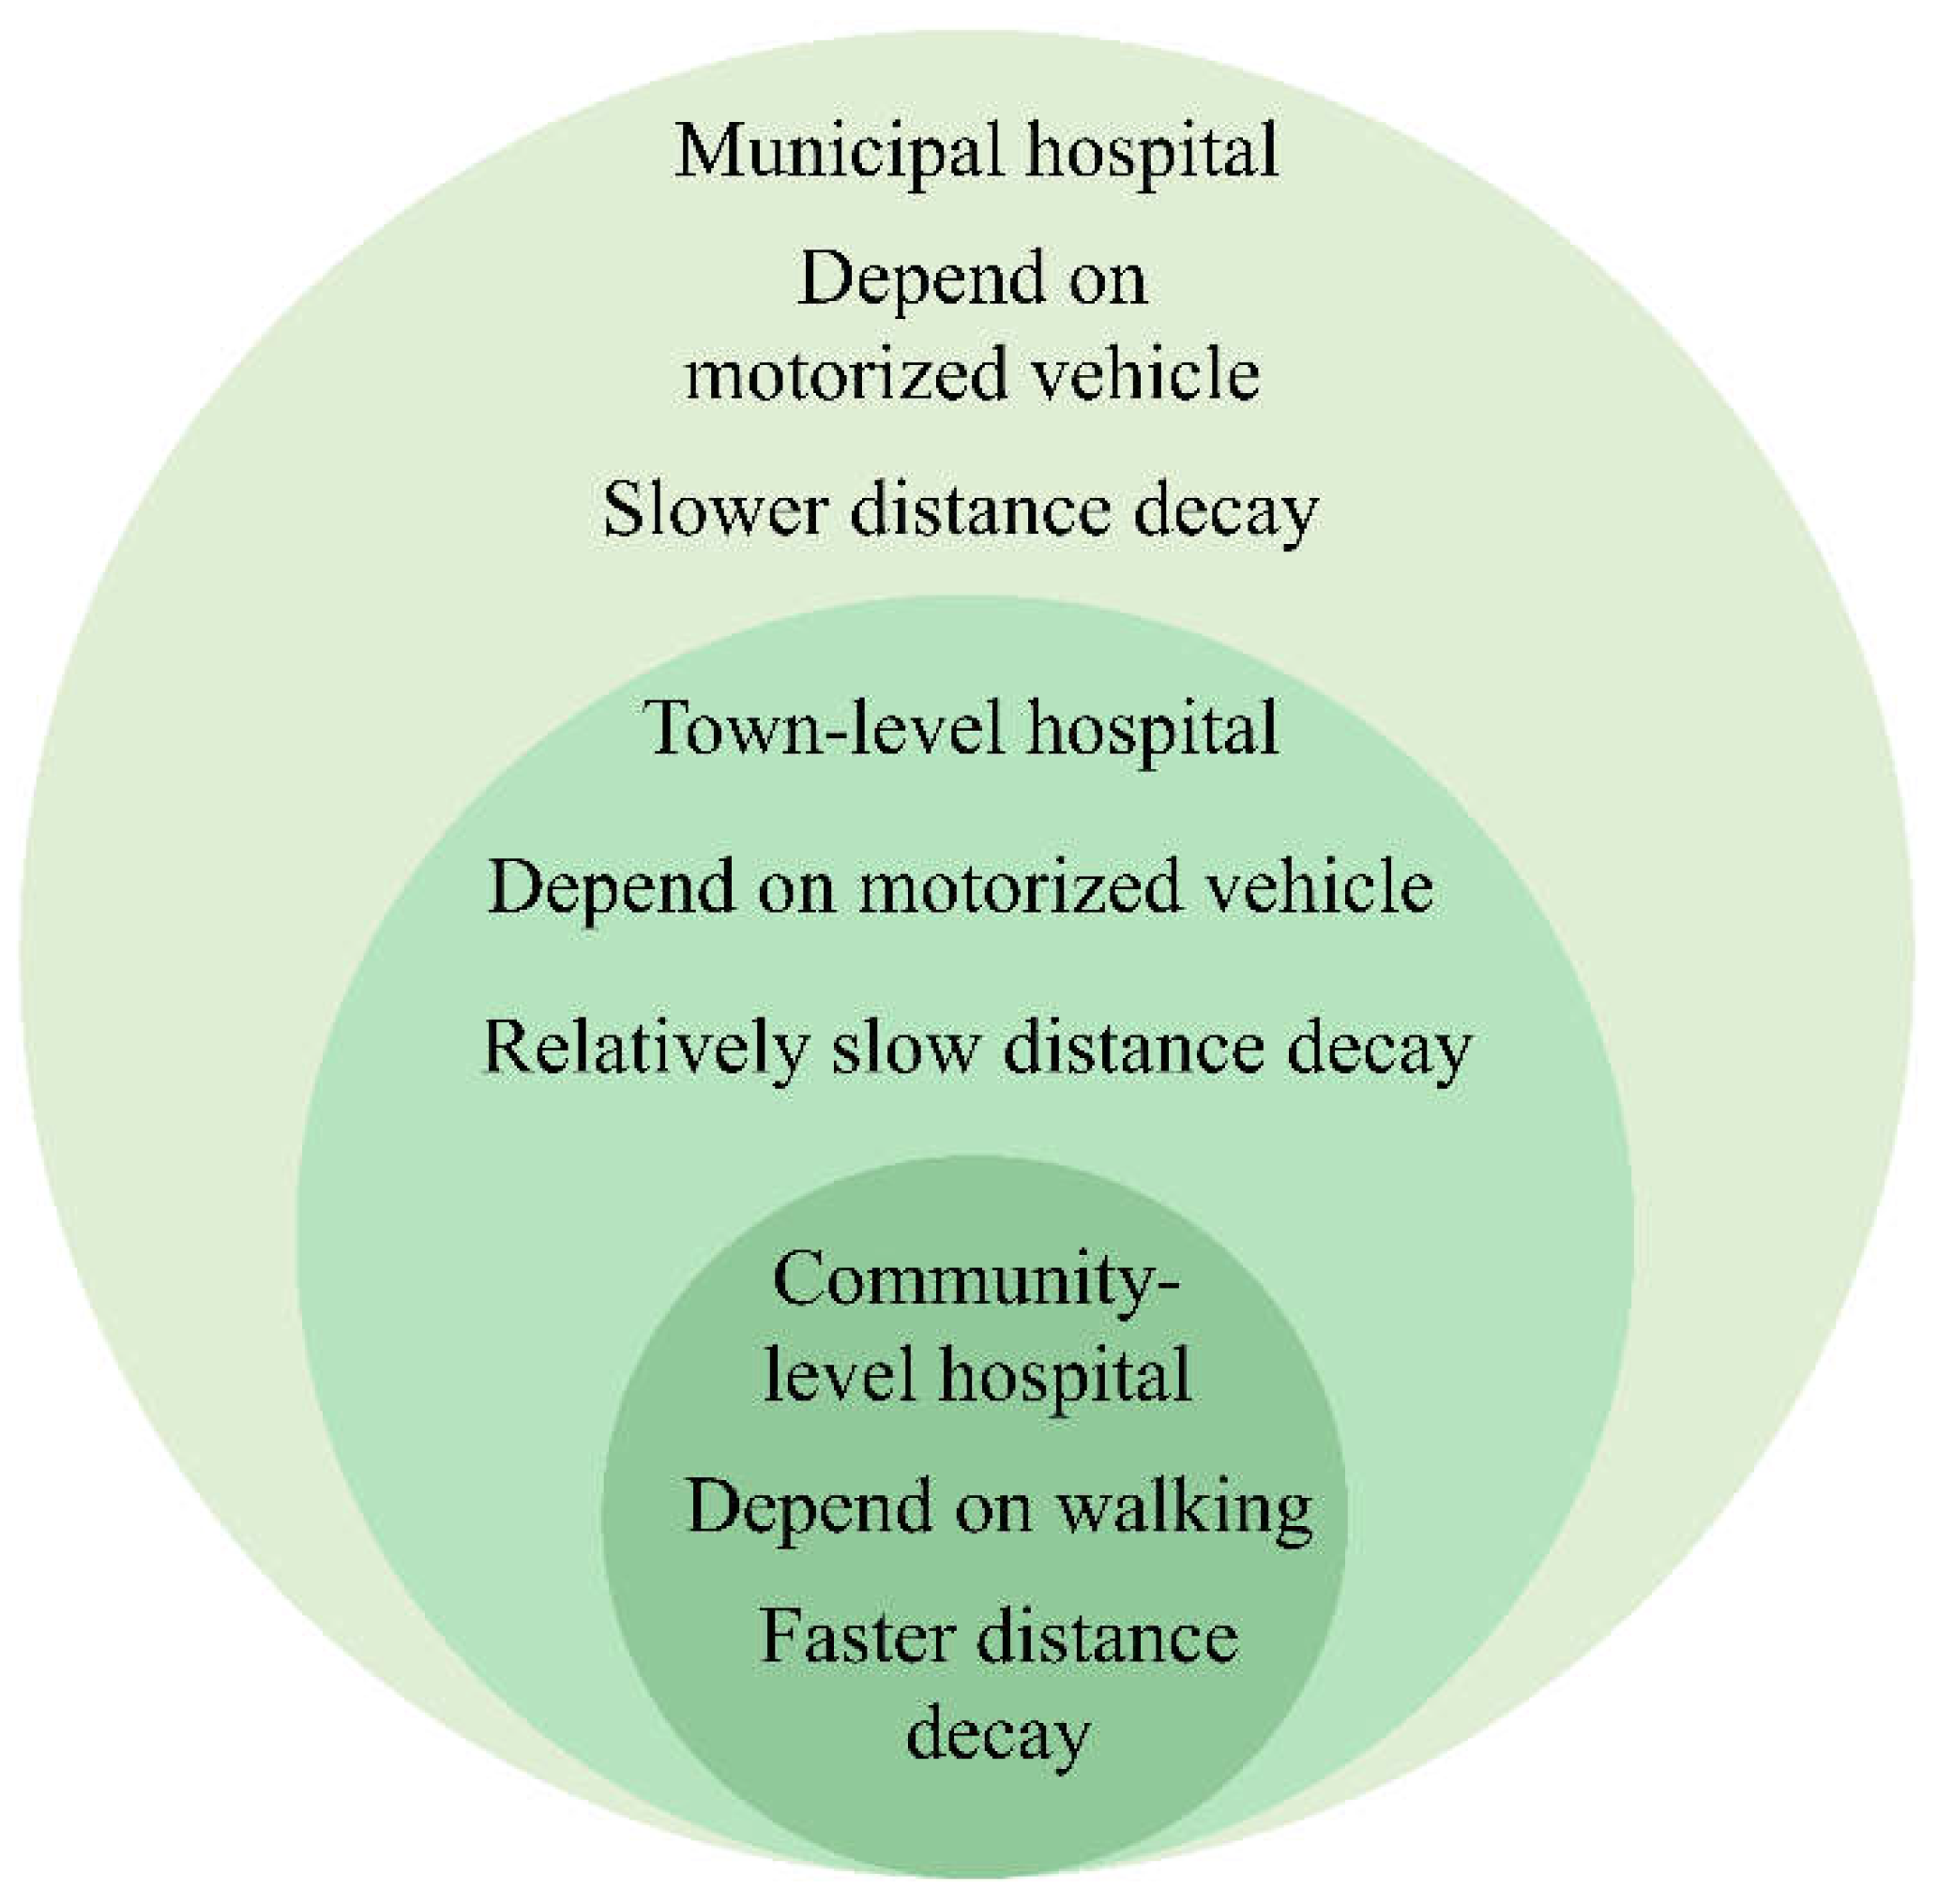
3.1. Accessibility Measurement
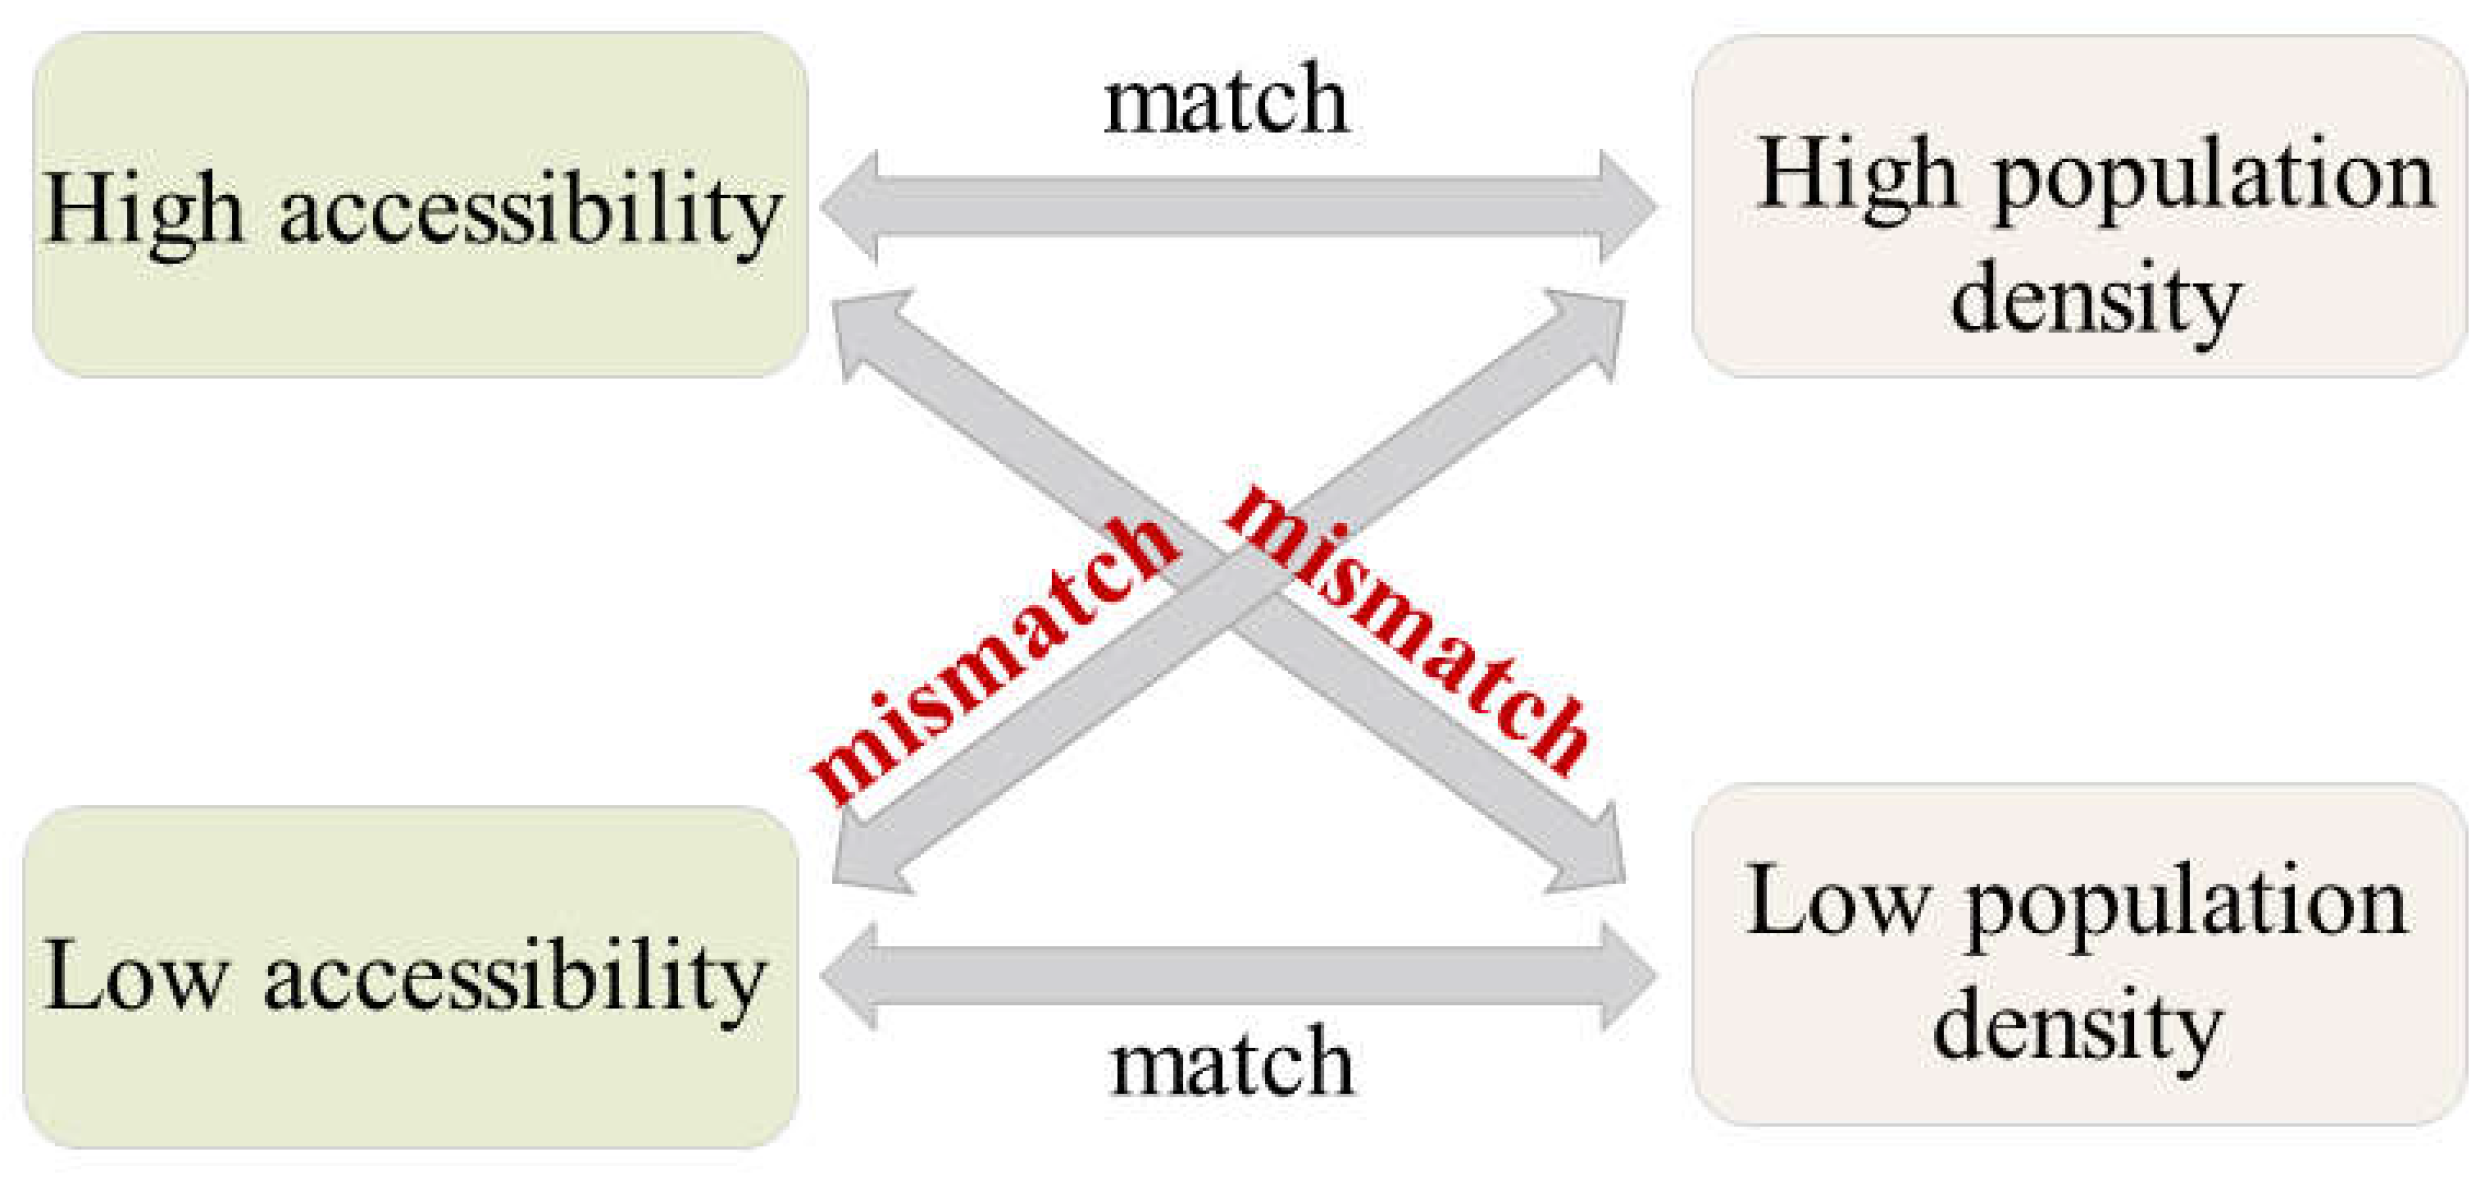
3.2. Measurement of the Medical Service Distribution Balance
4. Results and Discussion
4.1. Results of the Accessibility Evaluation
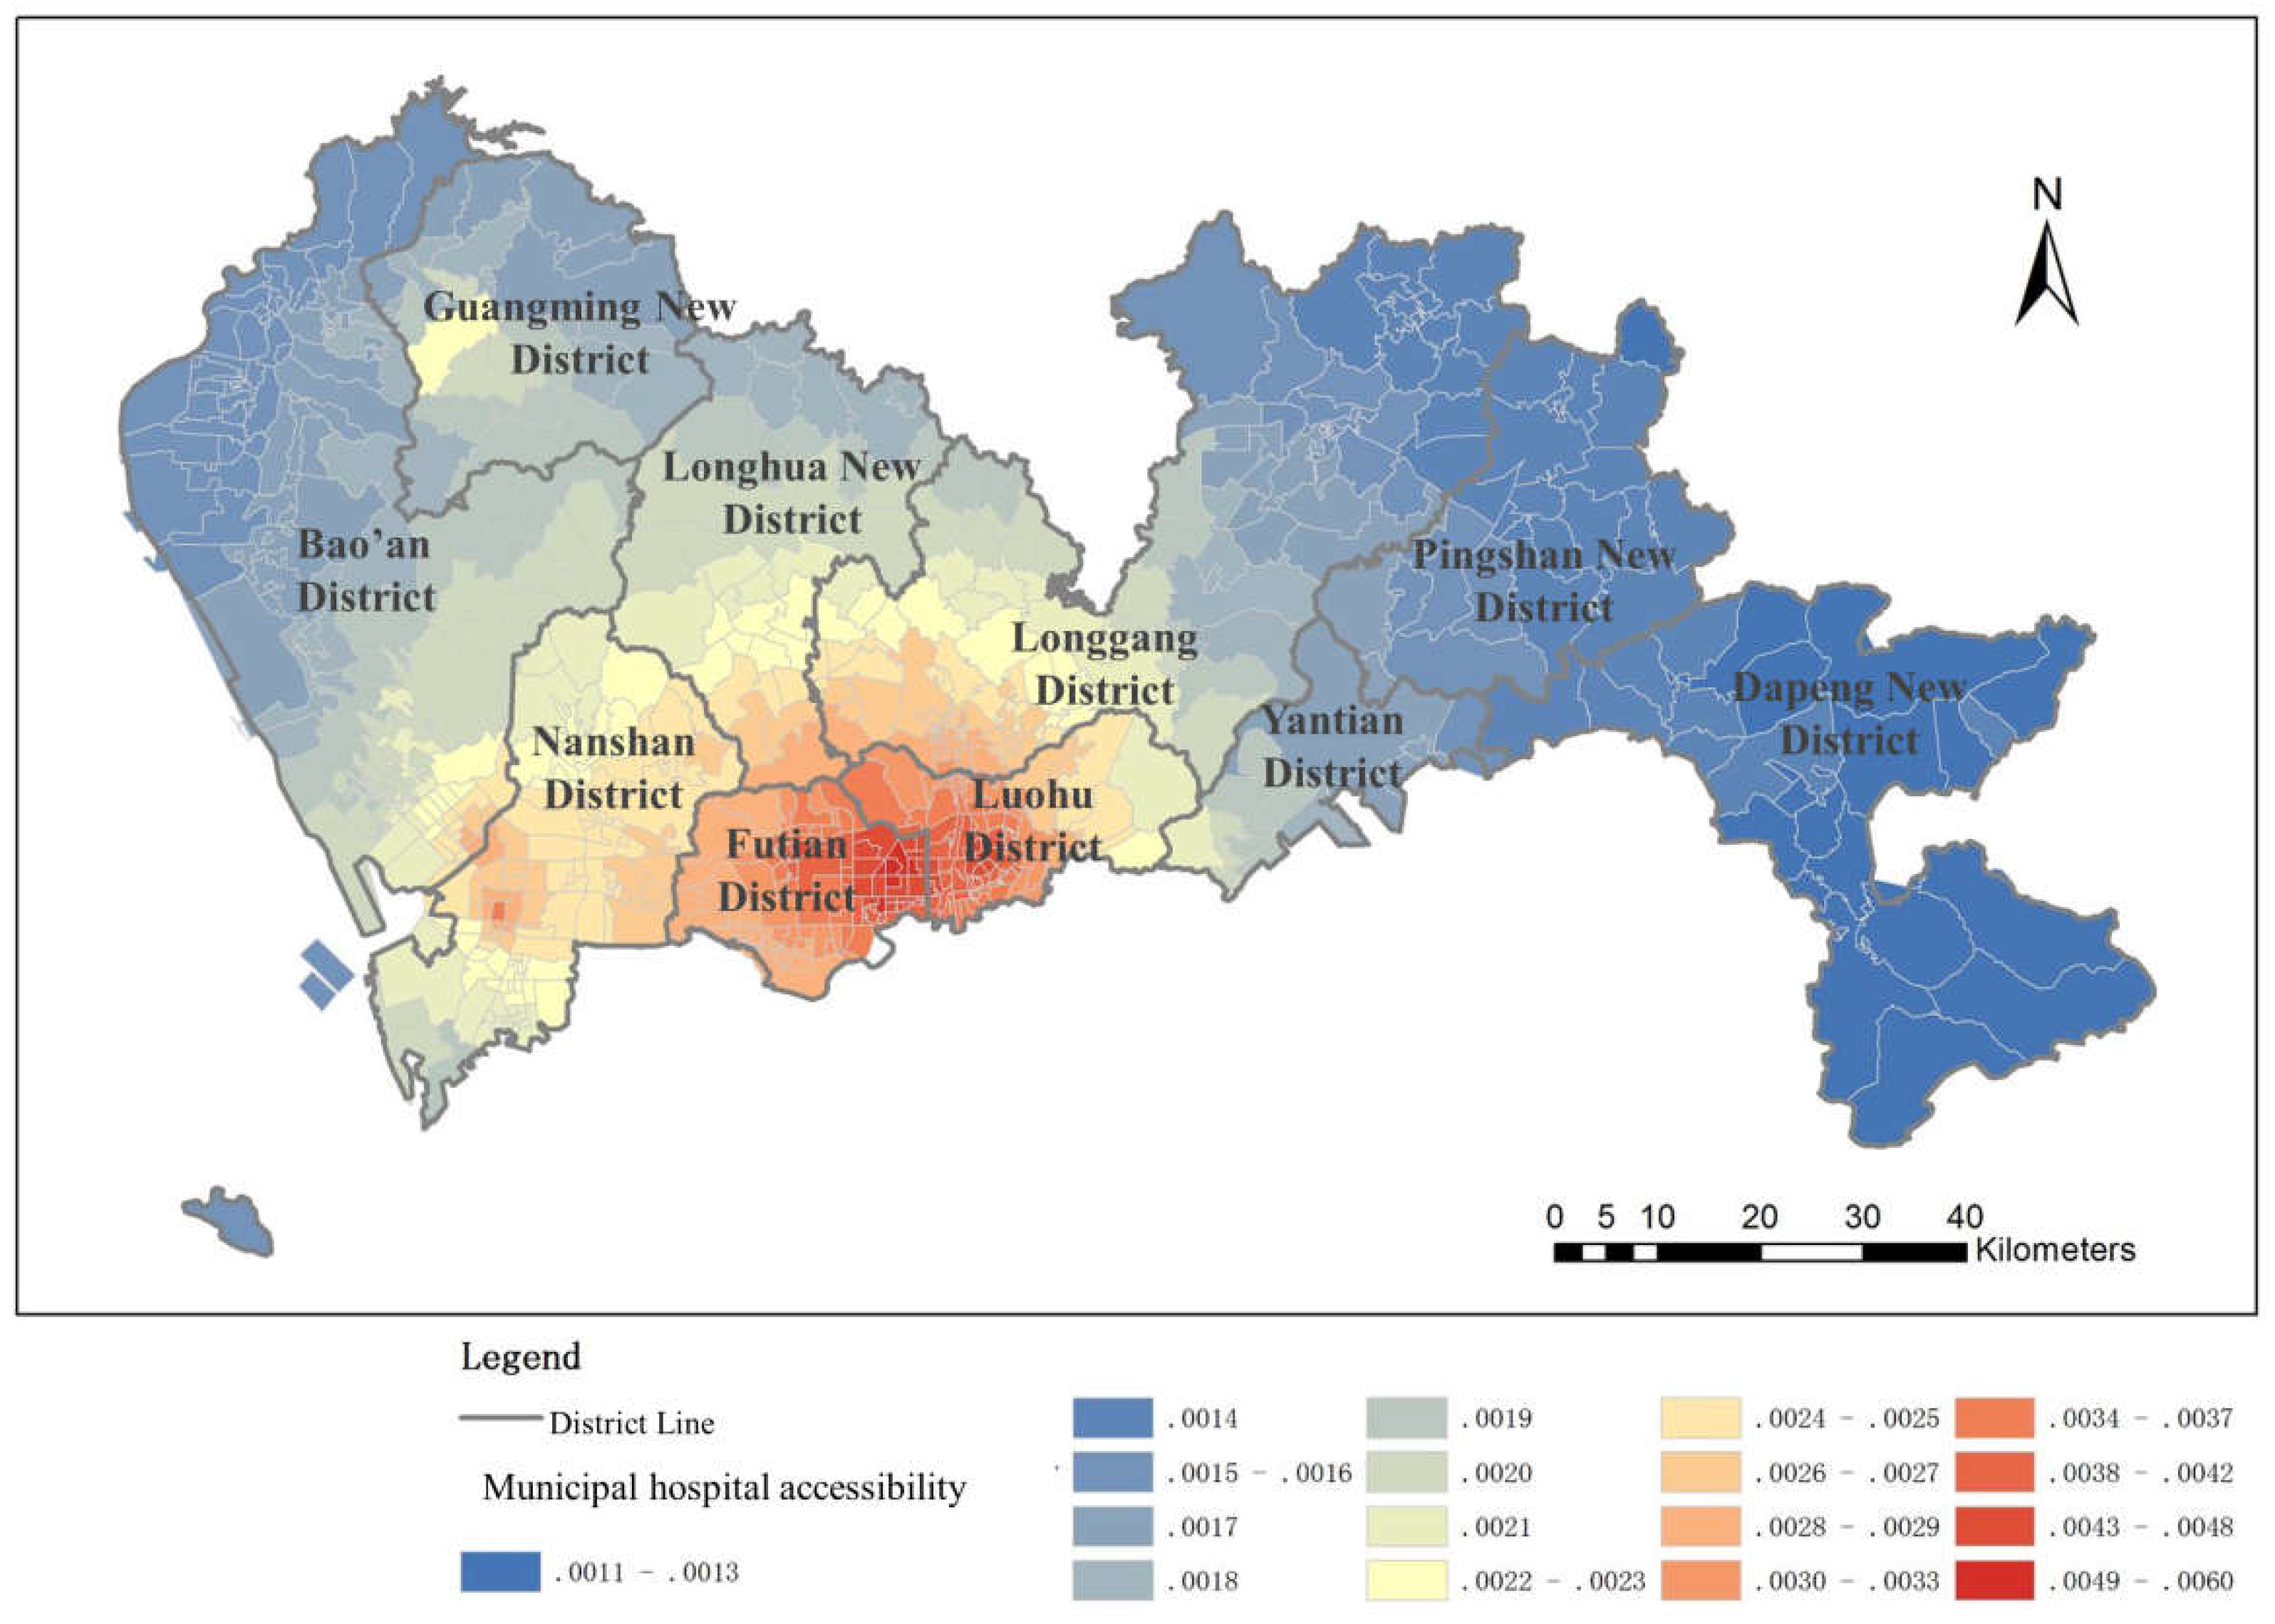
4.1.1. Municipal Hospital Accessibility
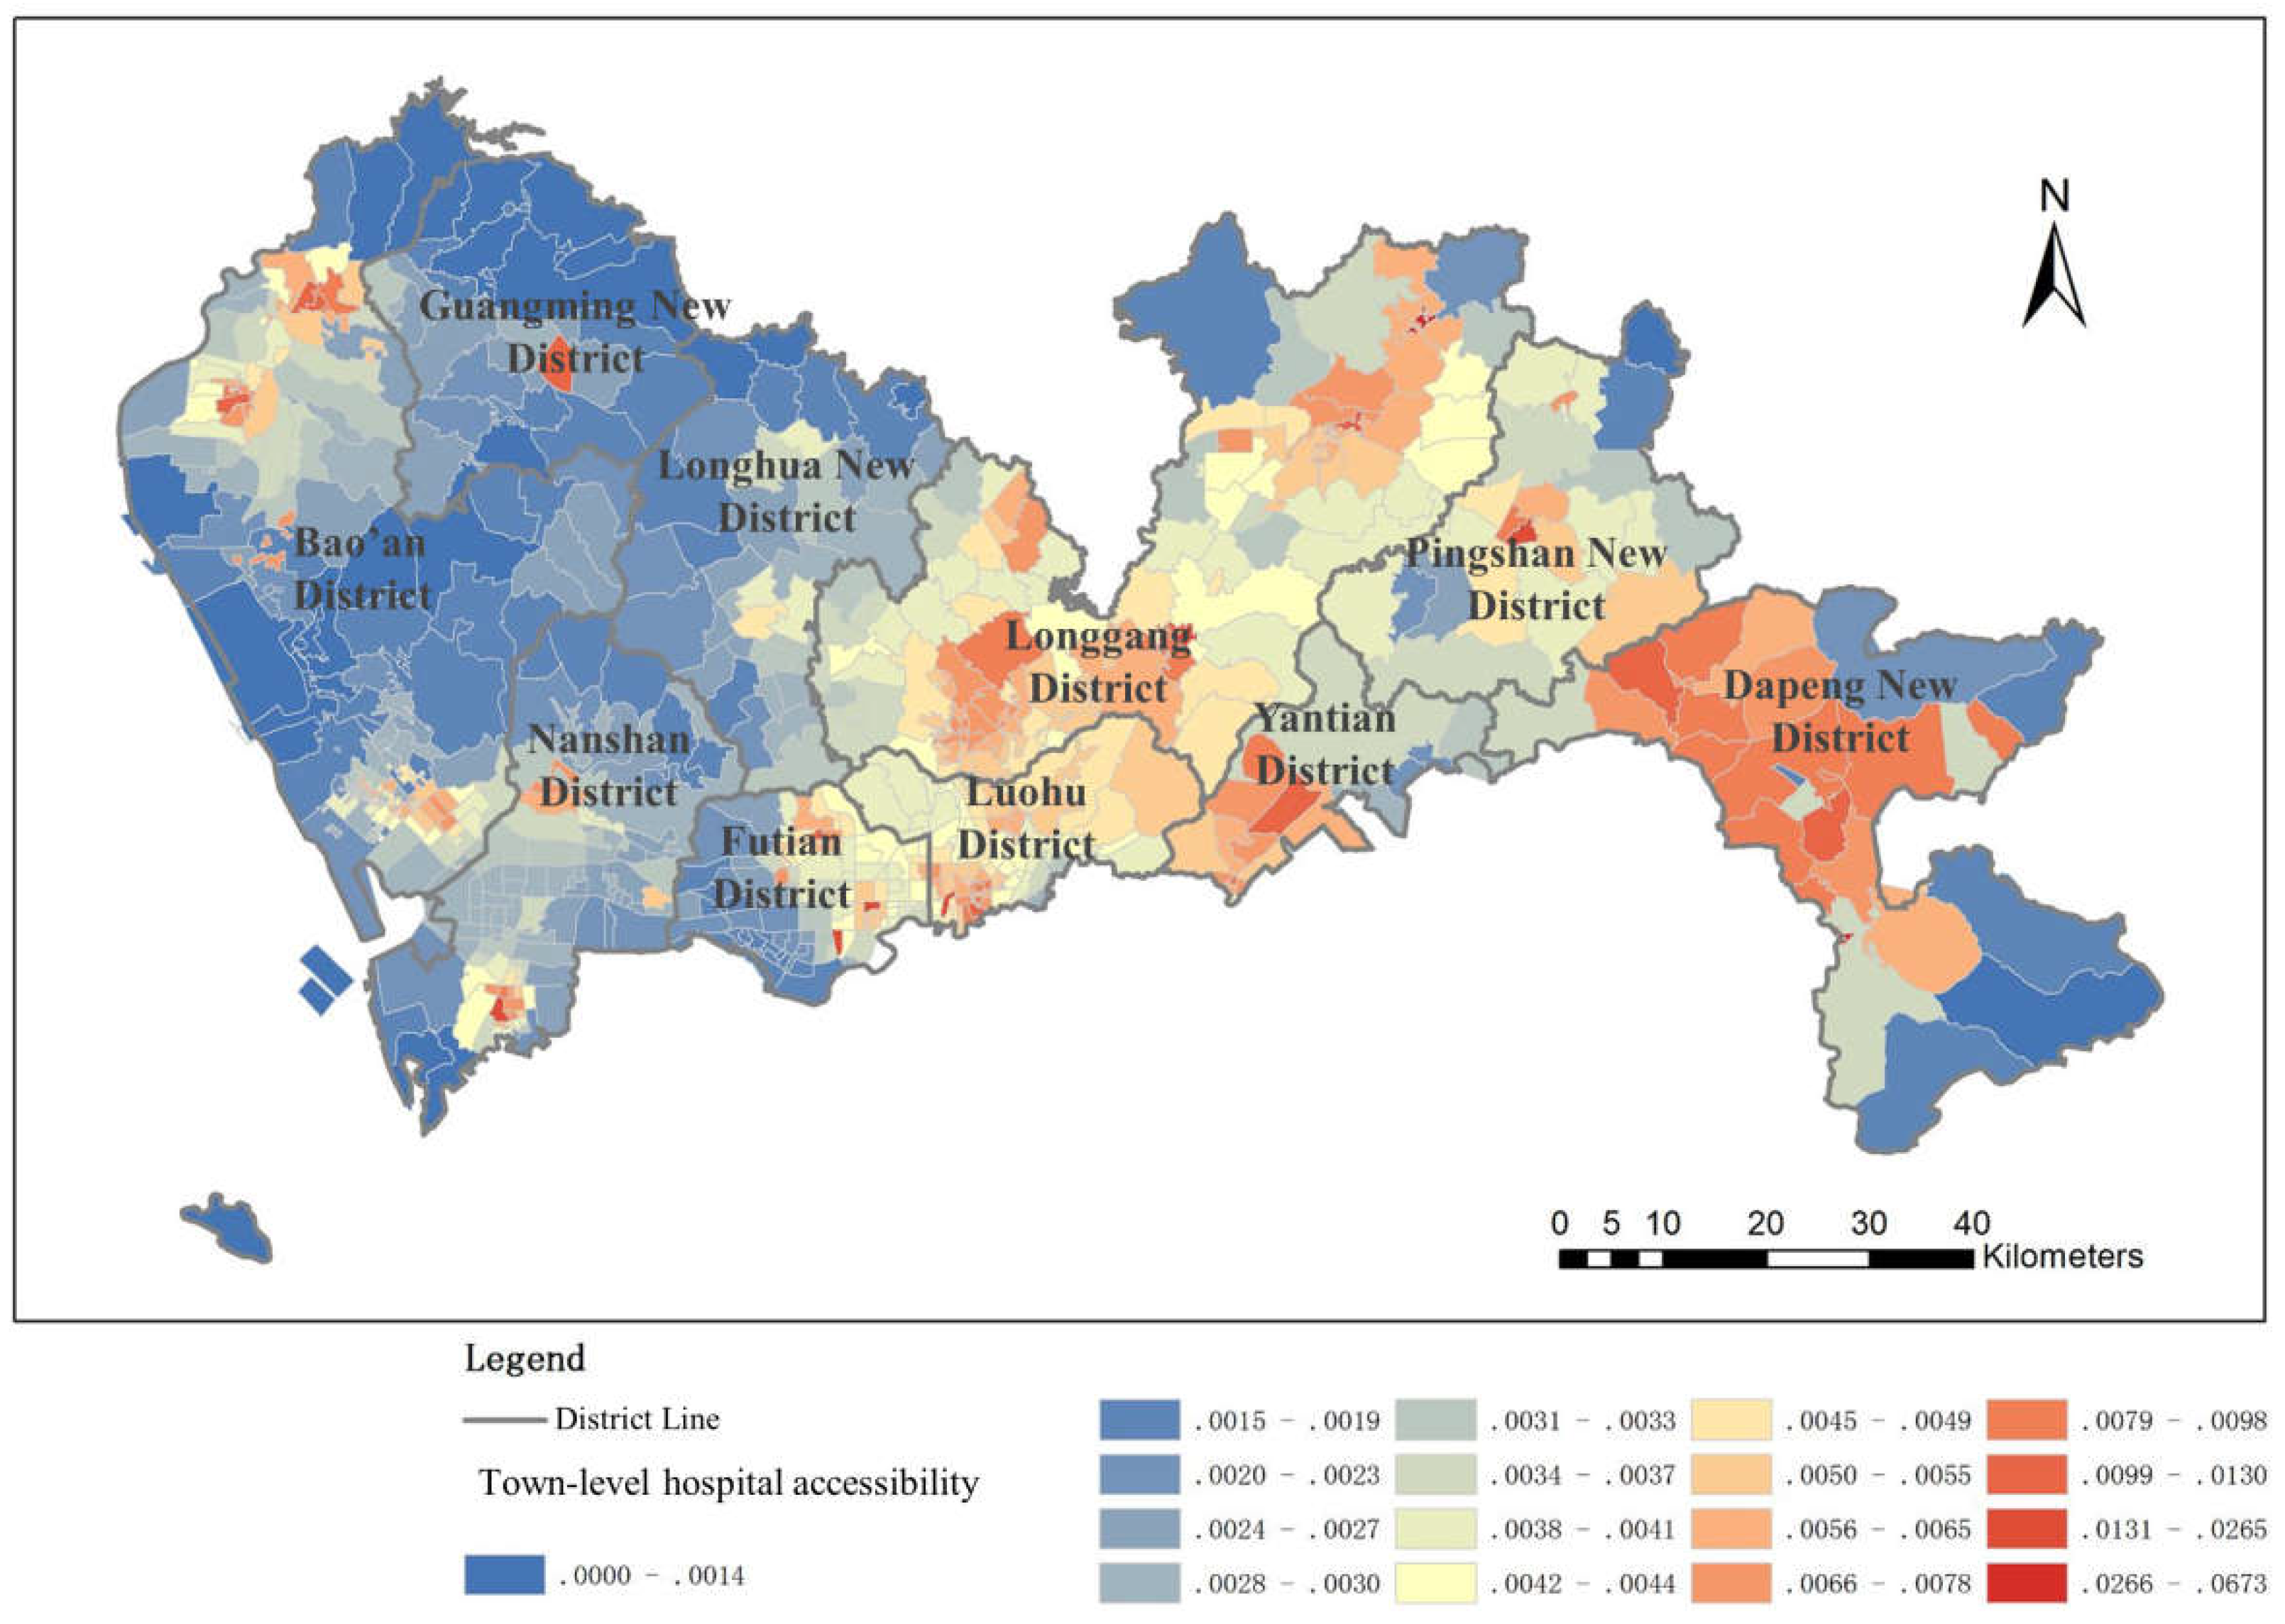
4.1.2. Town-Level Hospital Accessibility
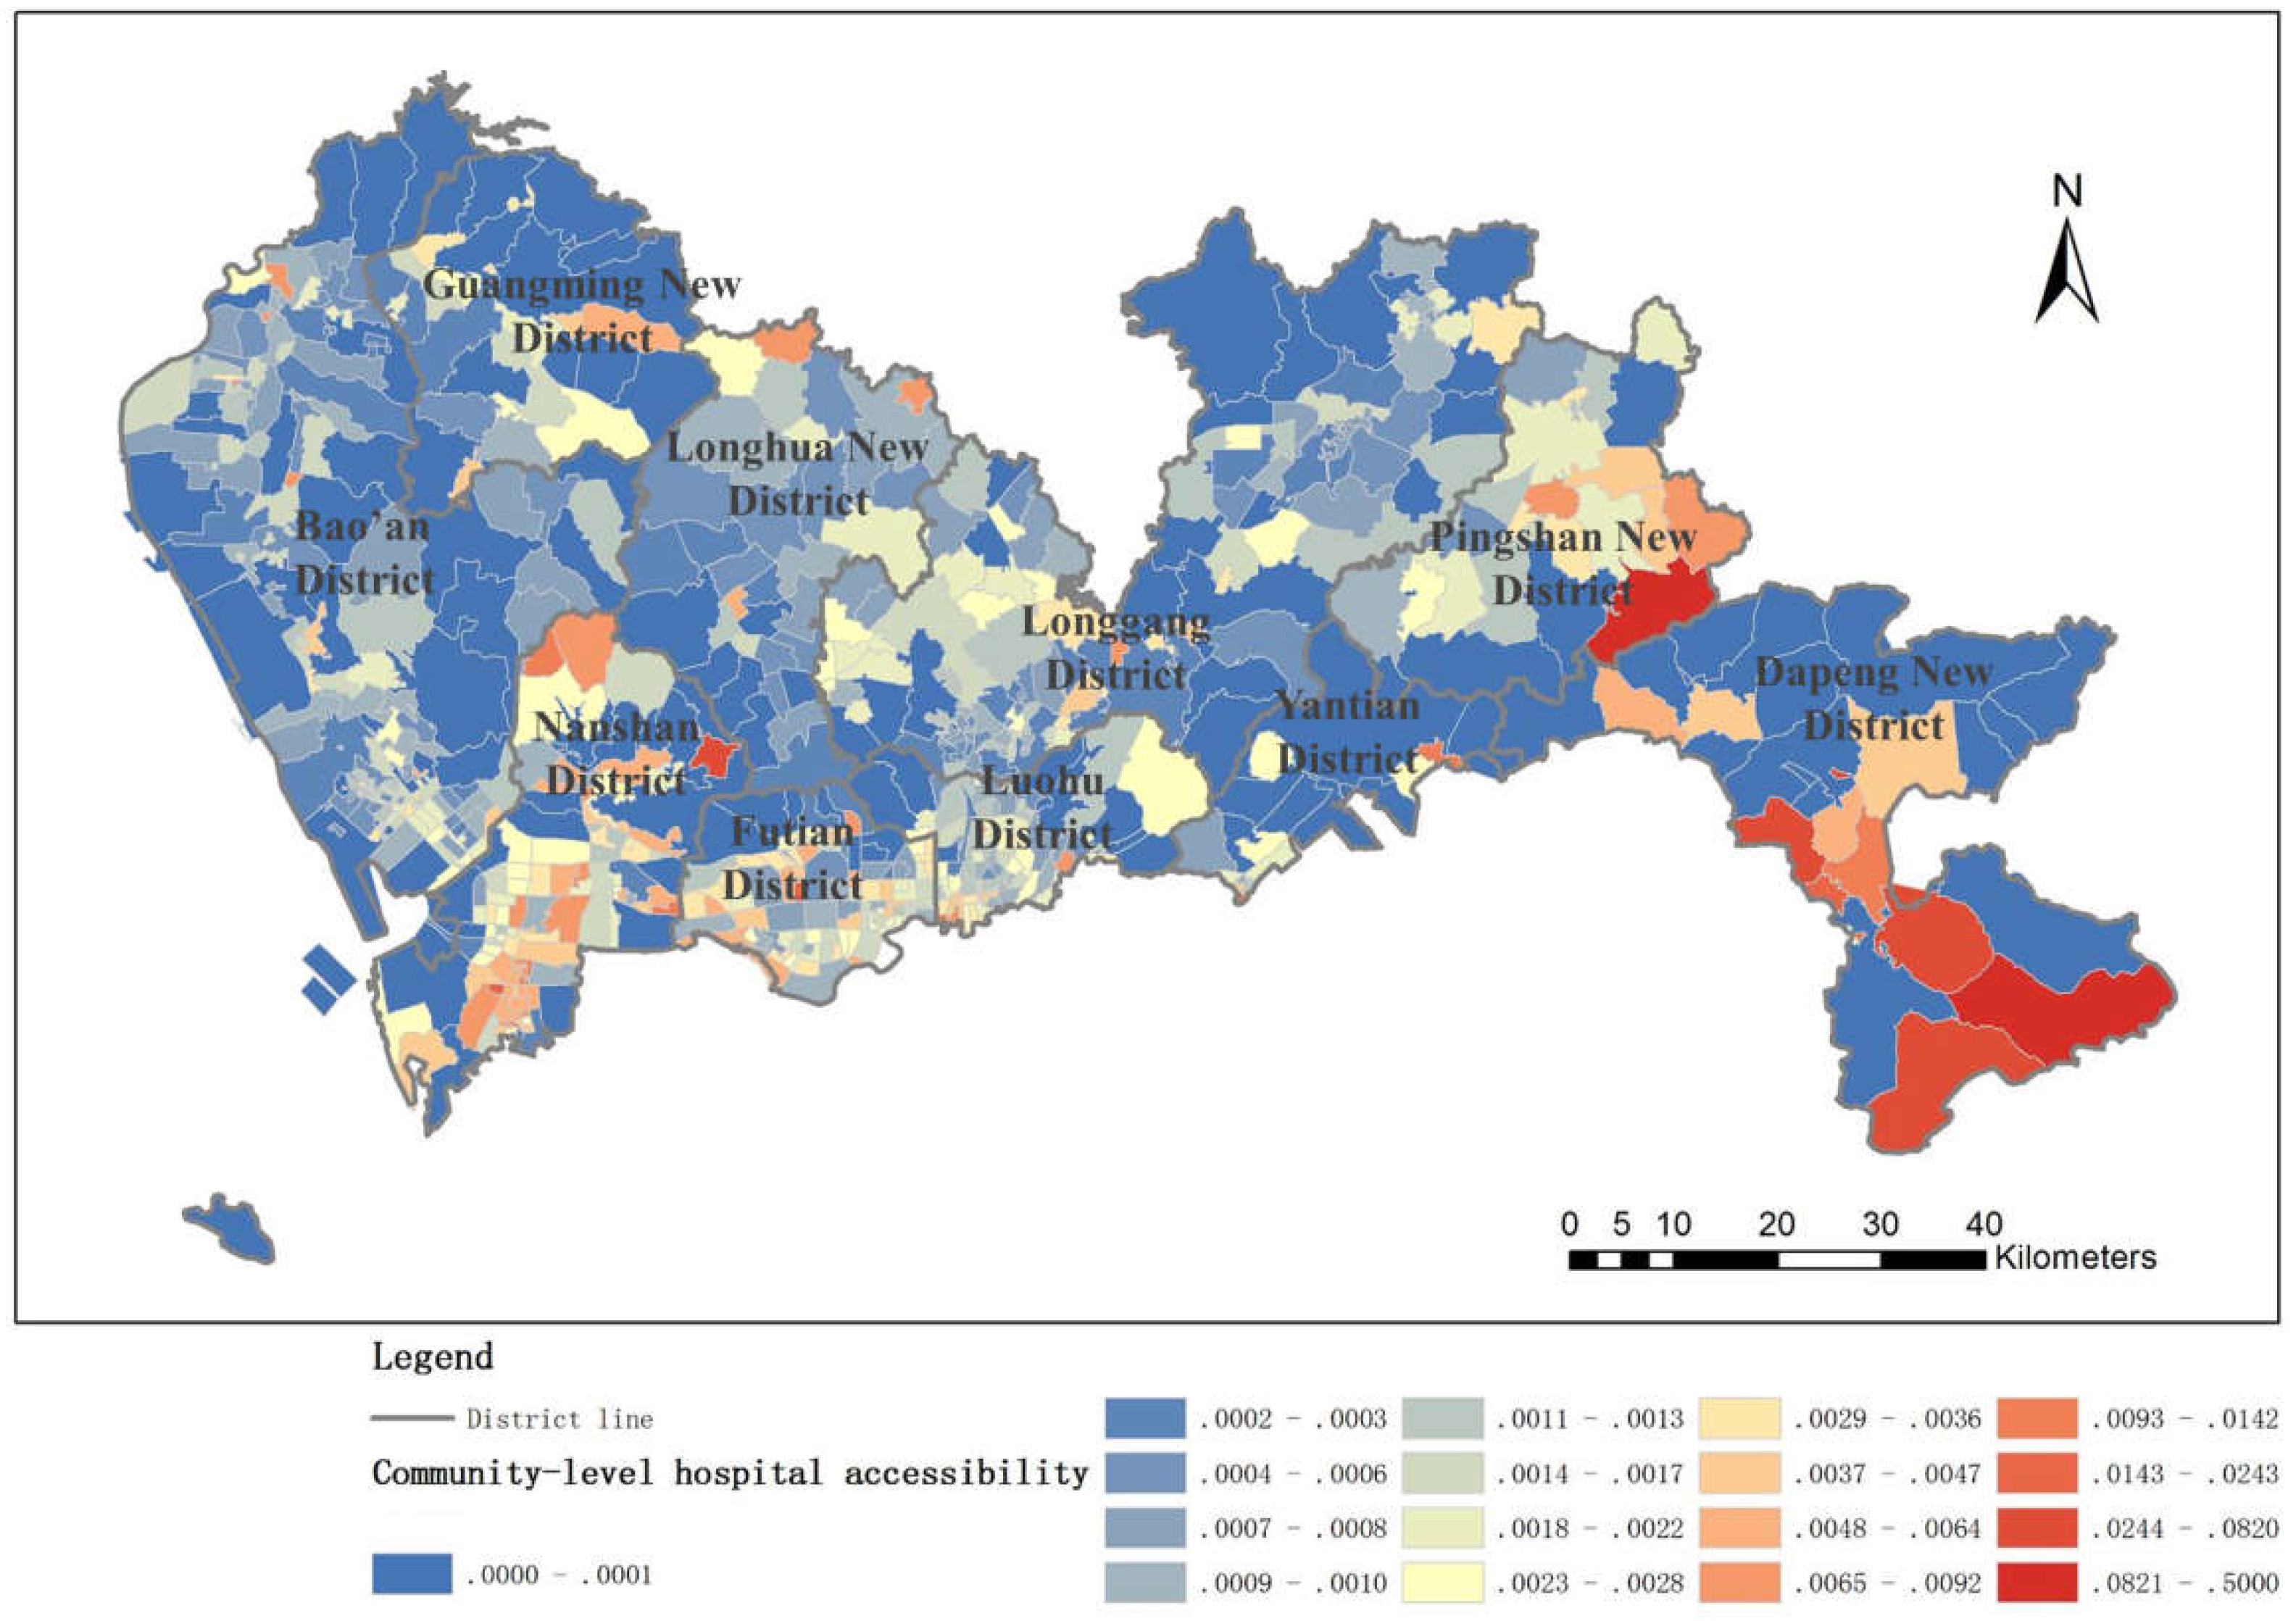
4.1.3. Community-Level Hospital Accessibility
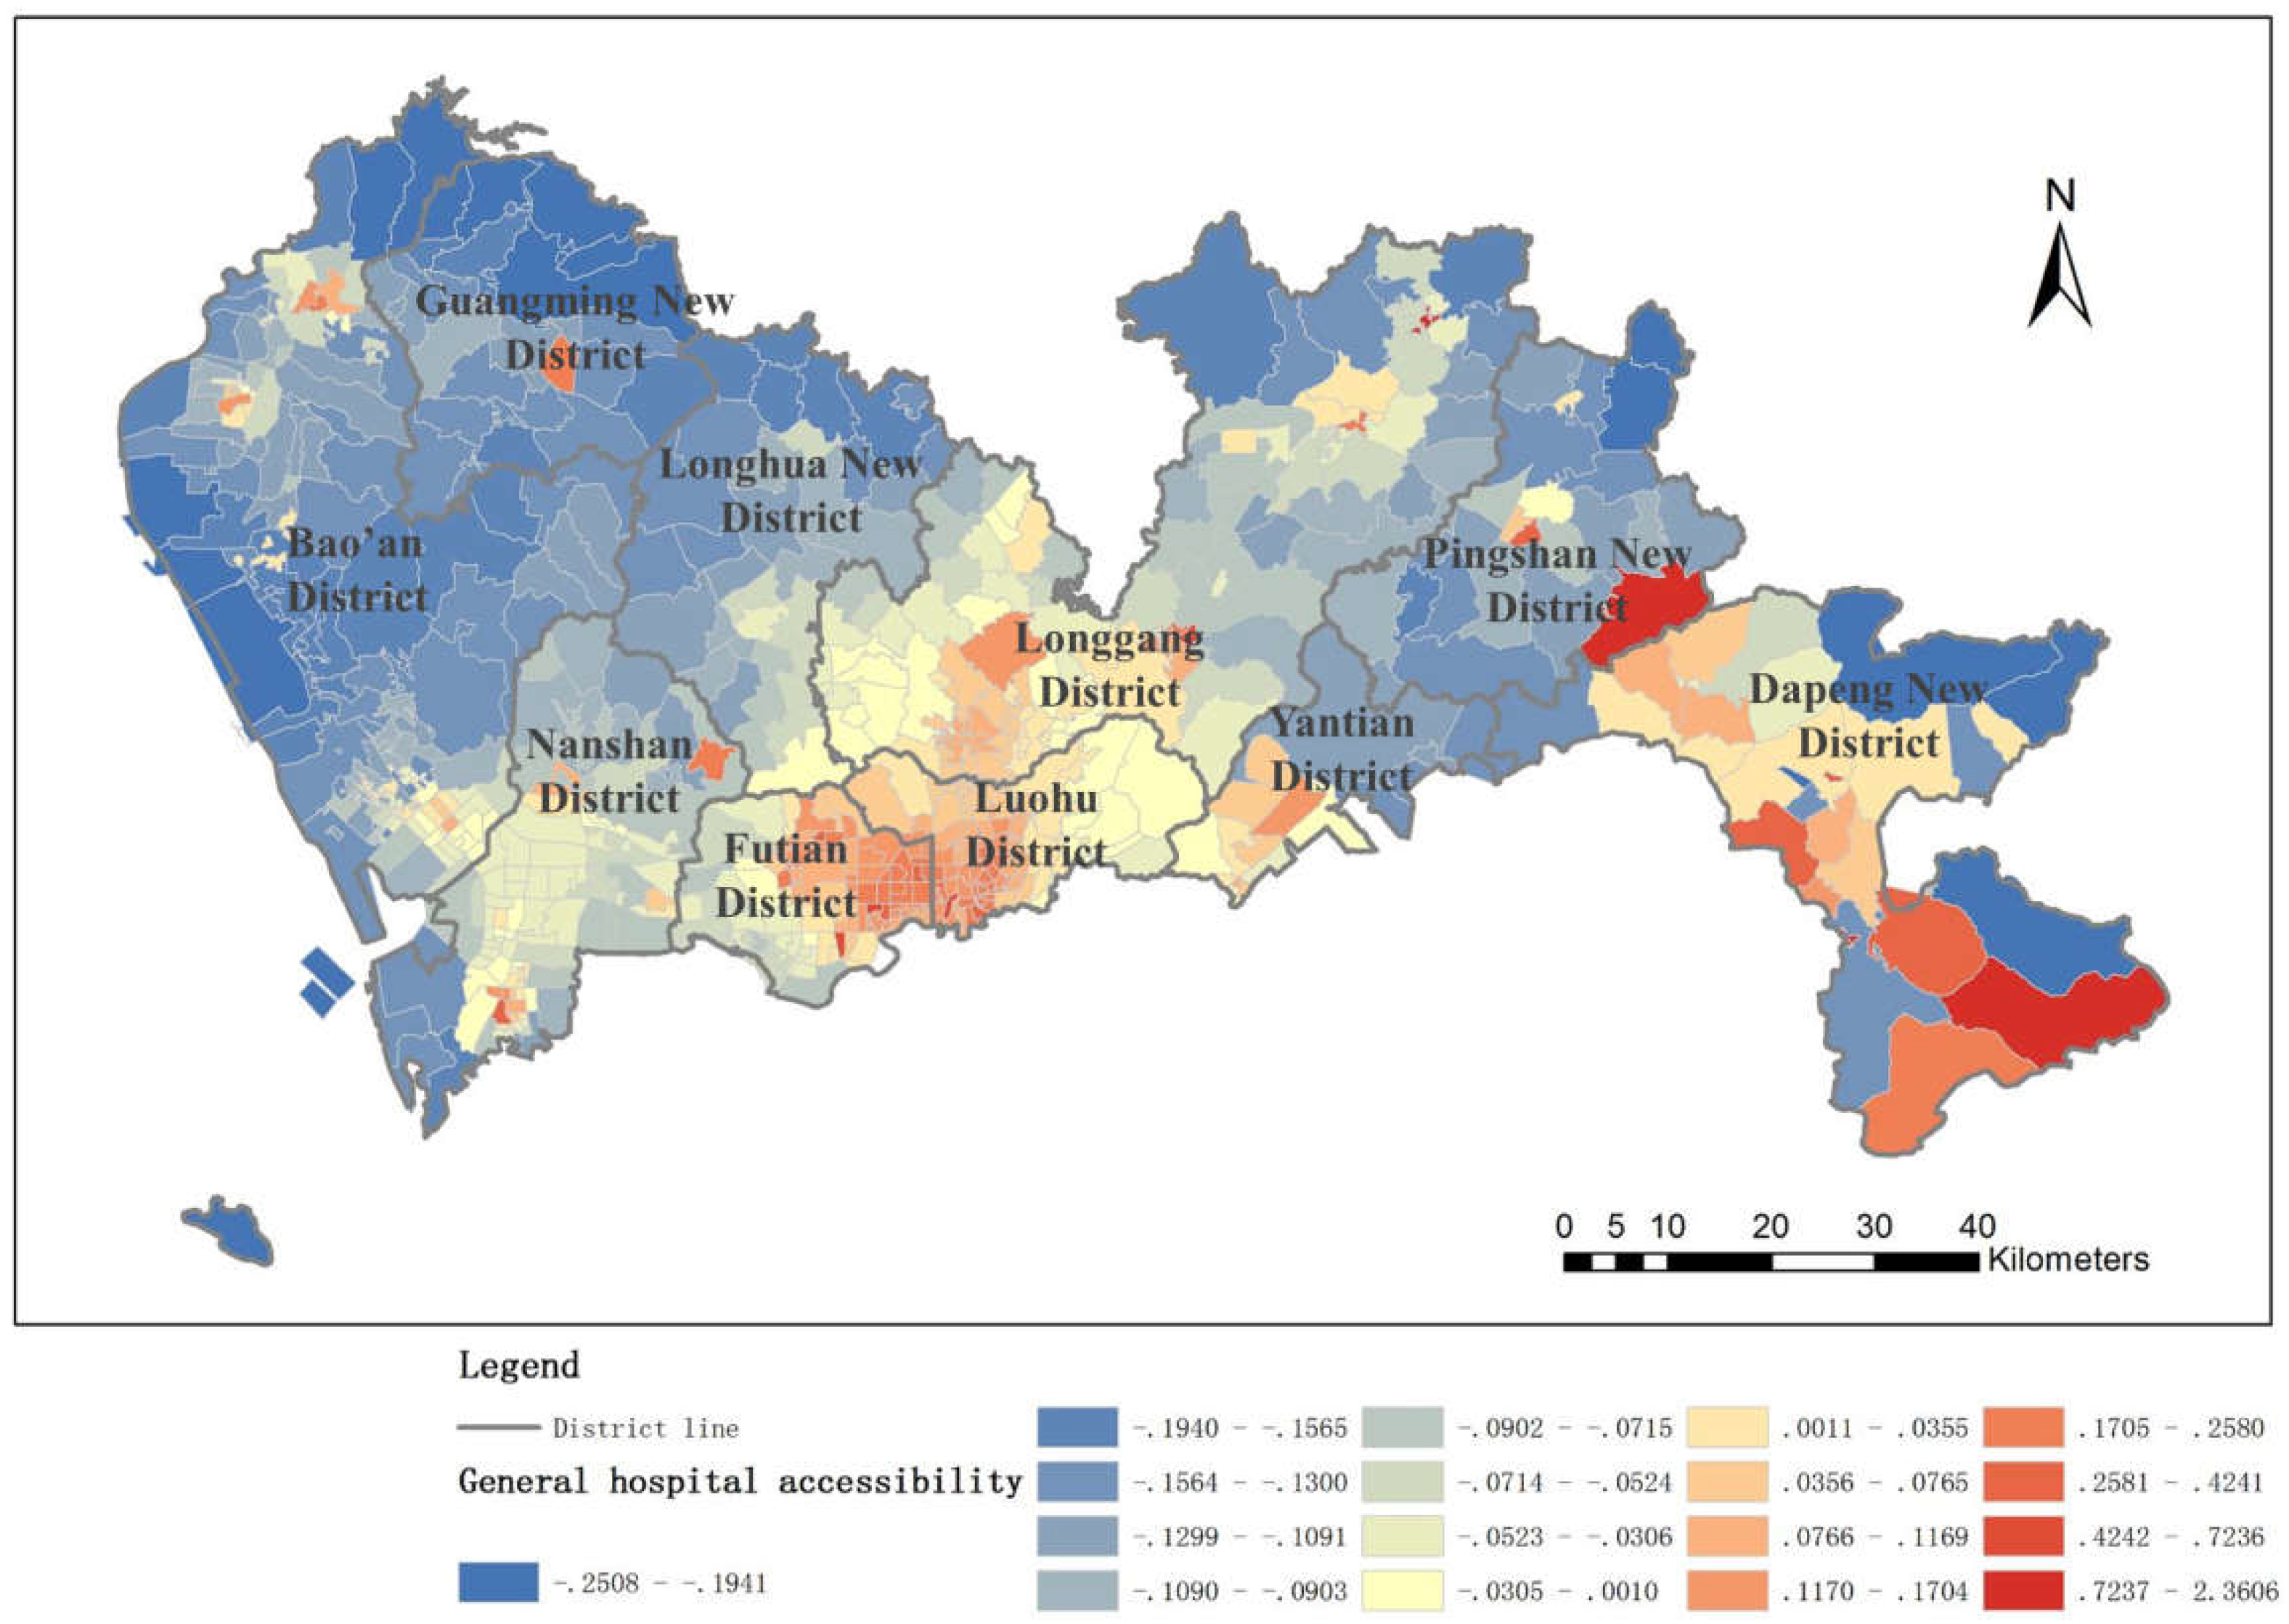
4.1.4. General Hospital Accessibility
4.2. Result of the Distribution Balance Evaluation
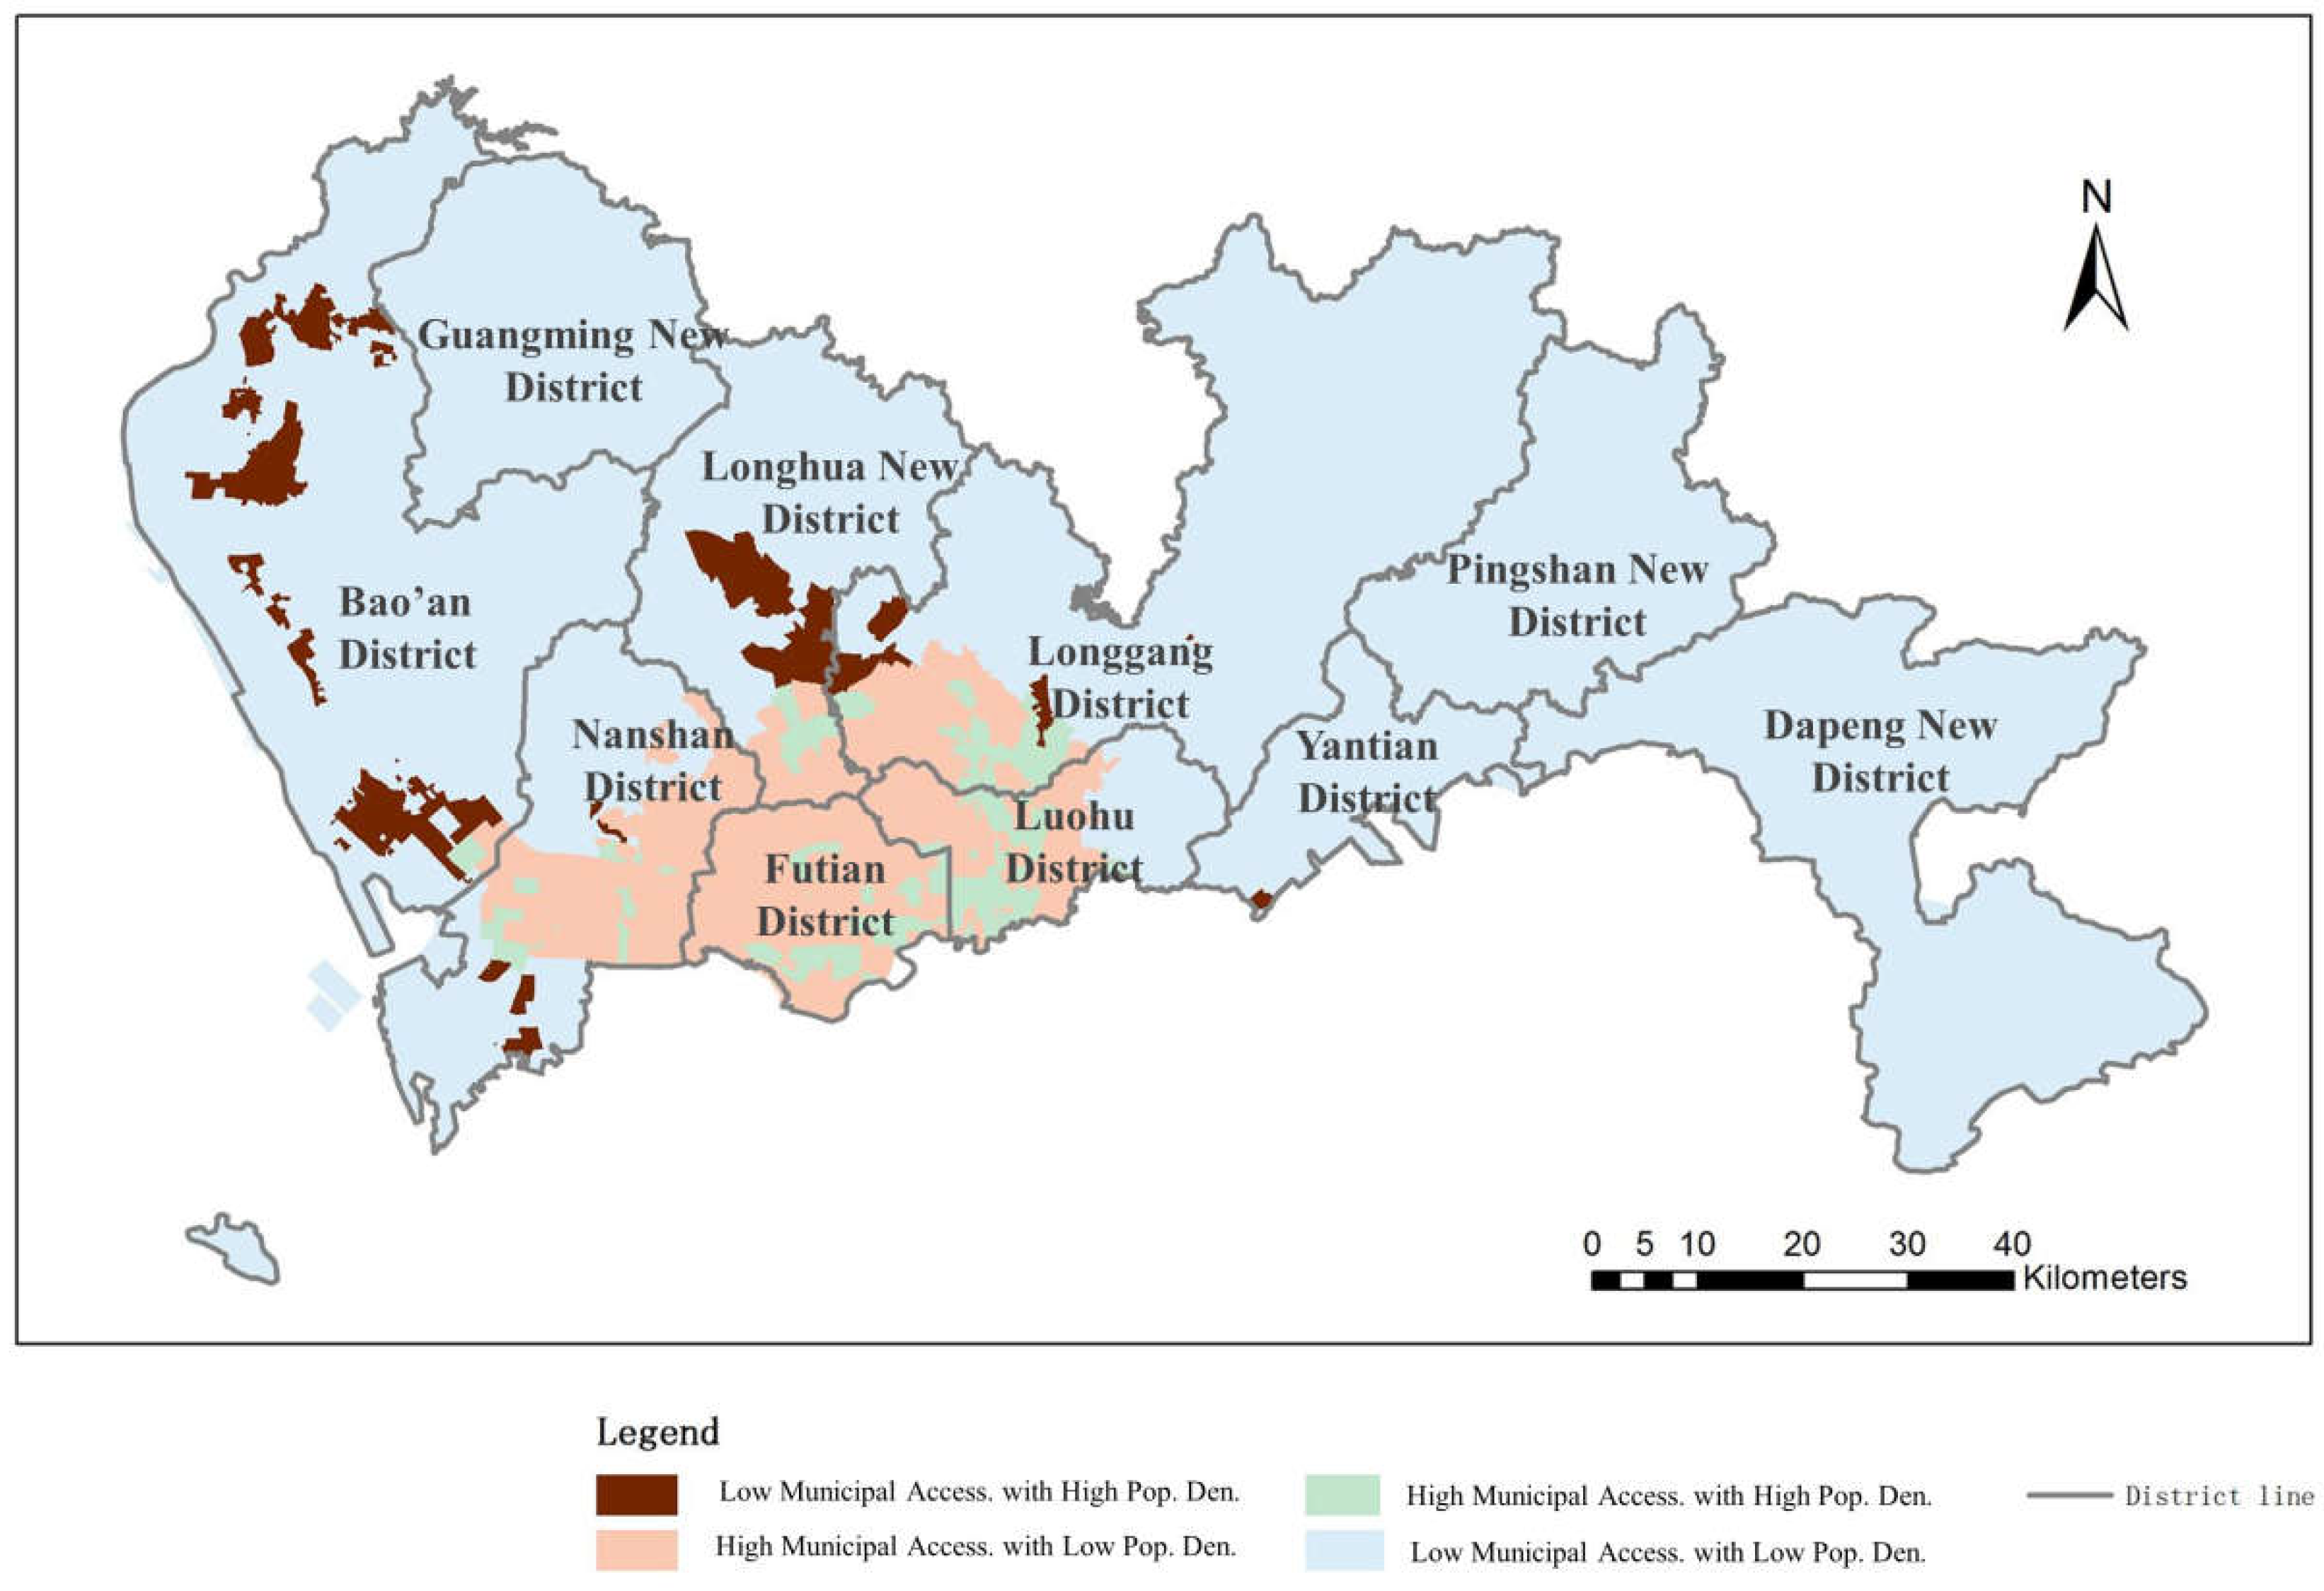
4.2.1. Municipal Hospital Accessibility Distribution Balance
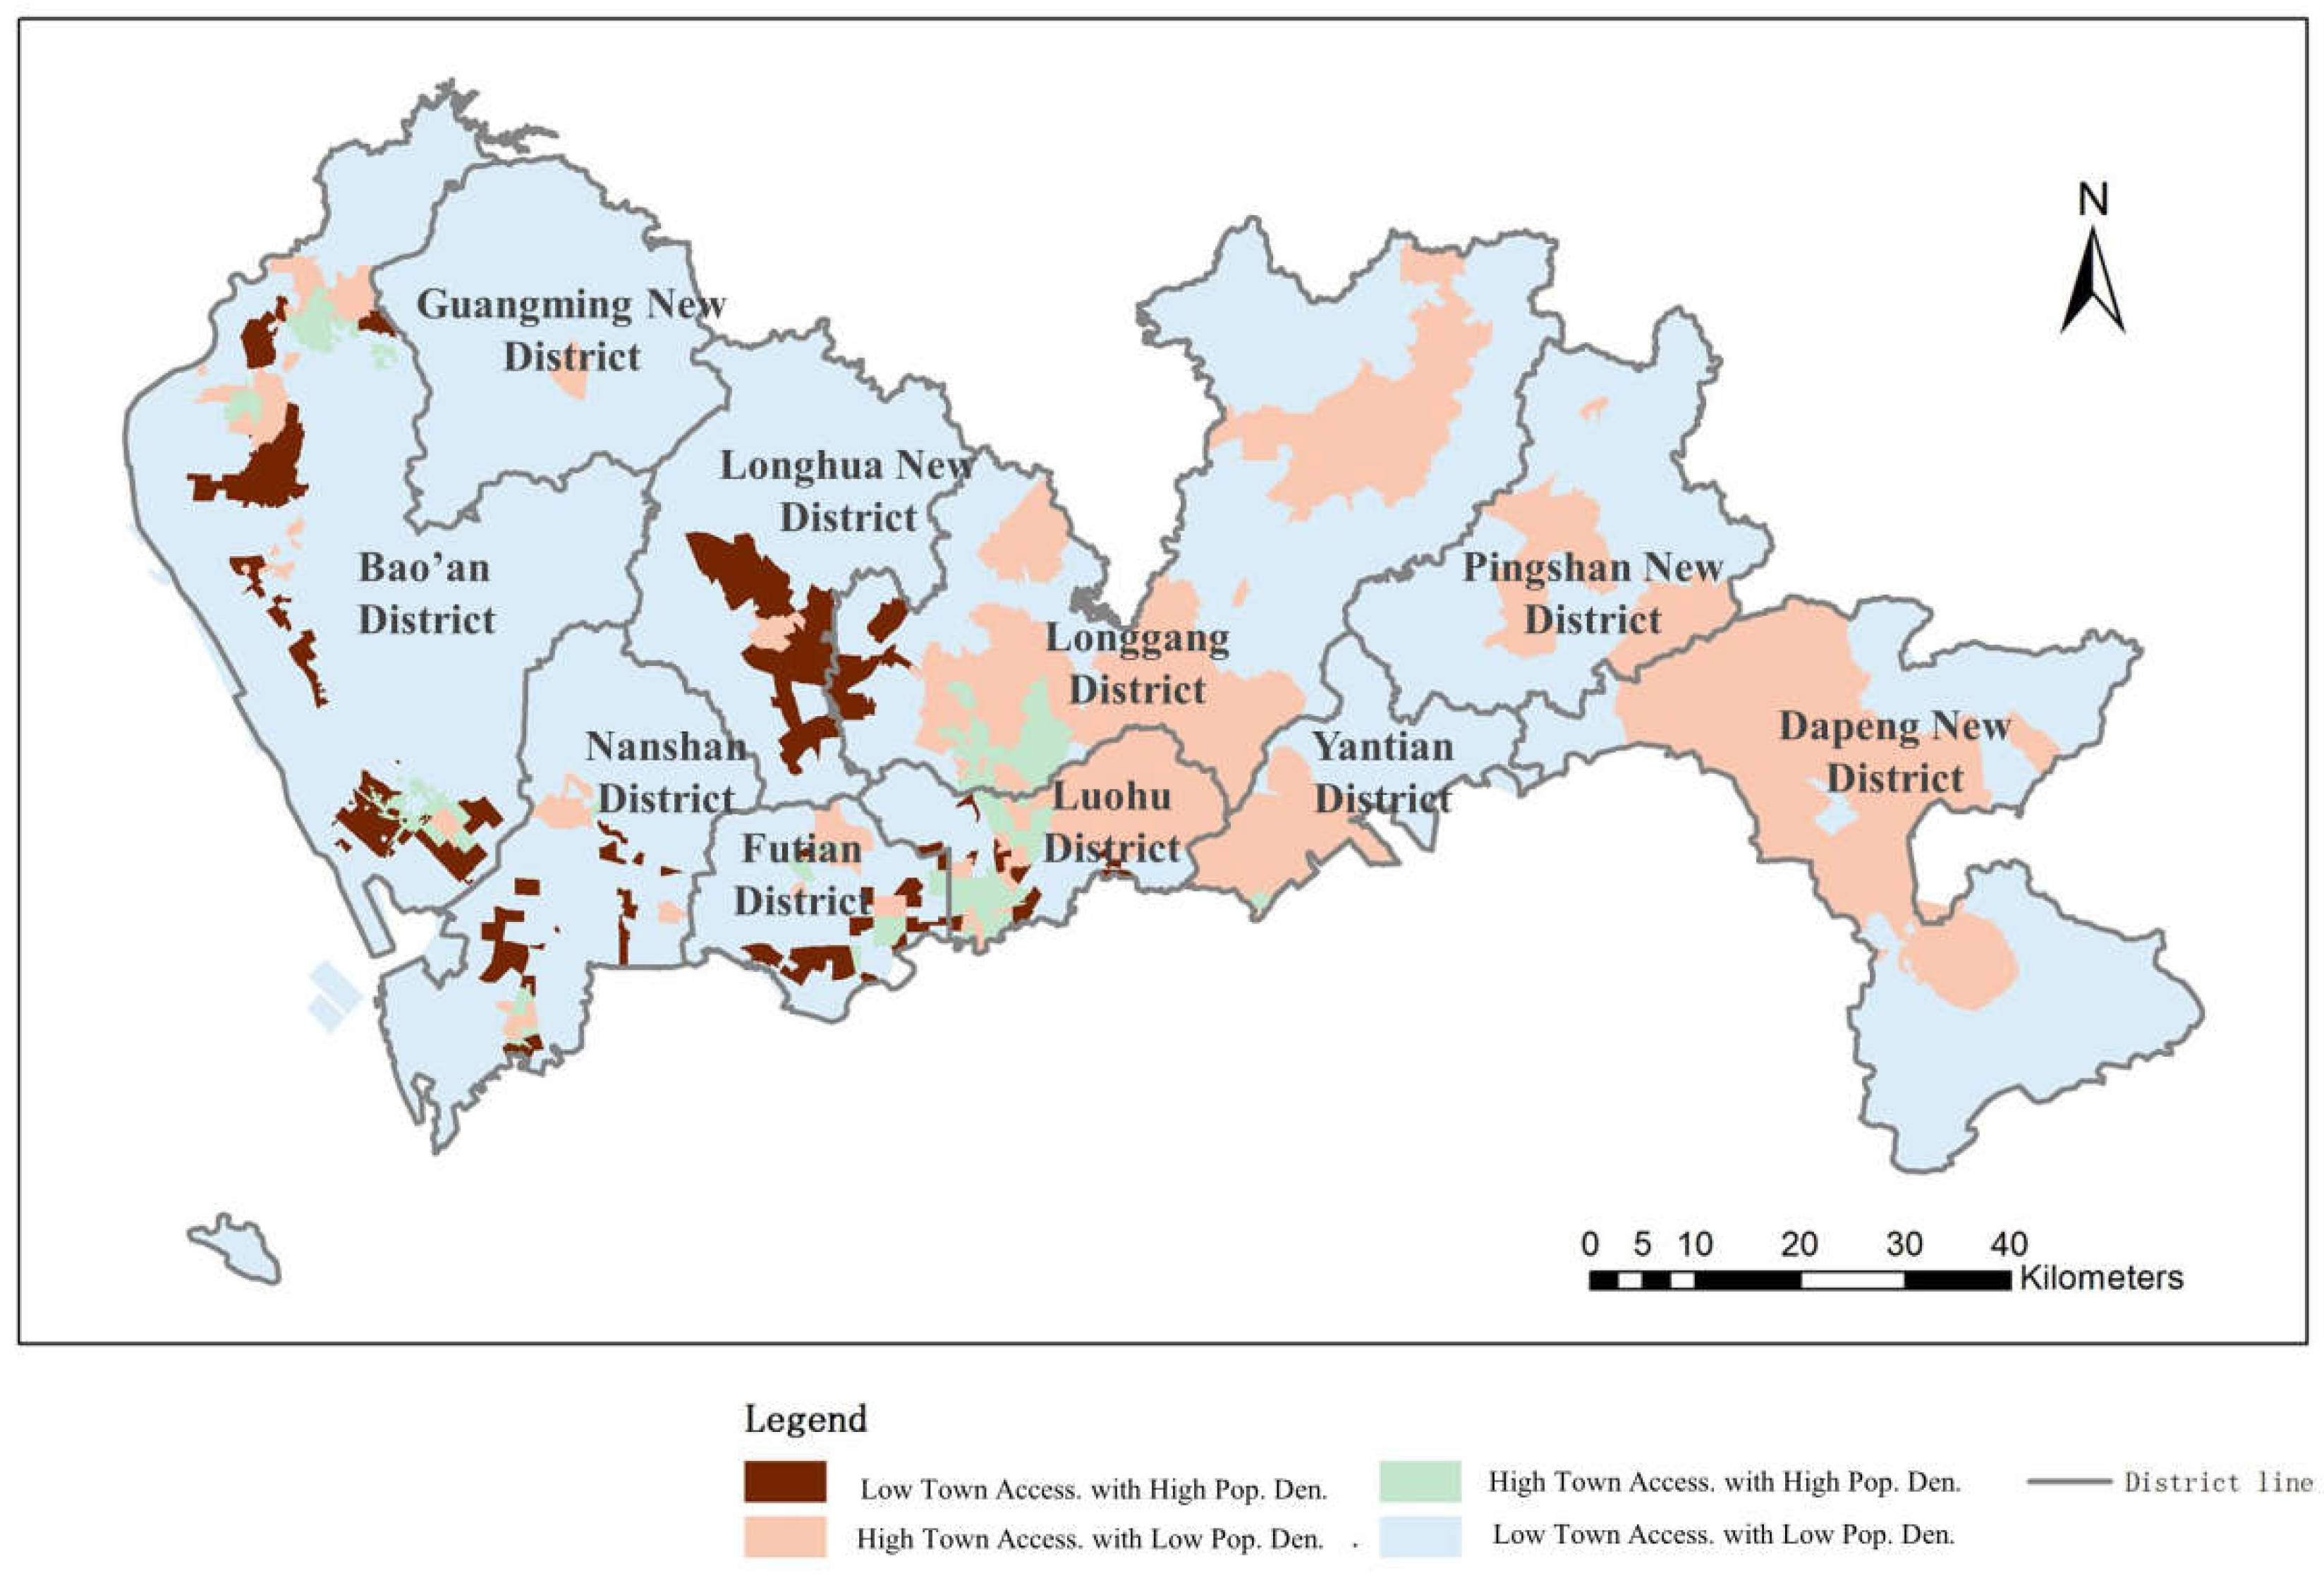
4.2.2. Town-Level Hospital Accessibility Distribution Balance
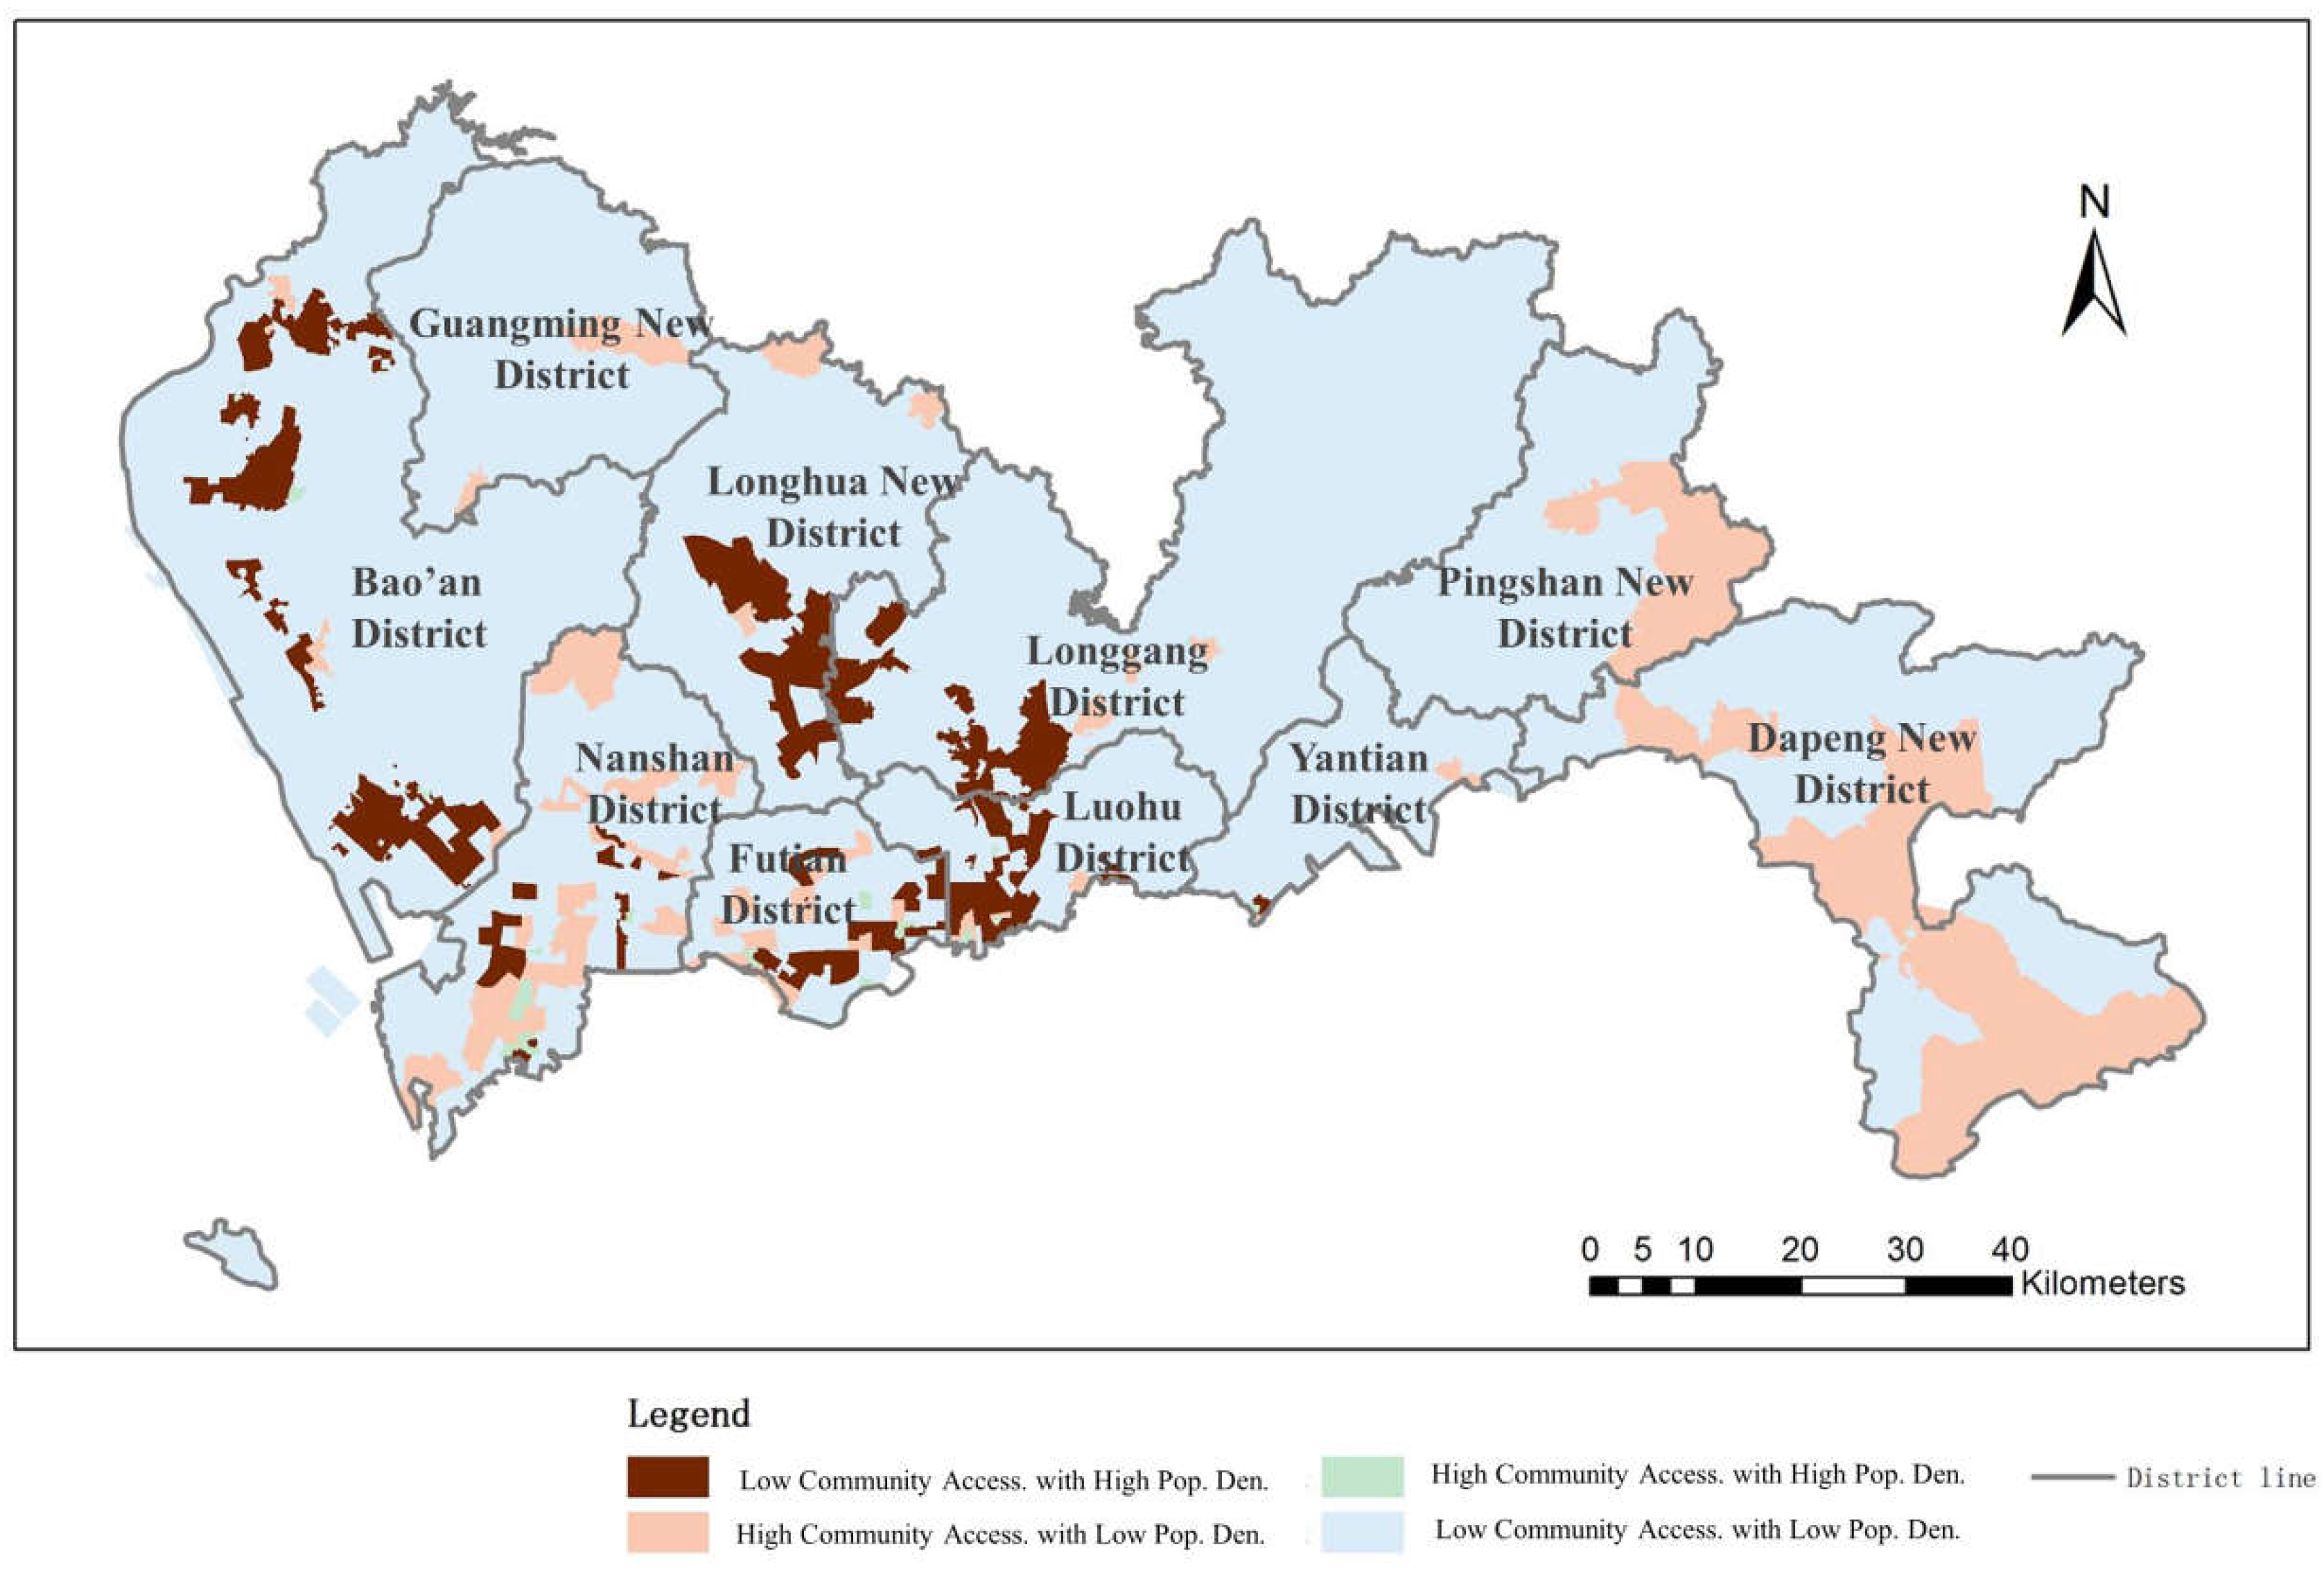
4.2.3. Community-Level Hospital Accessibility Distribution Balance
4.2.4. General Hospital Accessibility Distribution Balance
5. Conclusions
Author Contributions
Funding
Conflicts of Interest
References
- Gao, J.; Zhou, C.S.; Wang, Y.; Jiang, H. Spatial analysis on urban public service facilities of Guangzhou City during the economy system transformation. Geogr. Res. 2011, 30, 424–436. [Google Scholar] [CrossRef]
- Michalos, A.C.; Zumbo, B.D. Public services and the quality of life. Soc. Indic. Res. 1999, 48, 125–157. [Google Scholar] [CrossRef]
- Alonso, W. Location and Land Use; Harvard University Press: Cambridge, MA, USA, 1964; ISBN 9780674729568. [Google Scholar]
- McGrail, M.R. Spatial accessibility of primary health care utilising the two step floating catchment area method: An assessment of recent improvements. Int. J. Health Geogr. 2012, 11, 50. [Google Scholar] [CrossRef]
- Hutton, J.B. Restricted Dedication of Rights-of-Way for New Expressways or Other Limited access Facilities. Highway Res. Board Bulletin 1951, 38, 38–61. [Google Scholar]
- Haynes, R.; Lovett, A.; Sünnenberg, G. Potential accessibility, travel time, and consumer choice: Geographical variations in general medical practice registrations in eastern England. Environ. Plan A 2003, 35, 1733–1750. [Google Scholar] [CrossRef]
- Tanser, F.; Gijsbertsen, B.; Herbst, K. Modelling and understanding primary health care accessibility and utilization in rural South Africa: An exploration using a geographical information system. Soc. Sci. Med. 2006, 63, 691–705. [Google Scholar] [CrossRef]
- Langford, M.; Higgs, G. Measuring potential access to primary healthcare services: The influence of alternative spatial representations of population. Prof. Geogr. 2006, 58, 294–306. [Google Scholar] [CrossRef]
- Dewulf, B.; Neutens, T.; De Weerdt, Y.; Van de Weghe, N. Accessibility to primary health care in Belgium: An evaluation of policies awarding financial assistance in shortage areas. BMC Fam. Pr. 2013, 14, 122. [Google Scholar] [CrossRef]
- Mao, L.; Nekorchuk, D. Measuring spatial accessibility to healthcare for populations with multiple transportation modes. Health Place 2013, 24, 115–122. [Google Scholar] [CrossRef] [PubMed]
- Wang, L. Unequal spatial accessibility of integration-promoting resources and immigrant health: A mixed-methods approach. Appl. Geogr. 2018, 92, 140–149. [Google Scholar] [CrossRef]
- Yin, C.; He, Q.; Liu, Y.; Chen, W.; Gao, Y. Inequality of public health and its role in spatial accessibility to medical facilities in China. Appl. Geogr. 2018, 92, 50–62. [Google Scholar] [CrossRef]
- Pan, X.; Kwan, M.P.; Yang, L.; Zhou, S.; Zuo, Z.; Wan, B. Evaluating the Accessibility of Healthcare Facilities Using an Integrated Catchment Area Approach. Int. J. Environ. Res. Public Health 2018, 15, 2051. [Google Scholar] [CrossRef]
- Yang, G.; Song, C.; Shu, H.; Zhang, J.; Pei, T.; Zhou, C. Assessing patient bypass behavior using taxi trip origin–Destination (OD) data. ISPRS Int. J. Geo-Inf 2016, 5, 157. [Google Scholar] [CrossRef]
- Luo, W.; Wang, F. Measures of spatial accessibility to health care in a GIS environment: Synthesis and a case study in the Chicago Region. Environ. Plan. B Plan. Des. 2003, 30, 865–884. [Google Scholar] [CrossRef]
- McGrail, M.R.; Humphreys, J.S. Measuring spatial accessibility to primary care in rural areas: Improving the effectiveness of the two-step floating catchment area method. Appl. Geogr. 2009, 29, 533–541. [Google Scholar] [CrossRef]
- Connor, R.A.; Hillson, S.D.; Krawelski, J.E. Competition, professional synergism, and the geographic distribution of rural physicians. Med. Care 1995, 33, 1067–1078. [Google Scholar] [CrossRef] [PubMed]
- Council on Graduate Medical Education: Tenth Report: Physician Distribution and Health Care Challenges in Rural and Inner-City Areas; U.S. Department of Health and Human Services, Public Health Service, Health Resources and Services Administration: Washington, DC, USA, 1998.
- Schonfeld, H.K.; Heston, J.F.; Falk, I.S. Numbers of physicians required for primary medical care. N. Engl. J. Med. 1972, 286, 571–576. [Google Scholar] [CrossRef]
- Connor, R.A.; Kralewski, J.E.; Hillson, S.D. Measuring geographic access to health care in rural areas. Med. Care Rev. 1994, 51, 337–377. [Google Scholar] [CrossRef] [PubMed]
- Openshaw, S. The Modifiable Areal Unit Problem; Geo Books: Norwick, Norfolk, UK, 1984. [Google Scholar]
- Fyer, G.E., Jr.; Drisko, J.; Krugman, R.D.; Vojir, C.P.; Prochazka, A.; Miyoshi, T.J.; Miller, M.E. Multi-method assessment of access to primary medical care in rural Colorado. J. Rural Health 1999, 15, 113–121. [Google Scholar] [CrossRef]
- Joseph, A.E.; Bantock, P.R. Measuring potential physical accessibility to general practitioners in rural areas: A method and case study. Soc. Sci. Med. 1982, 16, 85–90. [Google Scholar] [CrossRef]
- Schuurman, N.; Bérubé, M.; Crooks, V.A. Measuring potential spatial access to primary health care physicians using a modified gravity model. Can. Geogr. 2010, 54, 29–45. [Google Scholar] [CrossRef]
- Wang, F.; Luo, W. Assessing spatial and nonspatial factors for healthcare access: Towards an integrated approach to defining health professional shortage areas. Health Place 2005, 11, 131–146. [Google Scholar] [CrossRef]
- Wang, F. Measurement, optimization, and impact of health care accessibility: A methodological review. Ann. Assoc. Am. Geogr. 2012, 102, 1104–1112. [Google Scholar] [CrossRef]
- Radke, J.; Mu, L. Spatial decompositions, modeling and mapping service regions to Predict Access to Social Programs. Geogr. Inf. Sci. 2000, 6, 105–112. [Google Scholar] [CrossRef]
- Luo, W.; Qi, Y. An enhanced two-step floating catchment area (E2SFCA) method for measuring spatial accessibility to primary care physicians. Health Place 2009, 15, 1100–1107. [Google Scholar] [CrossRef]
- Langford, M.; Fry, R.; Higgs, G. Measuring transit system accessibility using a modified two-step floating catchment technique. Int. J. Geogr. Inf. Sci. 2012, 26, 193–214. [Google Scholar] [CrossRef]
- Delamater, P.L. Spatial accessibility in suboptimally configured health care systems: A modified two-step floating catchment area (M2SFCA) metric. Health Place 2013, 24, 30–43. [Google Scholar] [CrossRef] [PubMed]
- Kaur Khakh, A.; Fast, V.; Shahid, R. Spatial Accessibility to Primary Healthcare Services by Multimodal Means of Travel: Synthesis and Case Study in the City of Calgary. Int. J. Environ. Res. Public Health 2019, 16, 170. [Google Scholar] [CrossRef]
- Zhu, X.; Tong, Z.; Liu, X.; Li, X.; Lin, P.; Wang, T. An Improved Two-Step Floating Catchment Area Method for Evaluating Spatial Accessibility to Urban Emergency Shelters. Sustainability 2018, 10, 2180. [Google Scholar] [CrossRef]
- Luo, J.; Chen, G.; Li, C.; Xia, B.; Sun, X.; Chen, S. Use of an E2SFCA Method to Measure and Analyse Spatial Accessibility to Medical Services for Elderly People in Wuhan, China. Int. J. Environ. Res. Public Health 2018, 15, 1503. [Google Scholar] [CrossRef] [PubMed]
- Wu, H.; Liu, L.; Yu, Y.; Peng, Z. Evaluation and Planning of Urban Green Space Distribution Based on Mobile Phone Data and Two-Step Floating Catchment Area Method. Sustainability 2018, 10, 214. [Google Scholar] [CrossRef]
- Munoz, U.H.; Källestål, C. Geographical accessibility and spatial coverage modeling of the primary health care network in the Western Province of Rwanda. Int. J. Health Geogr. 2012, 11, 40. [Google Scholar] [CrossRef]
- Neutens, T. Accessibility, equity and health care: Review and research directions for transport geographers. J. Transp. Geogr. 2015, 43, 14–27. [Google Scholar] [CrossRef]
- Peeters, D.; Thomas, I. Distance predicting functions and applied location-allocation models. J. Geogr. Syst. 2000, 2, 167–184. [Google Scholar] [CrossRef]
- Tao, Z.; Cheng, Y.; Dai, T.; Rosenberg, M.W. Spatial optimization of residential care facility locations in Beijing, China: Maximum equity in accessibility. Int. J. Health Geogr. 2014, 13, 33. [Google Scholar] [CrossRef] [PubMed]
- Ministry of Housing and Urban-Rual Development of the People’s Republic of China. Code for Design of General Hospital. Available online: http://www.mohurd.gov.cn/wjfb/ (accessed on 29 March 2019).
- Song, Z.; Chen, W.; Che, Q.; Zhang, L. Measurement of spatial accessibility to health care facilities and defining health professional shortage areas based on improved potential model—A case study of Rudong county in Jiangsu province. Sci. Geogr. Sin. 2010, 30, 213–219. [Google Scholar]
- Kong, X.; Liu, Y.; Wang, Y.; Tong, D.; Zhang, J. Investigating public facility characteristics from a spatial interaction perspective: A case study of Beijing hospitals using taxi data. ISPRS Int. J. Geo-Inf. 2017, 6, 38. [Google Scholar] [CrossRef]
- Kelobonye, K.; Mccarney, G.; Xia, J.; Swapan, M.S.; Mao, F.; Zhou, H. Relative accessibility analysis for key land uses: A spatial equity perspective. J. Transp. Geogr. 2019, 82–93. [Google Scholar] [CrossRef]
- Tsou, K.W.; Hung, Y.T.; Chang, Y.L. An accessibility-based integrated measure of relative spatial equity in urban public facilities. Cities 2005, 22, 424–435. [Google Scholar] [CrossRef]
- Wang, Y.; Tong, D.; Li, W.; Liu, Y. Optimizing the spatial relocation of hospitals to reduce urban traffic congestion: A case study of Beijing. T GIS 2019. [Google Scholar] [CrossRef]
- Gong, Y.; Lin, Y.; Duan, Z. Exploring the spatiotemporal structure of dynamic urban space using metro smart card records. Comput. Environ. Urban Syst. 2017, 64, 169–183. [Google Scholar] [CrossRef]
- Ren, M.; Lin, Y.; Jin, M.; Duan, Z.; Gong, Y.; Liu, Y. Examining the effect of land-use function complementarity on intra-urban spatial interactions using metro smart card records. Transportation 2019, 1–23. [Google Scholar] [CrossRef]


| Types of Medical Service Facilities | Transportation Mode | Truncation Distance | Attenuation Coefficient |
|---|---|---|---|
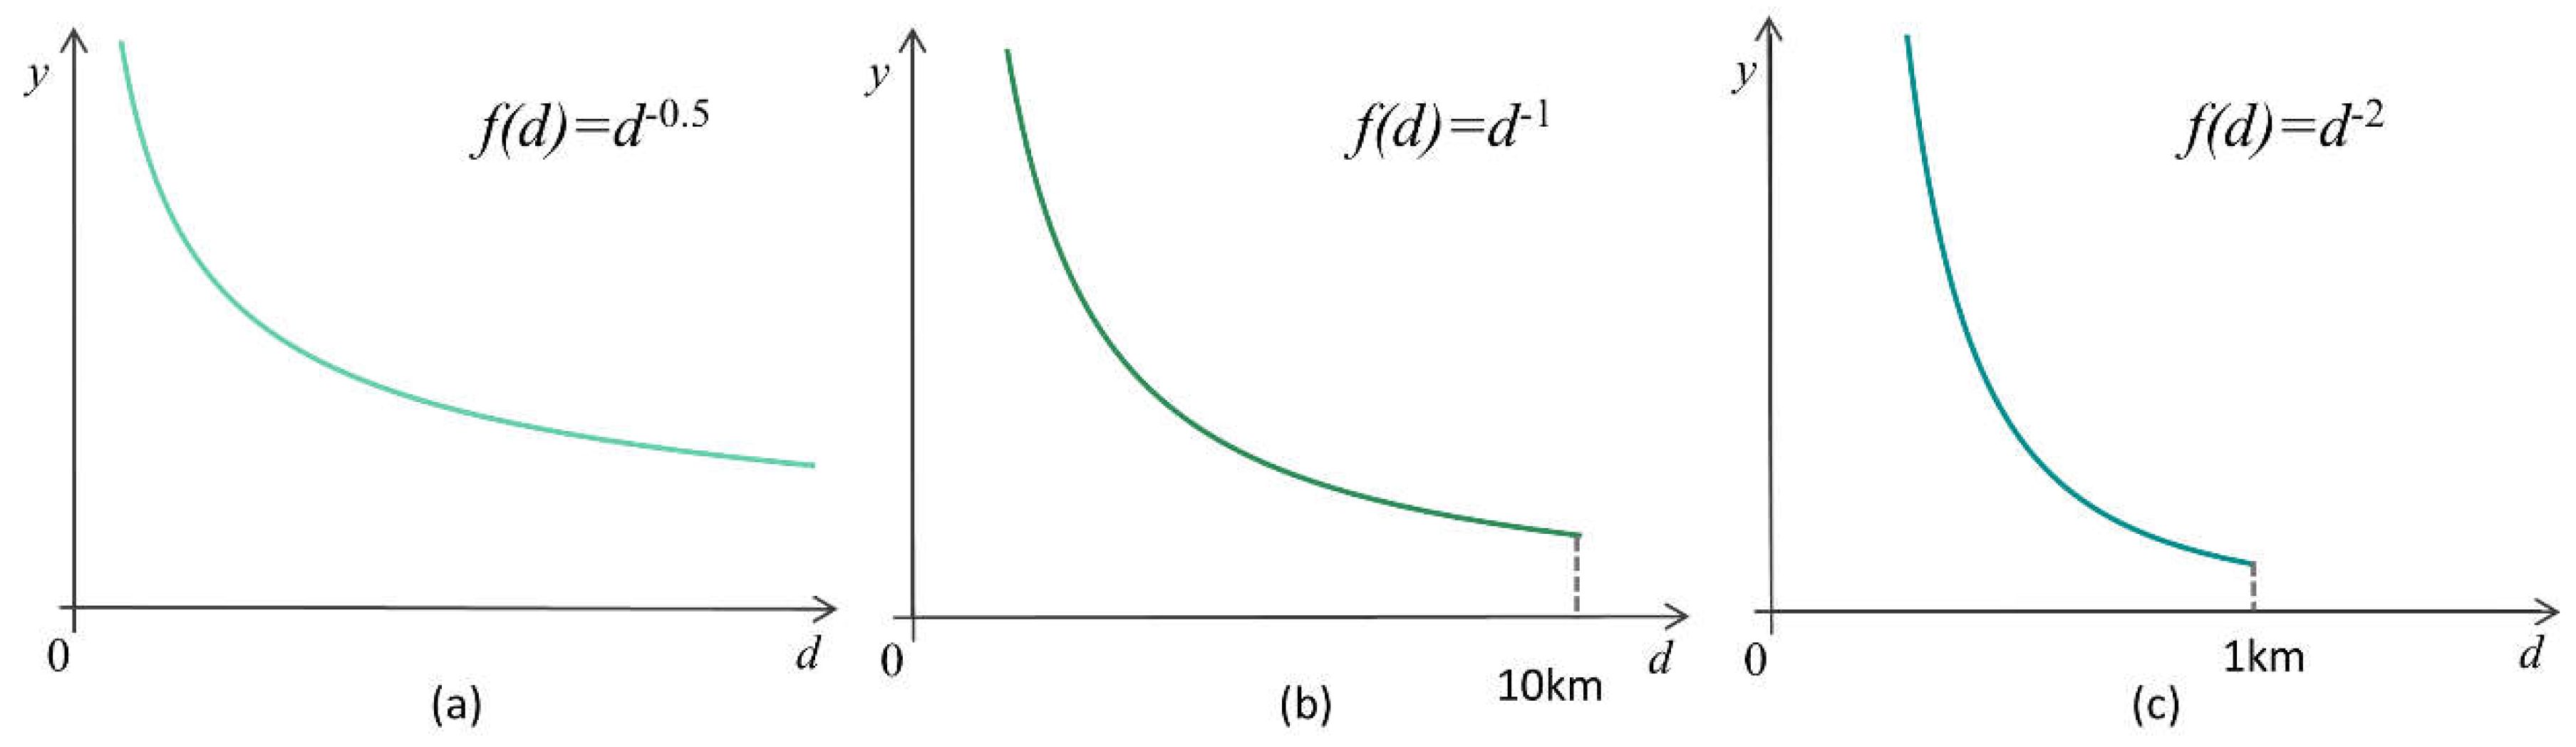
| Community-level hospitals | Walk | 1000 m | 2 |
| Town-level hospitals | Vehicle travel | 10,000 m | 1 |
| Municipal hospitals | Vehicle travel | Unlimited | 0.5 |
© 2019 by the authors. Licensee MDPI, Basel, Switzerland. This article is an open access article distributed under the terms and conditions of the Creative Commons Attribution (CC BY) license (http://creativecommons.org/licenses/by/4.0/).
Share and Cite
Jin, M.; Liu, L.; Tong, D.; Gong, Y.; Liu, Y. Evaluating the Spatial Accessibility and Distribution Balance of Multi-Level Medical Service Facilities. Int. J. Environ. Res. Public Health 2019, 16, 1150. https://0-doi-org.brum.beds.ac.uk/10.3390/ijerph16071150
Jin M, Liu L, Tong D, Gong Y, Liu Y. Evaluating the Spatial Accessibility and Distribution Balance of Multi-Level Medical Service Facilities. International Journal of Environmental Research and Public Health. 2019; 16(7):1150. https://0-doi-org.brum.beds.ac.uk/10.3390/ijerph16071150
Chicago/Turabian StyleJin, Meihan, Lu Liu, De Tong, Yongxi Gong, and Yu Liu. 2019. "Evaluating the Spatial Accessibility and Distribution Balance of Multi-Level Medical Service Facilities" International Journal of Environmental Research and Public Health 16, no. 7: 1150. https://0-doi-org.brum.beds.ac.uk/10.3390/ijerph16071150