1. Introduction
Non-communicable diseases (NCDs) have become the major health threat in low-, middle-, and high-income countries [
1,
2,
3], and they account for more than 50% of the global disease burden [
4,
5]. NCDs are also responsible for 70% of deaths worldwide, and more than 40% of these deaths are premature [
3]. Aging and changed lifestyle can make the status worse [
6,
7]. It is estimated that in 2030, over three-quarters of all deaths will be caused by NCDs [
1,
3]. NCDs can not only influence an individual’s life but can also impede sustainable development [
1,
8,
9,
10], thereby attracting attention from high-level politicians [
8,
10]. The current status of NCDs in China is no better than that in other countries. According to the Fifth Chinese National Health Services Survey, conducted in 2013, the prevalence rate of NCDs in China is 24.5% (much higher than the 18.9% in 2008), and 78.4% of the aged (over 65 years) present at least one NCD [
11]. The World Bank and World health Organization indicate that NCDs are responsible for approximately 70% of the total disease burden and 89% of deaths in China [
1,
12].
Patients with NCDs present a large demand for health services and health resources [
6,
13]. Under such circumstances, the Chinese government hopes that the patients with NCDs in stable or rehabilitation stages can be managed by primary medical institutions [
14,
15]. However, China has a weak primary healthcare system [
16,
17]. If patients with NCDs go to primary medical institutions for common health needs, it is currently unknown whether their health will suffer compared to those who go to high-level hospitals.
To date, many studies have been performed on factors influencing the health status of patients with NCDs [
18,
19,
20,
21,
22,
23,
24,
25,
26]. These studies mainly focused on psychiatric condition [
21,
22,
24,
25], disease progression [
18,
20,
21,
22,
24], comorbidities [
23,
25], health-risk behavior [
19,
26], and demographic characteristics [
18,
20,
24,
26]. Few studies have focused on the level of providers.
In this study, we selected patients who were seeking health care only in hospitals and those only in community health centers (or primary medical institution) to analyze the influence of provider level on the health status of patients with NCDs. The results of this study can ease the public’s worry on capability and service quality for primary medical institutions and bring support for health policy making in China.
2. Materials and Methods
2.1. Setting and Study Sample
This is a follow-up observation study. Data was obtained from the Surveillance of Health-seeking Behavior in Hubei province (the third stage), which was conducted by the Health and Family Planning Commission of Hubei Province. Participants were selected from the samples of the Fifth National Health Service Survey of China in 2013, which was based on multi-stage stratified cluster random sampling. A total of 330 households (936 people in total) in Qingshan District, Wuhan City, Hubei Province, were followed up. The surveillance was approved by all the sample families prior to the data collection, with the commitment that collected information will be confidential. Experienced general practitioners from the local community health centers were employed to collect information about health service utilization (including all the outpatient and inpatient services and corresponding institutions, diseases, and fees) from participants by household survey at the end of each month. Health-related quality of life (HRQoL) is a common measure to evaluate the effect of an intervention on patients’ health status [
27]. It was measured by the Chinese version of EQ-5D-3L (EQ-5D) monthly; this measure is widely used and highly recommended [
28,
29,
30]. Directors of community health centers were employed as supervisors to ensure there was no logical errors, wrong items, or absent items in the questionnaire. The study period was six months (July–December 2016), and each family was investigated six times. The baseline survey was conducted during the first interview in July, and information on demographics, socioeconomic characteristics, and health status was collected.
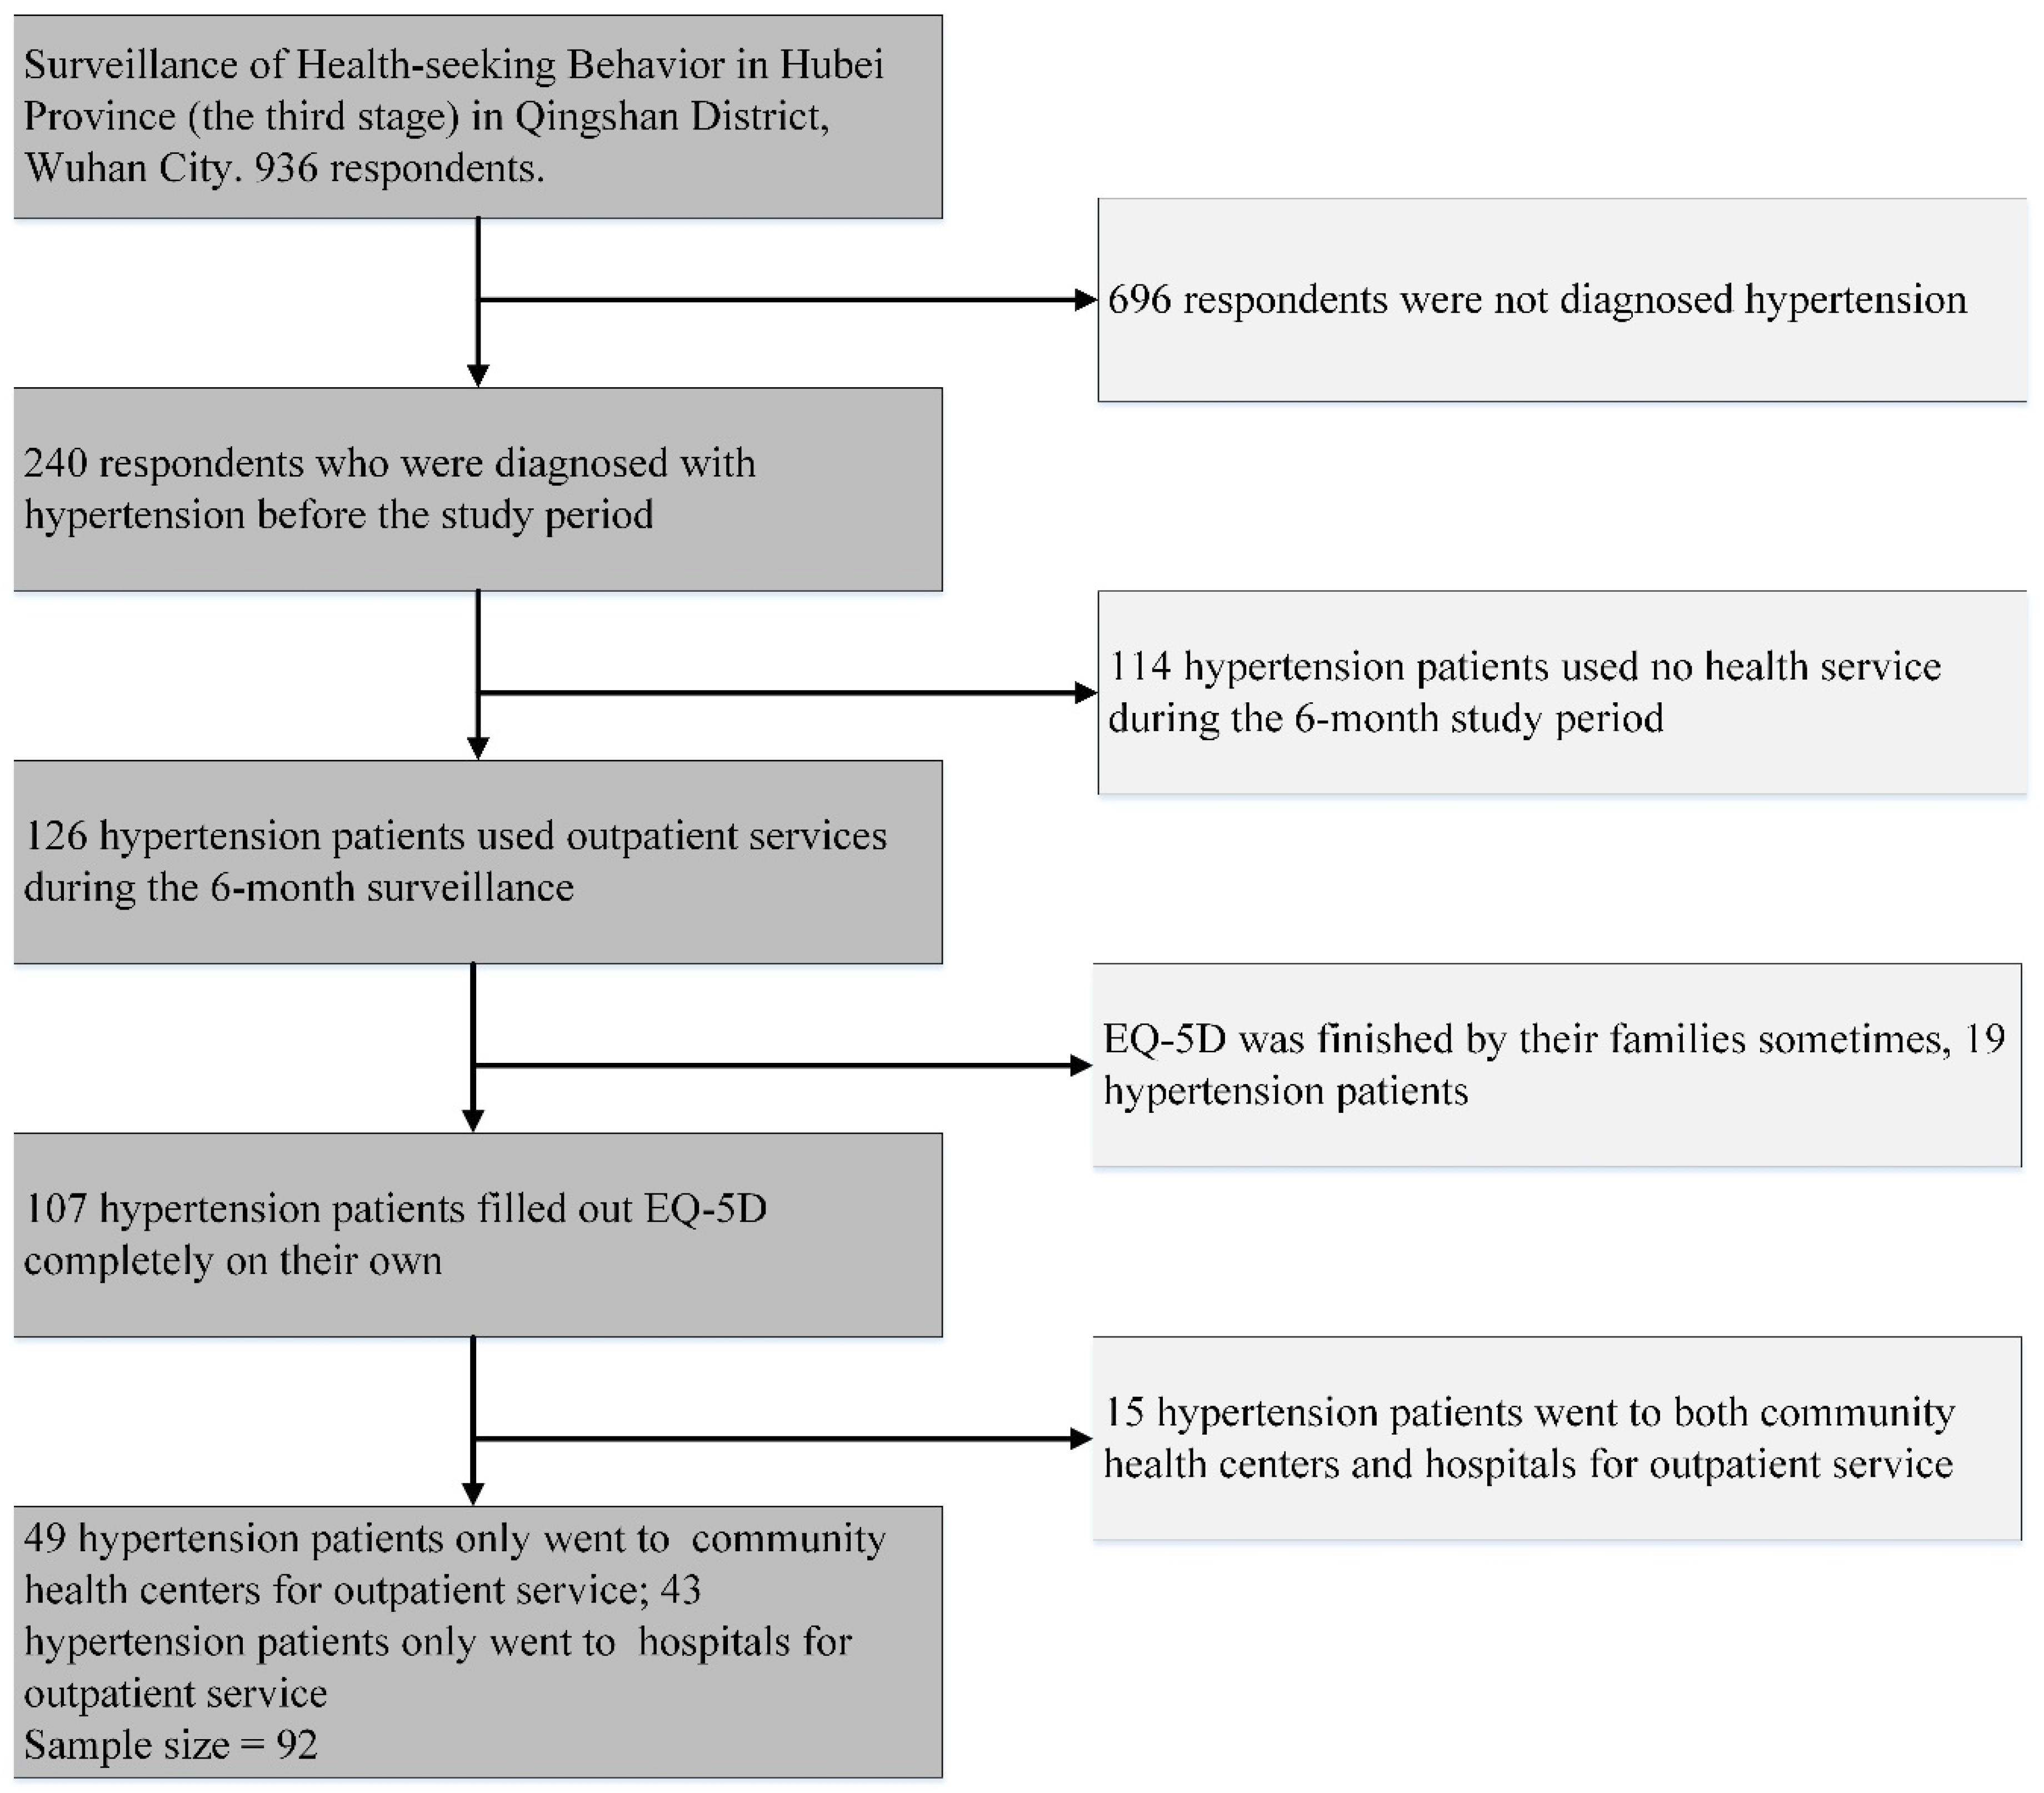
Hypertension is a considerable risk factor of cardiovascular, diabetes, and other chronic diseases [
31]. It shows the highest morbidity among NCDs in China (43.1% of patients with NCDs present hypertension), accounts for nearly 24% of outpatient services (the second highest), and 5.4% of inpatient services (the third highest) [
11]. Therefore, we selected hypertension patients as study participants. Among the 936 respondents, 240 people were diagnosed with hypertension before the study period, 126 of them used outpatient services for hypertension or relative disease during the six-month study period, and 107 of them filled out the EQ-5D completely by themselves six times. We divided those 107 people into the following groups according to the institution they chose for outpatient services: group 1 only went to community health centers (49 people), group 2 only went to hospitals (43 people), and group 3 went to both community health centers and hospitals (15 people) (
Figure 1). Groups 1 and 2 were study participants, and we compared the trajectories of their HRQoL over six months.
2.2. Measurement of HRQoL
The HRQoL of respondents was measured by EQ-5D. The scale contains a health description system and visual analogue scale (VAS). The description system presents five dimensions, including mobility, self-care, activity, pain/discomfort, and anxiety/depression. Detailed information about the EQ-5D is provided in the EQ-5D-3L manual [
32]. The EQ-5D description system was converted into a utility score according to the Chinese population-based time trade-off model, which was established by Liu G et al. [
33].
2.3. Statistical Analysis
The growth curve model introduced by Potthoff and Roy in 1964 has been widely used in repeated measurement studies of various fields [
34,
35,
36,
37,
38]. The model exhibits higher levels of statistical power than those of traditional methods when analyzing repeated measures data, especially in social science research [
39]. We applied a multilevel growth curve model to analyze whether the healthcare provider level can influence the HRQoL of hypertension patients. The utility score and VAS from EQ-5D were both taken as outcome variables. Time and healthcare provider level (community health center and hospital) were considered as independent variables. Other factors, including age (less than 65, 65–70, 70–75, and over 75), sex (male and female), family size (less than 3, 3, and over 3), family income per person (less than 20,000¥, 20,000–30,000¥, and over 30,000¥), frequency of use of outpatient services (less than once every two months and more than once every two months), and comorbidity (no comorbidity, one comorbidity, and more than one comorbidities) were also taken as independent variables, which may also influence the HRQoLf patients [
18,
19,
20,
21,
22,
23,
24,
25,
26]. The model of this study is shown below:
Yij denotes the HRQoL of patient i at time of j. π0i denotes the predicted HRQoL of i at the first wave. π1i represents the estimated slope (the predicted change of the HRQoL per month for patient i). εij refers to the errors of the HRQoL for patient i at time of j, and β00 represents the average HRQoL at wave 1, with other variables equal to zero. β01 represents the differences in the mean HRQoL between patients who selected hospitals as their common care provider and patients who chose community health center as their common care provider. β03 refers to differences in the mean HRQoL between males and females. β02, β04, β05, β06, and β07, represent the effects of age, family size, family income, frequency of use of outpatient services, and comorbidity number on patients’ HRQoL. β10refers to the average change of the HRQoL per month for all the patients. γ0i and γ1i denote the π0i and π1i errors.
One-way ANOVA was used to analyze the variation in HRQoL over time. All analyses were conducted in SAS, version 9.4 (SAS Institute Inc., Cary, NC, USA). The growth curve model was performed by SAS Proc Glimmix procedure, and parameters were estimated by the maximum likelihood method. Values with p < 0.05 (two-tailed) were considered statistically significant.
2.4. Ethics Approval and Consent to Participate
The study protocol conformed to the guidelines of the Ethics Committee of the Tongji Medical College of Huazhong University of Science and Technology. The protocol was registered in the Chinese Clinical Trial Registry (ChiCTR-OOR-14005563). Patient information was anonymized and de-identified before analysis.
3. Results
3.1. Summary Statistics of Sample Hypertension Patients
Among the 92 hypertension patients, 53.3% of them selected community health centers for outpatient services and the majority of them were over 65 years old (77.2%). Moreover, 51.1% of the patients were female, and the household income per capita was distributed mainly in the 20,000–30,000¥ income category (43.5%). More than half of the patients with hypertension belonged to households with one or two members (55.4%), and most of them sought outpatient services less than once every two months (58.7%); more than half of these patients had at least one comorbidity (51.1%). Further details are provided in
Table 1.
3.2. HRQoL of Hypertension Patients Over Time
We used the utility score and VAS from the EQ-5D to represent the HRQoL of the sample patients. During the six-month study period, the variation in the utility score mean was small and insignificant (
p = 0.93). The highest mean of the utility score was 0.928, and the lowest was 0.903. The mean VAS also varied insignificantly (
p = 0.155). The highest mean of VAS was 74.152, and the lowest mean was 69.685. Details are presented in
Table 2.
3.3. Factors Associated with HRQoL in Hypertension Patients
To explore the factors influencing the HRQoL of patients with hypertension, the growth curve model was applied, and results are provided in
Table 3. Comorbidity was the only factor significantly influencing the utility score. A high number of comorbidities in patients with hypertension resulted in a low utility score (estimate = −0.048,
p = 0.019). Other factors (time, provider level, age, sex, household income per capita, family size, and frequency of use of outpatient services) exerted no significant influence on the utility score. Time also notably influenced the VAS; VAS increased with time (estimate = 0.508,
p = 0.04). Comorbidity also significantly influenced the VAS. A high number of comorbidities in patients with hypertension resulted in low VAS (estimate = −4.62,
p < 0.001). Other factors (provider level, age, sex, household income per capita, family size, and frequency of use of outpatient services) also exerted no significant influence on VAS.
4. Discussion
This observational study focused on the influence of healthcare provider level on the HRQoL of patients with NCDs. The healthcare provider level for respondents was unknown at the beginning but determined by their health-seeking behavior information, which was continuously collected for months. This study is a longitudinal study, and each respondent was interviewed face-to-face for six times (once a month). The total sample is 552 (92 respondents with six waves of interviews) and the results are more stable and reliable than those of cross-sectional studies.
Study participants were mainly people aged over 65 years, which was in agreement with the fact that elderly people consist of the majority of patients with NCDs [
11]. Although our sample disease was hypertension, more than 50% of the respondents also had other NCDs, which was also in accordance with the NCDs prevalence of China [
40,
41]. Those two characteristics improved the representativeness of the sample and ensured the reliability of results.
The results showed that the HRQoL of the sample patients varied little over 6 months, which indicated that their health status was stable. The average utility score of sample patients was between 0.9 to 0.92, which was lower than that of the general population [
42,
43], and in accordance with the results measured by Li Zhang et al. (with the same method) for patients with hypertension [
31]. The average utility score further proved that the results were reliable.
The growth curve model showed that time exerted no influence on the factor of the utility score, which indicated that the utility score underwent no significant change over time. This result matched the result of a one-way ANOVA. Time was significantly related to VAS, and VAS increased over time. VAS refers health status evaluated by patients themselves, and it is more subjective than a utility score. The change in VAS may be due to psychological effects, given that the patients have been going to medical institutions frequently, and they may have expected good health status, although their body functions show no considerable improvement.
Comorbidity was also an influencing factor for the utility score and VAS; a high number of comorbidities in patients resulted in a low utility score and VAS, which was consistent with the findings of other studies [
23,
25]. Previous studies showed that age, income, and family size are related to the HRQoL of patients [
18,
26], and patients who were younger, richer, and/or with more household members had better HRQoL. However, in our study, these factors exerted no significant influence on HRQoL. This result may be attributed to the small sample size and short tracking period. If more respondents were followed up for a longer time, significant influences may be observed. Additionally, the frequency of use of outpatient services also showed insignificant influence, which indicated that patients may not obtain an improved health status despite the use of considerable health services.
The biggest concern of this study is the influence of healthcare provider level on patients’ HRQoL. The growth curve model showed that healthcare provider was insignificantly related to the utility score or VAS, which indicated that healthcare provider level exerted no influence on the health status of patients. This suggests that if hypertension patients go to primary medical institutions for their common heath needs, their health status will not decline; in other words, primary medical institutions can provide general health services for hypertension patients as good as hospitals. In addition, more than 50% of the participants presented other NCDs, which suggested that the results can also be applied to patients with multi-comorbidity. The results of this study indicate that the health status of patients with multi-comorbidity will not suffer if they choose primary medical institutions as their common healthcare provider.
5. Limitations
Our study has several limitations. The sample size was small and the tracking time was short, which may influence the stability of our conclusions. Only hypertension patients were included, and this may limit the generalizability of conclusions. Comorbidity cannot fully reflect disease severity for hypertension patients and may cause bias of conclusions. Further studies need to include more diseases and more participants with longer observation periods to enhance the stability and generalizability of conclusions. Additionally, more characteristics of participants need to be collected to reduce potential interruptions.
6. Conclusions
Our study shows that the healthcare provider level will not influence the health status of aged patients with NCDs. If aged patients with NCDs go to primary medical institutions for their common health needs, their health is unlikely to suffer. Patients with NCDs should be encouraged to go to primary medical institutions for general health services, and primary medical institutions should take care of the health demands of patients with NCDs at stable or rehabilitation stages of their disease management. If those measures can be well performed, the utilization efficiency of health resources would be greatly increased, and the operating efficiency of the delivery system will be markedly improved.
Author Contributions
Y.N. and L.Z participated in conception and design. Y.N. participated in data collection, and statistical analysis, and wrote the manuscript. T.Y. and Y.Z. helped to review the manuscript and offered suggestions for revisions. L.Z. helped to draft the manuscript, review the manuscript, and make final changes. All authors have given their final approval of the version to be published.
Funding
This study was funded by the National Natural Science Foundation of China (71673099) and the National Youth Natural Science Foundation of China, grant number (71603088). The funding body played no role in the design of the study, the collection, analysis, and interpretation of the data, or the writing of the manuscript.
Acknowledgments
This project proceeded under the help of local administrative authorities: Health and Family Planning Information Center of Hubei Province, Health and Family Planning Commission of Hubei Province.
Conflicts of Interest
The authors declare that they have no competing interests.
References
- Nikolic, I.A.; Stanciole, A.E.; Zaydman, M. Chronic Emergency: Why NCDs Matter. Health, Nutrition and Population (HNP) Discussion Paper; The World Bank: Washington, DC, USA, 2011. [Google Scholar]
- World Bank. The Growing Danger of Non-Communicable Diseases: Acting Now to Reverse Course; World Bank: Washington, DC, USA, 2011. [Google Scholar]
- Mendis, S. Global Status Report on Noncommunicable Diseases 2014; World Health Organization: Geneva, Switzerland, 2014. [Google Scholar]
- Murray, C.J.; Vos, T.; Lozano, R.; Naghavi, M.; Flaxman, A.D.; Michaud, C.; Ezzati, M.; Shibuya, K.; Salomon, J.A.; Abdalla, S.; et al. Disability-adjusted life years (DALYs) for 291 diseases and injuries in 21 regions, 1990–2010: A systematic analysis for the Global Burden of Disease Study 2010. Lancet 2012, 380, 2197–2223. [Google Scholar] [CrossRef]
- Abegunde, D.O.; Mathers, C.D.; Adam, T.; Ortegon, M.; Strong, K. The burden and costs of chronic diseases in low-income and middle-income countries. Lancet 2007, 370, 1929–1938. [Google Scholar] [CrossRef]
- Allotey, P.; Reidpath, D.D.; Yasin, S.; Chan, C.K.; de-Graft Aikins, A. Rethinking health-care systems: A focus on chronicity. Lancet 2011, 377, 450–451. [Google Scholar] [CrossRef]
- World Health Organization. Prevention and Control of Noncommunicable Diseases: Implementation of the Global Strategy: Report by the Secretaria; World Health Organization: Geneva, Switzerland, 2008. [Google Scholar]
- World Health Organization. WHO Global Coordination Mechanism on the Prevention and Control of Noncommunicable Diseases: Financing National NCD Responses in the Post-2015 Era; World Health Organization: Geneva, Switzerland, 2015. [Google Scholar]
- Alwan, A.; Maclean, D.R. A review of non-communicable disease in low- and middle-income countries. Int. Health 2009, 1, 3–9. [Google Scholar] [CrossRef] [PubMed]
- Alleyne, G.; Basu, S.; Stuckler, D. Who’s afraid of noncommunicable diseases? Raising awareness of the effects of noncommunicable diseases on global health. J. Health Commun. 2011, 16 (Suppl. 2), 82–93. [Google Scholar] [CrossRef] [PubMed]
- Health Statistics and Information Center. An Analysis Report of National Health Services Survey in China 2013; Health Statistics and Information Center: Beijing, China, 2015. [Google Scholar]
- World Health Organization. Noncommunicable Diseases Progress Monitor 2017; World Health Organization: Geneva, Switzerland, 2017. [Google Scholar]
- Benziger, C.P.; Roth, G.A.; Moran, A.E. The Global Burden of Disease Study and the Preventable Burden of NCD. Glob. Heart 2016, 11, 393–397. [Google Scholar] [CrossRef]
- State Council of China. Guideline for Building Tiered Healthcare Delivery System; State Council of China: Beijing, China, 2015.
- State Council of China. Chinese Medium- and Long-Term Plan for Prevention and Control of Noncommunicable Diseases (2017–2025); State Council of China: Beijing, China, 2017.
- Wang, Y.; Wilkinson, M.; Ng, E.; Cheng, K.K. Primary care reform in China. Br. J. Gen. Pract. J. R. Coll. Gen. Pract. 2012, 62, 546–547. [Google Scholar] [CrossRef] [Green Version]
- Liu, Q.; Wang, B.; Kong, Y.; Cheng, K.K. China’s primary health-care reform. Lancet 2011, 377, 2064–2066. [Google Scholar] [CrossRef]
- Sobhonslidsuk, A.; Silpakit, C.; Kongsakon, R.; Satitpornkul, P.; Sripetch, C.; Khanthavit, A. Factors influencing health-related quality of life in chronic liver disease. World J. Gastroenterol. 2006, 12, 7786–7791. [Google Scholar] [CrossRef] [PubMed]
- Strine, T.W.; Chapman, D.P.; Balluz, L.S.; Moriarty, D.G.; Mokdad, A.H. The Associations between Life Satisfaction and Health-related Quality of Life, Chronic Illness, and Health Behaviors among U.S. Community-dwelling Adults. J. Community Health 2008, 33, 40–50. [Google Scholar] [CrossRef]
- Braga, S.; Peixoto, S.V.; Gomes, I.C.; Acurcio, F.D.; Andrade, E.; Cherchiglia, M.L. Factors associated with health-related quality of life in elderly patients on hemodialysis. Rev. Saude Publica 2011, 45, 1127–1136. [Google Scholar] [CrossRef]
- Son, Y.J.; Song, Y.; Nam, S.; Shin, W.Y.; Lee, S.J.; Jin, D.K. Factors Associated With Health-Related Quality of Life in Elderly Korean Patients With Heart Failure. J. Cardiovasc. Nurs. 2012, 27, 528–538. [Google Scholar] [CrossRef]
- Megari, K. Quality of Life in Chronic Disease Patients. Health Psychol. Res. 2013, 1, e27. [Google Scholar] [CrossRef]
- Tyack, Z.; Frakes, K.A.; Barnett, A.; Cornwell, P.; Kuys, S.; McPhail, S. Predictors of health-related quality of life in people with a complex chronic disease including multimorbidity: A longitudinal cohort study. Qual. Life Res. 2016, 25, 2579–2592. [Google Scholar] [CrossRef]
- Yoo, J.Y.; Kim, Y.S.; Kim, S.S.; Lee, H.K.; Park, C.G.; Oh, E.G.; Oh, Y.M. Factors affecting the trajectory of health-related quality of life in COPD patients. Int. J. Tuberc. Lung Dis. 2016, 20, 738–746. [Google Scholar] [CrossRef]
- Muze, M.; Hailu, E.; Woldemichael, K.; Fekecha, B. Health Related Quality of Life And its Associated Factors Among Diabetic Patients Attending Diabetes Clinic in Jimma University Teaching Hospital, Ethiopia, 2014. J. Diabetes Metab. 2017, 8, 1000751. [Google Scholar] [CrossRef]
- Wang, C.L.; Lang, J.T.; Xuan, L.X.; Li, X.M.; Zhang, L. The effect of health literacy and self-management efficacy on the health-related quality of life of hypertensive patients in a western rural area of China: A cross-sectional study. Int. J. Equity Health 2017, 16. [Google Scholar] [CrossRef]
- Staquet, M.J.; Hays, R.D.; Fayers, P.M. (Eds.) Quality of Life Assessment in Clinical Trials: Methods and Practice; Oxford University Press: Oxford, UK, 1998. [Google Scholar]
- Deng, X.; Dong, P.; Zhang, L.; Tian, D.; Zhang, L.; Zhang, W.; Li, L.; Deng, J.; Ning, P.; Hu, G. Health-related quality of life in residents aged 18 years and older with and without disease: Findings from the First Provincial Health Services Survey of Hunan, China. BMJ Open 2017, 7, e015880. [Google Scholar] [CrossRef]
- Yang, J.; Jit, M.; Zheng, Y.; Feng, L.; Liu, X.; Wu, J.T.; Yu, H. The impact of influenza on the health related quality of life in China: An EQ-5D survey. BMC Infect. Dis. 2017, 17, 686. [Google Scholar] [CrossRef]
- Li, H.; Wei, X.; Ma, A.; Chung, R.Y. Inequalities in health status among rural residents: EQ-5D findings from household survey China. Int. J. Equity Health 2014, 13, 41. [Google Scholar] [CrossRef]
- Zhang, L.; Guo, X.; Zhang, J.; Chen, X.; Zhou, C.; Ge, D.; Qian, Y. Health-related quality of life among adults with and without hypertension: A population-based survey using EQ-5D in Shandong, China. Sci. Rep. 2017, 7. [Google Scholar] [CrossRef] [PubMed]
- Group, E. EuroQol—A new facility for the measurement of health-related quality of life. Health Policy 1990, 16, 199–208. [Google Scholar] [CrossRef]
- Liu, G.G.; Wu, H.; Li, M.; Gao, C.; Luo, N. Chinese time trade-off values for EQ-5D health states. Value Health 2014, 17, 597–604. [Google Scholar] [CrossRef] [PubMed]
- Rackow, P.; Scholz, U.; Hornung, R. Effects of a new sports companion on received social support and physical exercise: An intervention study. Appl. Psychol. Health Well-Being 2014, 6, 300–317. [Google Scholar] [CrossRef] [PubMed]
- Zhang, Z.Y.; Wang, L.J. Statistical power analysis for growth curve models using SAS. Behav. Res. Methods 2009, 41, 1083–1094. [Google Scholar] [CrossRef] [PubMed] [Green Version]
- Curran, P.J.; Obeidat, K.; Losardo, D. Twelve Frequently Asked Questions about Growth Curve Modeling. J. Cognit. Dev. 2010, 11, 121–136. [Google Scholar] [CrossRef] [PubMed]
- Potthoff, R.F.; Roy, S.N. A Generalized Multivariate Analysis of Variance Model Useful Especially for Growth Curve Problems. Biometrika 1964, 51, 313–326. [Google Scholar] [CrossRef]
- Nummi, T. Estimation in a random effects growth curve model. J. Appl. Stat. 1997, 24, 157–168. [Google Scholar] [CrossRef]
- Muthén, B.O.; Curran, P.J. General longitudinal modeling of individual differences in experimental designs: A latent variable framework for analysis and power estimation. Psychol. Methods 1997, 2, 371–402. [Google Scholar] [CrossRef]
- Yiran, L.; Kailing, J.; Haiyan, Z.; Chao, G.; Yanyao, M.; Hongmei, W. The Influence of Comorbidity on Chronic Disease Patients’ Quality of Life in the Urban Area of China. Chin. J. Hosp. Adm. 2012, 28, 925–928. [Google Scholar] [CrossRef]
- Cui, J.; Mao, F.; Wang, Z.H. Comorbidity of common chronic diseases among the elderly in China. Chin. J. Public Health 2016, 32, 66–69. [Google Scholar] [CrossRef]
- Guan, H.J.; Liu, G.E. Comparison Analysis on Health Related Quality of Life among Urban and Rural Residents in 4 Cities of China. Chin. Health Econ. 2015, 34, 5–12. [Google Scholar] [CrossRef]
- Zhou, T.; Guan, H.J.; Ma, A.X.; Liu, G.G. Health Related Quality of Life for General Population in China: A Systematic Review. Chin. Health Serv. Manag. 2016, 33, 621–623, 630. [Google Scholar]
© 2019 by the authors. Licensee MDPI, Basel, Switzerland. This article is an open access article distributed under the terms and conditions of the Creative Commons Attribution (CC BY) license (http://creativecommons.org/licenses/by/4.0/).


