Me’akai in Tonga: Exploring the Nature and Context of the Food Tongan Children Eat in Ha’apai Using Wearable Cameras


Abstract
:1. Introduction
2. Materials and Methods
2.1. Study Design
2.2. Ethical Approval
2.3. Sampling and Recruitment
2.4. Data Collection and Management
2.5. Image Content Analysis for the Me’akai Study
2.6. Statistical Analysis
3. Results
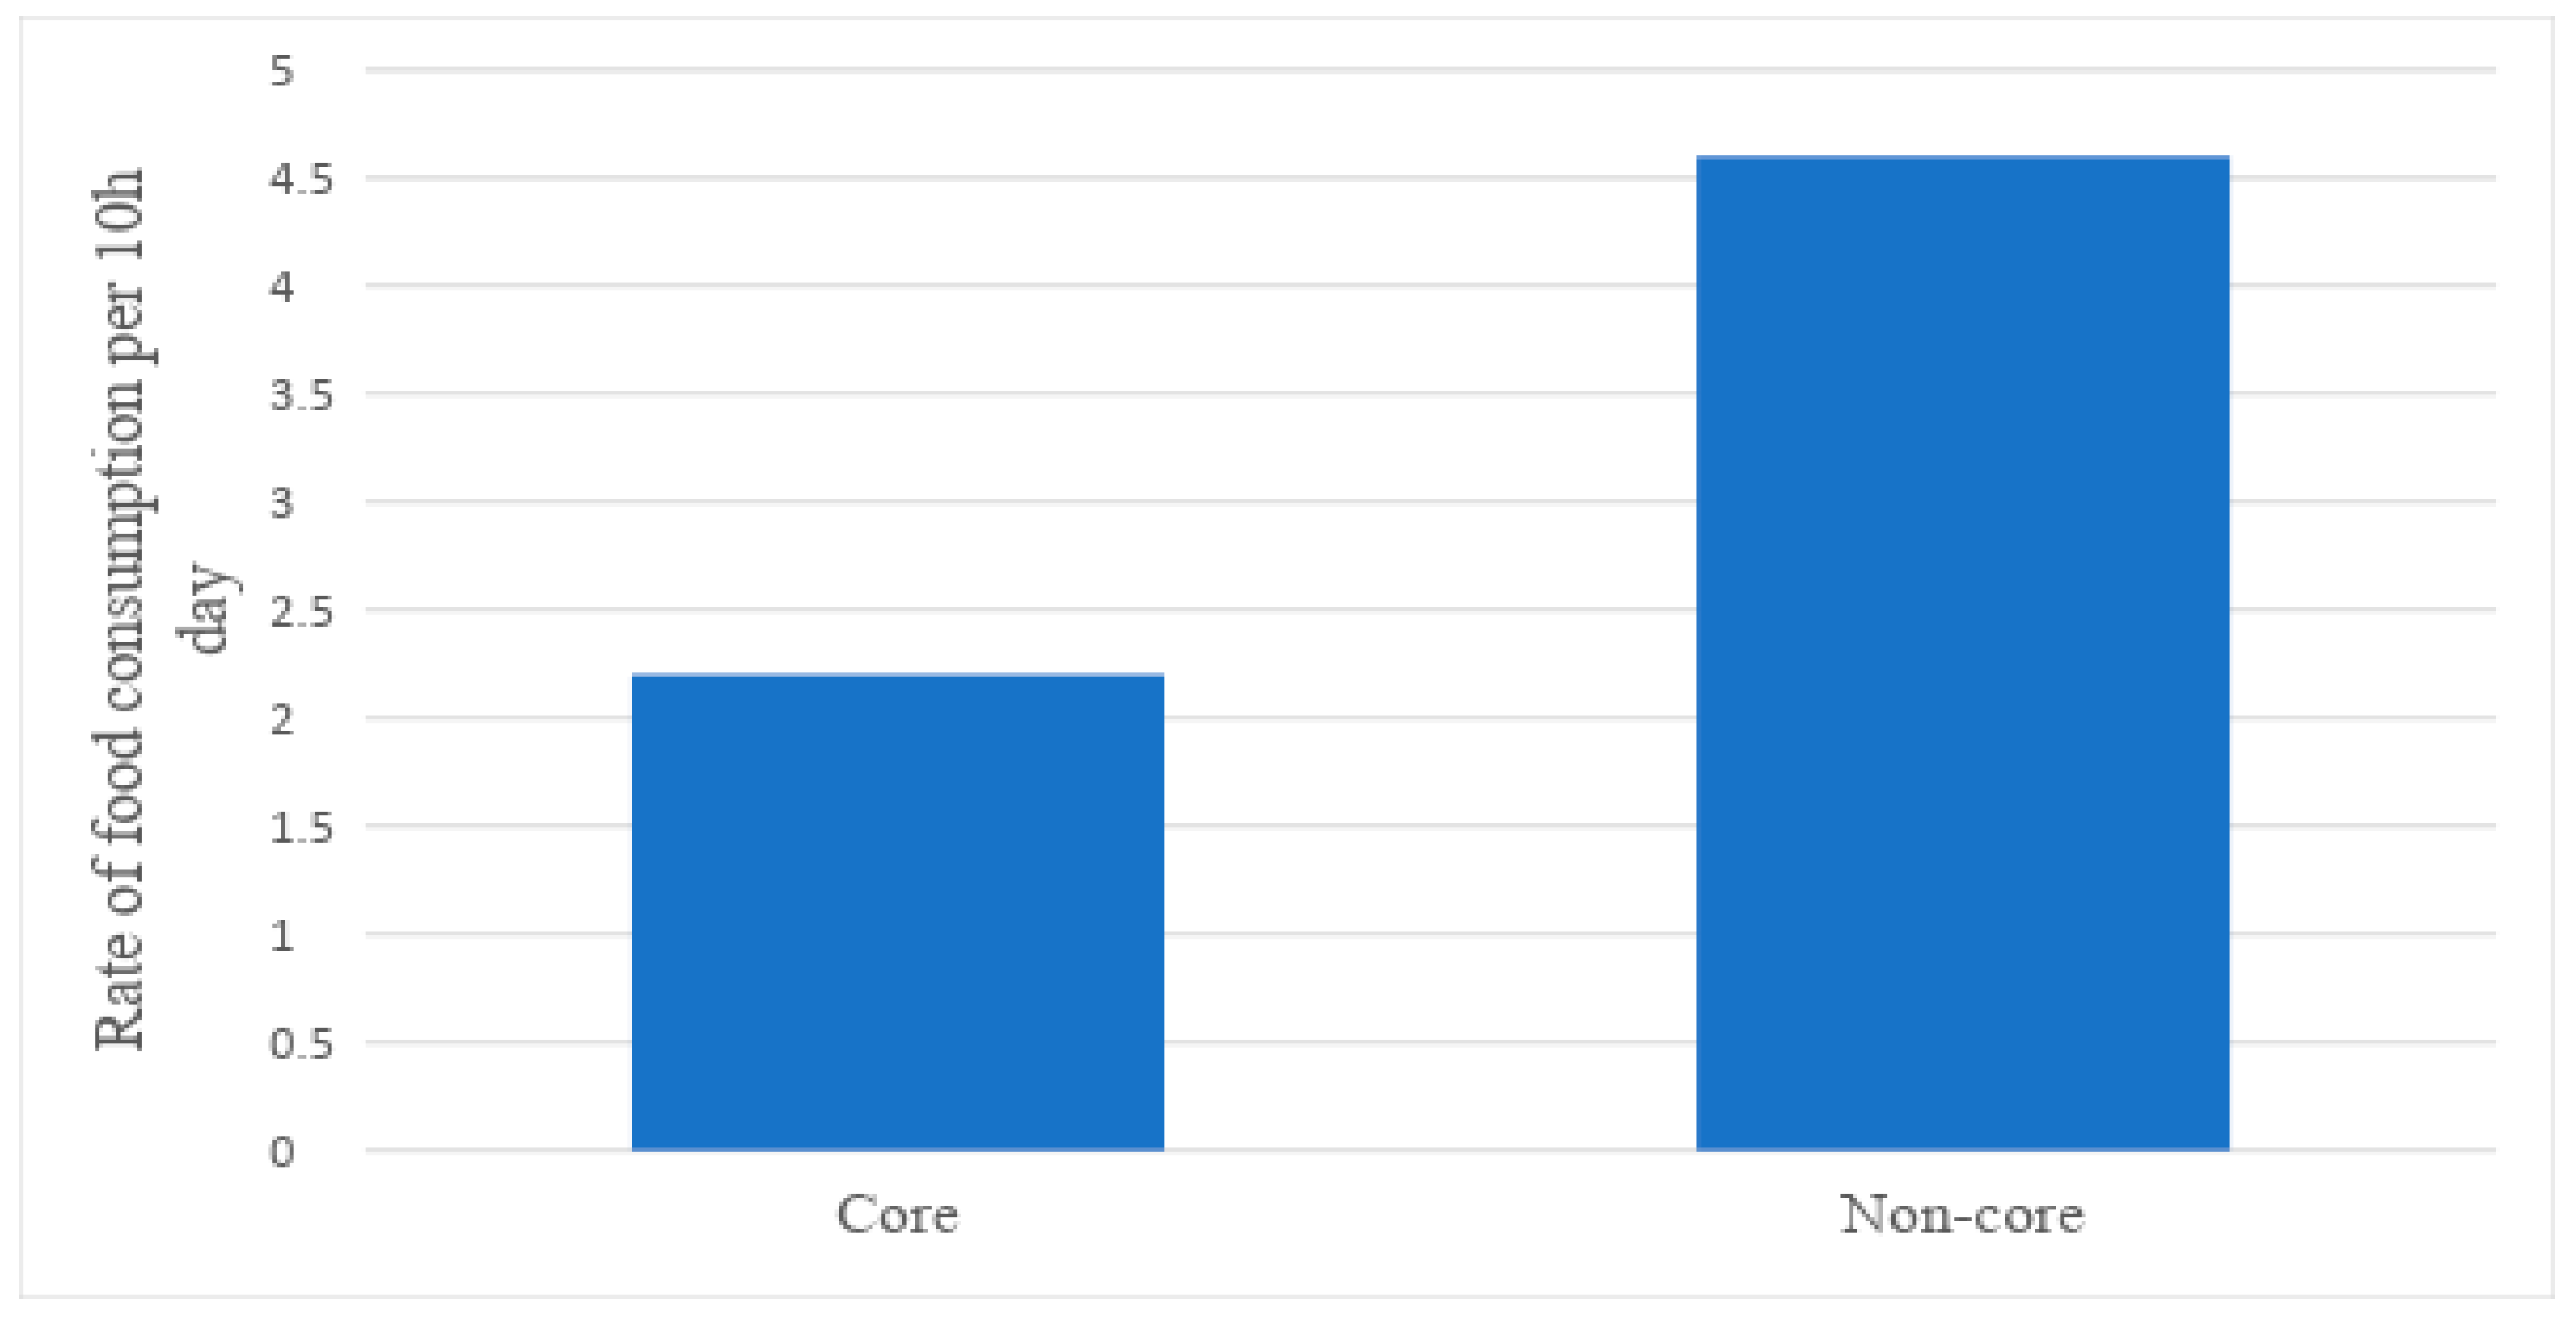
3.1. Core versus Non-Core Foods
3.1.1. Food Type
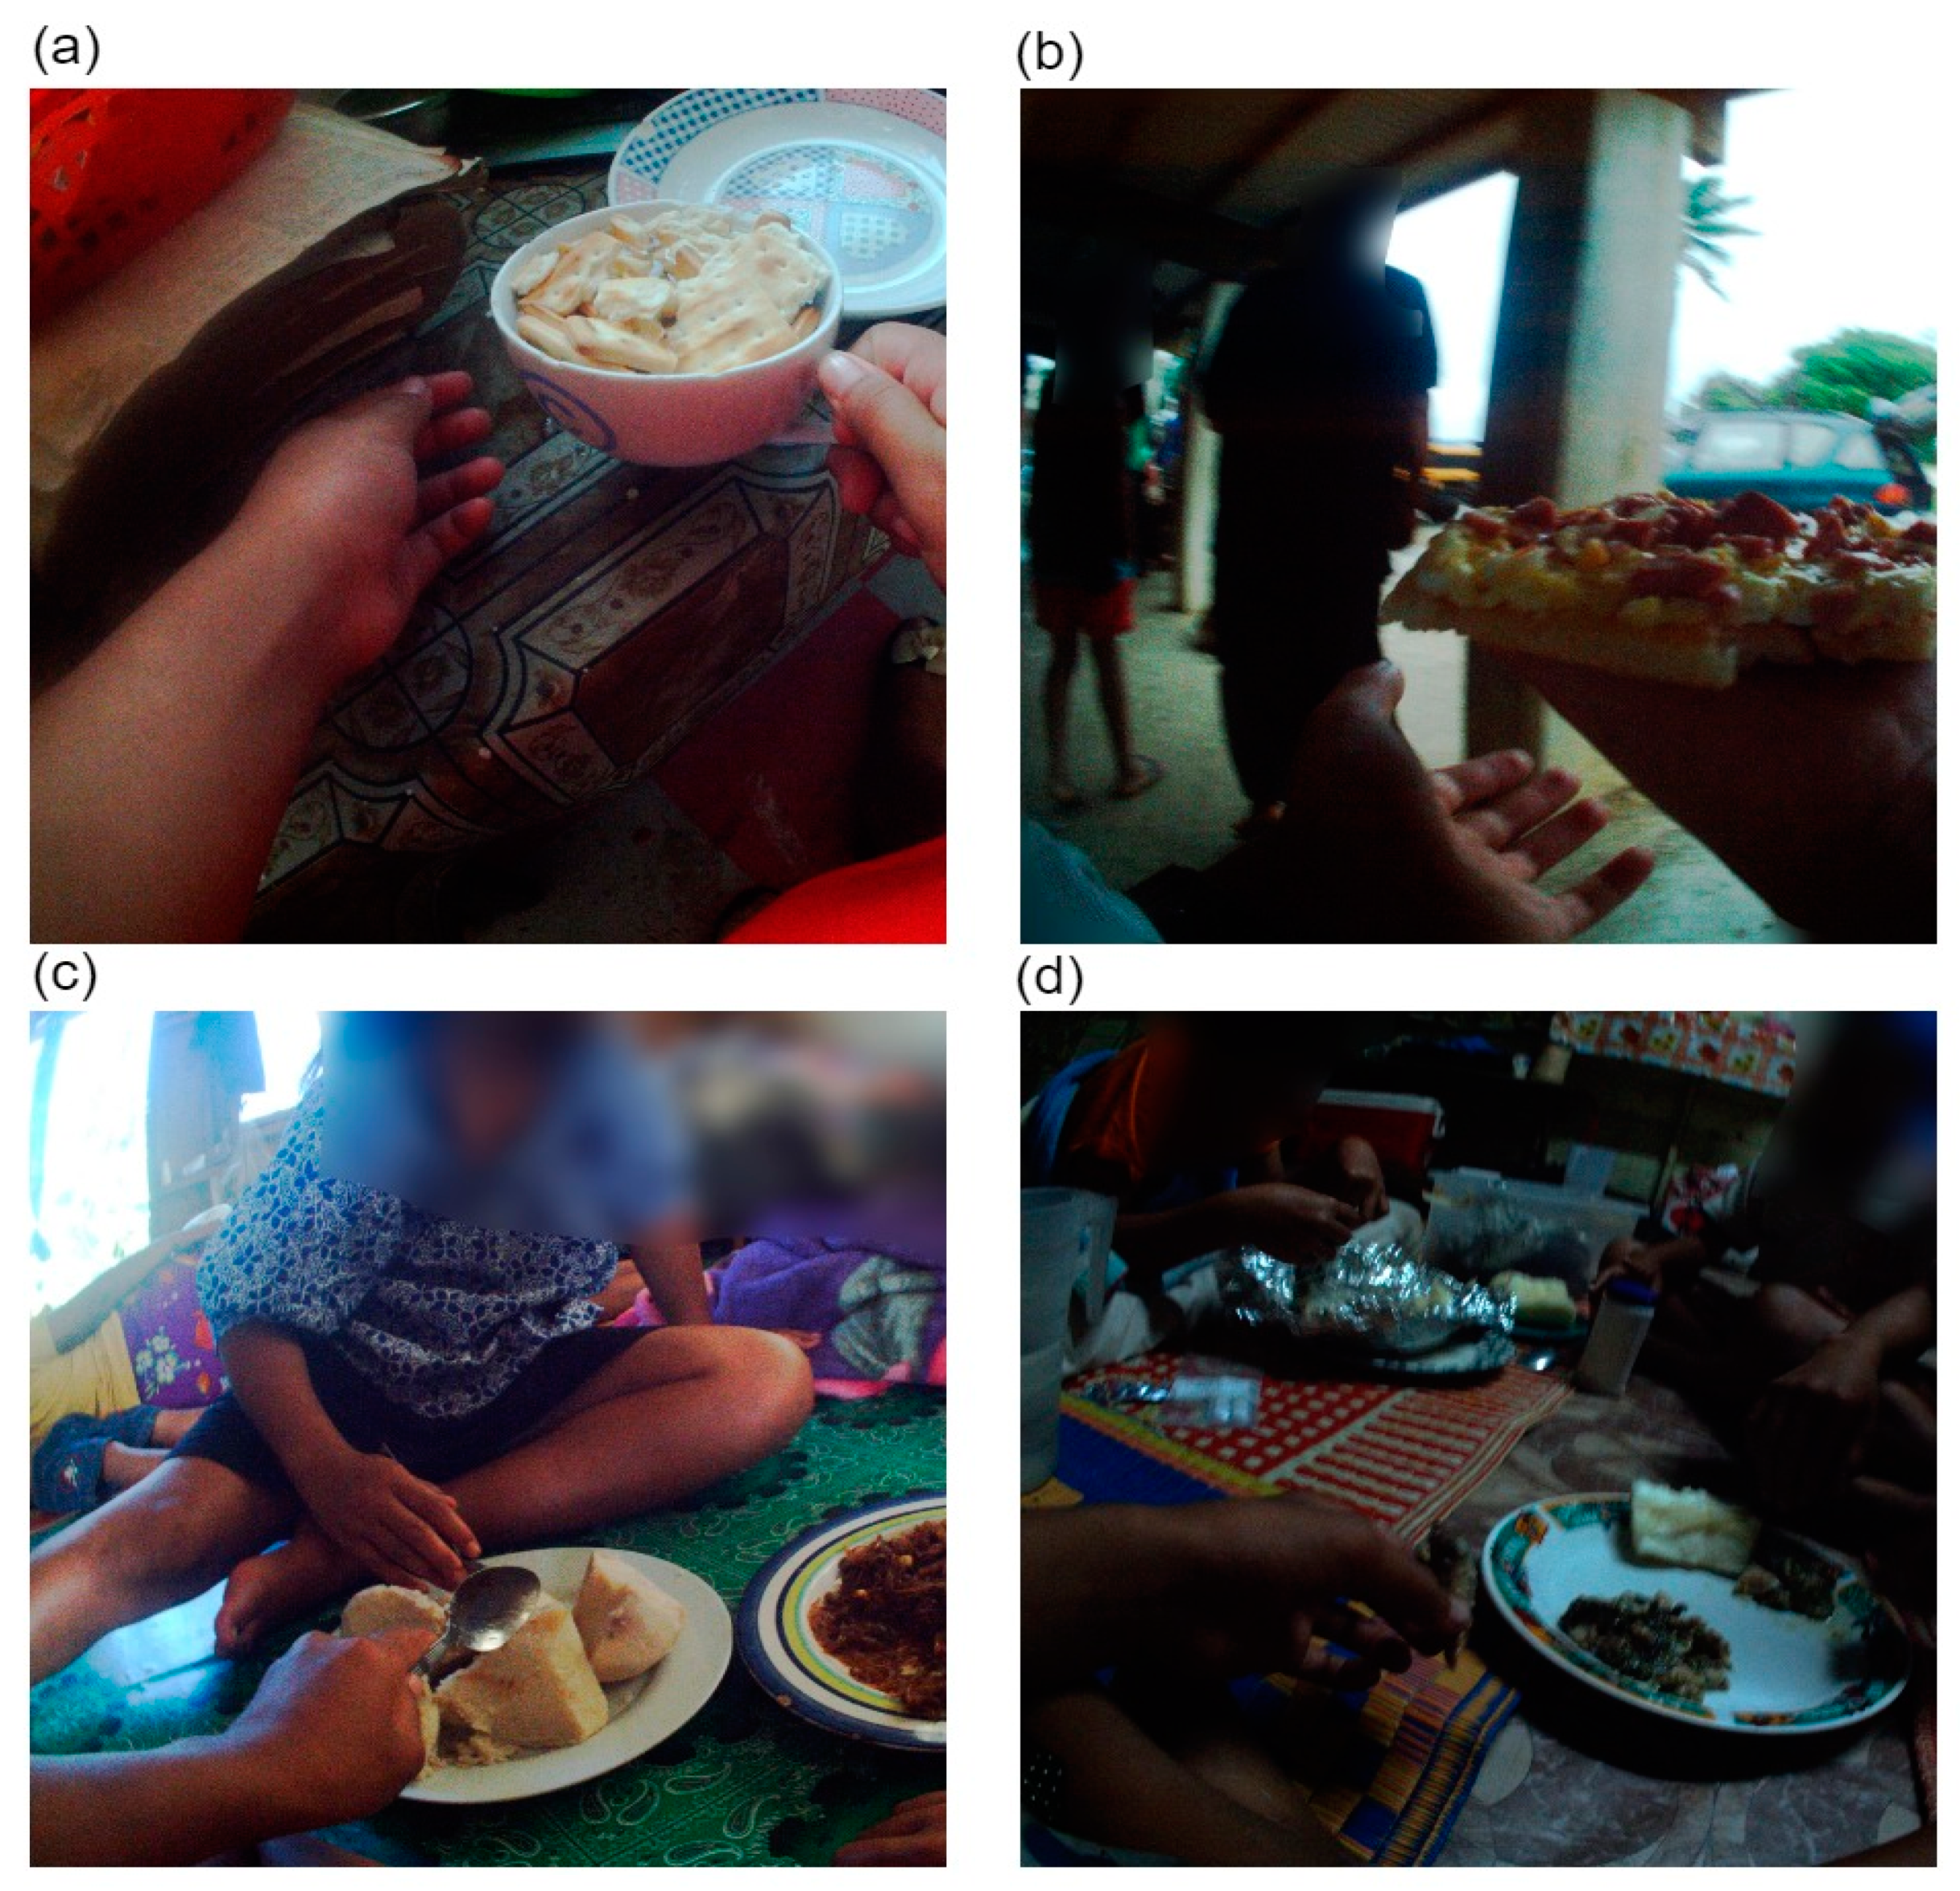
3.1.2. Eating Episode
3.1.3. Setting
3.1.4. Source
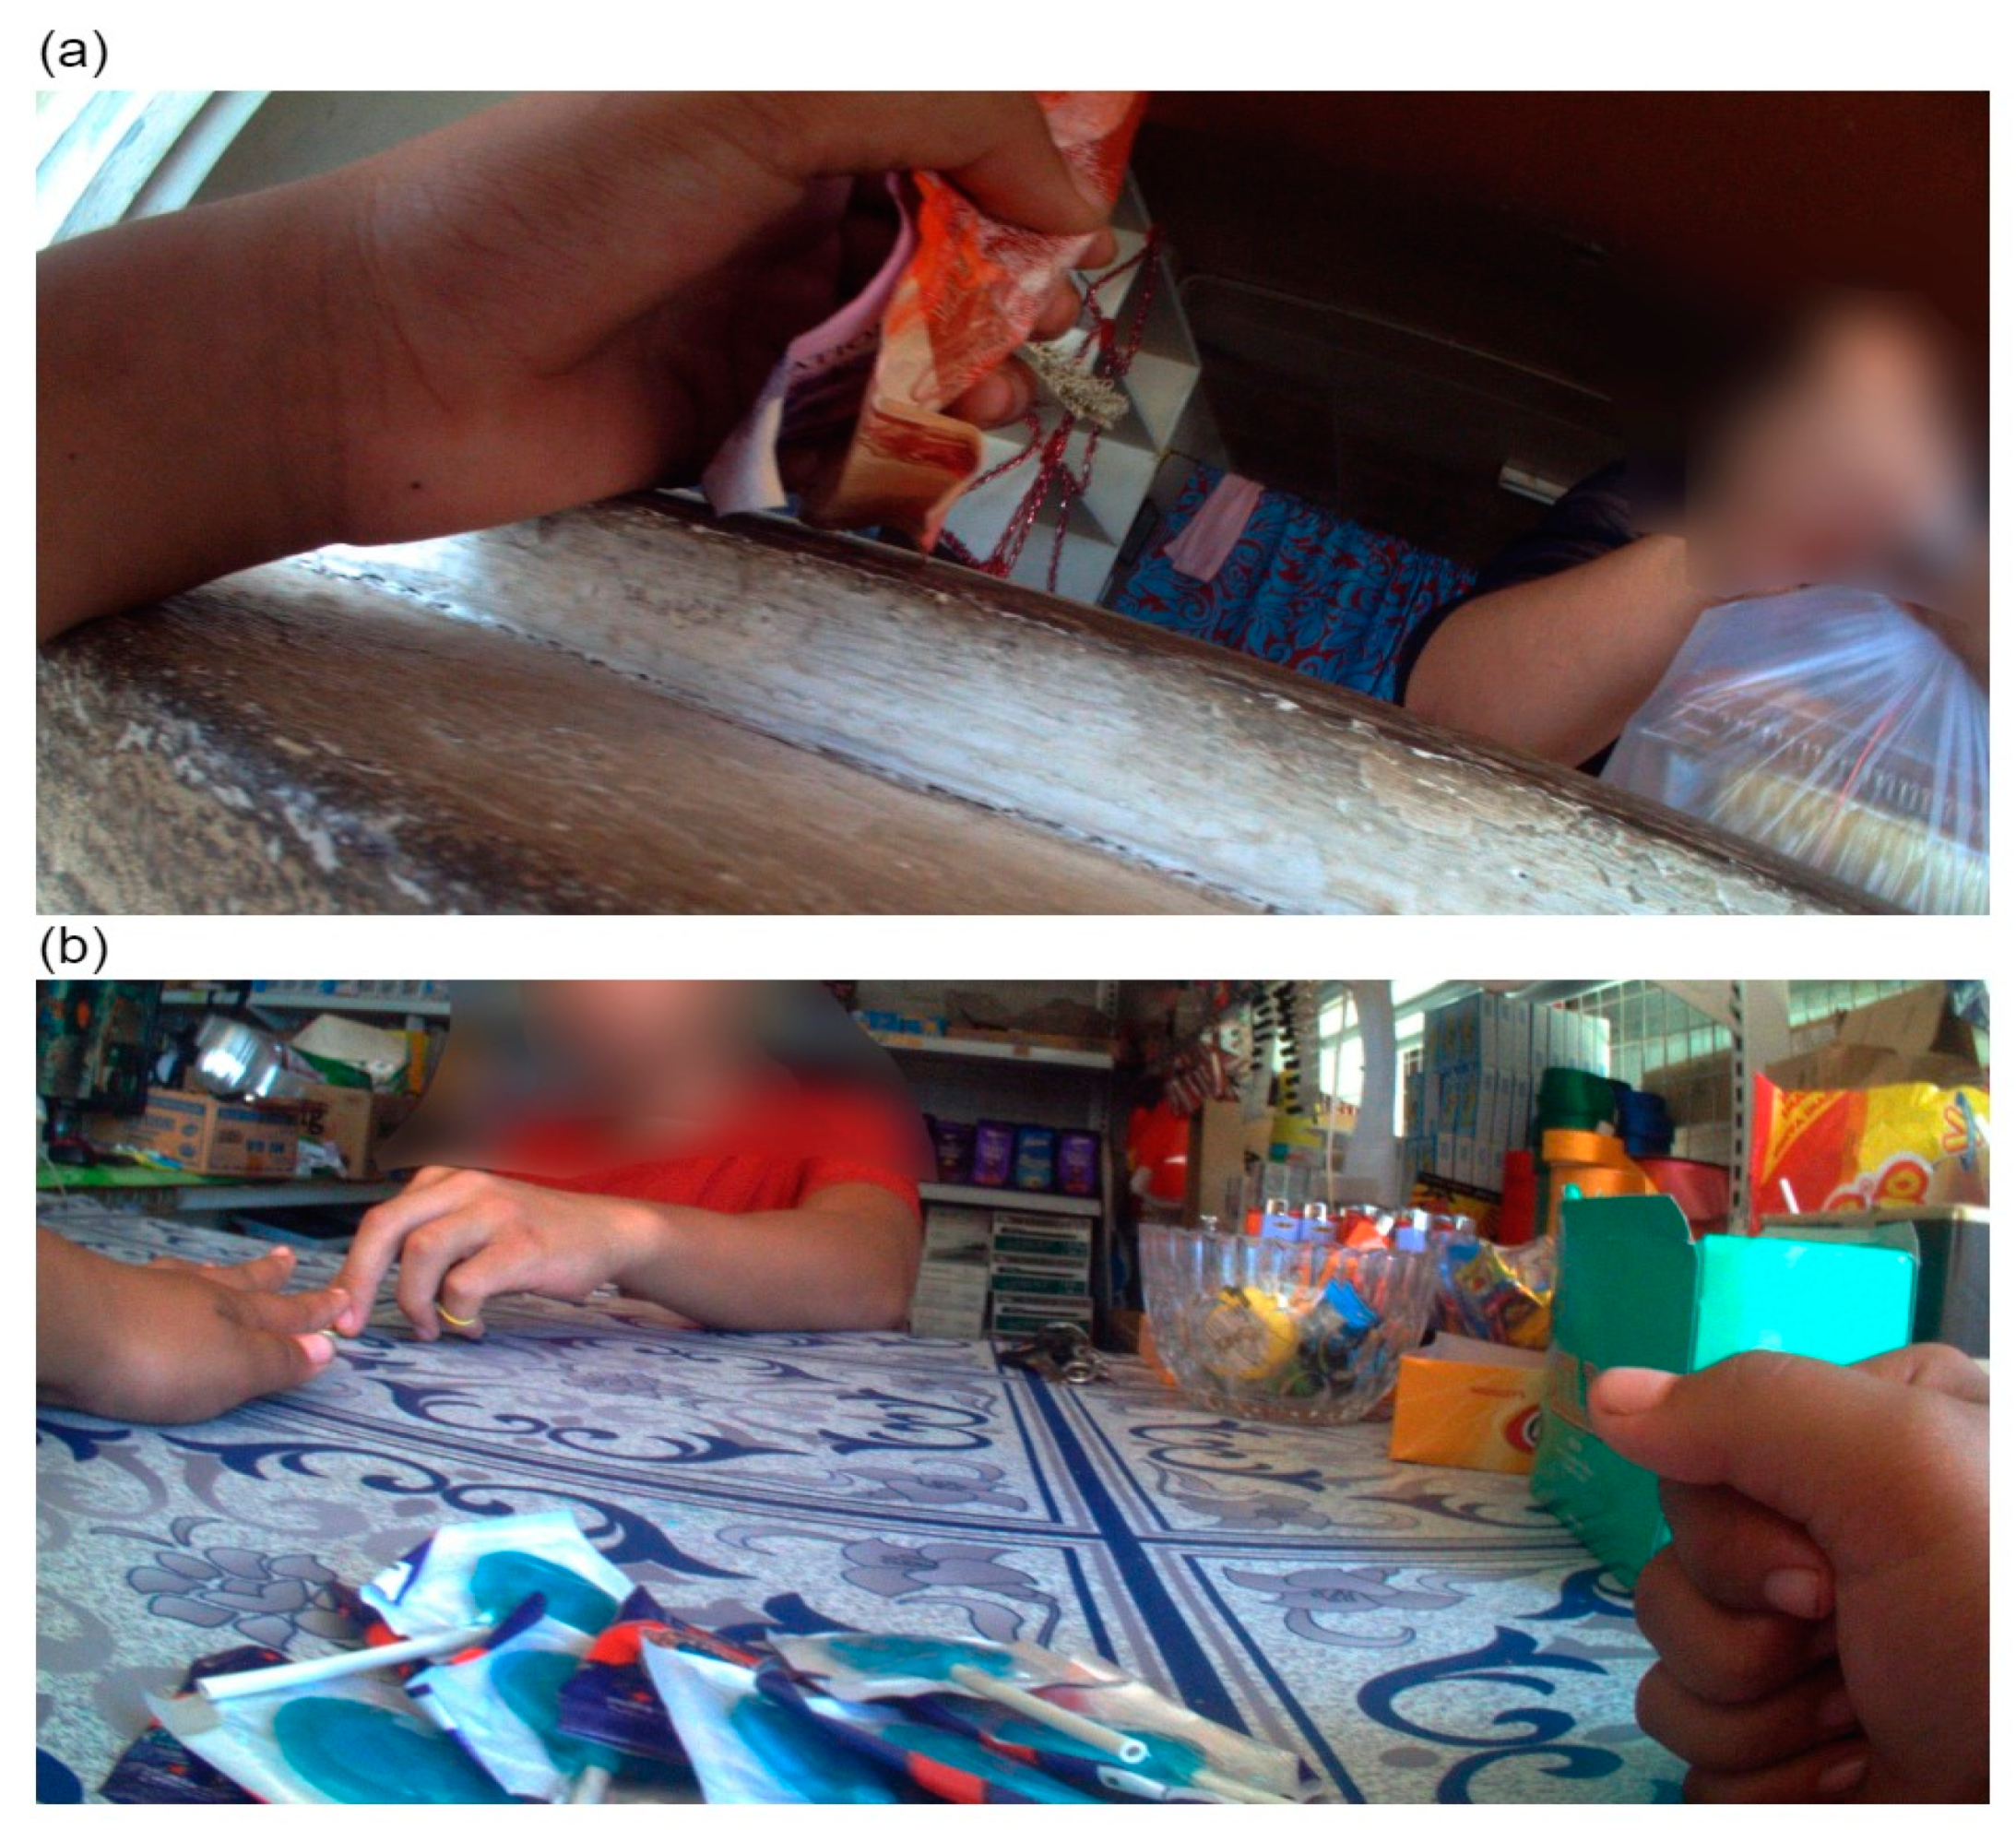
3.1.5. Purchaser
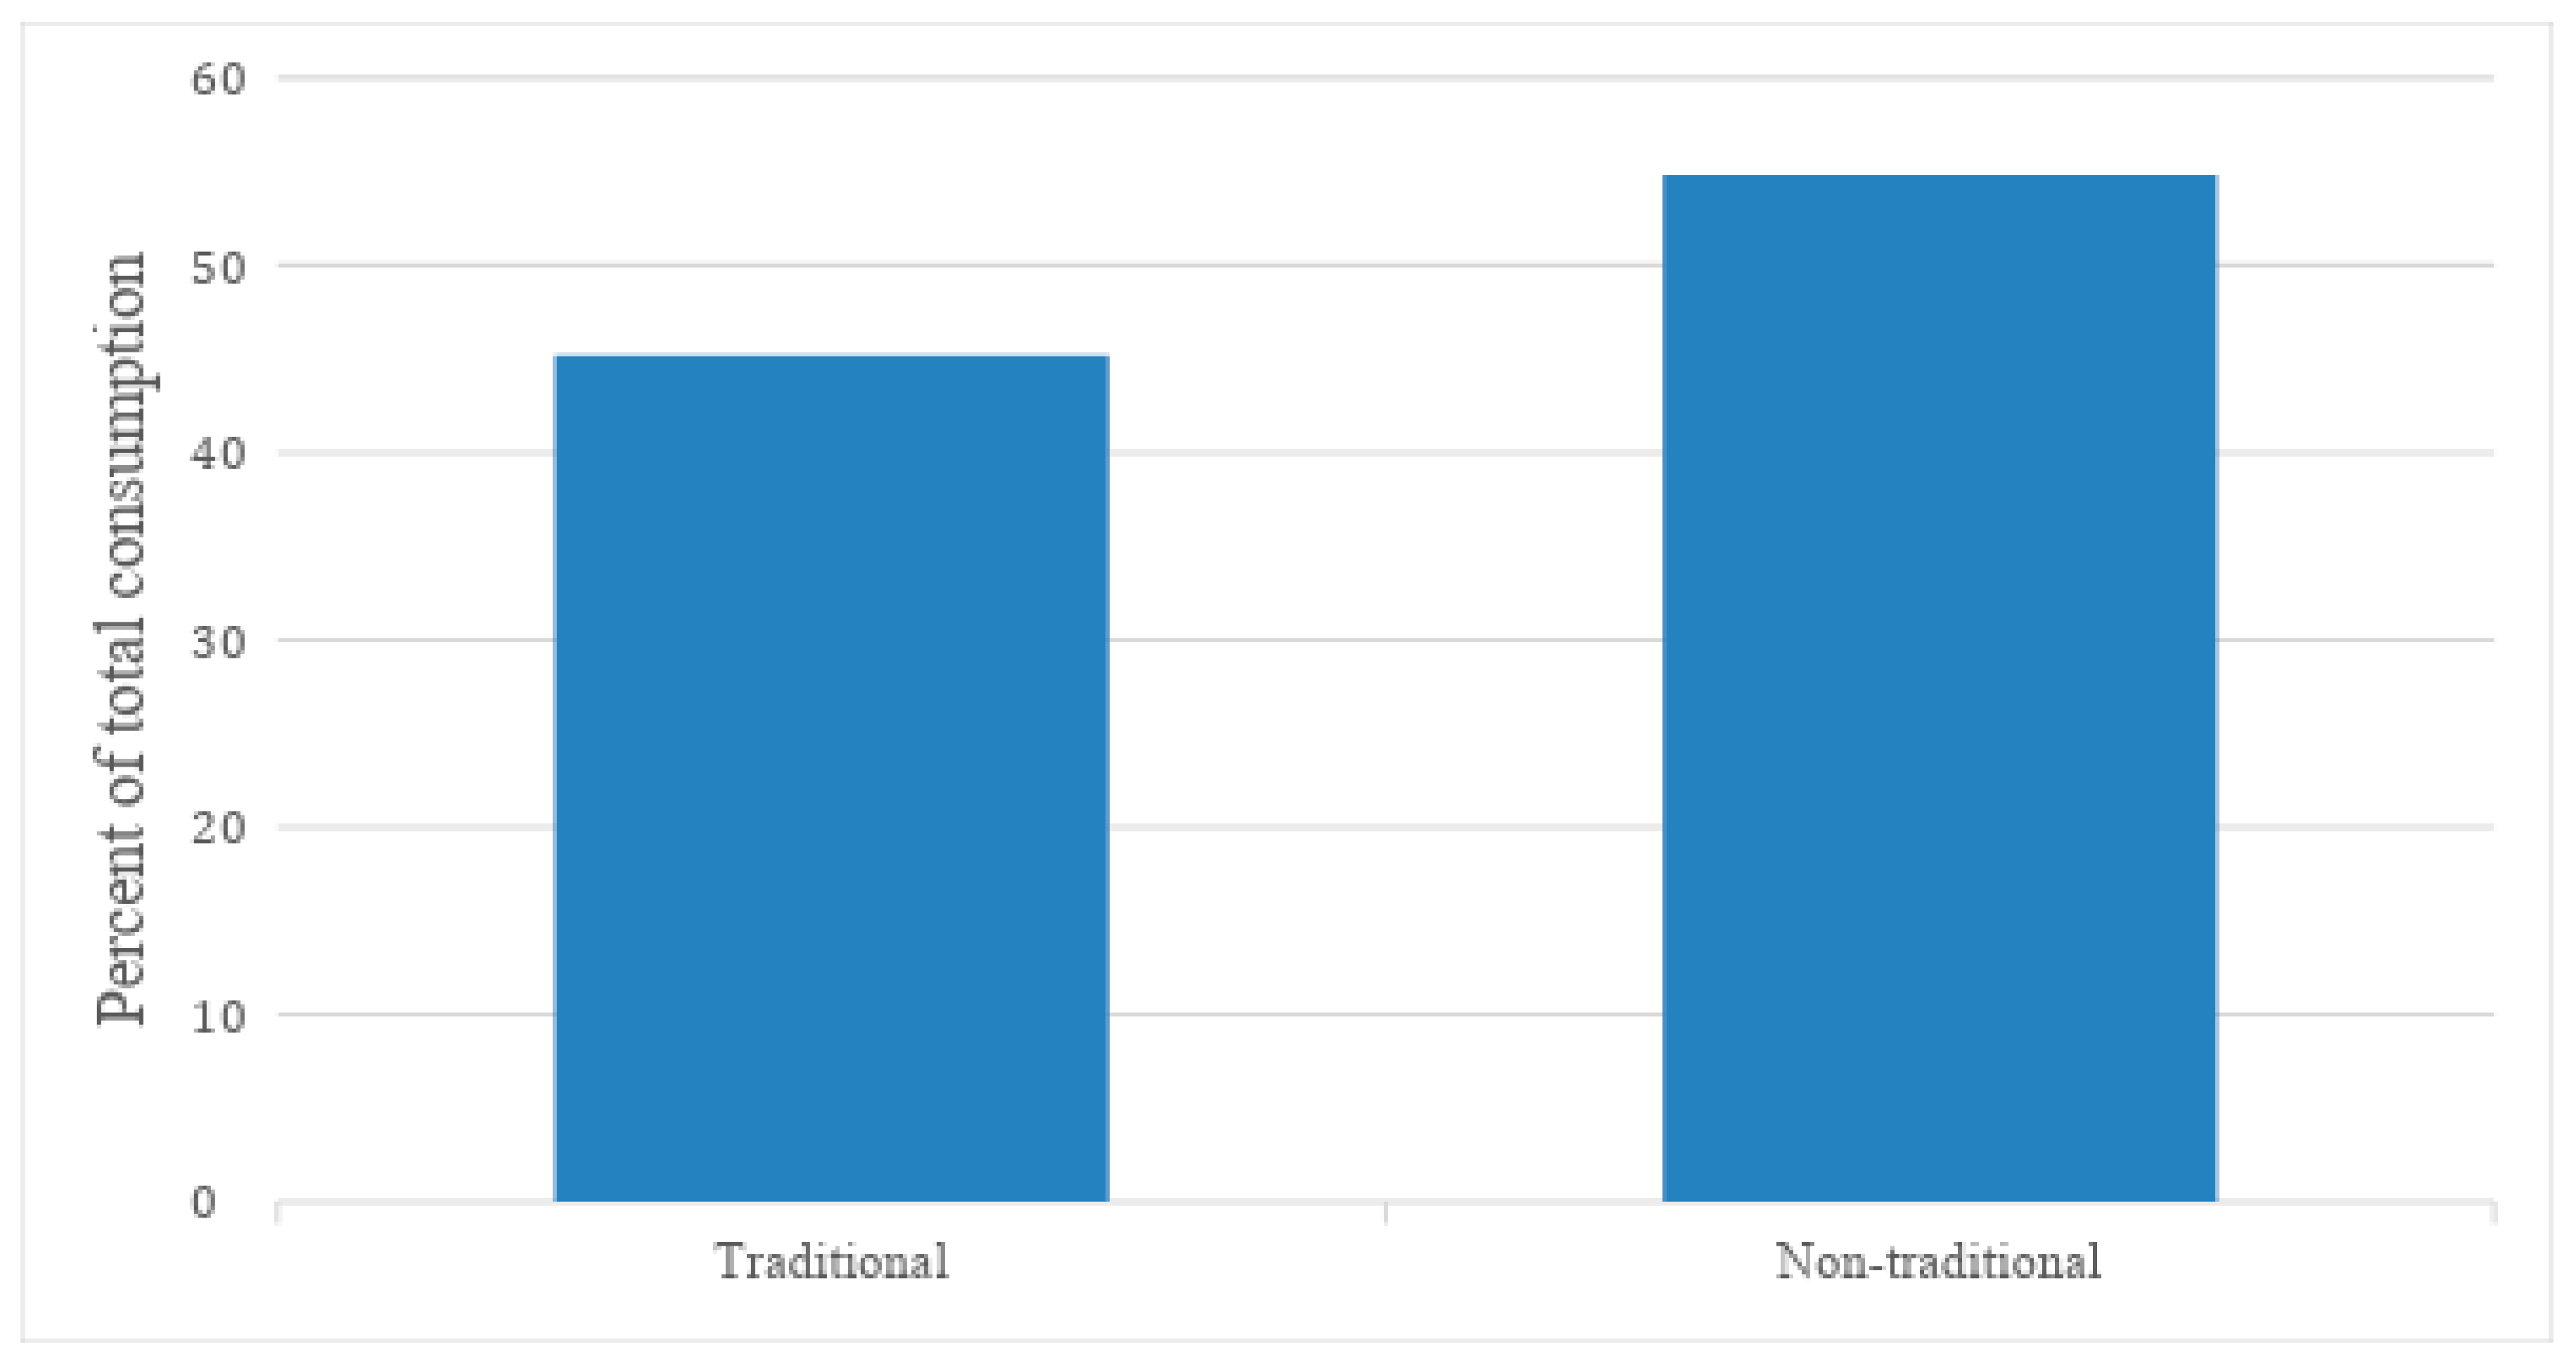
3.2. Traditional versus Non-Traditional Mixed Meals
4. Discussion
5. Conclusions
Author Contributions
Funding
Acknowledgments
Conflicts of Interest
References
- World Health Organization. Noncommunicable Diseases Progress Monitor; World Health Organization: Geneva, Switherland, 2017. [Google Scholar]
- Tonga Health Promotion Foundation. National Strategy for the Prevention and Control of Non-Communicable Diseases 2015–2020; Tonga Health Promotion Foundation: Nuku’alofa, Tonga, 2016; pp. 1–45. [Google Scholar]
- Ng, M.; Fleming, T.; Robinson, M.; Thomson, B.; Graetz, N.; Margono, C.; Mullany, E.C.; Biryukov, S.; Abbafati, C.; Abera, S.F. Global, regional, and national prevalence of overweight and obesity in children and adults during 1980–2013: A systematic analysis for the Global Burden of Disease Study 2013. Lancet 2014, 384, 766–781. [Google Scholar] [CrossRef]
- Tonga Department of Statistics Tonga Statistics at a Glance—Latest Releases. Available online: https://tonga.prism.spc.int/ (accessed on 7 March 2019).
- Commission on Ending Childhood Obesity. Report of the Commission on Ending Childhood Obesity; World Health Organization: Geneva, Switherland, 2016. [Google Scholar]
- Pauli, J.; Na’ati, E.; Taoi, L. Healthy Eating Discussion Paper; Department of Health: Nuku’alofa, Tonga, 2015.
- World Health Organization. Diet, Food Supply and Obesity in the Pacific; World Health Organization Regional Office for the Western Pacific: Manila, Philippines, 2003. [Google Scholar]
- World Health Organization. Obesity: Preventing and Managing the Global Epidemic; World Health Organization: Geneva, Switherland, 2000. [Google Scholar]
- Cacavas, K.; Mavoa, H.; Kremer, P.; Malakellis, M.; Fotu, K.; Swinburn, B.; de Silva-Sanigorski, A. Tongan Adolescents’ Eating Patterns: Opportunities for Intervention. Asia Pac. J. Public Health 2011, 23, 24–33. [Google Scholar] [CrossRef] [PubMed]
- Evans, M.; Sinclair, R.C.; Fusimalohi, C.; Liava’a, V. Globalization, diet, and health: An example from Tonga. Bull. WHO 2001, 79, 856–862. [Google Scholar] [PubMed]
- Gemming, L.; Jiang, Y.; Swinburn, B.; Utter, J.; Mhurchu, C.N. Under-reporting remains a key limitation of self-reported dietary intake: An analysis of the 2008/09 New Zealand Adult Nutrition Survey. Eur. J. Clin. Nutr. 2014, 68, 259. [Google Scholar] [CrossRef] [PubMed]
- Briefel, R.; Sempos, C.; McDowell, M.; Chien, S.; Alaimo, K. Dietary methods research in the third National Health and Nutrition Examination Survey: Underreporting of energy intake. Amer. J. Clin. Nutr. 1997, 65, 1203S–1209S. [Google Scholar] [CrossRef] [PubMed]
- Gemming, L.; Doherty, A.; Utter, J.; Shields, E.; Mhurchu, C.N. The use of a wearable camera to capture and categorise the environmental and social context of self-identified eating episodes. Appetite 2015, 92, 118–125. [Google Scholar] [CrossRef] [PubMed]
- Gemming, L.; Mhurchu, C.N. Dietary under-reporting: What foods and which meals are typically under-reported? Eur. J. Clin. Nutr. 2016, 70, 640. [Google Scholar] [CrossRef] [PubMed]
- Cowburn, G.; Matthews, A.; Doherty, A.; Hamilton, A.; Kelly, P.; Williams, J.; Foster, C.; Nelson, M. Exploring the opportunities for food and drink purchasing and consumption by teenagers during their journeys between home and school: A feasibility study using a novel method. Public Health Nutr. 2016, 19, 93–103. [Google Scholar] [CrossRef] [PubMed]
- Signal, L.N.; Stanley, J.; Smith, M.; Barr, M.B.; Chambers, T.J.; Zhou, J.; Duane, A.; Gurrin, C.; Smeaton, A.F.; McKerchar, C.; et al. Children’s everyday exposure to food marketing: An objective analysis using wearable cameras. Int. J. Behav. Nutr. Phys. Activ. 2017, 14, 137. [Google Scholar] [CrossRef] [PubMed]
- Gemming, L.; Rush, E.; Maddison, R.; Doherty, A.; Gant, N.; Utter, J.; Mhurchu, C.N. Wearable cameras can reduce dietary under-reporting: Doubly labelled water validation of a camera-assisted 24 h recall. Brit. J. Nutr. 2015, 113, 284–291. [Google Scholar] [CrossRef] [PubMed]
- Signal, L.N.; Smith, M.B.; Barr, M.; Stanley, J.; Chambers, T.J.; Zhou, J.; Duane, A.; Jenkin, G.L.; Pearson, A.L.; Gurrin, C. Kids’ Cam: an objective methodology to study the world in which children live. Amer. J. Prev. Med. 2017, 53, e89–e95. [Google Scholar] [CrossRef] [PubMed]
- Smith, M.; Stanley, J.; Signal, L.; Barr, M.; Chambers, T.; Balina, A.; Mhurchu, C.N.; Wilson, N. Children’s healthy and unhealthy beverage availability, purchase and consumption: A wearable camera study. Appetite 2019, 133, 240–251. [Google Scholar] [CrossRef]
- Robinson, A.; Hulme-Moir, S.; Puloka, V.; Smith, M.; Stanley, J.; Signal, L. Housing as a Determinant of Tongan Children’s Health: Innovative Methodology Using Wearable Cameras. Int. J. Environ. Res. Public Health. 2017, 14, 1170. [Google Scholar] [CrossRef]
- Puloka, V.; Smith, M.; Chambers, T.; Signal, L. An Evaluation of Tonga School Food Policy 2012–2015: A Pathway to a Healthier Life; Unpublished report; Health Promotion & Policy Research Unit, University of Otago: Wellington, New Zealand, 2017. [Google Scholar]
- Kids’Cam Tonga FOODS Coding Schedule. Available online: https://www.otago.ac.nz/heppru/publications/index.html (accessed on 10 May 2019).
- Pacific Community. Pacific Guidelines for a Healthy Diet and Lifestyle; Pacific Community: Noumea, New Caledonia, 2017. [Google Scholar]
- Cole, T.J.; Lobstein, T. Extended international (IOTF) body mass index cut-offs for thinness, overweight and obesity. Pediat. Obes. 2012, 7, 284–294. [Google Scholar] [CrossRef]
- Swinburn, B.; Egger, G.; Raza, F. Dissecting obesogenic environments: The development and application of a framework for identifying and prioritizing environmental interventions for obesity. Prev. Med. 1999, 29, 563–570. [Google Scholar] [CrossRef]
- Piukala, S.; Clark, H.; Tukuitonga, C.; Vivili, P.; Beaglehole, R. Turning the tide on non-communicable diseases in the Pacific region. Lancet Glob. Health 2016, 4, e899–e900. [Google Scholar] [CrossRef] [Green Version]
- Teng, A.; Puloka, V.; Fe’ao, S.; Signal, L.; Genç, M.; Wilson, N. DRAFT REPORT: Report to the Government of the Kingdom of Tonga on the Government’s Innovative Sugar-Sweetened Beverage Tax; University of Otago: Wellington, New Zealand; Health Promotion Forum: Auckland, New Zealand; Tonga Health Promotion Foundation: Nuku’alofa, Tonga, 2019. [Google Scholar]
- Delany, L.; Signal, L.; Thomson, G. International trade and investment law: A new framework for public health and the common good. BMC Public Health 2018, 18, 602. [Google Scholar] [CrossRef]
- Hernández-F, M.; Batis, C.; Rivera, J.A.; Colchero, M.A. Reduction in purchases of energy-dense nutrient-poor foods in Mexico associated with the introduction of a tax in 2014. Prev. Med. 2019, 118, 16–22. [Google Scholar] [CrossRef]


| Food Type | Eating Episode | Setting | Source | Purchaser |
|---|---|---|---|---|
| Core | Kai pongipongi (breakfast) | Church/church hall | Adult | Other child |
| Breads and cereal | Kai ho’atā (lunch) | Community venue | Child | Other adult |
| Fresh fruit | Kai efiafi (dinner) | Fale koloa (convenience store) | Fale koloa (convenience store) | Own purchase |
| Meat and alternatives | Snacking | Fast food restaurant | Fast food restaurant | Not applicable |
| Milk products | Unsure | Full service restaurant | Full service restaurant | Unidentified |
| Staple vegetables | ||||
| Vegetables | Home | Home | ||
| Ngoue’anga (garden) | Mobile food vendor | |||
| Non-core | Other retail | Ngoue’anga (garden) | ||
| Confectionery | Outdoor recreation space | School stall/canteen | ||
| Cookies and cakes | Private transport | Street stall | ||
| Edible ices | Public transport—facility | Supermarket | ||
| Fast foods | Public transport—vehicle | Vending machine | ||
| Fruit canned in syrup, sugar cane | Road | Unknown | ||
| Processed meat | School | |||
| Unhealthy snack foods e.g., packaged chips | Supermarket | |||
| Uncertain | ||||
| Mixed Meals | ||||
| Traditional mixed meal Non-traditional mixed meal | ||||
| Undetermined |
| Sociodemographic Variable | Group | N | % |
|---|---|---|---|
| Gender | Male | 20 | 57.1 |
| Female | 15 | 42.9 | |
| Age (years) * | 10 | 25 | 73.5 |
| 11 | 7 | 20.6 | |
| 12 | 2 | 5.9 | |
| Body mass index category ** | Underweight | 1 | 2.9 |
| Healthy | 28 | 79.9 | |
| Overweight | 5 | 14.3 | |
| Obese/morbidly obese | 1 | 2.9 | |
| School | 1 | 18 | 51.5 |
| 2 | 6 | 17.1 | |
| 3 | 6 | 17.1 | |
| 4 | 5 | 14.3 |
| Category | Core Foods | Non-Core Foods | ||
|---|---|---|---|---|
| Rate (95% CI) | % of Category | Rate (95% CI) | % of Category | |
| Food type | ||||
| Fruits | 1.3 (0.6, 2.6) | 57.3 | ||
| Meat and alternatives | 0.4 (0.1, 1.1) | 16.5 | ||
| Staple vegetables | 0.3 (0.2, 0.7) | 15.1 | ||
| Breads and cereals | 0.2 (0.1, 0.3) | 7.1 | ||
| Vegetables | 0.1 (0.0, 0.6) | 4.0 | ||
| Unhealthy snack foods | 1.5 (1.1, 2.1) | 33.8 | ||
| Confectionery | 1.2 (0.8, 1.7) | 25.6 | ||
| Cookies and cakes * | 1.0 (0.7, 1.4) | 21.6 | ||
| Edibles ices | 0.5 (0.1, 1.8) | 11.0 | ||
| Processed meat | 0.2 (0.1, 0.5) | 4.0 | ||
| Other fruits | 0.2 (0.0, 2.0) | 4.0 | ||
| Fast food | 0.0 (0.0, 0.0) | 0.0 | ||
| TOTAL | 2.3 (1.8, 2.9) | 100.0 | 4.5 (3.3, 6.7) | 100.0 |
| Eating episode | ||||
| Breakfast | 0.1 (0.0, 0.5) | 4.5 | 0.4 (0.1, 1.2) | 8.0 |
| Lunch | 0.3 (0.1, 1.1) | 11.1 | 0.3 (0.1, 0.7) | 5.9 |
| Dinner | 0.1 (0.0, 0.7) | 4.0 | 0.0 (0.0, 0.0) | 0.0 |
| Snack | 1.8 (1.3, 2.6) | 80.4 | 4.0 (2.5, 6.2) | 86.1 |
| TOTAL | 2.3 (1.8, 2.9) | 100.0 | 4.6 (3.3, 6.7) | 100.0 |
| Setting | ||||
| Home | 1.3 (0.8, 2.1) | 60.8 | 1.6 (1.2, 2.0) | 34.1 |
| School | 0.4 (0.2, 1.1) | 18.4 | 1.4 (0.6, 3.2) | 30.2 |
| Road | 0.2 (0.0, 1.5) | 8.3 | 0.9 (0.0, 1.9) | 19.9 |
| Food retail ** | 0.0 (0.0, 0.1) | 0.9 | 0.3 (0.1, 0.6) | 5.5 |
| Church/church hall | 0.1 (0.0, 1.0) | 6.5 | 0.2 (0.0, 0.9) | 3.9 |
| Private transport | 0.0 (0.0, 0.0) *** | 0.0 | 0.1 (0.0, 0.4) | 2.8 |
| Outdoor recreation space | 0.0 (0.0, 0.3) | 0.9 | 0.1 (0.0, 0.4) | 2.4 |
| Garden | 0.1 (0.3, 0.1) | 4.2 | 0.1 (0.0, 2.2) | 1.1 |
| TOTAL | 2.2 (1.8, 2.9) | 100.0 | 4.6 (3.3, 6.7) | 100.0 |
| Source | ||||
| Home | 1.5 (1.1, 2.1) | 82.5 | 1.6 (1.2, 2.0) | 39.5 |
| Child | 0.2 (0.1, 0.6) | 8.7 | 1.0 (0.6, 1.6) | 24.5 |
| Supermarket | 0.0 (0.0, 0.0) | 0.0 | 0.6 (0.1, 3.2) | 15.3 |
| Fale koloa | 0.0 (0.0, 0.7) | 1.1 | 0.4 (0.0, 4.8) | 10.5 |
| School stall | 0.0 (0.0, 0.0) | 0.0 | 0.2 (0.0, 1.3) | 4.6 |
| Adult | 0.0 (0.0, 0.0) | 0.0 | 0.1 (0.1, 0.4) | 3.6 |
| Garden | 0.1 (0.1, 0.4) | 7.7 | 0.1 (0.0, 3.4) | 2.0 |
| Fast food restaurant | 0.0 (0.0, 0.0) | 0.0 | 0.0 (0.0, 0.0) | 0.0 |
| TOTAL | 1.83 (1.8, 2.9) | 100.0 | 4.0 (3.3, 6.6) | 100.0 |
| Purchaser | ||||
| Own purchase | 0.2 (0.0, 0.7) | 100.0 | 0.7 (0.3, 1.8) | 73.0 |
| Other child | 0.0 (0.0, 0.0) | 0.0 | 0.2 (0.1, 0.6) | 24.7 |
| Other adult | 0.0 (0.0, 0.0) | 0.0 | 0.0 (0.0, 0.1) | 2.3 |
| TOTAL | 0.2 (0.0, 0.7) | 100.0 | 0.9 (0.4, 2.2) | 100.0 |
© 2019 by the authors. Licensee MDPI, Basel, Switzerland. This article is an open access article distributed under the terms and conditions of the Creative Commons Attribution (CC BY) license (http://creativecommons.org/licenses/by/4.0/).
Share and Cite
Veatupu, L.; Puloka, V.; Smith, M.; McKerchar, C.; Signal, L. Me’akai in Tonga: Exploring the Nature and Context of the Food Tongan Children Eat in Ha’apai Using Wearable Cameras. Int. J. Environ. Res. Public Health 2019, 16, 1681. https://0-doi-org.brum.beds.ac.uk/10.3390/ijerph16101681
Veatupu L, Puloka V, Smith M, McKerchar C, Signal L. Me’akai in Tonga: Exploring the Nature and Context of the Food Tongan Children Eat in Ha’apai Using Wearable Cameras. International Journal of Environmental Research and Public Health. 2019; 16(10):1681. https://0-doi-org.brum.beds.ac.uk/10.3390/ijerph16101681
Chicago/Turabian StyleVeatupu, Loma, Viliami Puloka, Moira Smith, Christina McKerchar, and Louise Signal. 2019. "Me’akai in Tonga: Exploring the Nature and Context of the Food Tongan Children Eat in Ha’apai Using Wearable Cameras" International Journal of Environmental Research and Public Health 16, no. 10: 1681. https://0-doi-org.brum.beds.ac.uk/10.3390/ijerph16101681