Measuring the Destination Accessibility of Cycling Transfer Trips in Metro Station Areas: A Big Data Approach


Abstract
:1. Introduction
2. Literature Review
2.1. Built Environment and Cycling Behavior
2.2. Gravity-Based Cycling Accessibility
2.3. Public Bicycle-Sharing Systems
2.4. Research Gaps and Our Research Objectives
3. Materials and Methods
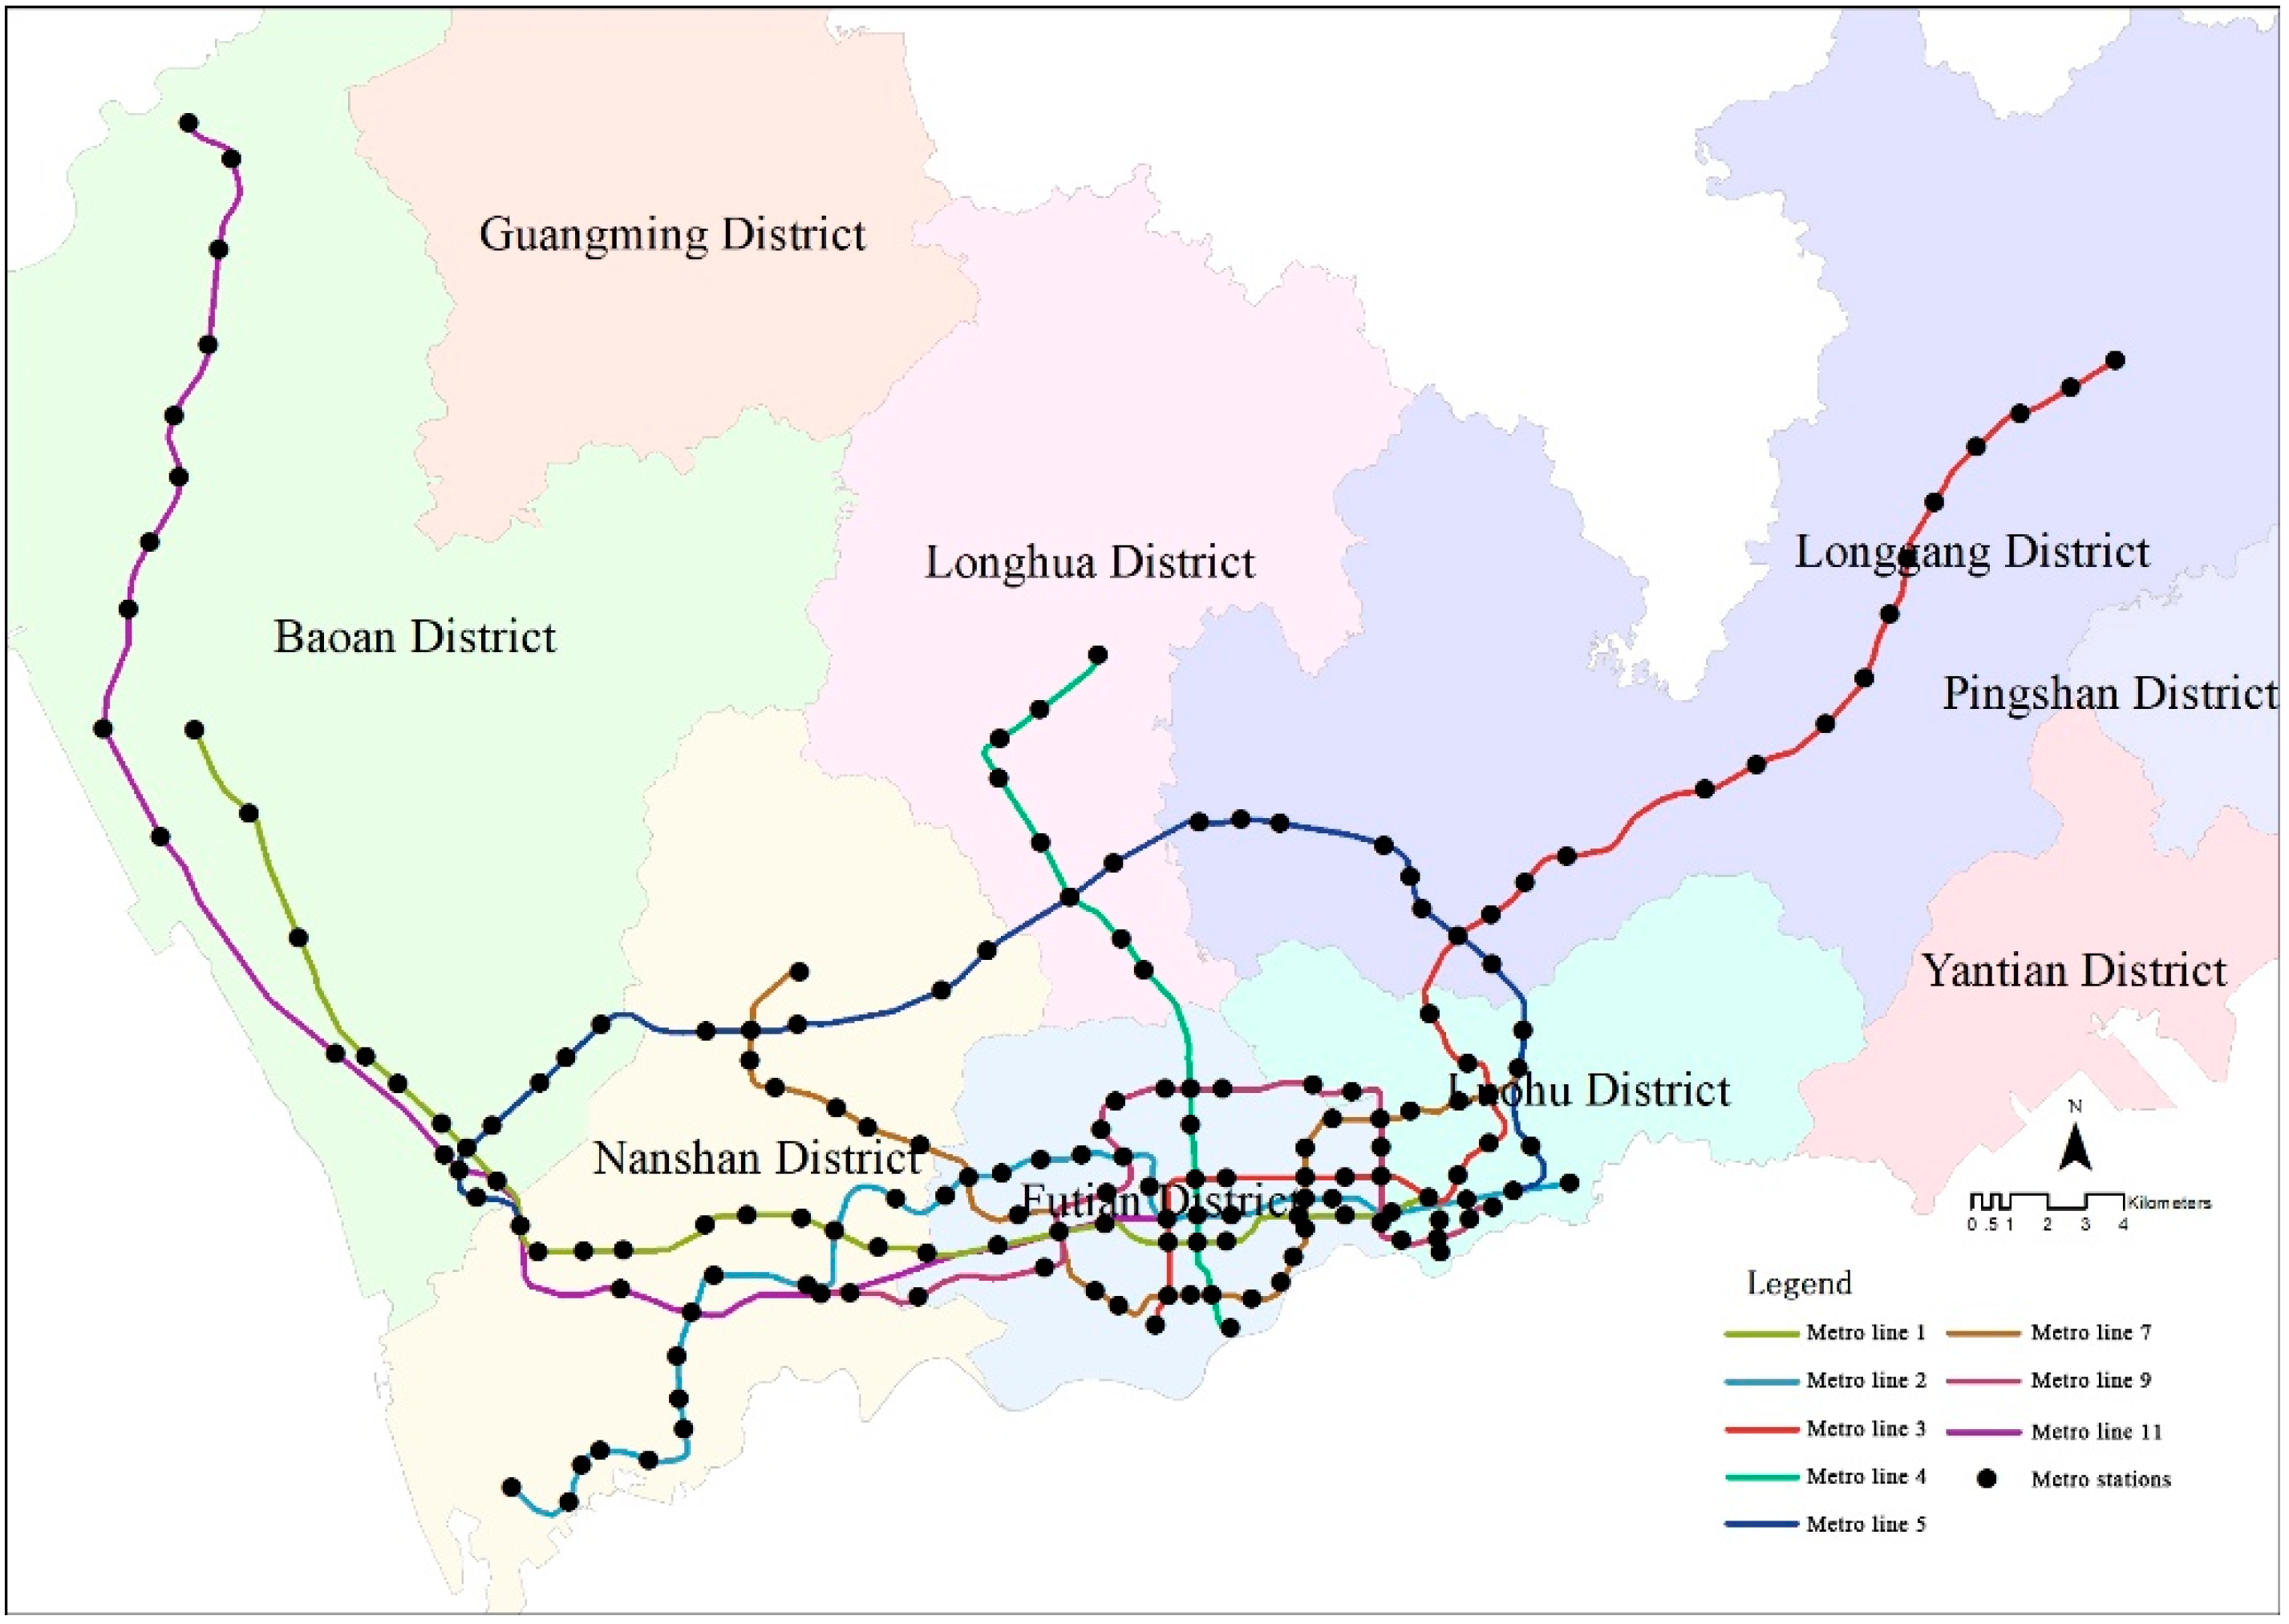
3.1. Study Area
3.2. Data Source
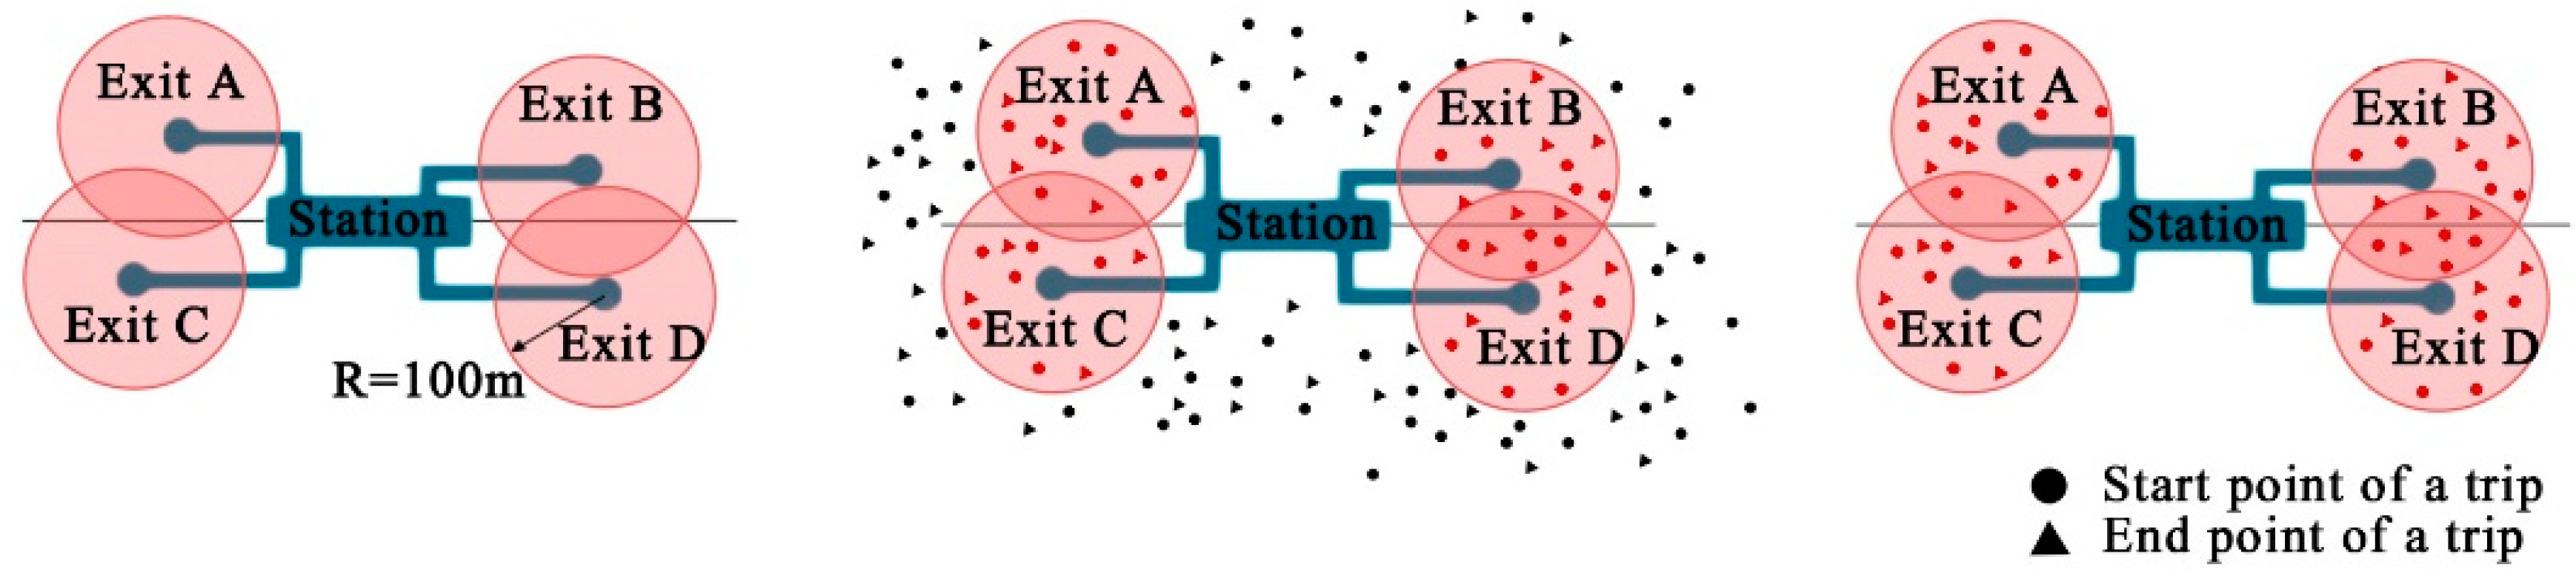
3.2.1. Cycling Data
3.2.2. Points of Interest (POIs)
3.3. Distance-Decay Function
3.4. Measuring Cycling Accessibility
3.5. Modeling the Number of Bicycle-Metro Trips with Proposed Cycling Accessibility Measure
4. Results
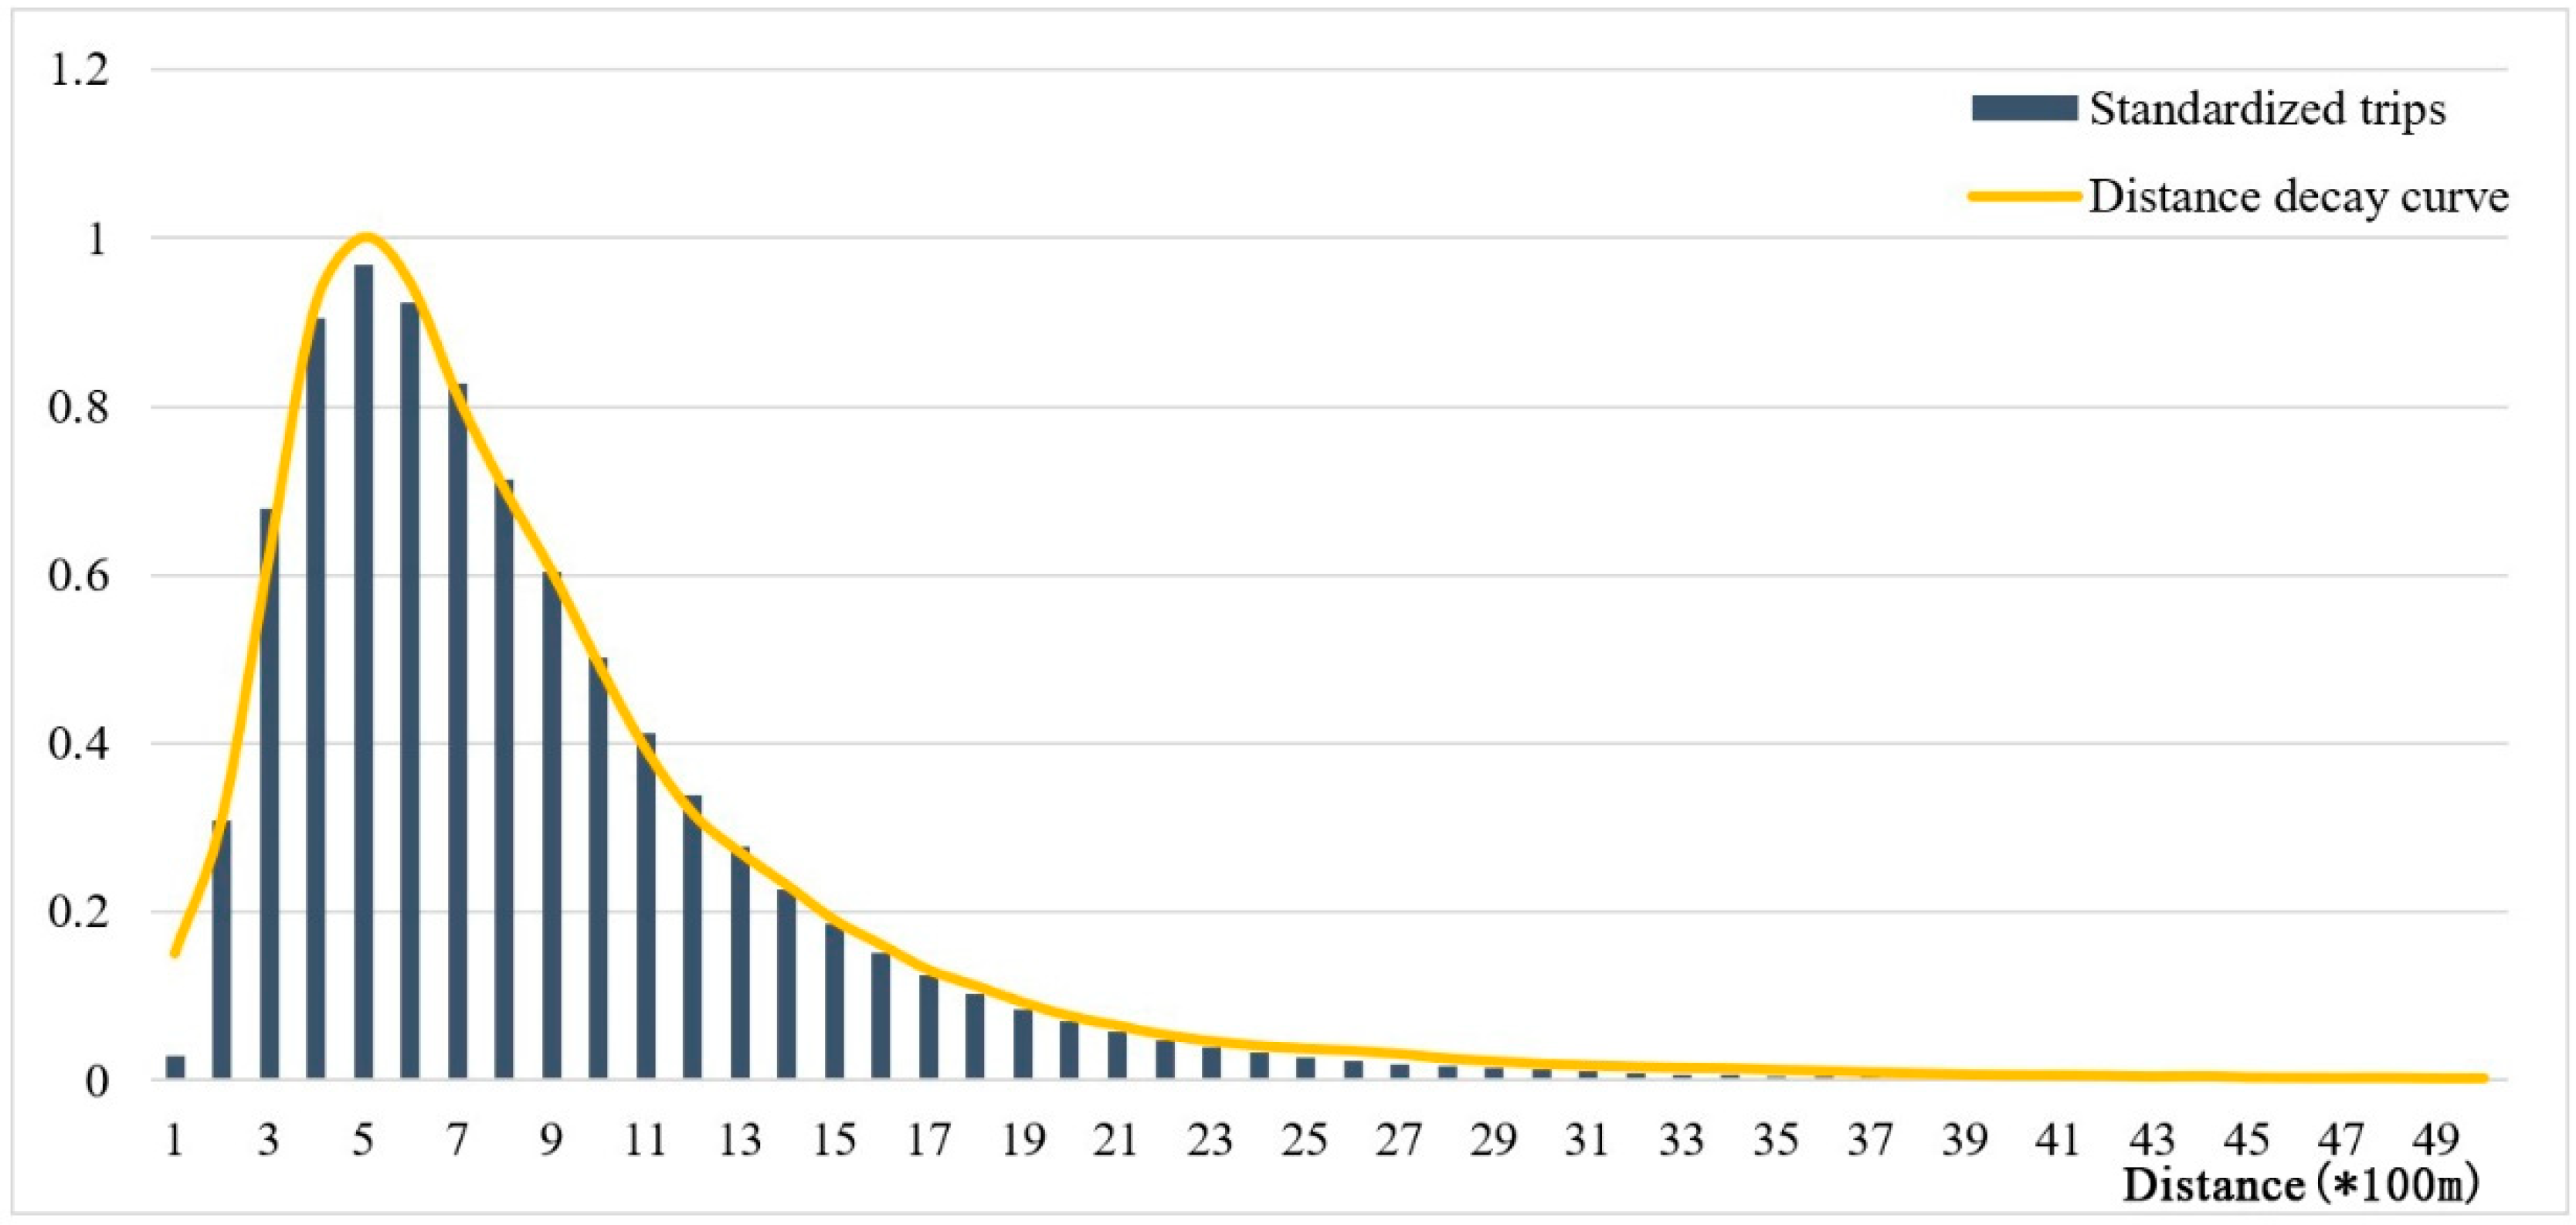
4.1. Characteristics of Cycling Distance Decay
4.2. Mapping Cycling Destination Accessibility
4.3. Regression Models
5. Discussion
6. Conclusions
Author Contributions
Funding
Conflicts of Interest
References
- Fraser, S.D.S.; Lock, K. Cycling for transport and public health: A systematic review of the effect of the environment on cycling. Eur. J. Public Health 2010, 21, 738–743. [Google Scholar] [CrossRef] [PubMed]
- Oja, P.; Titze, S.; Bauman, A.; De Geus, B.; Krenn, P.; Reger-Nash, B.; Kohlberger, T. Health benefits of cycling: A systematic review. Scand. J. Med. Sci. Sports 2011, 21, 496–509. [Google Scholar] [CrossRef] [PubMed]
- Rabl, A.; Nazelle, A.D. Benefits of shift from car to active transport. Transp. Policy 2012, 19, 121–131. [Google Scholar] [CrossRef]
- Pucher, J.; Buehler, R. Cycling for Everyone: Lessons from Europe. Transp. Res. Rec. 2008, 2074, 58–65. [Google Scholar] [CrossRef]
- Lee, I.M.; Shiroma, E.J.; Lobelo, F.; Puska, P.; Blair, S.N.; Katzmarzyk, P.T. Effect of physical inactivity on major non-communicable diseases worldwide: An analysis of burden of disease and life expectancy. Lancet 2012, 380, 219–229. [Google Scholar] [CrossRef]
- Sallis, J.F.; Floyd, M.F.; Rodríguez, D.A.; Saelens, B.E. Role of Built Environments in Physical Activity, Obesity, and Cardiovascular Disease. Circulation 2012, 125, 729–737. [Google Scholar] [CrossRef] [PubMed]
- Nian, G.; Chen, F.; Li, Z.; Zhu, Y.; Sun, D. Evaluating the alignment of new metro line considering network vulnerability with passenger ridership. Transp. A Transp. Sci. 2019, 15, 1402–1418. [Google Scholar] [CrossRef]
- Sun, D.; Guan, S. Measuring vulnerability of urban metro network from line operation perspective. Transp. Res. Part A Policy Pract. 2016, 94, 348–359. [Google Scholar] [CrossRef]
- Zhao, P.; Li, S. Bicycle-metro integration in a growing city: The determinants of cycling as a transfer mode in metro station areas in Beijing. Transp. Res. Part A Policy Pract. 2017, 99, 46–60. [Google Scholar] [CrossRef]
- Chen, J.; Chen, X.; Jiang, H.; Zhu, S.; Li, X.; Li, Z. Determining the Optimal Layout Design for Public Bicycle System within the Attractive Scope of a Metro Station. Math. Probl. Eng. 2015, 2015, 456013. [Google Scholar] [CrossRef]
- Cheng, Y.H.; Lin, Y.C. Expanding the effect of metro station service coverage by incorporating a public bicycle sharing system. Int. J. Sustain. Transp. 2017, 12, 241–252. [Google Scholar] [CrossRef]
- Zhang, Z.; Qian, C.; Bian, Y. Bicycle–metro integration for the ‘last mile’: Visualizing cycling in Shanghai. Environ. Plan. A Econ. Space 2018. [Google Scholar] [CrossRef]
- Wang, R.; Liu, C. Bicycle-Transit Integration in the United States, 2001–2009. J. Public Transp. 2013, 16, 95–119. [Google Scholar] [CrossRef]
- Kerr, J.; Emond, J.A.; Badland, H.; Reis, R.; Sarmiento, O.; Carlson, J.; Sallis, J.F.; Cerin, E.; Cain, K.; Conway, T.; et al. Perceived Neighborhood Environmental Attributes Associated with Walking and Cycling for Transport among Adult Residents of 17 Cities in 12 Countries: The IPEN Study. Environ. Health Perspect. 2016, 124, 290–298. [Google Scholar] [CrossRef] [PubMed] [Green Version]
- Zahabi, S.A.H.; Chang, A.; Miranda-Moreno, L.F.; Patterson, Z. Exploring the link between the neighborhood typologies, bicycle infrastructure and commuting cycling over time and the potential impact on commuter GHG emissions. Transp. Res. Part D Transp. Environ. 2016, 47, 89–103. [Google Scholar] [CrossRef]
- Mertens, L.; Compernolle, S.; Deforche, B.; Mackenbach, J.D.; Lakerveld, J.; Brug, J.; Roda, C.; Feuillet, T.; Oppert, J.M.; Glonti, K.; et al. Built environmental correlates of cycling for transport across Europe. Health Place 2017, 44, 35–42. [Google Scholar] [CrossRef] [PubMed] [Green Version]
- Handy, S. Planning for accessibility: In theory and in practice. In Access to Destinations; Levinson, D., Krizek, K., Eds.; Emerald Group Publishing Limited: Bingley, UK, 2005; pp. 131–147. [Google Scholar]
- Beimborn, E.A.; Greenwald, M.J.; Jin, X. Accessibility, Connectivity, and Captivity: Impacts on Transit Choice. Transp. Res. Rec. 2003, 1835, 1–9. [Google Scholar] [CrossRef]
- Iacono, M.; Krizek, K.J.; El-Geneidy, A. Measuring non-motorized accessibility: Issues, alternatives, and execution. J. Transp. Geogr. 2010, 18, 133–140. [Google Scholar] [CrossRef]
- Vale, D.S.; Saraiva, M.; Pereira, M. Active accessibility: A review of operational measures of walking and cycling accessibility. J. Transp. Land Use 2010, 18, 133–140. [Google Scholar] [CrossRef]
- Saghapour, T.; Moridpour, S.; Thompson, R.G. Measuring cycling accessibility in metropolitan areas. Int. J. Sustain. Transp. 2016, 11, 381–394. [Google Scholar] [CrossRef]
- ITF. Linking People and Places: New Ways of Understanding Spatial Access in Cities; OECD Publishing: Paris, France, 2017. [Google Scholar]
- Lin, J.J.; Zhao, P.; Takada, K.; Li, S.; Yai, T.; Chen, C.H. Built environment and public bike usage for metro access: A comparison of neighborhoods in Beijing, Taipei, and Tokyo. Transp. Res. Part D Transp. Environ. 2018, 63, 209–221. [Google Scholar] [CrossRef]
- Saberi, M.; Ghamami, M.; Gu, Y.; Shojaei, M.H.; Fishman, E. Understanding the impacts of a public transit disruption on bicycle sharing mobility patterns: A case of Tube strike in London. J. Transp. Geogr. 2018, 66, 154–166. [Google Scholar] [CrossRef]
- Shen, Y.; Zhang, X.; Zhao, J. Understanding the usage of dockless bike sharing in Singapore. Int. J. Sustain. Transp. 2018, 12, 686–700. [Google Scholar] [CrossRef]
- Rixey, R.A. Station-Level Forecasting of Bikesharing Ridership. Transp. Res. Rec. 2013, 2387, 46–55. [Google Scholar] [CrossRef] [Green Version]
- El-Assi, W.; Salah Mahmoud, M.; Nurul Habib, K. Effects of built environment and weather on bike sharing demand: A station level analysis of commercial bike sharing in Toronto. Transportation 2015, 44, 589–613. [Google Scholar] [CrossRef]
- Faghih-Imani, A.; Eluru, N. Incorporating the impact of spatio-temporal interactions on bicycle sharing system demand: A case study of New York CitiBike system. J. Transp. Geogr. 2016, 54, 218–227. [Google Scholar] [CrossRef]
- Faghih-Imani, A.; Hampshire, R.; Marla, L.; Eluru, N. An empirical analysis of bike sharing usage and rebalancing: Evidence from Barcelona and Seville. Transp. Res. Part A Policy Pract. 2017, 97, 177–191. [Google Scholar] [CrossRef]
- Cervero, R.; Duncan, M. Walking, Bicycling, and Urban Landscapes: Evidence From the San Francisco Bay Area. Am. J. Public Health 2003, 93, 1478–1483. [Google Scholar] [CrossRef]
- Zhang, Y.; Thomas, T.; Brussel, M.; van Maarseveen, M. Exploring the impact of built environment factors on the use of public bikes at bike stations: Case study in Zhongshan, China. J. Transp. Geogr. 2017, 58, 59–70. [Google Scholar] [CrossRef]
- Moudon, A.V.; Lee, C.; Cheadle, A.D.; Collier, C.W.; Johnson, D.; Schmid, T.L.; Weather, R.D. Cycling and the built environment, a US perspective. Transp. Res. Part D Transp. Environ. 2005, 10, 245–261. [Google Scholar] [CrossRef]
- Guo, J.Y.; Bhat, C.R.; Copperman, R.B. Effect of the Built Environment on Motorized and Nonmotorized Trip Making:Substitutive, Complementary, or Synergistic? Transp. Res. Rec. 2007, 2010, 1–11. [Google Scholar] [CrossRef]
- Buehler, R.; Pucher, J. Cycling to Work in 90 Large American Cities: New Evidence on the Role of Bike Paths and Lanes. Transportation 2012, 39, 409–432. [Google Scholar] [CrossRef]
- Tilahun, N.Y.; Levinson, D.M.; Krizek, K.J. Trails, lanes, or traffic: Valuing bicycle facilities with an adaptive stated preference survey. Transp. Res. Part A Policy Pract. 2007, 41, 287–301. [Google Scholar] [CrossRef] [Green Version]
- Parkin, J.; Wardman, M.; Page, M. Estimation of the determinants of bicycle mode share for the journey to work using census data. Transportation 2008, 35, 93–109. [Google Scholar] [CrossRef]
- Patricia Jasmin, K.; Pekka, O.; Sylvia, T. Route choices of transport bicyclists: A comparison of actually used and shortest routes. Int. J. Behav. Nutr. Phys. Act. 2014, 11, 31. [Google Scholar] [CrossRef]
- Cole-Hunter, T.; Donaire-Gonzalez, D.; Curto, A.; Ambros, A.; Valentin, A.; Garcia-Aymerich, J.; Martínez, D.; Braun, L.M.; Mendez, M.; Jerrett, M.; et al. Objective correlates and determinants of bicycle commuting propensity in an urban environment. Transp. Res. Part D Transp. Environ. 2015, 40, 132–143. [Google Scholar] [CrossRef]
- Lu, Y.; Yang, Y.; Sun, G.; Gou, Z. Associations between overhead-view and eye-level urban greenness and cycling behaviors. Cities 2019, 88, 10–18. [Google Scholar] [CrossRef]
- Handy, S.; Van Wee, B.; Kroesen, M. Promoting cycling for transport: Research needs and challenges. Transp. Rev. 2014, 34, 4–24. [Google Scholar] [CrossRef]
- Chillón, P.; Molina-García, J.; Castillo, I.; Queralt, A. What distance do university students walk and bike daily to class in Spain. J. Transp. Health Place 2016, 3, 315–320. [Google Scholar] [CrossRef]
- Rastogi, R.; Rao, K.V.K. Travel Characteristics of Commuters Accessing Transit: Case Study. J. Transp. Eng. 2003, 129, 684–694. [Google Scholar] [CrossRef]
- Krygsman, S.; Dijst, M.; Arentze, T. Multimodal public transport: An analysis of travel time elements and the interconnectivity ratio. Transp. Policy 2004, 11, 265–275. [Google Scholar] [CrossRef]
- Prins, R.G.; Pierik, F.; Etman, A.; Sterkenburg, R.P.; Kamphuis, C.B.; van Lenthe, F.J. How many walking and cycling trips made by elderly are beyond commonly used buffer sizes: Results from a GPS study. Health Place 2014, 27, 127–133. [Google Scholar] [CrossRef] [PubMed] [Green Version]
- Muhs, C.D.; Clifton, K.J. Do characteristics of walkable environments support bicycling? Toward a definition of bicycle-supported development. J. Transp. Land Use 2015, 9, 1–42. [Google Scholar] [CrossRef]
- Tan, Z.; Q.L. Xue, C. Walking as a Planned Activity: Elevated Pedestrian Network and Urban Design Regulation in Hong Kong. J. Urban Des. 2014, 19, 722–744. [Google Scholar] [CrossRef]
- DeMaio, P. Bike-sharing: History, Impacts, Models of Provision, and Future. J. Public Transp. 2009, 12, 41–60. [Google Scholar] [CrossRef]
- Liu, Z.; Jia, X.; Cheng, W. Solving the Last Mile Problem: Ensure the Success of Public Bicycle System in Beijing. Procedia Soc. Behav. Sci. 2012, 43, 73–78. [Google Scholar] [CrossRef] [Green Version]
- IIMedia’Research. Research on China’s Bike-Sharing Market in Q1; IIMedia Research Company: Guangzhou, China, 2017. [Google Scholar]
- Pal, A.; Zhang, Y.; Kwon, C. Analyzing Mobility Patterns and Imbalance of Free Floating Bike Sharing Systems; University of South Florida: Tampa, FL, USA, 2017. [Google Scholar]
- Leonardo, C.; Michele, O.; Rosalia, C.; Mario, B. Spatio-temporal Clustering and Forecasting Method for Free-Floating Bike Sharing Systems. In Proceedings of the International Conference on Systems Science (ICSS 2016), Wrocław, Poland, 7–9 September 2016; pp. 244–254. [Google Scholar]
- Li, X.; Zhang, Y.; Sun, L.; Liu, Q. Free-Floating Bike Sharing in Jiangsu: Users’ Behaviors and Influencing Factors. Energies 2018, 11, 1664. [Google Scholar] [CrossRef]
- Liu, H.C.; Lin, J.J. Associations of built environments with spatiotemporal patterns of public bicycle use. J. Transp. Geogr. 2019, 74, 299–312. [Google Scholar] [CrossRef]
- Winters, M.; Teschke, K.; Brauer, M.; Fuller, D. Bike Score(R): Associations between urban bikeability and cycling behavior in 24 cities. Int. J. Behav. Nutr. Phys. Act. 2016, 13, 18. [Google Scholar] [CrossRef]
- SUTPC. Evaluation and Analysis of Free-Floating Bicycle-Sharing Development in Shenzhen (2016.10–2017.03); Shenzhen Urban Transport Planning Center: Shenzhen, China, 2017. [Google Scholar]
- Zhao, P. The Impact of the Built Environment on Bicycle Commuting: Evidence from Beijing. Urban Stud. 2013, 51, 1019–1037. [Google Scholar] [CrossRef]
- Médard de Chardon, C.; Caruso, G.; Thomas, I. Bicycle sharing system ‘success’ determinants. Transp. Res. Part A Policy Pract. 2017, 100, 202–214. [Google Scholar] [CrossRef]
- García-Palomares, J.C.; Gutiérrez, J.; Cardozo, O.D. Walking Accessibility to Public Transport: An Analysis Based on Microdata and GIS. Environ. Plan. B Plan. Des. 2013, 40, 1087–1102. [Google Scholar] [CrossRef]
- Iacono, M.; Krizek, K.; El-Geneidy, A. Access to Destinations: How Close is Close Enough? Estimating Accurate Distance Decay Functions for Multiple Modes and Different Purposes; MN/RC 2008-11; Minnesota Department of Transportation: Saint Paul, MN, USA, 2008. [Google Scholar]
- Larsen, J.; El-Geneidy, A. A travel behavior analysis of urban cycling facilities in Montréal, Canada. Transp. Res. Part D Transp. Environ. 2011, 16, 172–177. [Google Scholar] [CrossRef]
- Nielsen, T.A.S.; Skov-Petersen, H. Bikeability—Urban structures supporting cycling. Effects of local, urban and regional scale urban form factors on cycling from home and workplace locations in Denmark. J. Transp. Geogr. 2018, 69, 36–44. [Google Scholar] [CrossRef]
- Lianjia, S. The Lease of Shenzhen. Available online: http://www.guandian.cn/article/20171103/193266.html (accessed on 3 November 2018).
- Wang, Z.; Chen, F.; Xu, T. Interchange between Metro and Other Modes: Access Distance and Catchment Area. J. Urban Plan. Dev. 2016, 142, 04016012. [Google Scholar] [CrossRef]


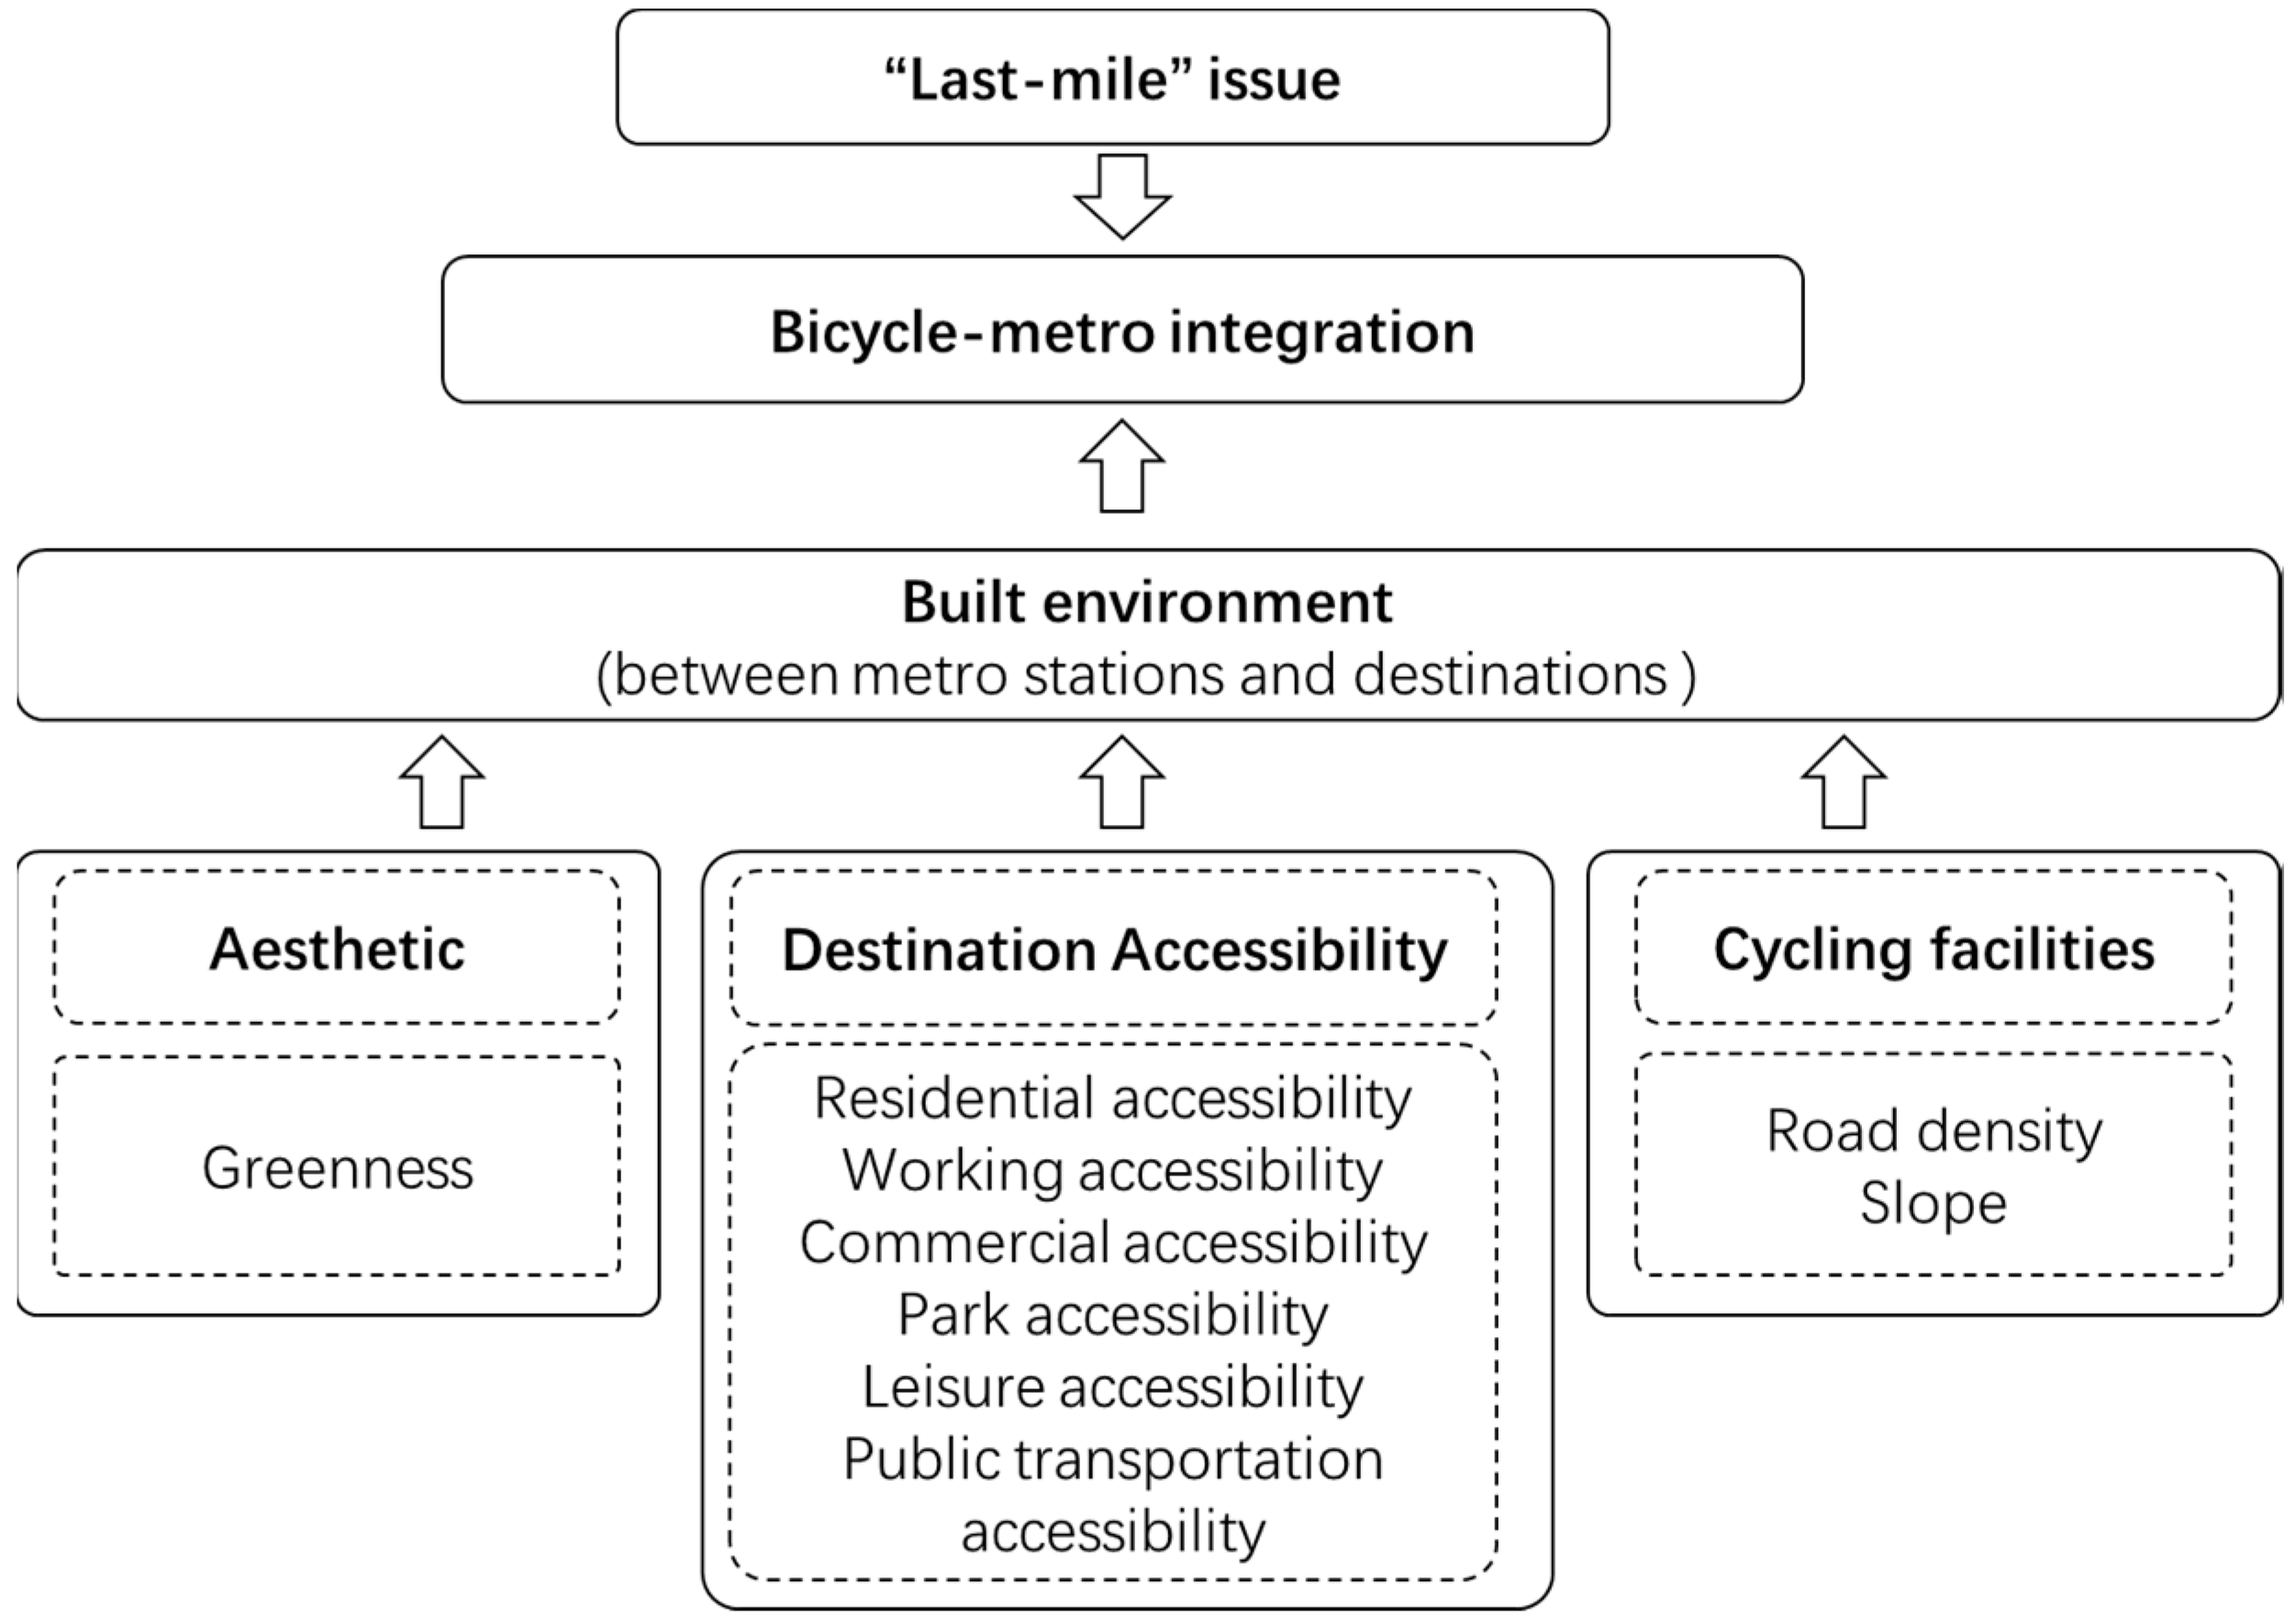
| Dimensions of Built Environment | Indicators | Variable | Measurement |
|---|---|---|---|
| Cycling accessibility | Residence accessibility | RA | The sum of the distances from all residence points of interest (POI) within a 2.5 km buffer to the metro station considering distance decay, as Equation (5) |
| Work accessibility | WA | The sum of the distances from all work POI within a 2.5 km buffer to the metro station considering distance decay, as Equation (5) | |
| Commercial accessibility | CA | The sum of the distances from all commercial POI within a 2.5 km buffer to the metro station considering distance decay, as Equation (5) | |
| Park accessibility | PA | The sum of the distances from all park POI within a 2.5 km buffer to the metro station considering distance decay, as Equation (5) | |
| Leisure accessibility | LA | The sum of the distances from all leisure POI within a 2.5 km buffer to the metro station considering distance decay, as Equation (5) | |
| Public transportation accessibility | PTA | The sum of the distances from all public transportation POI within a 2.5 km buffer to the metro station considering distance decay, as Equation (5) | |
| Cycling infrastructure | Road density | RD | Length of all roads divided by buffer area with a 2.5 km radius |
| Slope | S | The average slope in the 2.5 km buffer | |
| Aesthetic | Greenness | G | The average NDVI value in the 2.5 km buffer |
| Model | Calculation of Cycling Accessibility |
|---|---|
| Model 1 | |
| Model 2 | |
| Model 3 |
| Dimension of Built Environme | Indicator | Model 1 | Model 2 | Model 3 | ||||||
|---|---|---|---|---|---|---|---|---|---|---|
| B | S.E. | Sig | B | S.E. | Sig | B | S.E. | Sig | ||
| Destination accessibility | Resident | −4.80 | 14.47 | 0.74 | −11.27 | 18.66 | 0.55 | −25.90 | 18.71 | 0.17 |
| Working | 4.44 | 1.39 | <0.01 | 6.48 | 2.01 | 0.00 | 7.88 | 2.34 | <0.01 | |
| Commercial | −47.25 | 55.93 | 0.40 | −5.23 | 81.70 | 0.95 | 102.65 | 94.06 | 0.28 | |
| Park | −110.31 | 308.58 | 0.72 | −191.05 | 390.27 | 0.63 | −328.41 | 402.30 | 0.42 | |
| Leisure | 274.54 | 65.29 | <0.01 | 366.97 | 85.36 | 0.00 | 396.27 | 94.02 | <0.01 | |
| Public transport | −0.54 | 9.02 | 0.95 | 6.03 | 12.30 | 0.63 | 12.89 | 13.90 | 0.36 | |
| Cycling infrastructure | Road density | 39.75 | 18.03 | 0.03 | 37.54 | 17.24 | 0.03 | 43.17 | 16.49 | 0.01 |
| Slope | −537.22 | 613.71 | 0.38 | −576.88 | 589.06 | 0.33 | −539.99 | 571.07 | 0.35 | |
| Aesthetic | Greenness | 12,375.89 | 30,664.02 | 0.69 | 13,895.52 | 29,635.42 | 0.64 | 12,119.36 | 28,622.08 | 0.67 |
| Model fit information | Adjusted R2 | 0.365 | 0.411 | 0.445 | ||||||
| Error of std. estimate | 9198.33 | 8857.83 | 8593.16 | |||||||
| Significance | p < 0.01 | p < 0.01 | p < 0.01 | |||||||
© 2019 by the authors. Licensee MDPI, Basel, Switzerland. This article is an open access article distributed under the terms and conditions of the Creative Commons Attribution (CC BY) license (http://creativecommons.org/licenses/by/4.0/).
Share and Cite
Wu, X.; Lu, Y.; Lin, Y.; Yang, Y. Measuring the Destination Accessibility of Cycling Transfer Trips in Metro Station Areas: A Big Data Approach. Int. J. Environ. Res. Public Health 2019, 16, 2641. https://0-doi-org.brum.beds.ac.uk/10.3390/ijerph16152641
Wu X, Lu Y, Lin Y, Yang Y. Measuring the Destination Accessibility of Cycling Transfer Trips in Metro Station Areas: A Big Data Approach. International Journal of Environmental Research and Public Health. 2019; 16(15):2641. https://0-doi-org.brum.beds.ac.uk/10.3390/ijerph16152641
Chicago/Turabian StyleWu, Xueying, Yi Lu, Yaoyu Lin, and Yiyang Yang. 2019. "Measuring the Destination Accessibility of Cycling Transfer Trips in Metro Station Areas: A Big Data Approach" International Journal of Environmental Research and Public Health 16, no. 15: 2641. https://0-doi-org.brum.beds.ac.uk/10.3390/ijerph16152641