What Hinders the Development of Green Building? An Investigation of China


Abstract
:1. Introduction
2. Research Methodology
2.1. Identification of Potential Barriers
2.2. Questionnaire Design and Data Collection
2.3. Data Analysis
3. Results
3.1. Descriptive Statistics
3.2. Analysis of Variance
3.3. Exploratory Factor Analysis
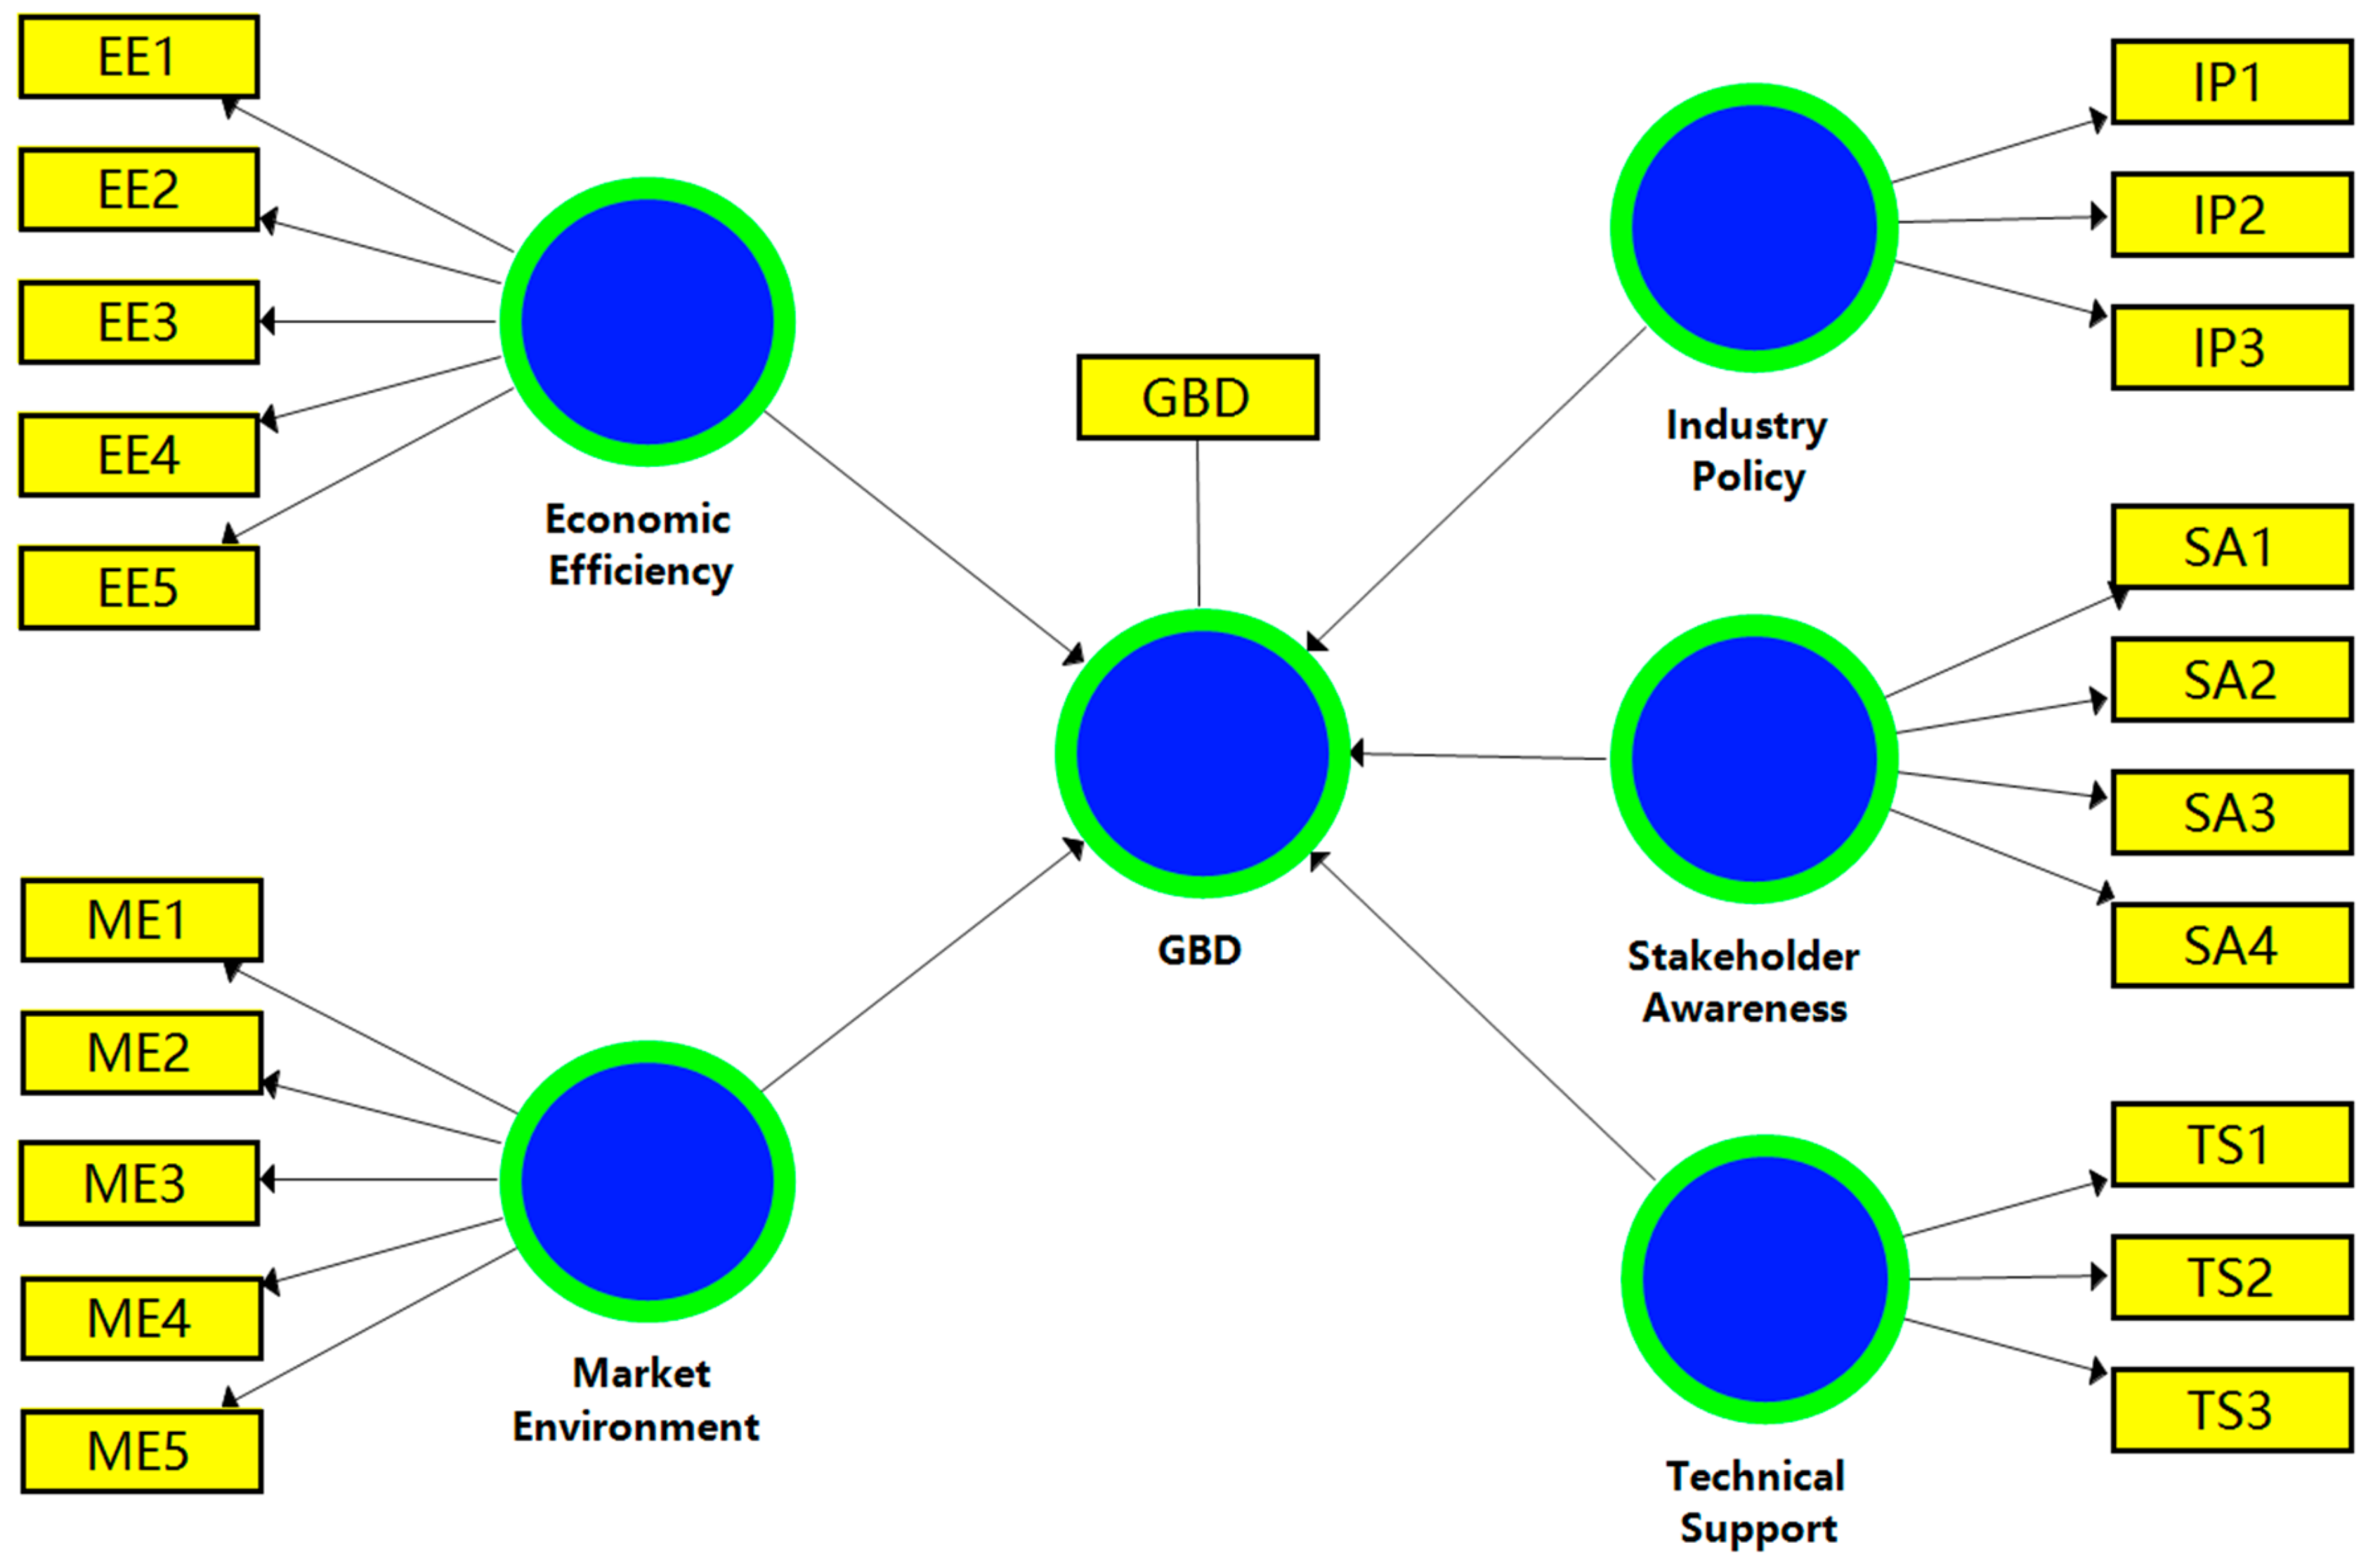
3.4. Partial Least Square Structural Equation Model (PLS-SEM)
3.4.1. Assessment of Outer Measurement Model
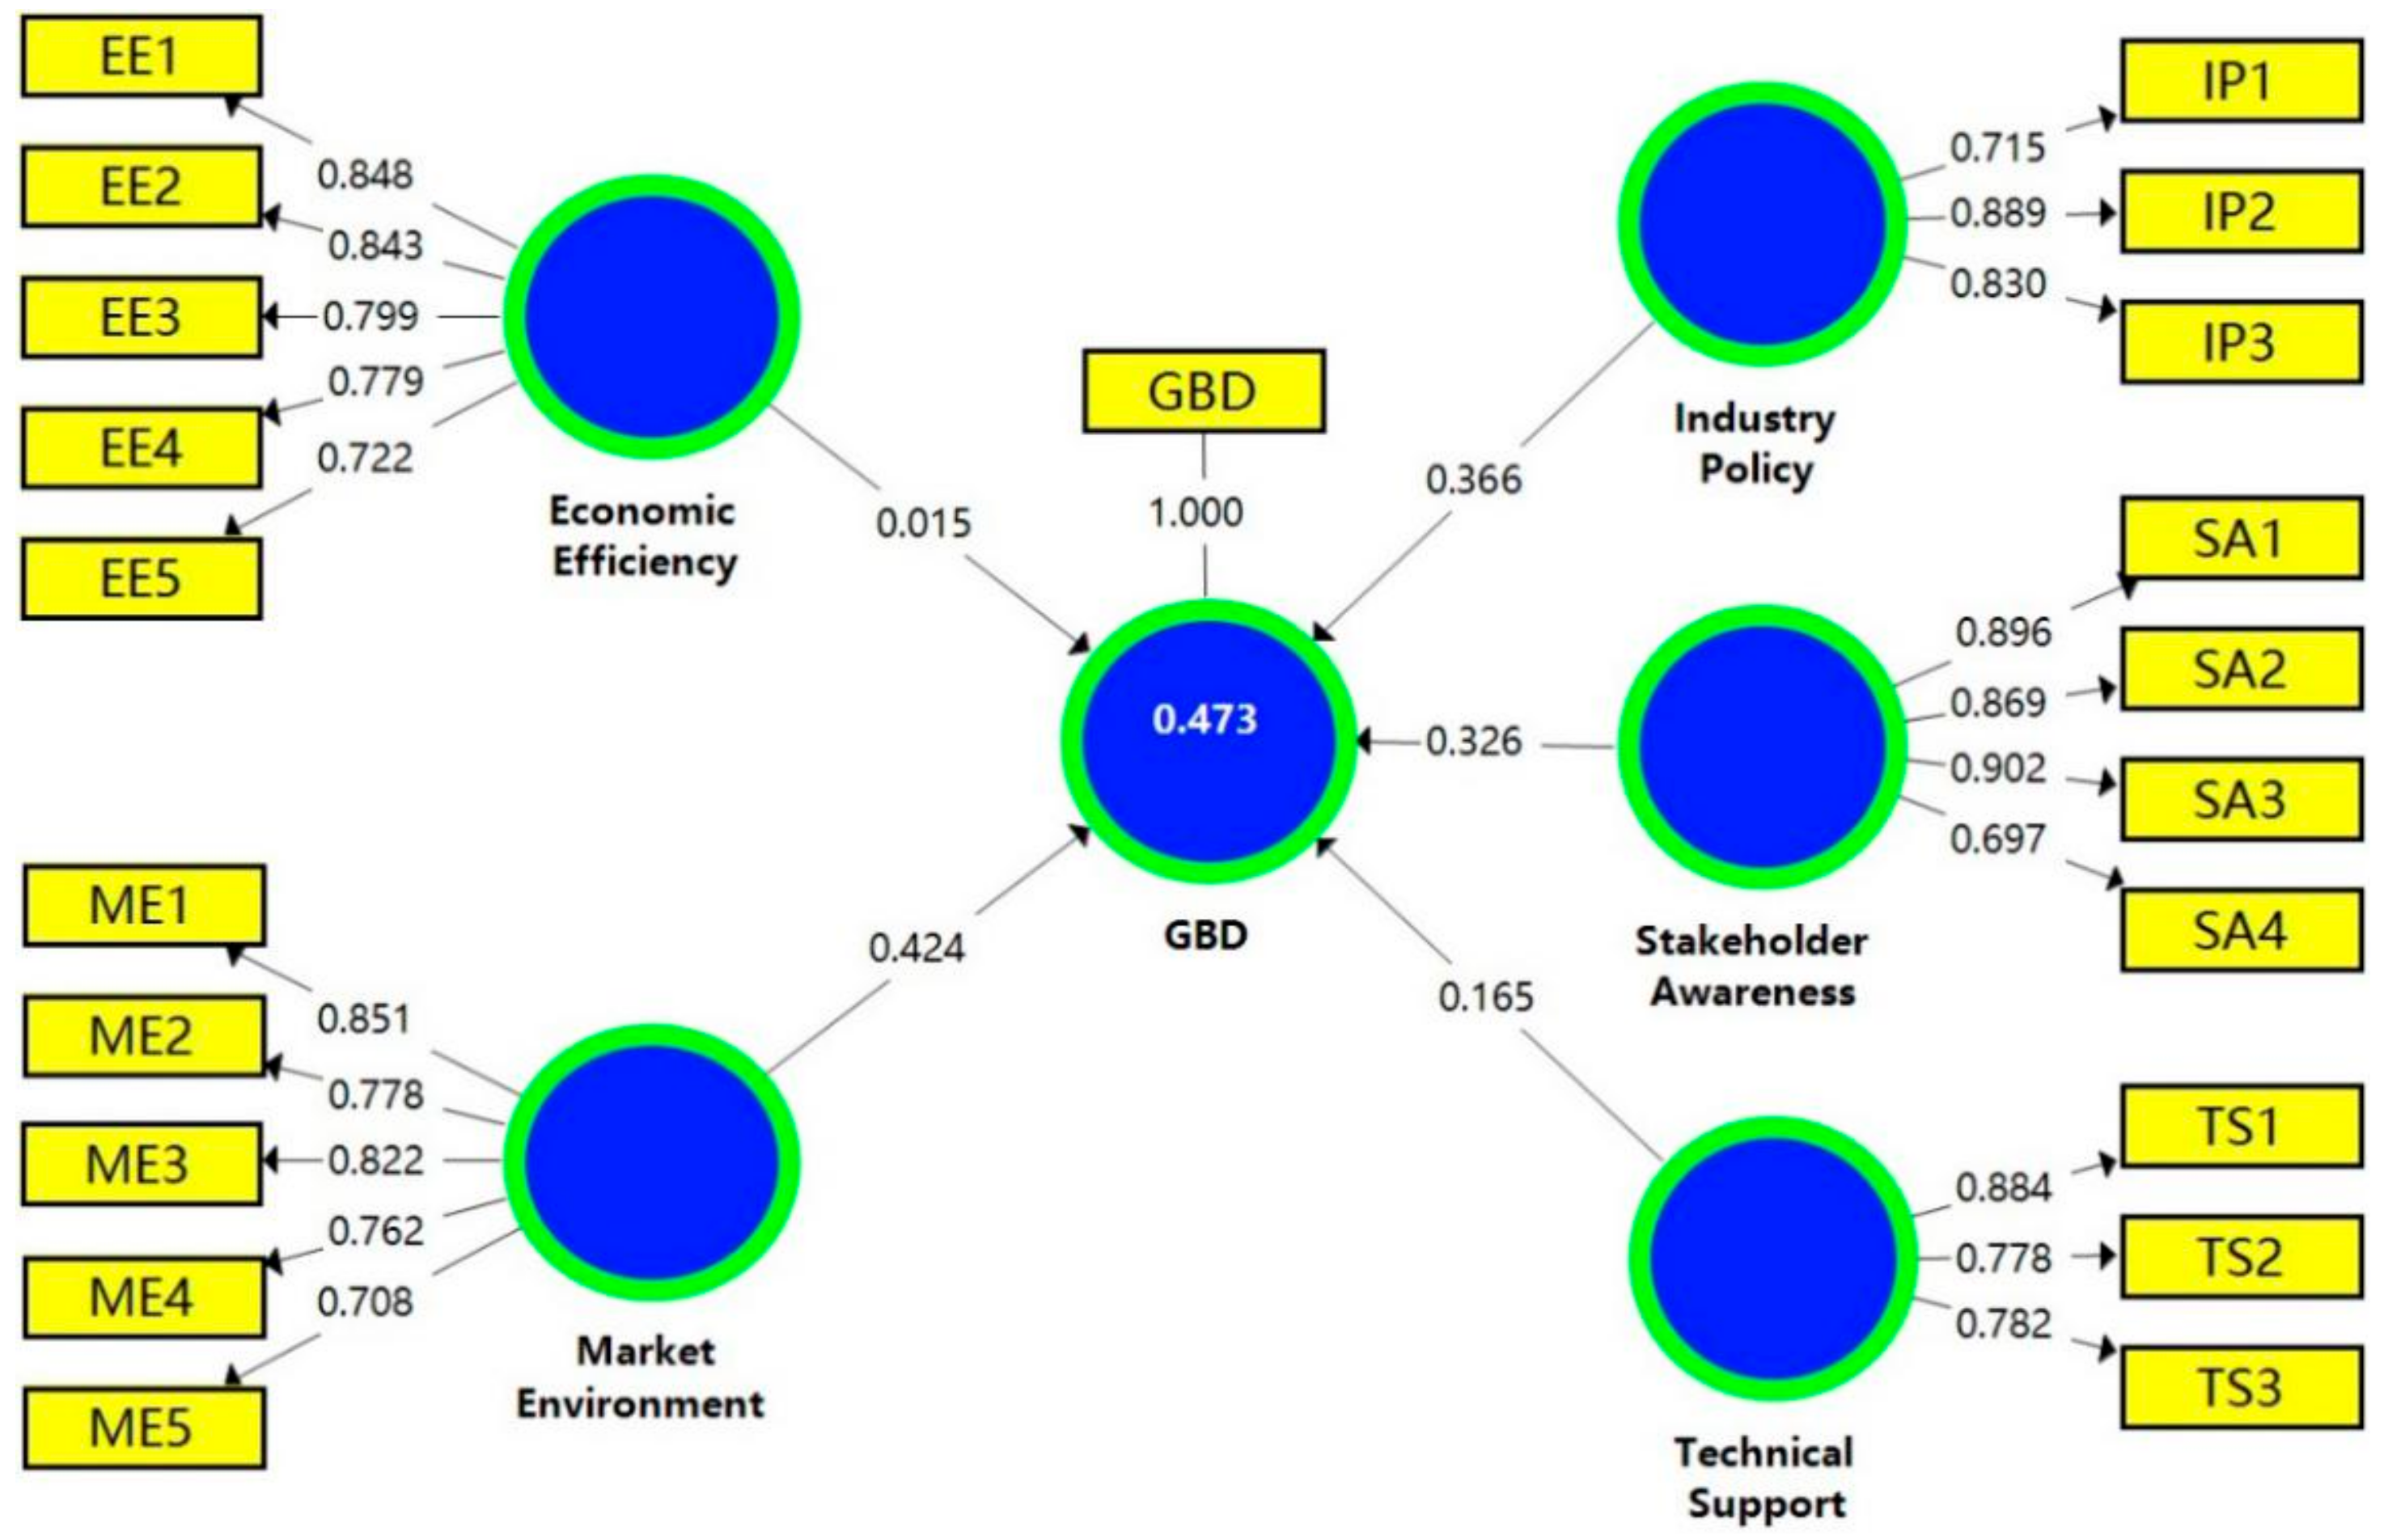
3.4.2. Evaluation of Inner Structure Model
4. Discussion
5. Conclusions
Author Contributions
Funding
Acknowledgments
Conflicts of Interest
References
- Zeng, X.; Duan, H.; Wang, F.; Li, J. Examining environmental management of e-waste: China’s experience and lessons. Renew. Sustain. Energy Rev. 2017, 72, 1076–1082. [Google Scholar] [CrossRef]
- Wei, Y.; Gu, J.; Wang, H.; Yao, T.; Wu, Z. Uncovering the culprits of air pollution: Evidence from China’s economic sectors and regional heterogeneities. J. Clean. Prod. 2018, 171, 1481–1493. [Google Scholar] [CrossRef]
- Wu, Z.; Yu, A.T.W.; Poon, C.S. An off-site snapshot methodology for estimating building construction waste composition—A case study of Hong Kong. Environ. Impact Assess. Rev. 2019, 77, 128–135. [Google Scholar] [CrossRef]
- Wong, J.K.W.; Zhou, J. Enhancing environmental sustainability over building life cycles through green BIM: A review. Autom. Constr. 2015, 57, 156–165. [Google Scholar] [CrossRef]
- Pandey, S. Impact of Green Building Rating Systems on the Sustainability and Efficacy of Green Buildings: Case Analysis of Green Building Index, Malaysia. Available online: https://scienceimpact.mit.edu/sites/default/files/documents/Pandey.pdf (accessed on 24 August 2019).
- Leising, E.; Quist, J.; Bocken, N. Circular Economy in the building sector: Three cases and a collaboration tool. J. Clean. Prod. 2018, 176, 976–989. [Google Scholar] [CrossRef]
- Hwang, B.-G.; Tan, J.S. Green building project management: Obstacles and solutions for sustainable development. Sustain. Dev. 2012, 20, 335–349. [Google Scholar] [CrossRef]
- Wu, Z.; Li, H.; Feng, Y.; Luo, X.; Chen, Q. Developing a green building evaluation standard for interior decoration: A case study of China. Build. Environ. 2019, 152, 50–58. [Google Scholar] [CrossRef]
- Ali, H.H.; Al Nsairat, S.F. Developing a green building assessment tool for developing countries—Case of Jordan. Build. Environ. 2009, 44, 1053–1064. [Google Scholar] [CrossRef]
- Cole, R.J. Emerging trends in building environmental assessment methods. Build. Res. Inf. 1998, 26, 3–16. [Google Scholar] [CrossRef]
- Doan, D.T.; Ghaffarianhoseini, A.; Naismith, N.; Zhang, T.; Ghaffarianhoseini, A.; Tookey, J. A critical comparison of green building rating systems. Build. Environ. 2017, 123, 243–260. [Google Scholar] [CrossRef]
- Li, Y.; Chen, X.; Wang, X.; Xu, Y.; Chen, P.-H. A review of studies on green building assessment methods by comparative analysis. Energy Build. 2017, 146, 152–159. [Google Scholar] [CrossRef]
- Olubunmi, O.A.; Xia, P.B.; Skitmore, M. Green building incentives: A review. Renew. Sustain. Energy Rev. 2016, 59, 1611–1621. [Google Scholar] [CrossRef] [Green Version]
- He, B.-J.; Zhao, D.-X.; Zhu, J.; Darko, A.; Gou, Z.-H. Promoting and implementing urban sustainability in China: An integration of sustainable initiatives at different urban scales. Habitat Int. 2018, 82, 83–93. [Google Scholar] [CrossRef]
- Gou, Z.; Xie, X. Evolving green building: Triple bottom line or regenerative design? J. Clean. Prod. 2017, 153, 600–607. [Google Scholar] [CrossRef]
- He, B.J. Towards the next generation of green building for urban heat island mitigation: Zero UHI impact building. Sustain. Cities Soc. 2019, 50, 101647. [Google Scholar] [CrossRef]
- Geng, Y.; Dong, H.; Xue, B.; Fu, J. An Overview of Chinese Green Building Standards. Sustain. Dev. 2012, 20, 211–221. [Google Scholar] [CrossRef]
- Ding, Z.; Fan, Z.; Tam, V.W.Y.; Bian, Y.; Li, S.; Illankoon, I.M.C.S.; Moon, S. Green building evaluation system implementation. Build. Environ. 2018, 133, 32–40. [Google Scholar] [CrossRef]
- Mao, C.; Shen, Q.; Pan, W.; Ye, K. Major Barriers to Off-Site Construction: The Developer’s Perspective in China. J. Manag. Eng. 2015, 31, 04014043. [Google Scholar] [CrossRef]
- Darko, A.; Chan, A.P.C.; Yang, Y.; Shan, M.; He, B.-J.; Gou, Z. Influences of barriers, drivers, and promotion strategies on green building technologies adoption in developing countries: The Ghanaian case. J. Clean. Prod. 2018, 200, 687–703. [Google Scholar] [CrossRef]
- USGBC. 2017 China Green Building Report: From Green to Health. Available online: https://www.usgbc.org/sites/default/files/2017-china-green-building-report.pdf (accessed on 18 July 2018).
- Li, Y.; Yang, L.; He, B.; Zhao, D. Green building in China: Needs great promotion. Sustain. Cities Soc. 2014, 11, 1–6. [Google Scholar] [CrossRef]
- Zhang, L.; Wu, J.; Liu, H. Policies to enhance the drivers of green housing development in China. Energy Policy 2018, 121, 225–235. [Google Scholar] [CrossRef]
- Liu, X.; Hu, W. Attention and sentiment of Chinese public toward green buildings based on Sina Weibo. Sustain. Cities Soc. 2019, 44, 550–558. [Google Scholar] [CrossRef]
- Huo, X.; Yu, A.T.W.; Darko, A.; Wu, Z. Critical factors in site planning and design of green buildings: A case of China. J. Clean. Prod. 2019, 222, 685–694. [Google Scholar] [CrossRef]
- Yin, S.; Li, B.; Xing, Z. The governance mechanism of the building material industry (BMI) in transformation to green BMI: The perspective of green building. Sci. Total Environ. 2019, 677, 19–33. [Google Scholar] [CrossRef]
- Olanipekun, A.O.; Chan, A.P.C.; Xia, B.; Adedokun, O.A. Applying the self-determination theory (SDT) to explain the levels of motivation for adopting green building. Int. J. Constr. Manag. 2018, 18, 120–131. [Google Scholar] [CrossRef]
- Bamgbade, J.A.; Kamaruddeen, A.M.; Nawi, M.N.M.; Yusoff, R.Z.; Azahari, B.R. Does government support matter? Influence of organizational culture on sustainable construction among Malaysian contractors. Int. J. Constr. Manag. 2018, 18, 93–107. [Google Scholar] [CrossRef]
- Love, P.E.D.; Niedzweicki, M.; Bullen, P.A.; Edwards, D.J. Achieving the Green Building Council of Australia’s world leadership rating in an office building in Perth. J. Constr. Eng. Manag. 2012, 138, 652–660. [Google Scholar] [CrossRef]
- Williams, K.; Dair, C. What is stopping sustainable building in England? Barriers experienced by stakeholders in delivering sustainable developments. Sustain. Dev. 2007, 15, 135–147. [Google Scholar] [CrossRef]
- Lam Patrick, T.I.; Chan Edwin, H.W.; Chau, C.K.; Poon, C.S.; Chun, K.P. Integrating Green Specifications in Construction and Overcoming Barriers in Their Use. J. Prof. Issues Eng. Educ. Pract. 2009, 135, 142–152. [Google Scholar] [CrossRef]
- Masrom, M.A.N.; Rahim, M.H.I.A.; Ann, S.C.; Mohamed, S.; Goh, K.C. A Preliminary Exploration of the Barriers of Sustainable Refurbishment for Commercial Building Projects in Malaysia. Procedia Eng. 2017, 180, 1363–1371. [Google Scholar] [CrossRef]
- Chan, A.P.C.; Darko, A.; Olanipekun, A.O.; Ameyaw, E.E. Critical barriers to green building technologies adoption in developing countries: The case of Ghana. J. Clean. Prod. 2018, 172, 1067–1079. [Google Scholar] [CrossRef]
- Zhang, X.; Platten, A.; Shen, L. Green property development practice in China: Costs and barriers. Build. Environ. 2011, 46, 2153–2160. [Google Scholar] [CrossRef]
- Marsden, P.V.; Wright, J.D. Handbook of Survey Research; Emerald Group Publishing: Bingley, UK, 2010. [Google Scholar]
- Wu, Z.; Yu, A.T.W.; Shen, L. Investigating the determinants of contractor’s construction and demolition waste management behavior in Mainland China. Waste Manag. 2017, 60, 290–300. [Google Scholar] [CrossRef] [PubMed]
- Zhang, L.; Chen, L.; Wu, Z.; Xue, H.; Dong, W. Key Factors Affecting Informed Consumers’ Willingness to Pay for Green Housing: A Case Study of Jinan, China. Sustainability 2018, 10, 1711. [Google Scholar] [CrossRef]
- Zhang, X.; Shen, L.; Wu, Y. Green strategy for gaining competitive advantage in housing development: A China study. J. Clean. Prod. 2011, 19, 157–167. [Google Scholar] [CrossRef]
- Wang, H.; Ju, P.; Xu, H.; Wong, D. Are Grassroots Sports Events Good for Migrant Cities’ Sustainable Development? A Case Study of the Shenzhen 100 km Hikathon. Sustainability 2019, 11, 256. [Google Scholar] [CrossRef]
- Li, Y.; Song, Y.; Wang, J.; Li, C. Intellectual Capital, Knowledge Sharing, and Innovation Performance: Evidence from the Chinese Construction Industry. Sustainability 2019, 11, 2713. [Google Scholar] [CrossRef]
- Zhang, L.; Chen, L.; Wu, Z.; Zhang, S.; Song, H. Investigating Young Consumers’ Purchasing Intention of Green Housing in China. Sustainability 2018, 10, 1044. [Google Scholar] [CrossRef]
- Rodriguez-Nikl, T.; Kelley, J.; Xiao, Q.; Hammer, K.; Tilt, B. Structural Engineers and Sustainability: An Opinion Survey. J. Prof. Issues in Eng. Educ. Pract. 2015, 141, 04014011. [Google Scholar] [CrossRef]
- Rahman, M.M. Barriers of Implementing Modern Methods of Construction. J. Manag. Eng. 2014, 30, 69–77. [Google Scholar] [CrossRef] [Green Version]
- Zhao, X.; Hwang, B.-G.; Low, S.P. Critical success factors for enterprise risk management in Chinese construction companies. Constr. Manag. Econ. 2013, 31, 1199–1214. [Google Scholar] [CrossRef]
- Bryant, F.; Yarnold, P. Principal-Component Analysis and Exploratory and Confirmatory Factor Analysis; American Psychological Association: Washington, DC, USA, 1995. [Google Scholar]
- Norusis, M.J. SPSS for Windows: Base System User’s Guide, Release 5.0; SPSS Inc: Chicago, IL, USA, 1993. [Google Scholar]
- Wang, Z.; Liu, X.; Liu, Q. Study of the Relationship between Political Connections and Corporate Re-Entrepreneurial Performance. Sustainability 2019, 11, 4027. [Google Scholar] [CrossRef]
- Liu, J.; Zhao, X.; Yan, P. Risk Paths in International Construction Projects: Case Study from Chinese Contractors. J. Constr. Eng. Manag. 2016, 142, 05016002. [Google Scholar] [CrossRef]
- Blanthorne, C.; Jones-Farmer, L.A.; Dreike Almer, E. Why You Should Consider SEM: A Guide to Getting Started; Emerald Group: Bingley, UK, 2006; Volume 9, pp. 179–207. [Google Scholar]
- Zhu, X.; Zhang, P.; Wei, Y.; Li, Y.; Zhao, H. Measuring the efficiency and driving factors of urban land use based on the DEA method and the PLS-SEM model—A case study of 35 large and medium-sized cities in China. Sustain. Cities Soc. 2019, 50, 101646. [Google Scholar] [CrossRef]
- Wei, Y.; Zhu, X.; Li, Y.; Yao, T.; Tao, Y. Influential factors of national and regional CO2 emission in China based on combined model of DPSIR and PLS-SEM. J. Clean. Prod. 2019, 212, 698–712. [Google Scholar] [CrossRef]
- Hussain, S.; Fang Wei, Z.; Ali, Z. Examining Influence of Construction Projects’ Quality Factors on Client Satisfaction Using Partial Least Squares Structural Equation Modeling. J. Constr. Eng. Manag. 2019, 145, 05019006. [Google Scholar] [CrossRef]
- Doloi, H. Rationalizing the Implementation of Web-Based Project Management Systems in Construction Projects Using PLS-SEM. J. Constr. Eng. Manag. 2014, 140, 04014026. [Google Scholar] [CrossRef]
- Ning, Y. Quantitative effects of drivers and barriers on networking strategies in public construction projects. Int. J. Proj. Manag. 2014, 32, 286–297. [Google Scholar] [CrossRef]
- Chin, W.; Marcoulides, G. The Partial Least Squares Approach to Structural Equation Modeling; Psychology Press: East Sussex, UK, 1998; Volume 8, pp. 295–336. [Google Scholar]
- Hair, J.F.; Ringle, C.M.; Sarstedt, M. PLS-SEM: Indeed a Silver Bullet. J. Market. Theory Pract. 2011, 19, 139–152. [Google Scholar] [CrossRef]
- Zhao, X.; Singhaputtangkul, N. Effects of Firm Characteristics on Enterprise Risk Management: Case Study of Chinese Construction Firms Operating in Singapore. J. Manag. Eng. 2016, 32, 05016008. [Google Scholar] [CrossRef]
- Chang, T.; Deng, X.; Hwang, B.-G. Investigating Political Risk Paths in International High-Speed Railway Projects: The Case of Chinese International Contractors. Sustainability 2019, 11, 4157. [Google Scholar] [CrossRef]
- Zhao, X.; Hwang, B.-G.; Pheng Low, S.; Wu, P. Reducing Hindrances to Enterprise Risk Management Implementation in Construction Firms. J. Constr. Eng. Manag. 2015, 141, 04014083. [Google Scholar] [CrossRef]
- Gong, P.; Zeng, N.; Ye, K.; König, M. An Empirical Study on the Acceptance of 4D BIM in EPC Projects in China. Sustainability 2019, 11, 1316. [Google Scholar] [CrossRef]
- Zeng, N.; Liu, Y.; Mao, C.; König, M. Investigating the Relationship between Construction Supply Chain Integration and Sustainable Use of Material: Evidence from China. Sustainability 2018, 10, 3581. [Google Scholar] [CrossRef]
- Yang, J.; Yang, Z. Critical factors affecting the implementation of sustainable housing in Australia. J. Hous. Built Environ. 2015, 30, 275–292. [Google Scholar] [CrossRef]
- Nguyen, H.-T.; Skitmore, M.; Gray, M.; Zhang, X.; Olanipekun, A.O. Will green building development take off? An exploratory study of barriers to green building in Vietnam. Resour. Conserv. Recycl. 2017, 127, 8–20. [Google Scholar] [CrossRef] [Green Version]
- Samari, M.; Godrati, N.; Esmaeilifar, R.; Olfat, P.; Shafiei, M.W.M. The investigation of the barriers in developing green building in Malaysia. Mod. Appl. Sci. 2013, 7, 1. [Google Scholar] [CrossRef]
- Zhang, X.; Shen, L.; Wu, Y.; Qi, G. Barriers to implement green strategy in the process of developing real estate projects. Open Waste Manag. J. 2011, 4, 33–37. [Google Scholar]
- Ahmad, T.; Aibinu, A.A.; Stephan, A. Managing green building development—A review of current state of research and future directions. Build. Environ. 2019, 155, 83–104. [Google Scholar] [CrossRef]
- Häkkinen, T.; Belloni, K. Barriers and drivers for sustainable building. Build. Res. Inf. 2011, 39, 239–255. [Google Scholar] [CrossRef]
- Afshari, H.; Issa, M.H.; Peng, Q. Barriers to the design, construction, operation and maintenance of green buildings: A state-of-the-art review. Proceedings of CSCE Annual General Meeting and Conference, Montreal, QC, Canada, 29 May–1 June 2013. [Google Scholar]
- Ahn, Y.H.; Pearce, A.R.; Wang, Y.; Wang, G. Drivers and barriers of sustainable design and construction: The perception of green building experience. Int. J. Sustain. Build. Technol. Urban Dev. 2013, 4, 35–45. [Google Scholar] [CrossRef]
- Chan, A.P.C.; Darko, A.; Ameyaw Ernest, E.; Owusu-Manu, D.-G. Barriers Affecting the Adoption of Green Building Technologies. J. Manag. Eng. 2017, 33, 04016057. [Google Scholar] [CrossRef]
- Shen, W.; Tang, W.; Siripanan, A.; Lei, Z.; Duffield, C.F.; Hui, F.K.P. Understanding the Green Technical Capabilities and Barriers to Green Buildings in Developing Countries: A Case Study of Thailand. Sustainability 2018, 10, 3585. [Google Scholar] [CrossRef]
- Thong, K.-C.; Wong, W.-P. Pathways for Sustainable Supply Chain Performance—Evidence from a Developing Country, Malaysia. Sustainability 2018, 10, 2781. [Google Scholar] [CrossRef]
- Hair, J.F.; Black, W.C.; Babin, B.J.; Anderson, R.E.; Tatham, R.L. Multivariate Data Analysis; Pearson Prentice Hall: Upper Saddle River, NJ, USA, 2006. [Google Scholar]
- Salonen, O.A.; Siirilä, J.; Valtonen, M. Sustainable Living in Finland: Combating Climate Change in Everyday Life. Sustainability 2018, 10, 104. [Google Scholar] [CrossRef]
- Nong, X.; Shao, D.; Xiao, Y.; Zhong, H. Spatio-Temporal Characterization Analysis and Water Quality Assessment of the South-to-North Water Diversion Project of China. Int. J. Environ. Res. Public Health 2019, 16, 2227. [Google Scholar] [CrossRef]
- Liu, B.; Wang, X.; Xia, N.; Ni, W. Critical Success Factors for the Management of Public Participation in Urban Renewal Projects: Perspectives from Governments and the Public in China. J. Urban Plan. Dev. 2018, 144, 04018026. [Google Scholar] [CrossRef]
- Hair, J.F.; Black, W.C.; Babin, B.J.; Anderson, R.E. Multivariate Data Analysis: Pearson New International Edition; Pearson Higher Education: London, UK, 2013. [Google Scholar]
- Anderson, J.C.; Gerbing, D.W. Structural Equation Modeling in Practice: A Review of Recommended Two-Step Approach. Psychol. Bull. 1988, 103, 411–423. [Google Scholar] [CrossRef]
- Wen, L.; Li, Z. Driving forces of national and regional CO2 emissions in China combined IPAT-E and PLS-SEM model. Sci. Total Environ. 2019, 690, 237–247. [Google Scholar] [CrossRef]
- Nunnally, J.C.; Bernstein, I.H. The Assessment of Reliability; McGraw-Hill Education: New York, NY, USA, 1994; Volume 8, pp. 248–292. [Google Scholar]
- Fornell, C.; Larcker, D.F. Evaluating Structural Equation Models with Unobservable Variables and Measurement Error. J. Mark. Res. 1981, 18, 39–50. [Google Scholar] [CrossRef]
- Sarstedt, M.; Ringle, C.M.; Smith, D.; Reams, R.; Hair, J.F. Partial least squares structural equation modeling (PLS-SEM): A useful tool for family business researchers. J. Fam. Bus. Strateg. 2014, 5, 105–115. [Google Scholar] [CrossRef]
- Ting, H.; Thaichon, P.; Chuah, F.; Tan, S.R. Consumer behaviour and disposition decisions: The why and how of smartphone disposition. J. Retail. Consum. Serv. 2019, 51, 212–220. [Google Scholar] [CrossRef]
- Joe, F.H.J. Partial least squares structural equation modeling (PLS-SEM). Eur. Bus. Rev. 2014, 26, 106–121. [Google Scholar] [CrossRef]
- Ahmad, A.; Hussain, A.; Mughal, M.P.; Mufti, N.A.; Saleem, M.Q. Path Analysis of the Antecedents and Occupational Stress Among the Managers of the Textile Industries: A Cross-Sectional Study from Pakistan Using PLS-SEM. In Advances in Social and Occupational Ergonomics; Springer: Cham, Switzerland, 2019; pp. 480–490. [Google Scholar]
- Rampasso, I.S.; Anholon, R.; Silva, D.; Cooper Ordoñez, R.E.; Santa-Eulalia, L.A.; Quelhas, O.L.G.; Leal Filho, W.; Granada Aguirre, L.F. Analysis of the perception of engineering students regarding sustainability. J. Clean. Prod. 2019, 233, 461–467. [Google Scholar] [CrossRef]
- Wang, W.; Zhang, S.; Su, Y.; Deng, X. Key Factors to Green Building Technologies Adoption in Developing Countries: The Perspective of Chinese Designers. Sustainability 2018, 10, 4135. [Google Scholar] [CrossRef]
- Darko, A.; Chan, A.P.C. Review of Barriers to Green Building Adoption. Sustain. Dev. 2017, 25, 167–179. [Google Scholar] [CrossRef]
- Osmani, M.; O’Reilly, A. Feasibility of zero carbon homes in England by 2016: A house builder’s perspective. Build. Environ. 2009, 44, 1917–1924. [Google Scholar] [CrossRef]
- Feng, Q.; Shi, X.; Zhang, J. Influence of rent-seeking on safety supervision in Chinese construction: Based on a simulation technology. Technol. Forecast. Soc. Chang. 2019, 138, 1–9. [Google Scholar] [CrossRef]
- Chan, E.; Yung, E. Evaluating Environmental Management Policies: An International Trend; Chinese Research Institute of Construction Management: Hong Kong, China, 2002. [Google Scholar]
- Durdyev, S.; Zavadskas, K.E.; Thurnell, D.; Banaitis, A.; Ihtiyar, A. Sustainable Construction Industry in Cambodia: Awareness, Drivers and Barriers. Sustainability 2018, 10, 392. [Google Scholar] [CrossRef]


| Code | Barriers | Key Reference | |||||||||
|---|---|---|---|---|---|---|---|---|---|---|---|
| [62] | [63] | [64] | [65] | [66] | [67] | [68] | [69] | [70] | [71] | ||
| B01 | Lack of regulations and policy | ✓ | ✓ | ✓ | ✓ | ✓ | ✓ | ||||
| B02 | Lack of industrial guidance | ✓ | |||||||||
| B03 | Lack of effective green building development modes | ✓ | ✓ | ✓ | |||||||
| B04 | Lack of effective supervision from government | ✓ | ✓ | ✓ | |||||||
| B05 | Inadequate support from related green building institutions | ✓ | ✓ | ✓ | ✓ | ||||||
| B06 | Low level of green design | ✓ | ✓ | ||||||||
| B07 | Incensement of construction cost | ✓ | ✓ | ✓ | ✓ | ✓ | |||||
| B08 | Extension of construction period | ✓ | ✓ | ✓ | |||||||
| B09 | Potential damage to structure | ✓ | ✓ | ✓ | |||||||
| B10 | Lack of mature green technology | ✓ | ✓ | ✓ | ✓ | ✓ | |||||
| B11 | Detachment of green building theories and technologies | ✓ | ✓ | ✓ | ✓ | ||||||
| B12 | Higher price of green building | ✓ | ✓ | ✓ | ✓ | ✓ | |||||
| B13 | Economic benefit is not obvious in a short term | ✓ | ✓ | ✓ | ✓ | ||||||
| B14 | Lack of financial support | ✓ | ✓ | ✓ | ✓ | ✓ | ✓ | ||||
| B15 | Immature green material market | ✓ | ✓ | ✓ | |||||||
| B16 | Public concerns on quality of green materials | ✓ | ✓ | ✓ | |||||||
| B17 | Lack of environmental awareness from developer | ✓ | ✓ | ✓ | |||||||
| B18 | Lack of environmental awareness from contractor | ✓ | ✓ | ✓ | |||||||
| B19 | Lack of environmental awareness from public | ✓ | ✓ | ✓ | ✓ | ||||||
| B20 | Low demand for green buildings | ✓ | ✓ | ✓ | ✓ | ✓ | |||||
| B21 | Ineffectiveness effect of demonstration green building | ✓ | ✓ | ✓ | |||||||
| B22 | Lack of green construction training | ✓ | ✓ | ✓ | ✓ | ✓ | |||||
| B23 | Lack of publicity for green buildings | ✓ | ✓ | ✓ | |||||||
| B24 | Limited benefit to enterprise reputation | ✓ | ✓ | ✓ | |||||||
| Variable | Category | Frequency | Percentage (%) |
|---|---|---|---|
| Workplace | Developer | 21 | 26.92 |
| Contractor | 16 | 20.51 | |
| Government | 13 | 16.67 | |
| Scholar | 28 | 35.90 | |
| Working experience (year) | 0–5 | 60 | 76.92 |
| 6–10 | 12 | 15.38 | |
| 11–15 | 3 | 3.85 | |
| Above 15 | 3 | 3.85 | |
| Education level | PhD | 6 | 7.69 |
| Master | 43 | 55.13 | |
| Bachelor | 27 | 34.62 | |
| Others | 2 | 2.56 | |
| Number of on-going project workers | 1–50 | 31 | 39.74 |
| 51–100 | 16 | 20.51 | |
| 101–200 | 13 | 16.67 | |
| Above 200 | 18 | 23.08 |
| Rank | Code | Barriers | Mean | SD 1 |
|---|---|---|---|---|
| 1 | B04 | Lack of effective supervision from government | 4.0769 | 0.99046 |
| 2 | B17 | Lack of environmental awareness from developer | 4.0128 | 0.99992 |
| 3 | B15 | Immature green material market | 4.0128 | 1.02556 |
| 4 | B02 | Lack of industrial guidance | 3.9872 | 0.99992 |
| 5 | B07 | Incensement of construction cost | 3.9615 | 1.21080 |
| 6 | B14 | Lack of financial support | 3.9231 | 1.09033 |
| 7 | B05 | Inadequate support from related green building institutions | 3.8974 | 1.07619 |
| 8 | B03 | Lack of effective green building development modes | 3.8718 | 0.94469 |
| 9 | B01 | Lack of regulations and policy | 3.8718 | 1.18824 |
| 10 | B10 | Lack of mature green technology | 3.8205 | 1.06593 |
| 11 | B21 | Ineffectiveness effect of demonstration green building | 3.8077 | 0.94054 |
| 12 | B24 | Limited benefit to enterprise reputation | 3.7692 | 1.09216 |
| 13 | B08 | Extension of construction period | 3.7436 | 1.11000 |
| 14 | B12 | Higher price of green building | 3.7308 | 1.07719 |
| 15 | B11 | Detachment of green building theories and technologies | 3.7179 | 0.97897 |
| 16 | B13 | Economic benefit is not obvious in a short term | 3.5769 | 1.12260 |
| 17 | B20 | Low demand for green buildings | 3.5769 | 1.26408 |
| 18 | B19 | Lack of environmental awareness from public | 3.5641 | 1.19076 |
| 19 | B06 | Low level of green design | 3.5513 | 1.02751 |
| 20 | B22 | Lack of green construction training | 3.5000 | 1.02881 |
| 21 | B18 | Lack of environmental awareness from contractor | 3.4872 | 1.20328 |
| 22 | B23 | Lack of publicity for green buildings | 3.4744 | 1.01578 |
| 23 | B16 | Public concerns on quality of green materials | 3.0769 | 1.15959 |
| 24 | B09 | Potential damage to structure | 2.7949 | 1.22059 |
| Code | Workplace | Experience | Gender | Education | Number of Workers | |||||
|---|---|---|---|---|---|---|---|---|---|---|
| F | Sig. | F | Sig. | F | Sig. | F | Sig. | F | Sig. | |
| B01 | 0.557 | 0.645 | 0.890 | 0.451 | 1.503 | 0.224 | 2.053 | 0.114 | 2.322 | 0.082 |
| B02 | 0.806 | 0.495 | 1.837 | 0.148 | 0.010 | 0.921 | 1.107 | 0.352 | 2.562 | 0.061 |
| B03 | 0.620 | 0.604 | 0.366 | 0.778 | 0.606 | 0.439 | 3.356 | 0.023 | 0.546 | 0.652 |
| B04 | 1.768 | 0.161 | 1.975 | 0.125 | 0.323 | 0.571 | 0.789 | 0.504 | 1.044 | 0.378 |
| B05 | 1.772 | 0.160 | 0.545 | 0.653 | 0.276 | 0.601 | 2.727 | 0.050 | 1.743 | 0.166 |
| B06 | 2.096 | 0.108 | 0.824 | 0.485 | 0.369 | 0.546 | 1.763 | 0.162 | 1.159 | 0.331 |
| B07 | 1.145 | 0.337 | 1.236 | 0.303 | 0.060 | 0.807 | 2.516 | 0.065 | 0.299 | 0.826 |
| B08 | 1.943 | 0.130 | 1.529 | 0.214 | 0.310 | 0.579 | 1.745 | 0.165 | 1.168 | 0.328 |
| B09 | 0.318 | 0.813 | 1.615 | 0.193 | 0.550 | 0.461 | 0.191 | 0.902 | 1.651 | 0.185 |
| B10 | 0.582 | 0.629 | 2.906 | 0.040 | 0.055 | 0.815 | 1.014 | 0.391 | 1.327 | 0.272 |
| B11 | 1.760 | 0.162 | 0.417 | 0.741 | 0.107 | 0.745 | 0.991 | 0.402 | 1.294 | 0.283 |
| B12 | 3.083 | 0.032 | 1.005 | 0.396 | 3.068 | 0.084 | 1.446 | 0.236 | 1.511 | 0.219 |
| B13 | 0.746 | 0.528 | 0.211 | 0.888 | 0.126 | 0.723 | 1.962 | 0.127 | 0.352 | 0.788 |
| B14 | 1.218 | 0.309 | 0.301 | 0.824 | 4.225 | 0.043 | 0.588 | 0.625 | 2.525 | 0.064 |
| B15 | 0.667 | 0.575 | 1.107 | 0.352 | 0.656 | 0.420 | 1.620 | 0.192 | 1.367 | 0.259 |
| B16 | 1.117 | 0.348 | 3.419 | 0.022 | 0.441 | 0.509 | 3.511 | 0.019 | 0.468 | 0.706 |
| B17 | 3.919 | 0.012 | 1.450 | 0.235 | 6.826 | 0.011 | 3.074 | 0.033 | 0.331 | 0.803 |
| B18 | 2.414 | 0.073 | 1.561 | 0.206 | 3.302 | 0.073 | 2.614 | 0.057 | 0.583 | 0.628 |
| B19 | 2.276 | 0.087 | 0.323 | 0.808 | 1.727 | 0.193 | 1.026 | 0.386 | 0.849 | 0.471 |
| B20 | 2.338 | 0.080 | 0.646 | 0.588 | 1.336 | 0.251 | 1.155 | 0.333 | 0.579 | 0.631 |
| B21 | 3.244 | 0.027 | 2.152 | 0.101 | 1.217 | 0.273 | 0.288 | 0.834 | 1.735 | 0.167 |
| B22 | 2.088 | 0.109 | 1.721 | 0.170 | 0.049 | 0.826 | 0.643 | 0.590 | 1.990 | 0.123 |
| B23 | 1.858 | 0.144 | 1.463 | 0.232 | 4.139 | 0.045 | 0.327 | 0.806 | 1.780 | 0.158 |
| B24 | 2.407 | 0.074 | 2.856 | 0.043 | 0.001 | 0.975 | 0.685 | 0.564 | 2.908 | 0.040 |
| Code | Rotated Component Matrix 1 | New Code | ||||
|---|---|---|---|---|---|---|
| Component | ||||||
| 1 | 2 | 3 | 4 | 5 | ||
| B07 | 0.759 | - | - | - | - | EE1 |
| B13 | 0.759 | - | - | - | - | EE2 |
| B08 | 0.720 | - | - | - | - | EE3 |
| B12 | 0.681 | - | - | - | - | EE4 |
| B14 | 0.609 | - | - | - | - | EE5 |
| B22 | - | 0.745 | - | - | - | ME1 |
| B23 | - | 0.742 | - | - | - | ME2 |
| B21 | - | 0.702 | - | - | - | ME3 |
| B24 | - | 0.630 | - | - | - | ME4 |
| B15 | - | 0.540 | - | - | - | ME5 |
| B18 | - | - | 0.885 | - | - | SA1 |
| B17 | - | - | 0.857 | - | - | SA2 |
| B19 | - | - | 0.838 | - | - | SA3 |
| B20 | - | - | 0.507 | - | - | SA4 |
| B04 | - | - | - | 0.776 | - | IP1 |
| B02 | - | - | - | 0.768 | - | IP2 |
| B01 | - | - | - | 0.707 | - | IP3 |
| B05 | - | - | - | - | 0.728 | TS1 |
| B06 | - | - | - | - | 0.633 | TS2 |
| B03 | - | - | - | - | 0.544 | TS3 |
| Eigenvalues | 3.715 | 3.477 | 3.285 | 2.896 | 2.483 | - |
| Variance (%) | 15.479 | 14.489 | 13.686 | 12.058 | 10.345 | - |
| Cumulative (%) | 15.479 | 29.968 | 43.654 | 55.712 | 66.057 | - |
| Component | Code | Loading | Cronbach’s α | AVE | CR |
|---|---|---|---|---|---|
| Economic Efficiency | EE1 | 0.848 | 0.858 | 0.639 | 0.898 |
| EE2 | 0.843 | - | - | - | |
| EE3 | 0.799 | - | - | - | |
| EE4 | 0.779 | - | - | - | |
| EE5 | 0.722 | - | - | - | |
| Market Environment | ME1 | 0.851 | 0.844 | 0.617 | 0.889 |
| ME2 | 0.778 | - | - | - | |
| ME3 | 0.822 | - | - | - | |
| ME4 | 0.762 | - | - | - | |
| ME5 | 0.708 | - | - | - | |
| Stakeholder Awareness | SA1 | 0.896 | 0.863 | 0.715 | 0.908 |
| SA2 | 0.869 | - | - | - | |
| SA3 | 0.902 | - | - | - | |
| SA4 | 0.697 | - | - | - | |
| Technical Support | TS1 | 0.859 | 0.747 | 0.666 | 0.856 |
| TS2 | 0.800 | - | - | - | |
| TS3 | 0.739 | - | - | - | |
| Industry Policy | IP1 | 0.715 | 0.741 | 0.663 | 0.854 |
| IP2 | 0.889 | - | - | - | |
| IP3 | 0.830 | - | - | - |
| Component | EE | IP | ME | GBD | SA | TS |
|---|---|---|---|---|---|---|
| EE | 0.8001 | - | - | - | - | - |
| IP | 0.580 | 0.8141 | - | - | - | - |
| ME | 0.598 | 0.596 | 0.7861 | - | - | - |
| GBD | 0.381 | 0.428 | 0.610 | 1.0001 | - | - |
| SA | 0.397 | 0.278 | 0.503 | 0.549 | 0.8451 | - |
| TS | 0.652 | 0.684 | 0.559 | 0.287 | 0.258 | 0.8161 |
| Code | EE | IP | ME | SA | TS |
|---|---|---|---|---|---|
| EE1 | 0.8481 | 0.531 | 0.399 | 0.220 | 0.578 |
| EE2 | 0.8431 | 0.514 | 0.524 | 0.415 | 0.570 |
| EE3 | 0.7991 | 0.355 | 0.409 | 0.205 | 0.489 |
| EE4 | 0.7791 | 0.416 | 0.459 | 0.417 | 0.454 |
| EE5 | 0.7221 | 0.471 | 0.569 | 0.317 | 0.495 |
| IP1 | 0.509 | 0.7151 | 0.479 | 0.308 | 0.676 |
| IP2 | 0.408 | 0.8891 | 0.526 | 0.177 | 0.536 |
| IP3 | 0.505 | 0.8301 | 0.446 | 0.199 | 0.462 |
| ME1 | 0.385 | 0.480 | 0.8511 | 0.432 | 0.458 |
| ME2 | 0.428 | 0.427 | 0.7781 | 0.314 | 0.439 |
| ME3 | 0.462 | 0.513 | 0.8221 | 0.353 | 0.466 |
| ME4 | 0.477 | 0.449 | 0.7621 | 0.505 | 0.380 |
| ME5 | 0.619 | 0.466 | 0.7081 | 0.366 | 0.452 |
| SA1 | 0.335 | 0.274 | 0.428 | 0.8961 | 0.227 |
| SA2 | 0.354 | 0.275 | 0.398 | 0.8691 | 0.214 |
| SA3 | 0.310 | 0.233 | 0.437 | 0.9021 | 0.200 |
| SA4 | 0.357 | 0.142 | 0.451 | 0.6971 | 0.238 |
| TS1 | 0.554 | 0.551 | 0.420 | 0.281 | 0.8841 |
| TS2 | 0.422 | 0.519 | 0.464 | 0.076 | 0.7781 |
| TS3 | 0.618 | 0.600 | 0.478 | 0.275 | 0.7821 |
| No. | Path | Path Coefficient | t-Value | p-Value | Inference |
|---|---|---|---|---|---|
| P1 | EE → GBD | 0.015 | 0.140 | 0.889 | Not supported |
| P2 | IP → GBD | 0.366 | 3.053 | *** | Supported |
| P3 | ME → GBD | 0.424 | 3.304 | *** | Supported |
| P4 | SA → GBD | 0.326 | 2.880 | *** | Supported |
| P5 | TS → GBD | 0.165 | 1.181 | 0.238 | Not supported |
© 2019 by the authors. Licensee MDPI, Basel, Switzerland. This article is an open access article distributed under the terms and conditions of the Creative Commons Attribution (CC BY) license (http://creativecommons.org/licenses/by/4.0/).
Share and Cite
Wu, Z.; Jiang, M.; Cai, Y.; Wang, H.; Li, S. What Hinders the Development of Green Building? An Investigation of China. Int. J. Environ. Res. Public Health 2019, 16, 3140. https://0-doi-org.brum.beds.ac.uk/10.3390/ijerph16173140
Wu Z, Jiang M, Cai Y, Wang H, Li S. What Hinders the Development of Green Building? An Investigation of China. International Journal of Environmental Research and Public Health. 2019; 16(17):3140. https://0-doi-org.brum.beds.ac.uk/10.3390/ijerph16173140
Chicago/Turabian StyleWu, Zezhou, Mingyang Jiang, Yuzhu Cai, Hao Wang, and Shenghan Li. 2019. "What Hinders the Development of Green Building? An Investigation of China" International Journal of Environmental Research and Public Health 16, no. 17: 3140. https://0-doi-org.brum.beds.ac.uk/10.3390/ijerph16173140