Water Environmental Capacity Calculation and Allocation of the Taihu Lake Basin in Jiangsu Province Based on Control Unit


Abstract
:1. Introduction
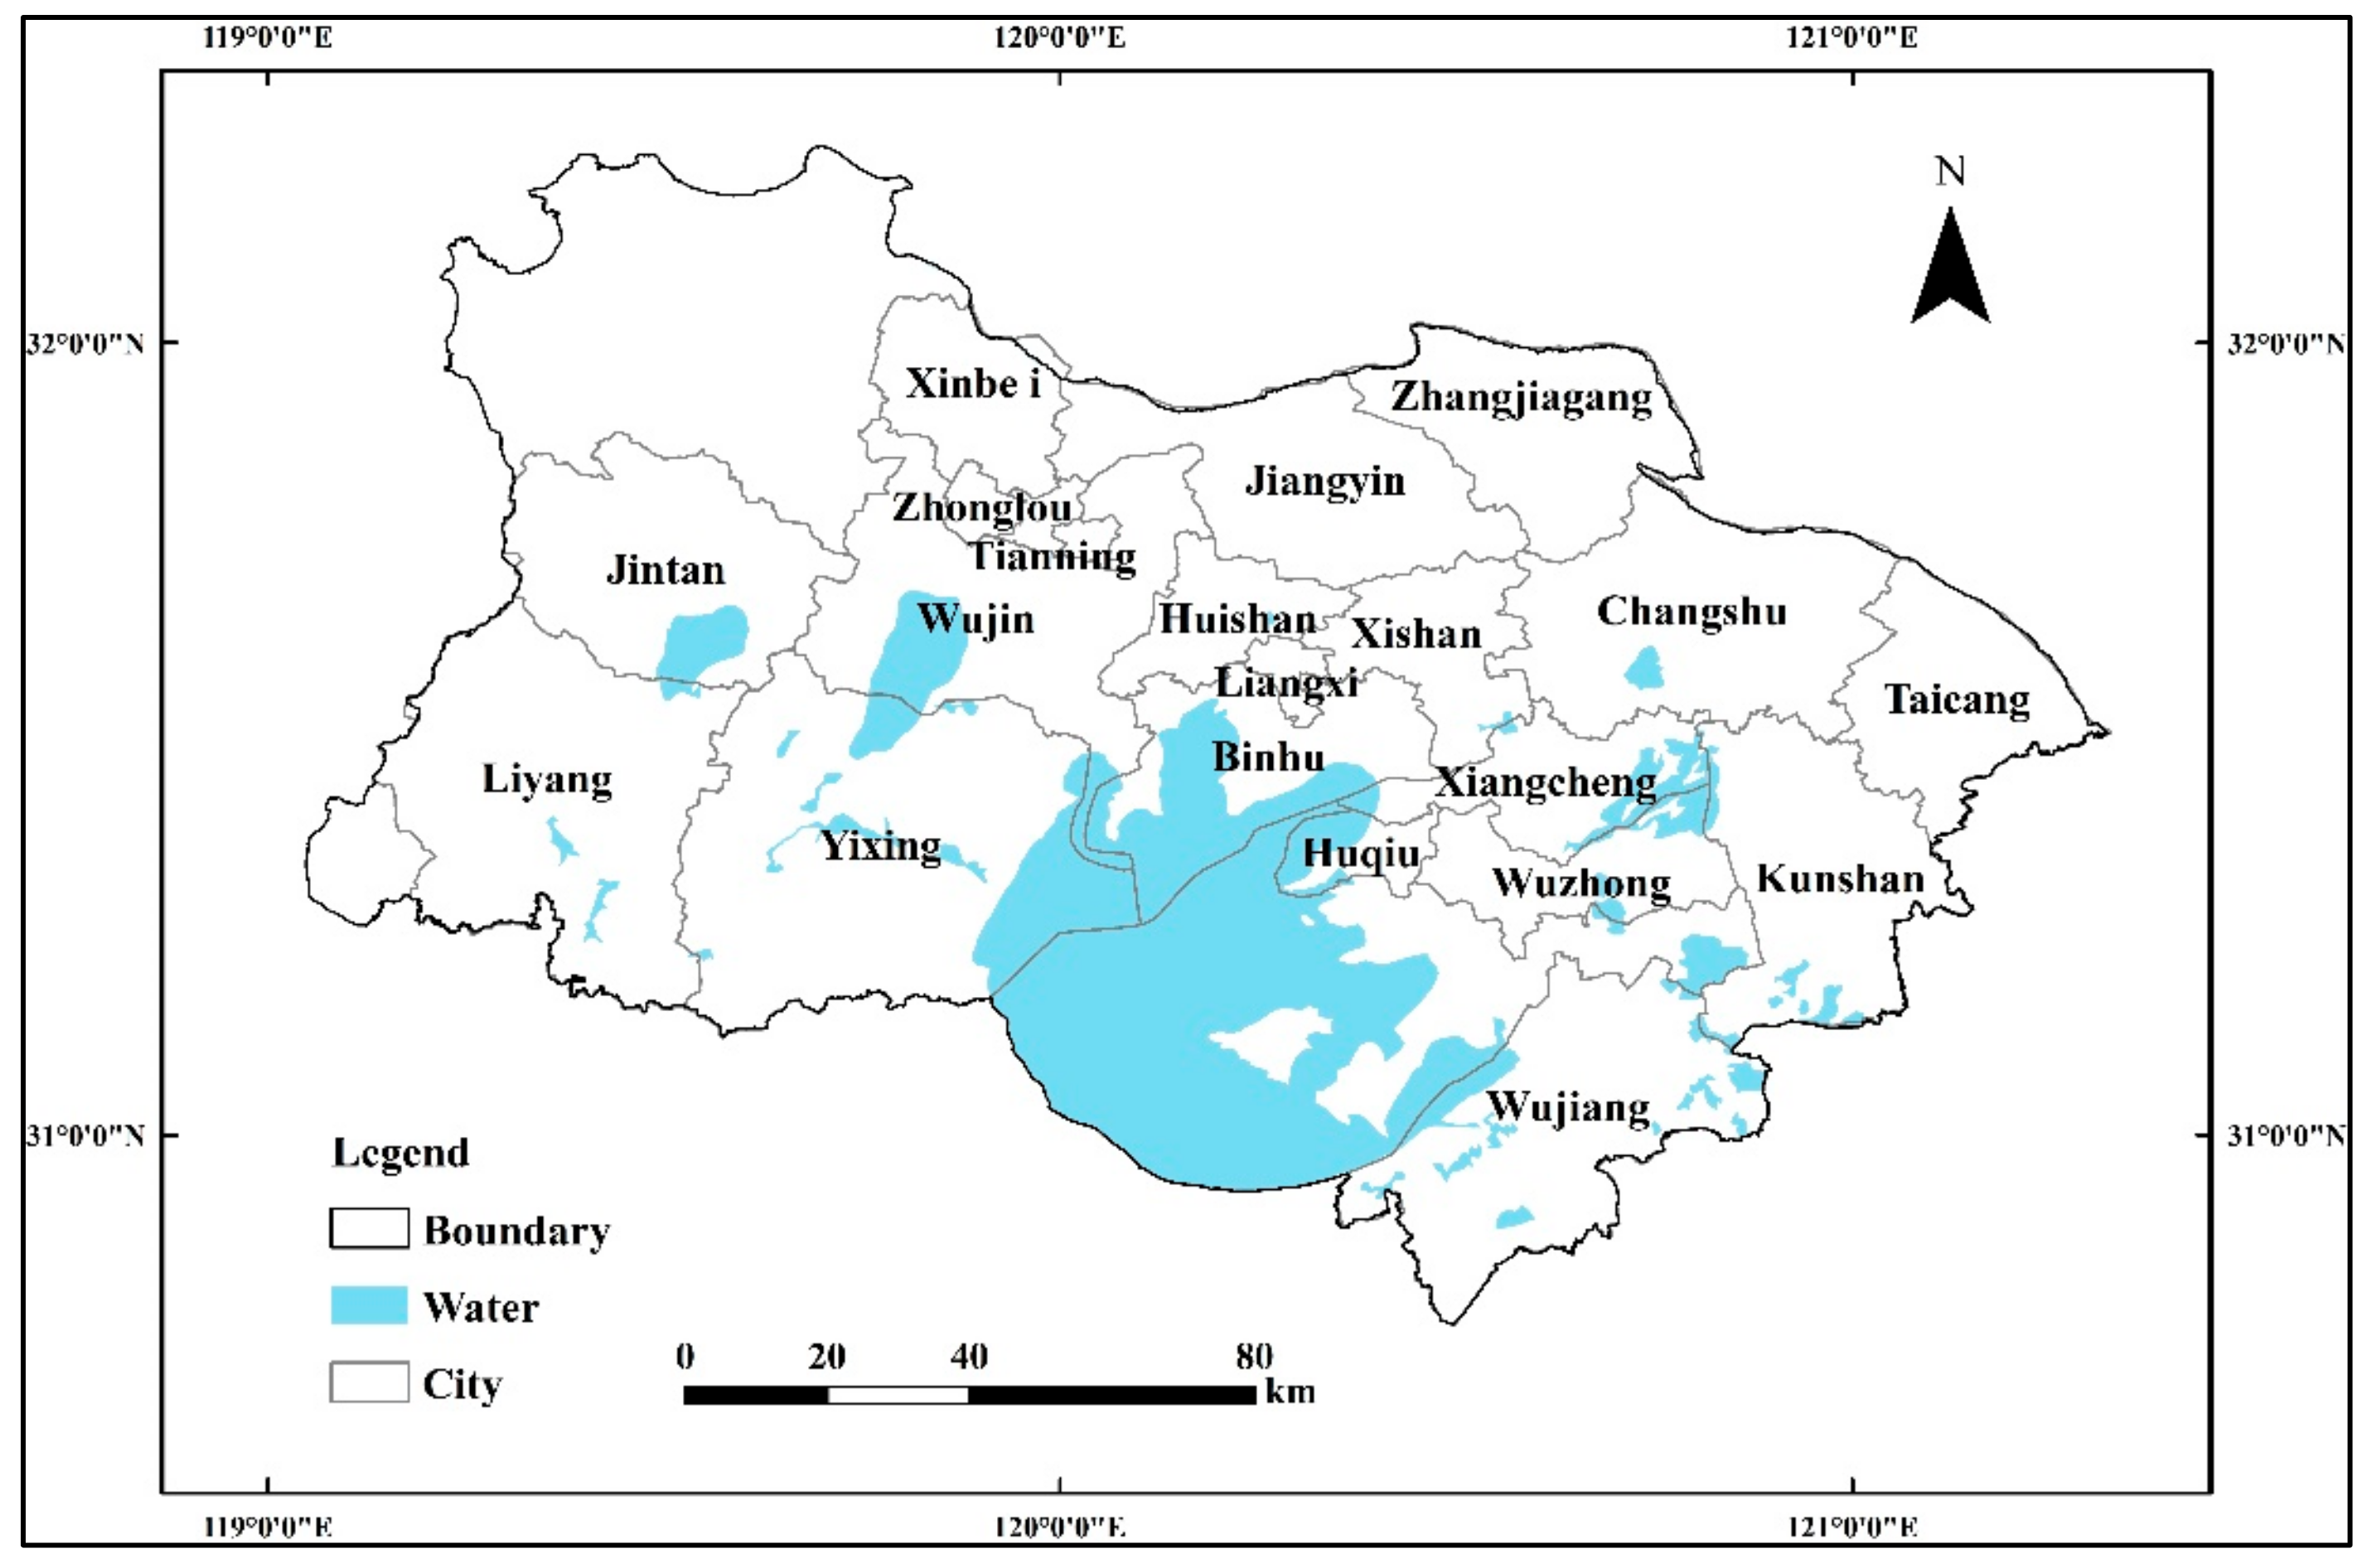
2. Study Area
3. Method
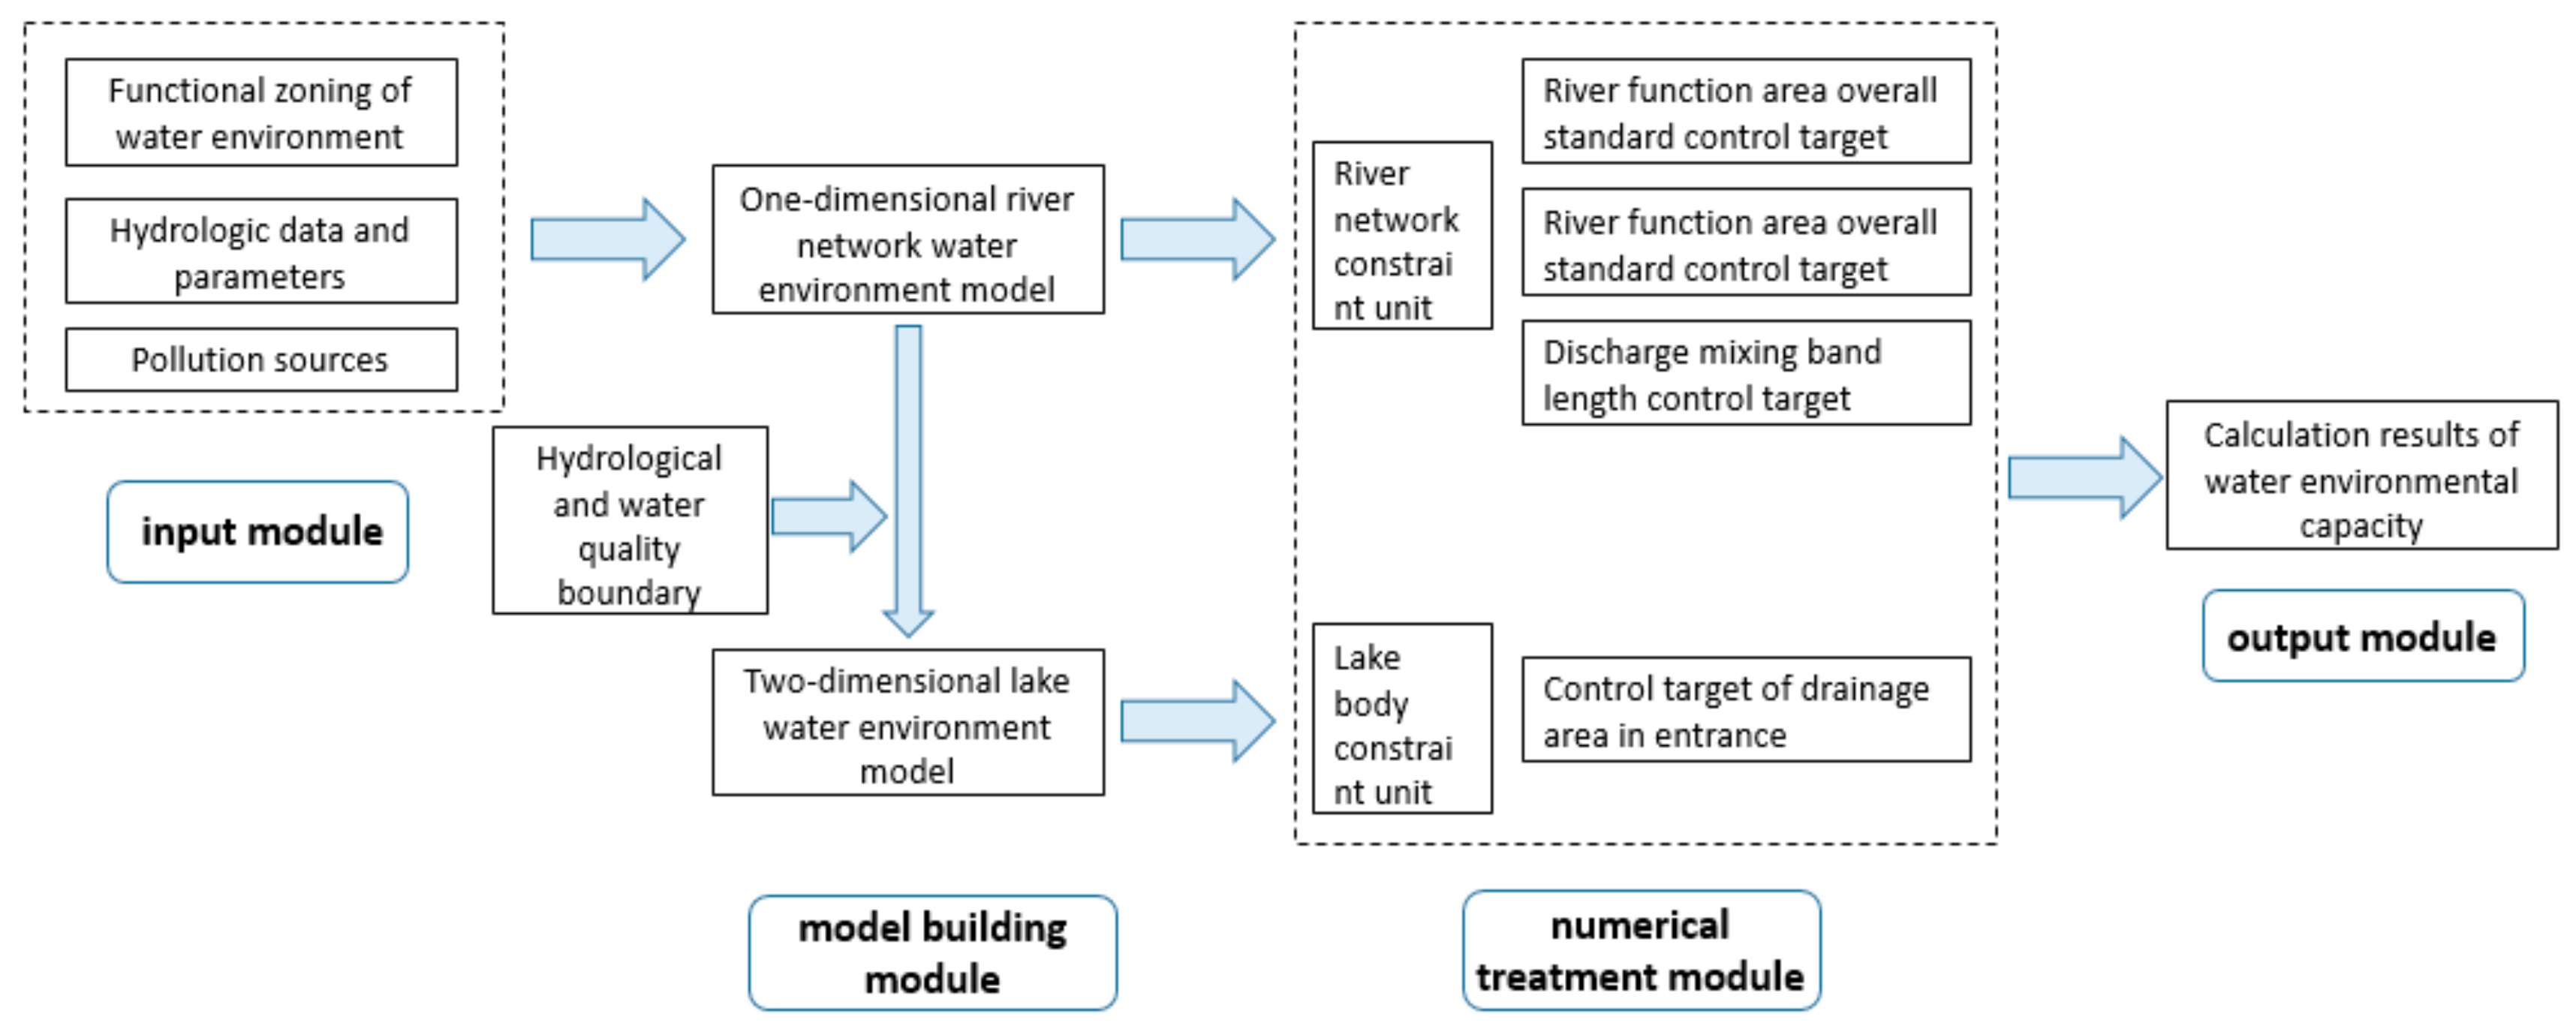
3.1. Outline
3.2. Division of Control Unit
3.2.1. Control Unit Division
3.2.2. Rationality Analysis
3.2.3. Calculation of Water Environmental Capacity in Plain River Network Area
3.2.4. Analysis of Rationality of Regional Water Environment Capacity Calculation
3.2.5. Control Unit Water Environment Capacity Allocation Method
4. Results and Discussion
4.1. Control Unit Division Results
4.2. Rationality Analysis of Control Unit Division Results
4.3. Calculation Results of Regional Water Environment Capacity
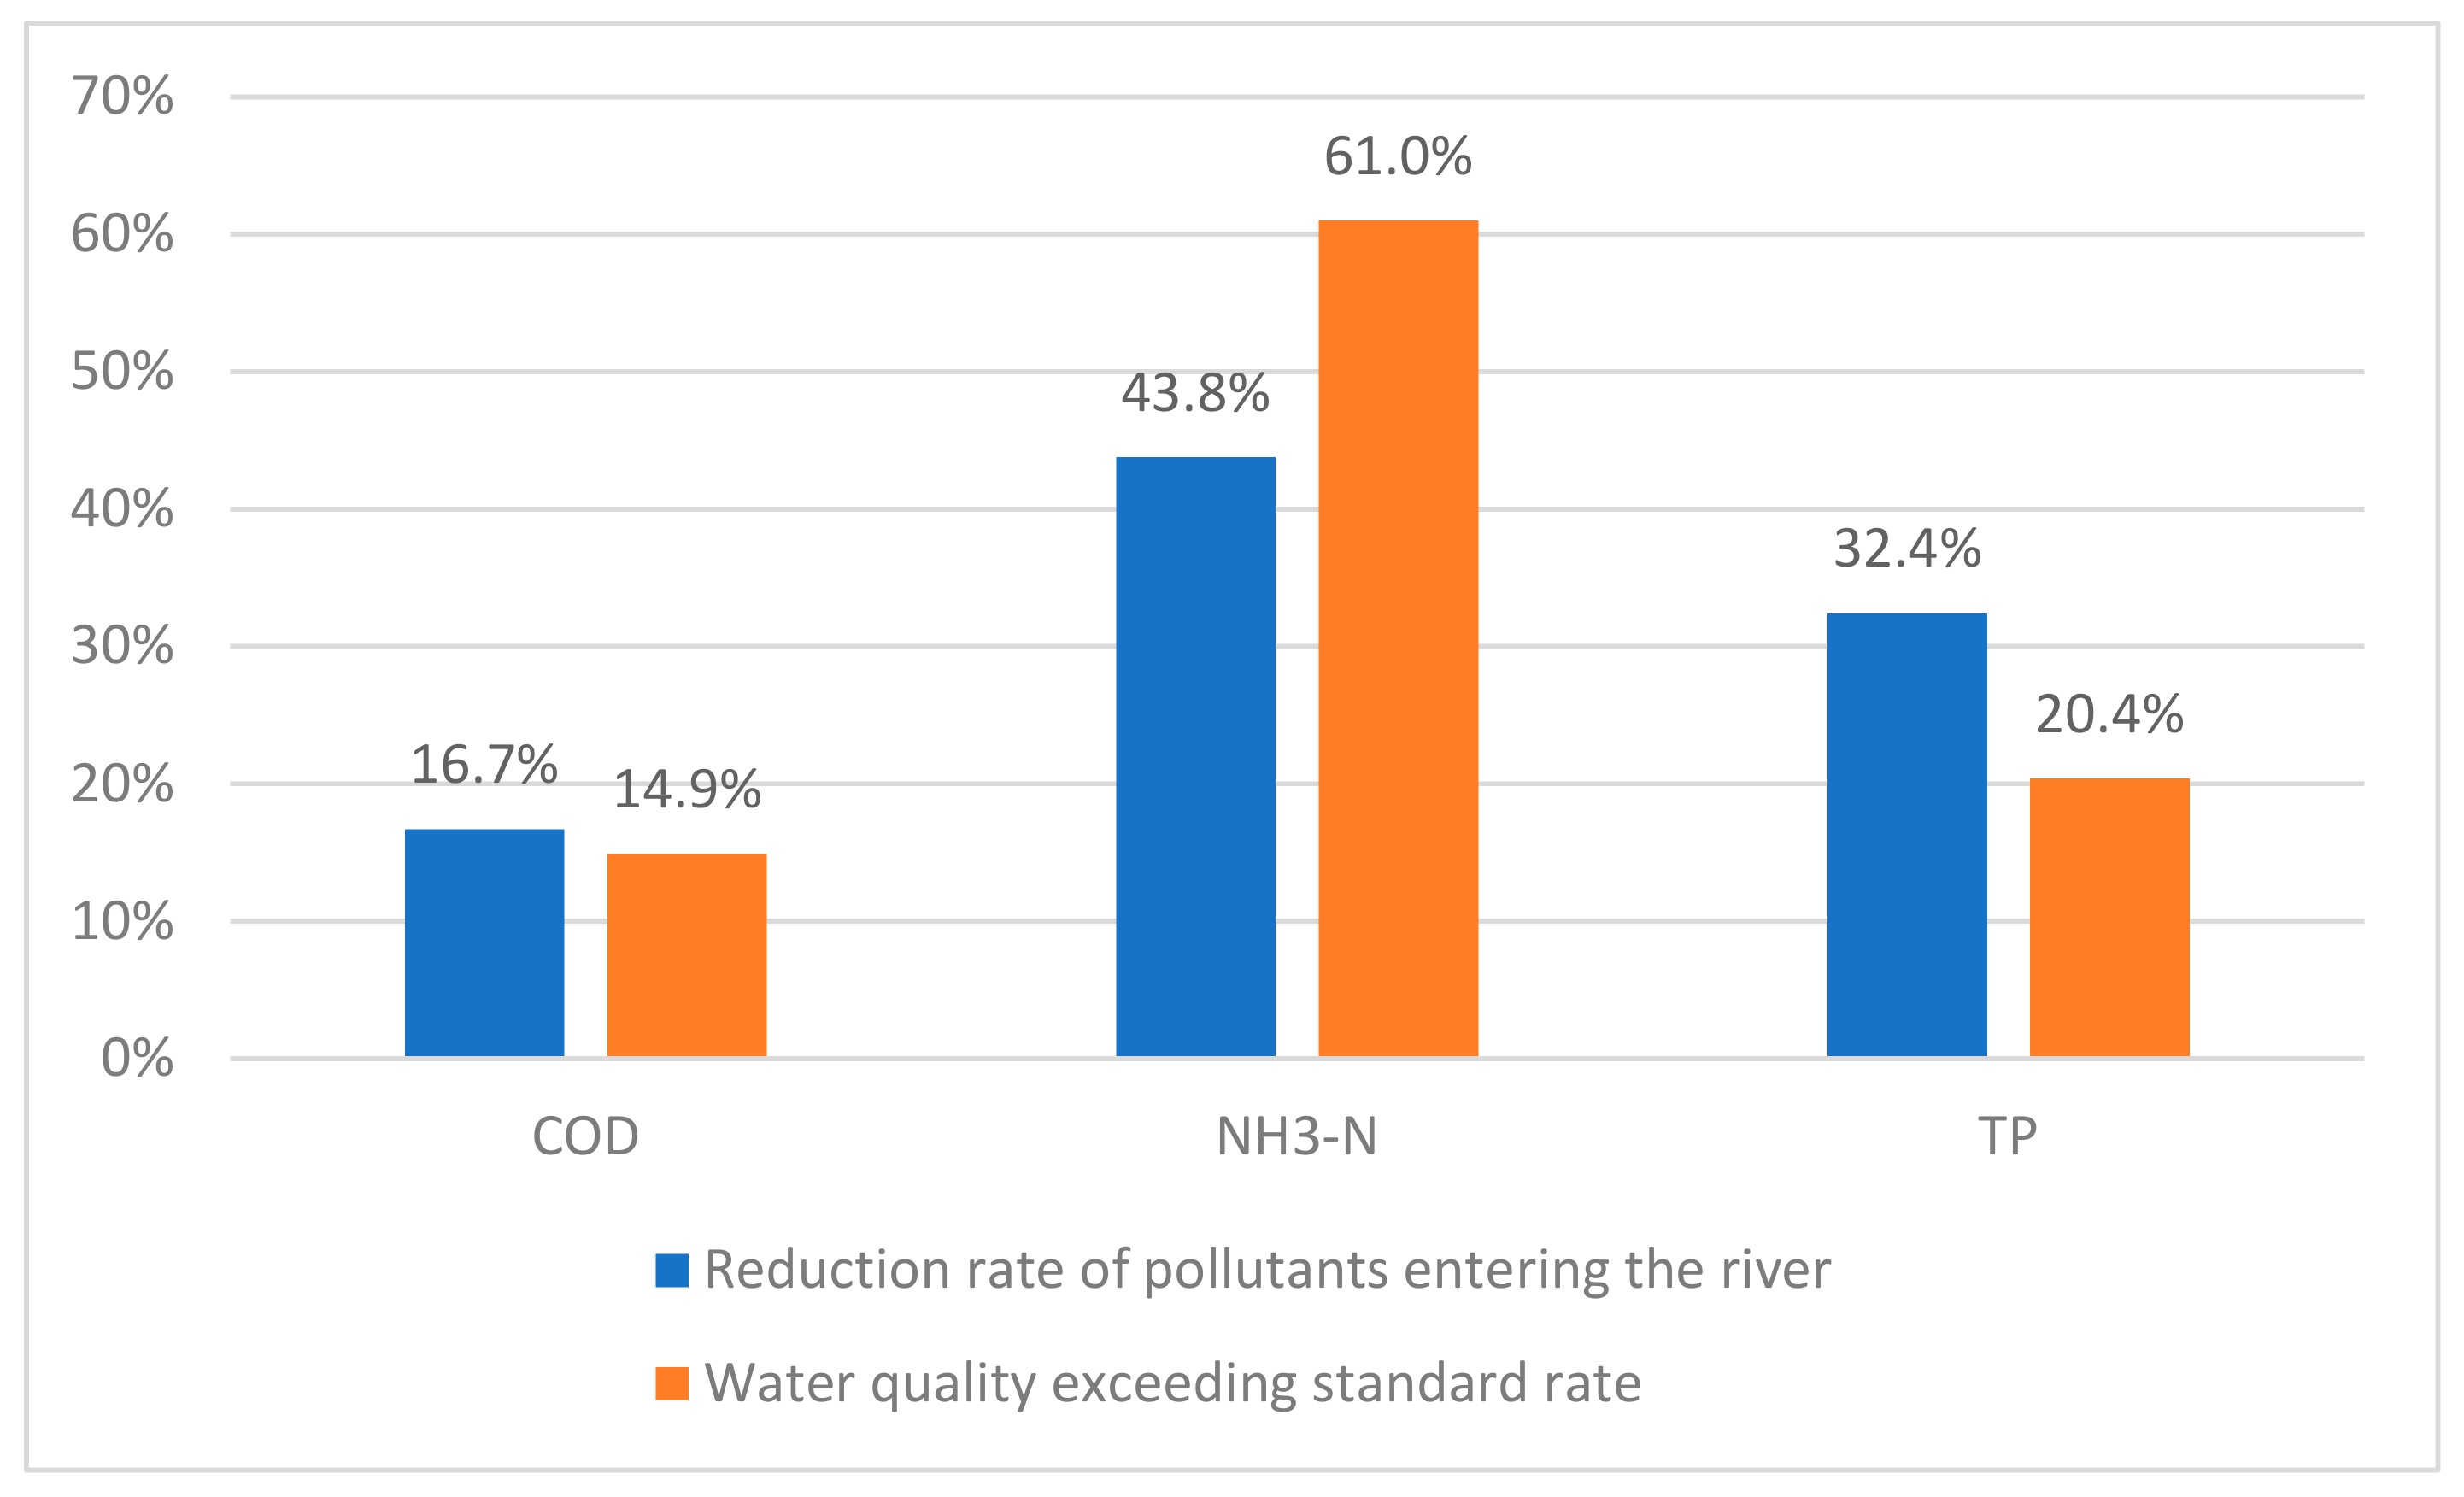
4.4. Rationality Analysis of the Results of Regional Water Environmental Capacity Calculation
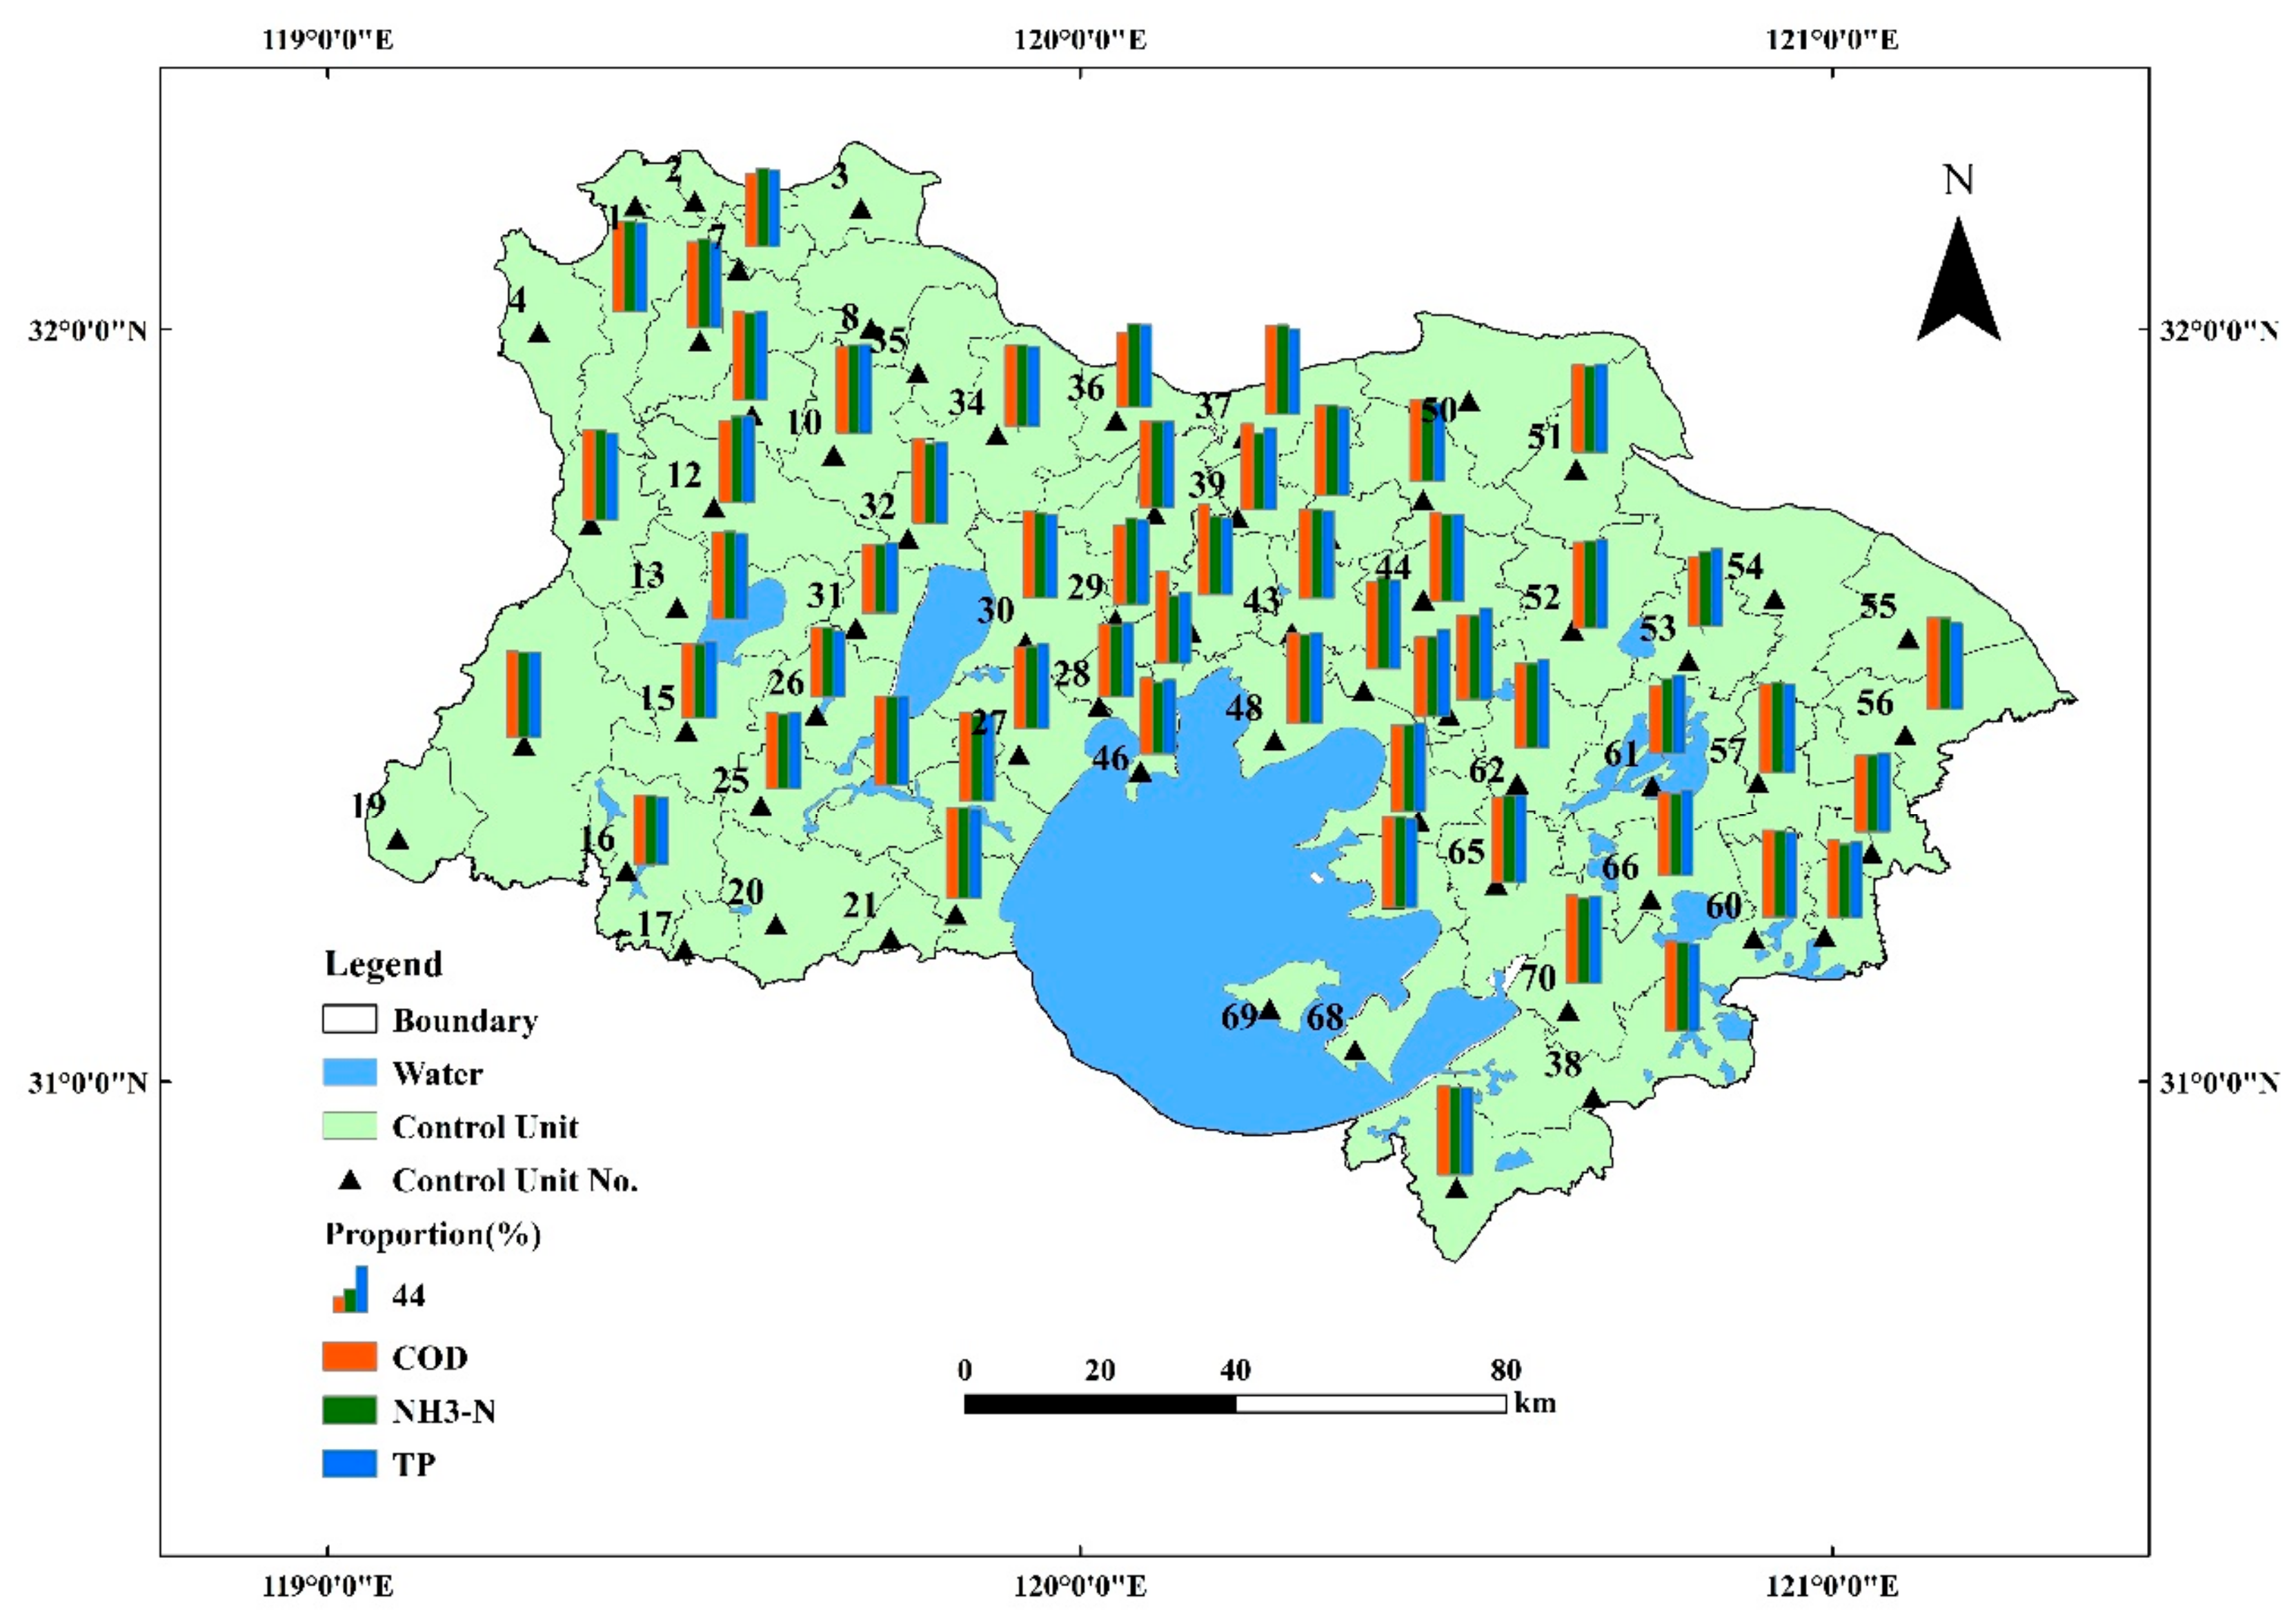
4.5. Control Unit Water Environment Capacity Calculation Results
4.6. Application of Sewage Disposal License Management System
5. Conclusions
Author Contributions
Funding
Acknowledgments
Conflicts of Interest
References
- Liang, B.; Wang, X.Y. Current Status and Prospects of Research on Total Control of Water Environment Pollutants in China. J. Cap. Norm. Univ. Nat. Sci. Ed. 2005, 26, 93–98. [Google Scholar]
- Xia, Q. Total Water Pollutant Control in River Basins; China Environmental Science Press: Beijing, China, 1996. [Google Scholar]
- Yang, W.J. Research on Total Water Pollutant Control Scheme; Beijing University of Chemical Technology: Beijing, China, 2011. [Google Scholar]
- Meng, W.; Zhang, N.; Zhang, Y. Research on watershed water quality target management technology (I)—Total control technology of control unit. Environ. Sci. 2007, 20, 1–8. [Google Scholar]
- Patil, A.; Deng, Z.Q. Bayesian approach to estimating margin of safety for total maximum daily load development. J. Environ. Manag. 2011, 92, 910–918. [Google Scholar] [CrossRef] [PubMed]
- Lemly, A.D. Procedure for setting environmentally safe total maximum daily loads (TMDLs) for selenium. Ecotoxicol. Environ. Saf. 2002, 52, 123–127. [Google Scholar] [CrossRef] [PubMed]
- Havens, K.E.; Schelske, C.L. The importance of considering biological processes when setting total maximum daily load (TMDL) for phosphorus in shallow lakes and reservoirs. Environ. Pollut. 2001, 113, 1–9. [Google Scholar] [CrossRef]
- Kang, M.S.; Park, S.W.; Lee, J.J.; Yoo, K.H. Applying SWAT for TMDL programs to a small watershed containing rice paddy fields. Agric. Water Manag. 2006, 79, 72–92. [Google Scholar] [CrossRef]
- Keller, A.A.; Cavallaro, L. Assessing the US clean Water Act 303(d) listing process for determining impairment of a waterbody. J. Environ. Manag. 2008, 86, 699–711. [Google Scholar] [CrossRef] [PubMed]
- Meng, W.; Zhang, Y.; Zhang, N. Researchs on water ecological function division and quality target management technology in river basins. J. Environ. Sci. 2011, 31, 1345–1351. [Google Scholar]
- Meng, W.; Zhang, Y.; Wang, X.Q. Research on watershed water quality target management technology: V. Environmental economic policy of water pollution prevention and control. Environ. Sci. Res. 2008, 21, 1–9. [Google Scholar]
- Meng, W.; Wang, H.Y.; Wang, Y.Y. Research on Watershed Water Quality Target Management Technology (IV)—Water Contaminant Emission Limit and Control Technology Assessment of Control Unit. Environ. Sci. Res. 2008, 21, 1–9. [Google Scholar]
- Meng, W.; Liu, Z.T.; Zhang, N. Research on watershed water quality target management technology (II)—Water environment benchmark, standard and total amount control. Environ. Sci. Res. 2008, 21, 1–8. [Google Scholar]
- Meng, W.; Qin, Y.W.; Zheng, B.H. Research on watershed water quality target management technology (III)—Study on water environment monitoring technology. Environ. Sci. Res. 2008, 21, 9–16. [Google Scholar]
- Meng, W. Technology and Demonstration of Total Water Pollutants in River Basins; China Environmental Science Press: Beijing, China, 2008. [Google Scholar]
- Tan, B.; Chen, W.Q.; Tan, G.Y. GIS-based TMYL Architecture for Water Quality Target Management—Taking the Lancang River Basin as an Example. Environ. Sci. 2011, 37, 52–54. [Google Scholar]
- Lei, K.; Meng, W.; Qiao, F. Water quality target management technology and application case study of control unit. China Eng. Sci. 2013, 15, 63–69. [Google Scholar]
- Zhang, Y.L.; Liu, P.Z. Water Environment Capacity Handbook; Tsinghua University Press: Beijing, China, 1991. [Google Scholar]
- Dong, F.; Liu, X.B.; Peng, W.Q. Review and Prospect of Calculation Methods for Surface Water and Water Environment Capacity. Adv. Water Sci. 2014, 25, 451–463. [Google Scholar]
- Zhao, Y.X.; Xu, M.; Chen, Y. Research on water environment capacity accounting and regional total control strategy in Beihai City. Environ. Pollut. Control 2015, 37, 69–75. [Google Scholar]
- Nie, X. Research on Water Environmental Capacity and Total Pollutant Control in the Ash River Basin. Environ. Sci. Manag. 2015, 40, 72–75. [Google Scholar]
- Liu, L.F.; Zhang, X.W.; Xia, J. Study on forecasting method of river water environmental capacity. J. Hydraul. Eng. 1998, 7, 16–20. [Google Scholar]
- Liebman, J.C.; Lynn, W.R. The optimal allocation of stream dissolved oxygen. Water Resour. Res. 1966, 2, 581–591. [Google Scholar] [CrossRef]
- Ecker, J.G. A geometric programming model for optimal allocation of stream dissolved oxygen. Manag. Sci. 1975, 21, 658–668. [Google Scholar] [CrossRef]
- Loucks, D.P.; Revelle, C.S.; Lynn, W.R. Management models for water quality control. Manag. Sci. 1967, 14, 166–181. [Google Scholar] [CrossRef]
- Thomann, R.V.; Sobel, M.S. Estuarine water quality management and forecasting. J. Sanit. Eng. Div. 1964, 90, 9–36. [Google Scholar]
- Revelle, C.S.; Loucks, D.P.; Lynn, W.R. Linear programming applied to water quality management. Water Resour. Res. 1968, 4, 1–9. [Google Scholar] [CrossRef]
- Lohani, B.N.; Thanh, N.C. Probabilistic water quality control policies. J. Environ. Eng. Div. 1979, 105, 713–725. [Google Scholar]
- Fujiwara, O.; Gnanendran, S.K.; Ohgaki, S. River quality management under stochastic streamflow. J. Environ. Eng. 1986, 112, 185–199. [Google Scholar] [CrossRef]
- Eheart, J.W.; Park, H. Effects of temperature variation on critical stream dissolved oxygen. Water Resour. Res. 1989, 25, 145–151. [Google Scholar] [CrossRef]
- Burn, D.H.; McBean, E.A. Optimization modeling of water quality in an uncertain environment. Water Resour. Res. 1985, 21, 934–940. [Google Scholar] [CrossRef]
- Burn, D.H.; Lence, B.J. Comparison of optimization formulations for waste-load allocations. J. Environ. Eng. 1992, 188, 597–613. [Google Scholar] [CrossRef]
- Cardwell, H.; Ellis, H. Stochastic dynamic programming models for water quality management. Water Resour. Res. 1993, 29, 803–813. [Google Scholar] [CrossRef]
- Li, S.Y.; Morioka, T. Optimal allocation of waste loads in a river with probabilistic tributary flow under transverse mixing. Water Environ. Res. 1999, 71, 156–162. [Google Scholar] [CrossRef]
- Liu, J.T.; Yang, Y.S.; Gao, J.F. Classification and temporal and spatial variation of cyanobacteria blooms in Taihu Lake. J. Yangtze River Resour. Environ. 2011, 20, 156–160. [Google Scholar]
- Jin, X.L.; Gao, J.F.; Zhao, G.J. Influence of the socio-economic development on the water environment and development trend in the Taihu Lake Basin in the past 20 years. J. Yangtze River Resour. Environ. 2006, 15, 298–302. [Google Scholar]
- Zhu, G.W. Temporal and spatial differentiation of water quality in Taihu Lake and its relationship with water bloom. J. Yangtze River Resour. Environ. 2009, 18, 439–445. [Google Scholar]
- Dai, W.; Yan, Q.W.; Yang, S.J. Analysis on the Practice and Legislation of Emission Permits Trading in Taihu Basin. Resour. Sci. 2011, 33, 253–258. [Google Scholar]
- Xiong, W.; Yan, Q.W.; Cheng, S.K. Humanistic Driving Force Assessment of Water Environment Evolution in Taihu Basin Based on Pollution Footprint Model—A Case Study of Changzhou City, Jiangsu Province. Resour. Sci. 2011, 33, 223–229. [Google Scholar]
- Gao, Y.N.; Gao, J.F.; Chen, W. Classification of pollution control units and assessment of water environment load in typical areas of Taihu Lake Basin. J. Yangtze River Resour. Environ. 2012, 21, 335–340. [Google Scholar]
- Bao, K.; Pang, Y.; Sun, H.; Mo, X.; Wang, M. Up-to-standard assessment of water quality based on control unit division technology: A case study of Baidu Port. Hohai Univ. (Nat. Sci.) 2011, 39, 651–655. [Google Scholar]
- Meng, W.; Zhang, Y.; Zhang, B. Aquatic ecological region approach and its application in China. Adv. Water Sci. 2007, 18, 293–300. [Google Scholar]
- Meng, W.; Zhang, Y.; Zhang, B. Study of aquatic eco region in Liao River Basin. Acta Sci. Circum. 2007, 27, 911–918. [Google Scholar]
- Gao, J.F.; Gao, Y.N. Water Ecological Function Division of Taihu Lake Basin; China Environmental Science Press: Beijing, China, 2012. [Google Scholar]
- Gao, Y.N.; Gao, J.F. Delineation of aquatic ecoregions in Taihu lake basin. Geogr. Res. 2010, 29, 111–117. [Google Scholar]
- Song, W.W.; Pang, Y. The Calculation of Water Environment Capacity of Qinhuai River Basin Based on the National Test of QB-CS Water Quality Standards. China Water Hydropower 2017, 10, 80–84. [Google Scholar]
- Bao, W.; Pei, Y.; Sun, W. Study on Calculation Method of Water Environment Capacity Based on Water Quality of Control Section—Taking Yincun Port as an Example. Resour. Sci. 2011, 33, 249–252. [Google Scholar]
- Zhang, L.M.; Liu, Y.; Sun, W.H.; Bian, B. Estimation of Water Environment Capacity and Pollutant Reduction and Distribution in the Xiaoqiao River Watershed of Taihu Basin. J. Lake Sci. 2009, 21, 502–508. [Google Scholar]
- Sun, W.H.; Yao, G.J.; Pang, Y. Discussion of asymmetrical coeficient-based calculation method for water environmental capacity. Water Resour. Prot. 2001, 64, 25–26. [Google Scholar]
- Yu, L.; Wu, S.Z.; Fan, L.L.; Xu, Y. Research on Uneven Coefficients in One-Dimensional Calculation of Water Environment Capacity. Environ. Sci. Technol. 2008, 31, 116–119. [Google Scholar]


| Year | I | II | III | IV | V | Worse Than V | Single Factor Exceeding Rate | Exceeding Rate | ||
|---|---|---|---|---|---|---|---|---|---|---|
| COD | NH3-N | TP | ||||||||
| 2011 | 0.9 | 18.6 | 35.6 | 26.8 | 8.4 | 9.7 | 10.02 | 44.20 | 18.35 | 44.20 |
| 2012 | 2.4 | 25.5 | 40.0 | 17.8 | 7.1 | 7.2 | 9.54 | 30.16 | 27.03 | 30.16 |
| Cities | COD | NH3-N | TP | |||||||||
|---|---|---|---|---|---|---|---|---|---|---|---|---|
| Inflow Quantity | Water Environmental Capacity | Inflow Quantity Reduction Rate | Water Quality Standard Exceeding Rate | Inflow Quantity | Water Environmental Capacity | Inflow Quantity Reduction Rate | Water Quality Standard Exceeding Rate | Inflow Quantity | Water Environmental Capacity | Inflow Quantity Reduction Rate | Water Quality Standard Exceeding Rate | |
| Wuxi | 6.3 | 5.4 | 14.0% | 18.9% | 0.6 | 0.5 | 14.0% | 70.3% | 0.14 | 0.11 | 24.8% | 17.0% |
| Changzhou | 7.1 | 6.0 | 15.7% | 22.1% | 0.9 | 0.4 | 54.9% | 69.0% | 0.17 | 0.08 | 52.3% | 27.2% |
| Suzhou | 15.1 | 12.3 | 18.3% | 3.6% | 2.2 | 1.1 | 47.8% | 43.8% | 0.31 | 0.23 | 24.9% | 17.0% |
| Total | 28.5 | 23.7 | 16.7% | 14.9% | 3.7 | 2.1 | 43.8% | 61.0% | 0.62 | 0.42 | 32.4% | 20.4% |
| Control Unit No. | COD | NH3-N | TP | Control Unit No. | COD | NH3-N | TP |
|---|---|---|---|---|---|---|---|
| 1 | 394 | 26 | 5 | 36 | 2510 | 214 | 43 |
| 2 | 250 | 15 | 3 | 37 | 2527 | 233 | 47 |
| 3 | 404 | 24 | 5 | 38 | 11,051 | 946 | 189 |
| 4 | 945 | 62 | 12 | 39 | 3881 | 361 | 72 |
| 5 | 1486 | 92 | 18 | 40 | 6456 | 596 | 119 |
| 6 | 3145 | 207 | 41 | 41 | 4377 | 407 | 81 |
| 7 | 418 | 28 | 6 | 42 | 2534 | 261 | 52 |
| 8 | 612 | 38 | 8 | 43 | 1825 | 188 | 38 |
| 9 | 1632 | 108 | 22 | 44 | 2340 | 241 | 48 |
| 10 | 2427 | 160 | 32 | 45 | 1169 | 120 | 24 |
| 11 | 934 | 57 | 11 | 46 | 517 | 47 | 9 |
| 12 | 6168 | 411 | 82 | 47 | 244 | 24 | 5 |
| 13 | 9536 | 636 | 127 | 48 | 1627 | 159 | 32 |
| 14 | 6047 | 443 | 89 | 49 | 155 | 16 | 3 |
| 15 | 6907 | 505 | 101 | 50 | 9400 | 865 | 173 |
| 16 | 2040 | 119 | 24 | 51 | 10,516 | 991 | 198 |
| 17 | 119 | 9 | 2 | 52 | 8478 | 783 | 157 |
| 18 | 5389 | 502 | 100 | 53 | 12,492 | 1181 | 236 |
| 19 | 341 | 21 | 4 | 54 | 5831 | 539 | 108 |
| 20 | 1321 | 133 | 27 | 55 | 6233 | 576 | 115 |
| 21 | 143 | 15 | 3 | 56 | 8192 | 737 | 147 |
| 22 | 1118 | 105 | 21 | 57 | 4538 | 398 | 80 |
| 23 | 2656 | 278 | 56 | 58 | 2220 | 197 | 39 |
| 24 | 3835 | 413 | 83 | 59 | 2896 | 271 | 54 |
| 25 | 3835 | 413 | 83 | 60 | 8396 | 785 | 157 |
| 26 | 6793 | 732 | 146 | 61 | 7019 | 648 | 130 |
| 27 | 4426 | 464 | 93 | 62 | 2209 | 244 | 49 |
| 28 | 3330 | 223 | 45 | 63 | 207 | 23 | 5 |
| 29 | 1595 | 107 | 21 | 64 | 600 | 66 | 13 |
| 30 | 8677 | 582 | 116 | 65 | 2413 | 267 | 53 |
| 31 | 1704 | 114 | 23 | 66 | 3504 | 388 | 78 |
| 32 | 2290 | 154 | 31 | 67 | 277 | 25 | 5 |
| 33 | 5878 | 394 | 79 | 68 | 1499 | 116 | 23 |
| 34 | 3782 | 245 | 49 | 69 | 197 | 15 | 3 |
| 35 | 833 | 55 | 11 | 70 | 9776 | 933 | 187 |
© 2019 by the authors. Licensee MDPI, Basel, Switzerland. This article is an open access article distributed under the terms and conditions of the Creative Commons Attribution (CC BY) license (http://creativecommons.org/licenses/by/4.0/).
Share and Cite
Huang, J.; Pang, Y.; Zhang, X.; Tong, Y. Water Environmental Capacity Calculation and Allocation of the Taihu Lake Basin in Jiangsu Province Based on Control Unit. Int. J. Environ. Res. Public Health 2019, 16, 3774. https://0-doi-org.brum.beds.ac.uk/10.3390/ijerph16193774
Huang J, Pang Y, Zhang X, Tong Y. Water Environmental Capacity Calculation and Allocation of the Taihu Lake Basin in Jiangsu Province Based on Control Unit. International Journal of Environmental Research and Public Health. 2019; 16(19):3774. https://0-doi-org.brum.beds.ac.uk/10.3390/ijerph16193774
Chicago/Turabian StyleHuang, Juan, Yong Pang, Xiaoqiang Zhang, and Yifan Tong. 2019. "Water Environmental Capacity Calculation and Allocation of the Taihu Lake Basin in Jiangsu Province Based on Control Unit" International Journal of Environmental Research and Public Health 16, no. 19: 3774. https://0-doi-org.brum.beds.ac.uk/10.3390/ijerph16193774