Factors Influencing the Age of Complementary Feeding—A Cross-Sectional Study from Two European Countries

 ,
, 

Abstract
:1. Introduction
2. Materials and Methods
2.1. Study Design
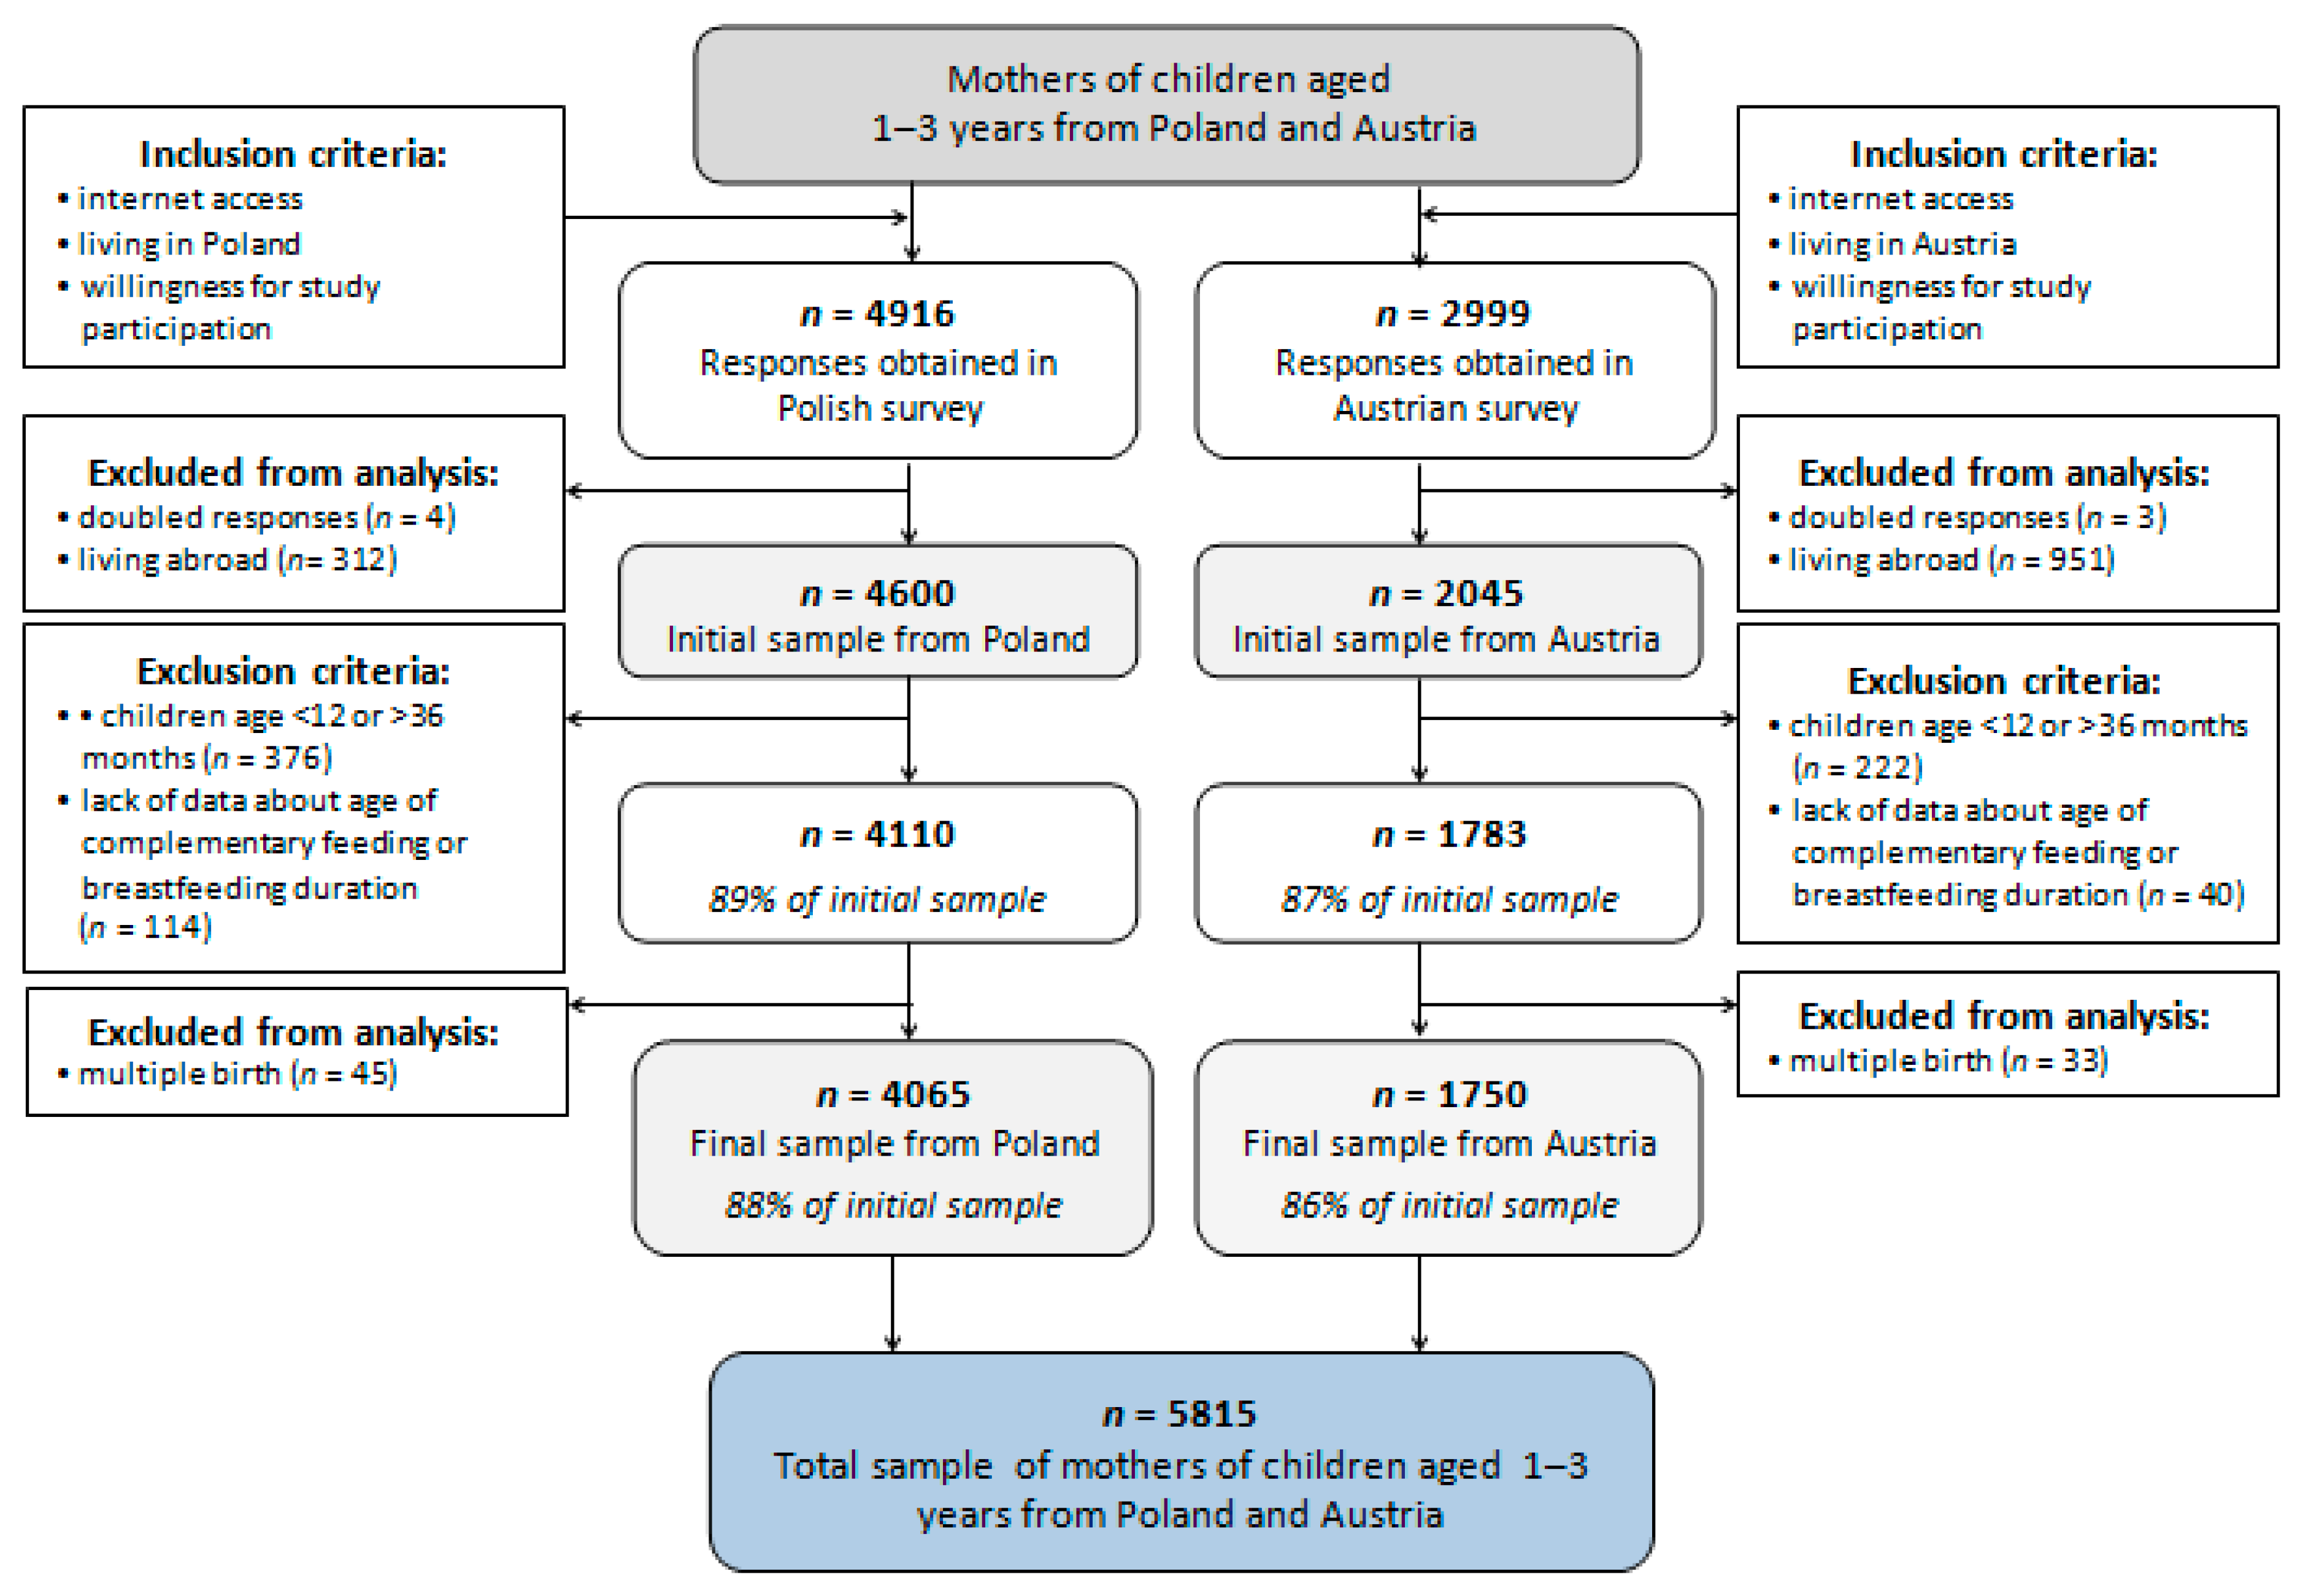
2.2. Study Group
2.3. Questionnaire
2.3.1. Demographics Data
2.3.2. Milk Feeding Practices
2.3.3. Introduction of Solids and First Food Offered, Family Food Environment, and Meal Patterns
2.3.4. Toddlers’ Dietary Habits
2.3.5. Toddlers’ Health and Development
2.4. Statistical Analysis
3. Results
3.1. Study Group Characteristics
3.1.1. Family Characteristics
3.1.2. Children’s Characteristics
3.1.3. Age of Introduction of Complementary Feeding
3.2. Factors Associated with Complementary Feeding Start before 4 Months
3.3. Factors Associated with Complementary Feeding Start between 4 and 6 Months
3.4. Factors Associated with Complementary Feeding Start after 6 Completed Months
4. Discussion
4.1. Age of Introduction of Complementary Feeding
4.2. Sociodemographic Factors Related to the Age of Introduction of Complementary Feeding
4.3. Pregnancy-Related Factors Related to the Age of Introduction of Complementary Feeding
4.4. Children-Feeding Factors Related to the Age of Introduction of Complementary Feeding
4.5. Strengths and Limitations
5. Conclusions
Supplementary Materials
Author Contributions
Funding
Conflicts of Interest
References
- Agostoni, C.; Baselli, L.; Mazzoni, M.B. Early nutrition patterns and diseases of adulthood: A plausible link? Eur. J. Intern. Med. 2013, 24, 5–10. [Google Scholar] [CrossRef] [PubMed]
- Victora, C.G.; Bahl, R.; Barros, A.J.D.; França, G.V.A.; Horton, S.; Krasevec, J.; Murch, S.; Sankar, M.J.; Walker, N.; Rollins, N.C. Breastfeeding in the 21st century: Epidemiology, mechanisms, and lifelong effect. Lancet 2016, 387, 475–490. [Google Scholar] [CrossRef]
- Butte, N.F.; Lopez-Alarcon, M.G.; Garza, C. Nutrient Adequacy of Exclusive Breastfeeding for the Term Infant During the First 6 Months of Life; World Health Organization: Geneva, Switzerland, 2001. [Google Scholar]
- World Health Organization. The World Health Organization’s Infant Feeding Recommendation. Available online: https://www.who.int/nutrition/topics/infantfeeding_recommendation/en/ (accessed on 4 July 2019).
- Szajewska, H.; Horvath, A.; Rybak, A.; Socha, P. Karmienie piersią. Stanowisko Polskiego towarzystwa gastroenterologii, hepatologii i żywienia dzieci. Stand. Med. 2016, 13, 9–24. [Google Scholar]
- Fewtrell, M.; Bronsky, J.; Campoy, C.; Domellöf, M.; Embleton, N.; Fidler Mis, N.; Hojsak, I.; Hulst, J.M.; Indrio, F.; Lapillonne, A.; et al. Complementary feeding: A position paper by the European Society for Paediatric Gastroenterology, Hepatology, and Nutrition (ESPGHAN) Committee on Nutrition. J. Pediatr. Gastroenterol. Nutr. 2017, 64, 119–132. [Google Scholar] [CrossRef] [PubMed]
- Were, F.N.; Lifschitz, C. Complementary feeding: Beyond nutrition. Ann. Nutr. Metab. 2018, 73, 20–25. [Google Scholar] [CrossRef]
- World Health Organization. Complementary Feeding: Report of the Global Consultation, and Summary of Guiding Principles for Complementary Feeding of the Breastfed Child. Available online: https://apps.who.int/iris/handle/10665/42739 (accessed on 5 July 2019).
- World Health Organization (WHO). Commercial Foods for Infants and Young Children in the WHO European Region. A study of the Availability, Composition and Marketing of Baby Foods in Four European Countries; WHO: Geneva, Switzerland, 2019. [Google Scholar]
- European Food Safety Authority (EFSA). EFSA Panel on Dietetic Products, N. and A. (NDA) Scientific opinion on the appropriate age for introduction of complementary feeding of infants. EFSA J. 2009, 7, 1423. [Google Scholar] [CrossRef]
- Szajewska, H.; Socha, P.; Horvath, A.; Rybak, A.; Dobrzańska, A.; Katarzyna Borszewska-Kornacka, M.; Chybicka, A.; Czerwionka-Szaflarska, M.; Gajewska, D.; Helwich, E.; et al. Zasady żywienia zdrowych niemowląt. Zalecenia Polskiego towarzystwa gastroenterologii, hepatologii i żywienia dzieci. Stand. Med. 2014, 11, 321–338. [Google Scholar]
- Austrian Ministry of Labour, Social Affairs, Health and Consumer Protection. Austrian Foodbased Dietary Guidelines for 1- to 3-Year Old Toddlers; Austrian Ministry of Labour, Social Affairs, Health and Consumer Protection: Viena, Austria, 2014.
- Wang, J.; Wu, Y.; Xiong, G.; Chao, T.; Jin, Q.; Liu, R.; Hao, L.; Wei, S.; Yang, N.; Yang, X. Introduction of complementary feeding before 4 months of age increases the risk of childhood overweight or obesity: A meta-analysis of prospective cohort studies. Nutr. Res. 2016, 36, 759–770. [Google Scholar] [CrossRef]
- Bell, S.; Yew, S.; Devenish, G.; Ha, D.; Do, L.; Scott, J. Duration of breastfeeding, but not timing of solid food, reduces the risk of overweight and obesity in children aged 24 to 36 months: Findings from an Australian cohort study. Int. J. Environ. Res. Public Health 2018, 15, 599. [Google Scholar] [CrossRef]
- Burgess, J.A.; Dharmage, S.C.; Allen, K.; Koplin, J.; Garcia-Larsen, V.; Boyle, R.; Waidyatillake, N.; Lodge, C.J. Age at introduction to complementary solid food and food allergy and sensitization: A systematic review and meta-analysis. Clin. Exp. Allergy 2019, 49, 754–769. [Google Scholar] [CrossRef]
- Gupta, S.; Agarwal, R.; Aggarwal, K.C.; Chellani, H.; Duggal, A.; Arya, S.; Bhatia, S.; Sankar, M.J.; Sreenivas, V.; Jain, V.; et al. Complementary feeding at 4 versus 6 months of age for preterm infants born at less than 34 weeks of gestation: A randomised, open-label, multicentre trial. Lancet Glob. Heal. 2017, 5, e501–e511. [Google Scholar] [CrossRef]
- White, J.M.; Bégin, F.; Kumapley, R.; Murray, C.; Krasevec, J. Complementary feeding practices: Current global and regional estimates. Matern. Child Nutr. 2017, 13, e12505. [Google Scholar] [CrossRef] [PubMed] [Green Version]
- Schiess, S.; Grote, V.; Scaglioni, S.; Luque, V.; Martin, F.; Stolarczyk, A.; Vecchi, F.; Koletzko, B.; Project, C.O. Introduction of complementary feeding in 5 European Countries. J. Pediatr. Gastroenterol. Nutr. 2010, 50, 92–98. [Google Scholar] [CrossRef] [PubMed]
- Tromp, I.I.M.; Briedé, S.; Kiefte-de Jong, J.C.; Renders, C.M.; Jaddoe, V.W.V.; Franco, O.H.; Hofman, A.; Raat, H.; Moll, H.A. Factors associated with the timing of introduction of complementary feeding: The generation R study. Eur. J. Clin. Nutr. 2013, 67, 625–630. [Google Scholar] [CrossRef]
- Kronborg, H.; Foverskov, E.; Væth, M. Breastfeeding and introduction of complementary food in Danish infants. Scand. J. Public Health 2015, 43, 138–145. [Google Scholar] [CrossRef]
- Alzaheb, R.; Alzaheb, A.R. Factors Associated with the early introduction of complementary feeding in saudi arabia. Int. J. Environ. Res. Public Health 2016, 13, 702. [Google Scholar] [CrossRef]
- Helle, C.; Hillesund, E.R.; Overby, N.C. Timing of complementary feeding and associations with maternal and infant characteristics: A Norwegian cross-sectional study. PLoS ONE 2018, 13, e0199455. [Google Scholar] [CrossRef]
- Eurostat. Population on 1 January 2019. Available online: https://ec.europa.eu/eurostat/databrowser/view/tps00001/default/table?lang=en (accessed on 2 October 2019).
- Eurostat GDP at Regional Level. Available online: https://ec.europa.eu/eurostat/statistics-explained/index.php/GDP_at_regional_level#Regional_GDP_per_capita (accessed on 4 July 2019).
- Villar, J.; Ismail, L.C.; Victora, C.G.; Ohuma, E.O.; Bertino, E.; Altman, D.G.; Lambert, A.; Papageorghiou, A.T.; Carvalho, M.; Jaffer, Y.A.; et al. International fetal and newborn growth consortium for the 21st century (INTERGROWTH-21st). International standards for newborn weight, length, and head circumference by gestational age and sex: The newborn cross-sectional study of the INTERGROWTH-21st Project. Lancet 2014, 384, 857–868. [Google Scholar]
- INTERGROWTH-21st Neonatal Size Calculator. Available online: http://intergrowth21.ndog.ox.ac.uk/ (accessed on 28 September 2019).
- World Health Organization. WHO Child Growth Standards: Length/Height-For-Age, Weight-For-Age, Weight-For-Length, Weight-Forheight and Body Mass Index-For-Age: Methods and Development; WHO: Geneva, Switzerland, 2006. [Google Scholar]
- Papoutsou, S.; Savva, S.C.; Hunsberger, M.; Jilani, H.; Michels, N.; Ahrens, W.; Tornaritis, M.; Veidebaum, T.; Molnár, D.; Siani, A.; et al. IDEFICS consortium. timing of solid food introduction and association with later childhood overweight and obesity: The IDEFICS study. Matern. Child Nutr. 2018, 14, e12471. [Google Scholar] [CrossRef]
- Scott, J.A.; Binns, C.W.; Graham, K.I.; Oddy, W.H. Predictors of the early introduction of solid foods in infants: Results of a cohort study. BMC Pediatr. 2009, 9, 60. [Google Scholar] [CrossRef]
- Griffiths, L.J.; Tate, A.R.; Dezateux, C.; Bartington, S.; Bedford, H.; Cole, T.; Hawkins, S.S.; Law, C.; Peckham, C.; Samad, L.; et al. Do early infant feeding practices vary by maternal ethnic group? Public Health Nutr. 2007, 10, 957–964. [Google Scholar] [CrossRef] [PubMed] [Green Version]
- Wang, L.; van Grieken, A.; van der Velde, L.A.; Vlasblom, E.; Beltman, M.; L’Hoir, M.P.; Boere-Boonekamp, M.M.; Raat, H. Factors associated with early introduction of complementary feeding and consumption of non-recommended foods among Dutch infants: The BeeBOFT study. BMC Public Health 2019, 19, 388. [Google Scholar] [CrossRef] [PubMed]
- Barrera, C.M.; Hamner, H.C.; Perrine, C.G.; Scanlon, K.S. Timing of introduction of complementary foods to US infants, national health and nutrition examination survey 2009–2014. J. Acad. Nutr. Diet. 2018, 118, 464–470. [Google Scholar] [CrossRef] [PubMed]
- Carletti, C.; Pani, P.; Monasta, L.; Knowles, A.; Cattaneo, A. Introduction of complementary foods in a cohort of infants in northeast Italy: Do parents comply with WHO recommendations? Nutrients 2017, 9, 34. [Google Scholar] [CrossRef] [PubMed]
- Brekke, H.K.; Ludvigsson, J.F.; van Odijk, J.; Ludvigsson, J. Breastfeeding and introduction of solid foods in Swedish infants: The All Babies in Southeast Sweden study. Br. J. Nutr. 2005, 94, 377–382. [Google Scholar] [CrossRef] [PubMed]
- Rebhan, B.; Kohlhuber, M.; Schwegler, U.; Koletzko, B.V.; Fromme, H. Infant feeding practices and associated factors through the first 9 months of life in Bavaria, Germany. J. Pediatr. Gastroenterol. Nutr. 2009, 49, 467–473. [Google Scholar] [CrossRef]
- Fewtrell, M.S.; Lucas, A.; Morgan, J.B. Factors associated with weaning in full term and preterm infants. Arch. Dis. Child. Fetal Neonatal Ed. 2003, 88, F296–F301. [Google Scholar] [CrossRef]
- Braid, S.; Harvey, E.M.; Bernstein, J.; Matoba, N. Early introduction of complementary foods in preterm infants. J. Pediatr. Gastroenterol. Nutr. 2015, 60, 811–818. [Google Scholar] [CrossRef]
- Giannì, M.; Bezze, E.; Colombo, L.; Rossetti, C.; Pesenti, N.; Roggero, P.; Sannino, P.; Muscolo, S.; Plevani, L.; Mosca, F. Complementary feeding practices in a cohort of italian late preterm infants. Nutrients 2018, 10, 1861. [Google Scholar] [CrossRef]
- Baldassarre, M.; Di Mauro, A.; Pedico, A.; Rizzo, V.; Capozza, M.; Meneghin, F.; Lista, G.; Laforgia, N. Weaning time in preterm infants: An audit of italian primary care paediatricians. Nutrients 2018, 10, 616. [Google Scholar] [CrossRef]
- Burke, R.M.; Leon, J.S.; Suchdev, P.S. Identification, prevention and treatment of iron deficiency during the first 1000 days. Nutrients 2014, 6, 4093–4114. [Google Scholar] [CrossRef] [PubMed]
- Domellöf, M.; Braegger, C.; Campoy, C.; Colomb, V.; Decsi, T.; Fewtrell, M.; Hojsak, I.; Mihatsch, W.; Molgaard, C.; Shamir, R.; et al. Iron requirements of infants and toddlers. J. Pediatr. Gastroenterol. Nutr. 2014, 58, 119–129. [Google Scholar] [CrossRef] [PubMed]
- Clayton, H.B.; Li, R.; Perrine, C.G.; Scanlon, K.S. Prevalence and reasons for introducing infants early to solid foods: Variations by milk feeding type. Pediatrics 2013, 131, e1108–e1114. [Google Scholar] [CrossRef] [PubMed]
- World Health Organization. Ending Inappropriate Promotion of Commercially Available Complementary Foods for Infants and Young Children Between 6 and 36 Months in Europe; A Discussion Paper Outlining the First Steps in Developing a Nutrient Profile Model to Drive Changes to Product Composition and Labelling and Promotion Practices in the WHO European Region; WHO: Geneva, Switzerland, 2019. [Google Scholar]
- Newby, R.M.; Davies, P.S.W. Why do women stop breast-feeding: Results from a contemporary prospective study in a cohort of Australian women. Eur. J. Clin. Nutr. 2016, 70, 1428–1432. [Google Scholar] [CrossRef]
- Eurostat Individuals—Internet Use. Available online: https://appsso.eurostat.ec.europa.eu/nui/show.do?dataset=isoc_ci_ifp_iu&lang=en (accessed on 20 August 2019).
- Statistics Poland Information Society in Poland. Results of Statistical Surveys in the Years 2014–2018; Statistics Poland: Warsaw, Poland, 2018. [Google Scholar]


| Variable | Poland (n = 4065) % (n) | Austria (n = 1750) % (n) | p-Value |
|---|---|---|---|
| Maternal age: | ≤0.001 | ||
| <25 years | 4.7 (191) | 4.6 (80) | |
| 25–29 years | 32.5 (1320) | 26.1 (457) | |
| 30–34 years | 47.7 (1938) | 39.5 (692) | |
| 35–39 years | 13.6 (554) | 24.9 (436) | |
| ≥40 years | 1.5 (62) | 4.9 (85) | |
| Paternal age: | ≤0.001 | ||
| <25 years | 1.5 (59) | 2.0 (35) | |
| 25–29 years | 20.2 (823) | 14.3 (250) | |
| 30–34 years | 48.8 (1985) | 34.2 (598) | |
| 35–39 years | 22.7 (924) | 30.3 (531) | |
| ≥40 years | 6.7 (274) | 19.2 (336) | |
| Maternal education: | ≤0.001 | ||
| primary and vocational | 0.9 (38) | 26.2 (458) | |
| high school | 11.7 (477) | 3.6 (63) | |
| University | 87.3 (3550) | 70.2 (1229) | |
| Paternal education: | ≤0.001 | ||
| primary and vocational | 9.1 (373) | 45.0 (787) | |
| high school | 23.4 (950) | 6.6 (116) | |
| University | 67.5 (2742) | 48.4 (847) | |
| Household size: | ≤0.001 | ||
| 2 | 2.0 (81) | 2.2 (39) | |
| 3 | 62.3 (2531) | 47.1 (824) | |
| 4 | 28.3 (1149) | 37.8 (661) | |
| 5 | 5.5 (225) | 9.0 (158) | |
| ≥6 | 1.9 (79) | 3.9 (68) | |
| Number of children living in the household: | ≤0.001 | ||
| 1 | 67.8 (2758) | 48.9 (855) | |
| 2 | 27.8 (1129) | 36.6 (641) | |
| ≥3 | 4.4 (178) | 14.5 (254) | |
| Living area: | ≤0.001 | ||
| rural | 17.3 (705) | 56.3 (986) | |
| urban | 82.7 (3360) | 43.7 (764) | |
| Living macroeconomic region: | ≤0.001 | ||
| 47%–50% GDP EU-28 average | 13.9 (564) | - | |
| 51%–100% GDP EU-28 average | 62.7 (2550) | 5.5 (96) | |
| 101%–110% GDP EU-28 average | 23.4 (951) | 42.1 (737) | |
| 111%–130% GDP EU-28 average | - | 26.2 (459) | |
| 131%–150% GDP EU-28 average | - | 10.2 (179) | |
| >150% GDP EU-28 average | - | 15.9 (279) | |
| Average monthly income per capita 1: | ≤0.001 | ||
| 1st category | 1.5 (59) | 8.5 (149) | |
| 2nd category | 14.5 (588) | 20.8 (364) | |
| 3rd category | 32.7 (1328) | 31.4 (550) | |
| 4th category | 17.4 (706) | 26.4 (462) | |
| 5th category | 12.3 (499) | 10.6 (186) | |
| 6th category | 21.8 (885) | 2.2 (39) |
| Variable | Poland (n = 4065) Mean ± SD 1 Min–Max % (n) | Austria (n = 1750) Mean ± SD Min–Max % (n) | ||||||
|---|---|---|---|---|---|---|---|---|
| <4 mo | 4–6 mo | >6 mo | p-Value | <4 mo | 4–6 mo | >6 mo | p-Value | |
| Infant age: | 24.2 ± 7.6 | 22.1 ± 7.3 | 21.3 ± 7.1 | ≤0.01 | 25.1 ± 8.1 | 23.9 ± 7.7 | 23.7 ± 7.9 | 0.110 |
| 12.0–36.0 | 12.0–36.0 | 12.0–36.0 | 12.0–36.0 | 12.0–36.0 | 12.0–36.0 | |||
| Infant gender: | 0.085 | 0.468 | ||||||
| female | 52.0 (51) | 46.3 (1139) | 49.6 (748) | 44.7 (34) | 49.8 (656) | 52.4 (187) | ||
| male | 48.0 (47) | 53.7 (1321) | 50.4 (759) | 55.3 (42) | 50.2 (661) | 47.6 (170) | ||
| Pregnancy duration: | ||||||||
| <37 weeks | 79.6 (78) | 7.2 (178) | 0.3 (4) | ≤0.001 | 59.2 (45) | 4.4 (58) | 2.0 (7) | ≤0.001 |
| 37–42 weeks | 19.4 (19) | 92.2 (2268) | 99.3 (1497) | 39.5 (30) | 94.6 (1246) | 98.0 (350) | ||
| >42 weeks | 1.0 (1) | 0.6 (14) | 0.4 (6) | 1.3 (1) | 1.0 (13) | - | ||
| Birthweight to gestational age categories: | ||||||||
| SGA 2 | 7.1 (7) | 4.6 (113) | 3.1 (47) | 0.016 | 11.8 (9) | 6.2 (81) | 7.8 (28) | 0.293 |
| AGA 3 | 68.4 (67) | 75.9 (1866) | 79.0 (1190) | 73.7 (56) | 80.8 (1064) | 78.7 (281) | ||
| LGA 4 | 24.5 (24) | 19.5 (481) | 17.9 (270) | 14.5 (11) | 13.0 (172) | 13.5 (48) | ||
| Any breastfeeding: | ||||||||
| no | 22.5 (22) | 7.2 (178) | 1.0 (15) | ≤0.001 | 13.2 (10) | 7.7 (102) | 10.6 (38) | 0.076 |
| yes | 77.5 (76) | 92.8 (2282) | 99.0 (1492) | 86.8 (686) | 92.3 (1215) | 89.4 (319) | ||
| Infant formula use at maternity ward: | ||||||||
| no | 28.6 (28) | 36.9 (908) | 47.2 (711) | ≤0.001 | 36.8 (28) | 61.0 (804) | 67.8 (242) | ≤0.001 |
| don’t know | 3.1 (3) | 3.8 (94) | 4.1 (62) | 1.3 (1) | 0.5 (6) | 0.6 (2) | ||
| yes | 68.4 (67) | 59.3 (1458) | 48.7 (734) | 61.8 (47) | 38.5 (507) | 31.7 (113) | ||
| Infant formula use after discharge: | ||||||||
| no | 34.7 (34) | 61.5 (1512) | 80.9 (1219) | ≤0.001 | 38.2 (29) | 67.0 (882) | 78.2 (279) | ≤0.001 |
| yes | 65.3 (64) | 38.5 (948) | 19.1 (288) | 61.8 (47) | 33.0 (435) | 21.8 (78) | ||
| Complementary feeding method: | ||||||||
| TSF 5 | 60.2 (59) | 35.9 (884) | 13.3 (201) | ≤0.001 | 52.6 (40) | 39.5 (520) | 22.1 (79) | ≤0.001 |
| mixed | 35.7 (35) | 52.8 (1299) | 58.7 (884) | 39.5 (30) | 49.2 (648) | 52.4 (187) | ||
| BLW 6 | 4.1 (4) | 11.3 (277) | 28.0 (422) | 7.9 (6) | 11.3 (149) | 25.5 (91) | ||
| Variable | Poland (n = 4065) | Austria (n = 1750) | |||
|---|---|---|---|---|---|
| OR 1 (95% CI 2) | aOR 3 (95% CI) | OR (95% CI) | aOR (95% CI) | ||
| SOCIODEMOGRAPHIC FACTORS | Maternal age: | ||||
| <25 years | 2.41 (1.15–5.05) * | 1.17 (0.37–3.73) | 2.24 (0.82–6.14) | 2.49 (0.76–8.11) | |
| 25–29 years | 1.29 (0.81–2.05) | 1.64 (0.90–2.98) | 1.94 (1.07–3.54) * | 2.21 (1.06–4.65) * | |
| 30–34 years | 1 | 1 | 1 | 1 | |
| 35–39 years | 1.26 (0.68–2.34) | 1.33 (0.62–2.89) | 1.87 (1.02–3.45) * | 1.76 (0.83–3.71) | |
| ≥40 years | 1.62 (0.38–6.88) | 1.37 (0.22–8.32) | 1.23 (0.36–4.23) | 0.65 (0.14–2.92) | |
| Maternal education: | |||||
| primary and vocational | 8.93 (3.62–22.02) *** | 14.49 (3.73–56.35) *** | 1.62 (0.99–2.67) | 2.13 (1.10–4.11) * | |
| high school | 1.98 (1.18–3.30) ** | 2.20 (1.06–4.60) * | 2.84 (1.16–6.93) * | 3.35 (1.09–10.28) * | |
| university | 1 | 1 | 1 | 1 | |
| Number of children in household: | |||||
| 1 | 1.16 (0.73–1.86) | 0.93 (0.52–1.69) | 1.45 (0.86–2.46) | 0.79 (0.42–1.51) | |
| 2 | 1 | 1 | 1 | 1 | |
| ≥3 | 1.61 (0.65–3.99) | 1.53 (0.43–5.50) | 1.40 (0.68–2.86) | 1.07 (0.46–2.49) | |
| Living area: | |||||
| rural | 1.00 (0.59–1.70) | 0.59 (0.30–1.15) | 1.31 (0.71–1.81) | 1.41 (0.68–2.92) | |
| urban | 1 | 1 | 1 | 1 | |
| Living in macroeconomic region (GDP EU-28 average): | |||||
| 47–50% | 1.79 (1.01–3.17) * | 1.69 (0.77–3.67) | - | - | |
| 51–100% | 0.76 (0.46–1.24) | 0.84 (0.45–1.56) | 1.34 (0.51–3.55) | 1.36 (0.43–4.23) | |
| 101–110% | 1 | 1 | 1 | 1 | |
| 111–130% | - | - | 1.05 (0.58–1.90) | 0.89 (0.44–1.81) | |
| 131–150% | - | - | 0.85 (0.35–2.07) | 0.94 (0.32–2.79) | |
| >150% | - | - | 1.58 (0.86–2.93) | 2.52 (1.02–6.26) * | |
| Average monthly income per capita 4: | |||||
| 1st category | 1.42 (0.32–6.31) | 0.70 (0.10–4.80) | 1.37 (0.55–3.41) | 1.01 (0.34–3.03) | |
| 2nd category | 1.58 (0.83–3.00) | 1.08 (0.44–2.64) | 1.45 (0.73–2.89) | 1.09 (0.47–2.51) | |
| 3rd category | 0.71 (0.38–1.35) | 0.55 (0.25–1.19) | 1.11 (0.57–2.15) | 1.02 (0.46–2.28) | |
| 4th category | 1 | 1 | 1 | 1 | |
| 5th categery | 0.58 (0.24–1.40) | 0.16–1.24) | 1.92 (0.89–4.15) | 2.28 (0.91–5.72) | |
| 6th category | 1.23 (0.69–2.36) | 1150.53–2.50) | 1.51 (0.33–6.81) | 1.01 (0.14–7.08) | |
| PREGNANCY-RELATED FACTORS | Pregnancy duration: | ||||
| preterm | 8.11 (4.86–13.55) *** | 10.21 (5.73–18.20) *** | 3.59 (2.14–6.05) *** | 4.45 (2.42–8.18) *** | |
| term | 1 | 1 | 1 | 1 | |
| Birthweight to gestational age categories: | |||||
| SGA 5 | 2.00 (0.90–4.42) | 1.33 (0.46–3.84) | 1.98 (0.96–4.12) | 1.30 (0.55–3.10) | |
| AGA 6 | 1 | 1 | 1 | 1 | |
| LGA 7 | 1.46 (0.91–2.34) | 1.74 (0.97–3.13) | 1.20 (0.62–2.33) | 1.59 (0.71–3.53) | |
| FEEDING-RELATED FACTORS | Any breastfeeding: | ||||
| no | 5.66 (3.45–9.30) *** | 2.73 (1.29–5.76) ** | 1.66 (0.84–3.30) | 1.49 (1.20–2.21) | |
| yes | 1 | 1 | 1 | 1 | |
| Infant formula use at maternity ward: | |||||
| no | 1 | 1 | 1 | 1 | |
| otherwise | 1.72 (1.11–2.68) * | 0.61 (0.33 – 1.21) | 2.86 (1.77–4.60) *** | 1.24 (0.64–2.41) | |
| Infant formula use after discharge: | |||||
| no | 1 | 1 | 1 | 1 | |
| yes | 4.16 (2.73–6.34) *** | 3.73 (2.06 – 6.75) *** | 3.67(2.28–5.89) *** | 3.65 (1.87–7.12) *** | |
| Variable | Poland (n = 4065) | Austria (n = 1750) | |||
|---|---|---|---|---|---|
| OR 1 (95% CI 2) | aOR 3 (95% CI) | OR (95% CI) | aOR (95% CI) | ||
| SOCIODEMOGRAPHIC FACTORS | Maternal age: | ||||
| <25 years | 1.75 (1.27–2.42) *** | 1.57 (1.10–2.25) * | 0.65 (0.39–1.08) | 0.60 (0.35–1.02) | |
| 25–29 years | 1.39 (1.20–1.61) *** | 1.34 (1.15–1.57) *** | 0.91 (0.69–1.20) | 0.89 (0.67–1.19) | |
| 30–34 years | 1 | 1 | 1 | 1 | |
| 35–39 years | 1.03 (0.85–1.25) | 1.01 (0.83–1.23) | 0.84 (0.63–1.10) | 0.85 (0.63–1.13) | |
| ≥40 years | 0.85 (0.51–1.41) | 0.82 (0.49–1.38) | 0.80 (0.48–1.33) | 0.88 (0.52–1.51) | |
| Maternal education: | |||||
| primary and vocational | 1.30 (0.66–2.55) | 0.98 (0.49–1.98) | 0.99 (0.77–1.27) | 0.93 (0.71–1.23) | |
| high school | 1.33 (1.08–1.62) ** | 1.19 (0.96–1.49) | 0.60 (0.35–1.02) | 0.60 (0.34–1.05) | |
| University | 1 | 1 | 1 | 1 | |
| Number of children in household: | |||||
| 1 | 1.02 (0.89–1.18) | 0.90 (0.77–1.05) | 0.97 (0.76–1.24) | 1.02 (0.79–1.32) | |
| 2 | 1 | 1 | 1 | 1 | |
| ≥3 | 0.75 (0.54–1.03) | 0.84 (0.61–1.17) | 0.66 (0.48–0.91) * | 0.69 (0.49–0.96) * | |
| Living area: | |||||
| rural | 1.22 (1.03–1.45) * | 1.13 (0.95–1.35) | 1.23 (0.99–1.53) | 1.38 (1.06–1.80) * | |
| urban | 1 | 1 | 1 | 1 | |
| Living in macroeconomic region (GDP EU-28 average): | |||||
| 47–50% | 1.32 (1.06–1.64) * | 1.20 (0.96–1.52) | - | - | |
| 51–100% | 0.97 (0.83–1.13) | 0.94 (0.80–1.10) | 0.91 (0.56–1.46) | 0.90 (0.55–1.47) | |
| 101–110% | 1 | 1 | 1 | 1 | |
| 111–130% | - | - | 1.20 (0.91–1.57) | 1.26 (0.95–1.67) | |
| 131–150% | - | - | 1.91 (1.24–2.96) ** | 2.17 (1.38–3.43) *** | |
| >150% | - | - | 0.90 (0.66–1.22) | 1.13 (0.79–1.61) | |
| Average monthly income per capita 4: | |||||
| 1st category | 1.34 (0.76–2.34) | 0.93 (0.52–1.67) | 0.88 (0.58–1.34) | 1.00 (0.65–1.56) | |
| 2nd category | 1.06 (0.85–1.32) | 0.85 (0.67–1.08) | 1.02 (0.74–1.40) | 1.08 (0.78–1.51) | |
| 3rd category | 1.08 (0.90–1.30) | 1.01 (0.83–1.22) | 1.08 (0.81–1.44) | 1.13 (0.84–1.53) | |
| 4th category | 1 | 1 | 1 | 1 | |
| 5th category | 1.09 (0.86–1.38) | 1.08 (0.85–1.34) | 0.79 (0.54–1.16) | 0.89 (0.60–1.32) | |
| 6th category | 1.01 (0.82–1.23) | 1.03 (0.84–1.27) | 0.94 (0.44–1.99) | 0.97 (0.45–2.10) | |
| PREGNANCY-RELATED FACTORS | Pregnancy duration: | ||||
| preterm | 1.45 (1.11–1.90) ** | 1.27 (0.96–1.68) | 0.34 (0.23–0.50) *** | 0.31 (0.21–0.47) *** | |
| term | 1 | 1 | 1 | 1 | |
| Birthweight to gestational age categories: | |||||
| SGA 5 | 1.41 (1.01–1.97) * | 1.37 (0.97–1.93) | 0.69 (0.46–1.04) | 0.82 (0.54–1.25) | |
| AGA 6 | 1 | 1 | 1 | 1 | |
| LGA 7 | 1.10 (0.94–1.30) | 1.10 (0.93–1.30) | 0.92 (0.67–1.27) | 0.96 (0.69–1.34) | |
| FEEDING-RELATED FACTORS | Any breastfeeding: | ||||
| no | 3.31 (2.31–4.74) *** | 1.78 (1.21–2.60) ** | 0.69 (0.48–1.00) * | 1.49 (1.31–1.77) ** | |
| yes | 1 | 1 | 1 | 1 | |
| Infant formula use at maternity ward: | |||||
| no | 1 | 1 | 1 | 1 | |
| otherwise | 1.46 (1.28–1.66) *** | 1.16 (1.01–1.33) * | 1.07 (0.85–1.33) | 1.07 (0.80–1.43) | |
| Infant formula use after discharge: | |||||
| no | 1 | 1 | 1 | 1 | |
| yes | 2.23 (1.93–2.58) *** | 1.91 (1.63–2.24) *** | 1.23 (0.97–1.56) | 1.61 (1.17–2.21) ** | |
| Variable | Poland (n = 4065) | Austria (n = 1750) | |||
|---|---|---|---|---|---|
| OR 1 (95% CI 2) | aOR 3 (95% CI) | OR (95% CI) | aOR (95% CI) | ||
| SOCIO-DEMOGRAPHIC FACTORS | Maternal age: | ||||
| <25 years | 0.49 (0.35–0.69) *** | 0.58 (0.40–0.85) ** | 1.34 (0.78–2.30) | 1.63 (0.92–2.88) | |
| 25–29 years | 0.70 (0.60–0.81) *** | 0.72 (0.61–0.84) *** | 0.94 (0.70–1.27) | 1.01 (0.74–1.38) | |
| 30–34 years | 1 | 1 | 1 | 1 | |
| 35–39 years | 0.95 (0.78–1.15) | 0.99 (0.80–1.21) | 1.06 (0.79–1.43) | 1.11 (0.81–1.52) | |
| ≥40 years | 1.13 (0.68–1.88) | 1.31 (0.75–2.27) | 1.32 (0.78–2.23) | 1.39 (0.80–2.41) | |
| Maternal education: | |||||
| primary and vocational | 0.36 (0.16–0.83) * | 0.51 (0.21–1.21) | 0.90 (0.69–1.18) | 0.92 (0.68–1.24) | |
| high school | 0.68 (0.56–0.84) *** | 0.77 (0.61–0.97) * | 1.31 (0.73–2.34) | 1.42 (0.76–2.63) | |
| University | 1 | 1 | 1 | 1 | |
| Number of children in household: | |||||
| 1 | 0.97 (0.84–1.11) | 1.14 (0.97–1.33) | 0.95 (0.73–1.23) | 1.01 (0.77–1.33) | |
| 2 | 1 | 1 | 1 | 1 | |
| ≥3 | 1.28 (0.93–1.76) | 1.11 (0.79–1.56) | 1.48 (1.05–2.08) * | 1.55 (1.09–2.21) * | |
| Living area: | |||||
| rural | 0.81 (0.69–0.97) * | 0.94 (0.78–1.13) | 0.77 (0.61–0.98) * | 0.66 (0.50–0.88) ** | |
| urban | 1 | 1 | 1 | 1 | |
| Living in macroeconomic region (GDP EU-28 average): | |||||
| 47–50% | 0.69 (0.55–0.86) ** | 0.78 (0.61–0.99) * | - | - | |
| 51–100% | 1.06 (0.91–1.24) | 1.10 (0.93–1.30) | 1.10 (0.67–1.82) | 1.19 (0.71–2.00) | |
| 101–110% | 1 | 1 | 1 | 1 | |
| 111–130% | - | - | 0.81 (0.60–1.08) | 0.80 (0.59–1.08) | |
| 131–150% | - | - | 0.49 (0.30–0.79) * | 0.42 (0.25–0.69) *** | |
| >150% | - | - | 1.00 (0.72–1.39) | 0.74 (0.51–1.09) | |
| Average monthly income per capita 4: | |||||
| 1st category | 0.71 (0.40–1.26) | 1.12 (0.61–2.08) | 1.07 (0.69–1.67) | 0.98 (0.61–1.56) | |
| 2nd category | 0.89 (0.71–1.12) | 1.16 (0.90–1.49) | 0.90 (0.64–1.26) | 0.89 (0.62–1.27) | |
| 3rd category | 0.95 (0.79–1.15) | 1.04 (0.85–1.27) | 0.91 (0.67–1.24) | 0.90 (0.66–1.24) | |
| 4th category | 1 | 1 | 1 | 1 | |
| 5th category | 0.96 (0.76–1.22) | 0.98 (0.76–1.25) | 1.10 (0.73–1.65) | 1.02 (0.66–1.56) | |
| 6th category | 0.97 (0.79–1.18) | 0.96 (0.78–1.20) | 0.97 (0.43–2.18) | 1.04 (0.45–2.41) | |
| PREGNANCY-RELATED FACTORS | Pregnancy duration: | ||||
| preterm | 0.02 (0.01–0.06) *** | 0.03 (0.01–0.07) *** | 0.25 (0.12–0.54) *** | 0.26 (0.12–0.57) *** | |
| term | 1 | 1 | 1 | 1 | |
| Birthweight to gestational age categories: | |||||
| SGA 5 | 0.64 (0.45–0.90) * | 0.65 (0.45–0.94) * | 1.24 (0.80–1.93) | 1.22 (0.76–1.93) | |
| AGA 6 | 1 | 1 | 1 | 1 | |
| LGA 7 | 0.87 (0.74–1.02) | 0.88 (0.74–1.05) | 1.05 (0.74–1.47) | 0.96 (0.67–1.37) | |
| FEEDING-RELATED FACTORS | Any breastfeeding: | ||||
| no | 0.12 (0.07–0.20) *** | 0.25 (0.15–0.44) *** | 0.36 (0.12–1.41) | 0.36 (0.15–0.65) *** | |
| yes | 1 | 1 | 1 | 1 | |
| Infant formula use at maternity ward: | |||||
| no | 1 | 1 | 1 | 1 | |
| otherwise | 0.65 (0.57–0.74) *** | 0.88 (0.77–1.02) | 0.71 (0.55–0.90) | 0.89 (0.64–1.22) | |
| Infant formula use after discharge: | |||||
| no | 1 | 1 | 1 | 1 | |
| yes | 0.36 (0.31–0.42) *** | 0.45 (0.38–0.54) *** | 0.53 (0.40–0.70) *** | 0.37 (0.25–0.55) *** | |
© 2019 by the authors. Licensee MDPI, Basel, Switzerland. This article is an open access article distributed under the terms and conditions of the Creative Commons Attribution (CC BY) license (http://creativecommons.org/licenses/by/4.0/).
Share and Cite
Zielinska, M.A.; Rust, P.; Masztalerz-Kozubek, D.; Bichler, J.; Hamułka, J. Factors Influencing the Age of Complementary Feeding—A Cross-Sectional Study from Two European Countries. Int. J. Environ. Res. Public Health 2019, 16, 3799. https://0-doi-org.brum.beds.ac.uk/10.3390/ijerph16203799
Zielinska MA, Rust P, Masztalerz-Kozubek D, Bichler J, Hamułka J. Factors Influencing the Age of Complementary Feeding—A Cross-Sectional Study from Two European Countries. International Journal of Environmental Research and Public Health. 2019; 16(20):3799. https://0-doi-org.brum.beds.ac.uk/10.3390/ijerph16203799
Chicago/Turabian StyleZielinska, Monika A., Petra Rust, Daria Masztalerz-Kozubek, Jacqueline Bichler, and Jadwiga Hamułka. 2019. "Factors Influencing the Age of Complementary Feeding—A Cross-Sectional Study from Two European Countries" International Journal of Environmental Research and Public Health 16, no. 20: 3799. https://0-doi-org.brum.beds.ac.uk/10.3390/ijerph16203799