Changes of Bacterial Communities in Response to Prolonged Hydrodynamic Disturbances in the Eutrophic Water-Sediment Systems

 , and
, and 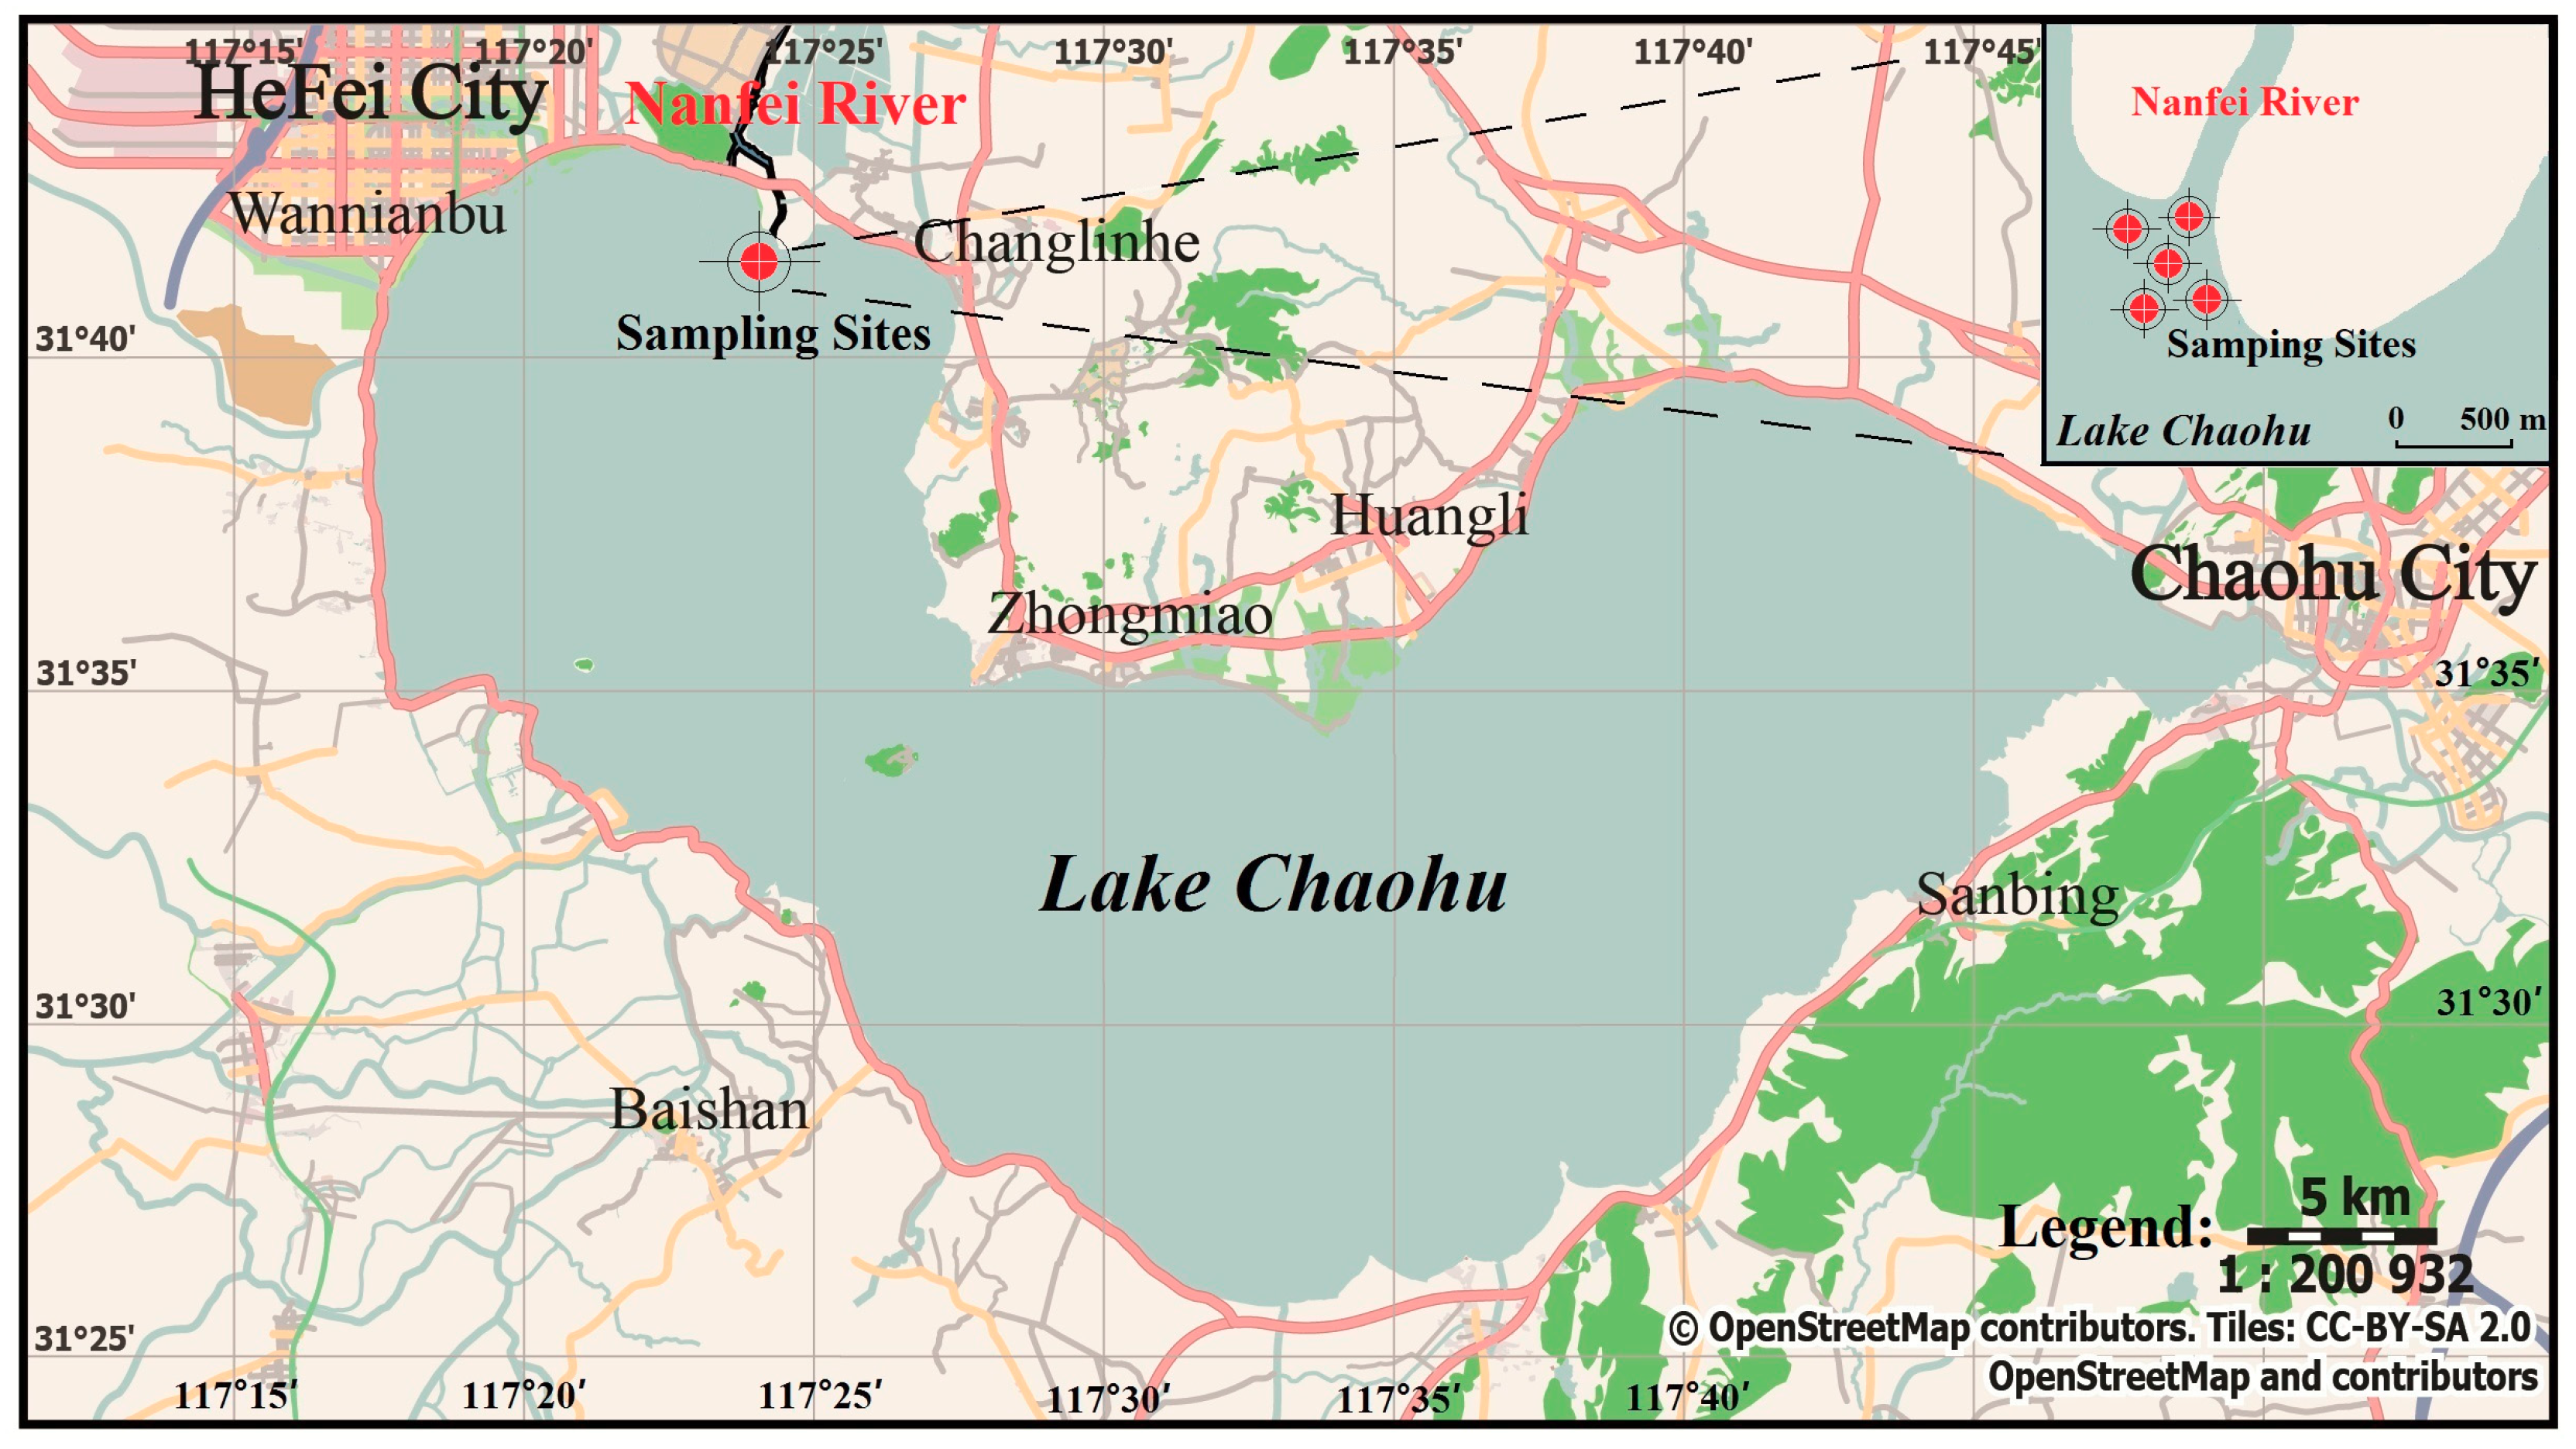
Abstract
:1. Introduction
2. Materials and Methods
2.1. Sampling Sites and Experimental Materials
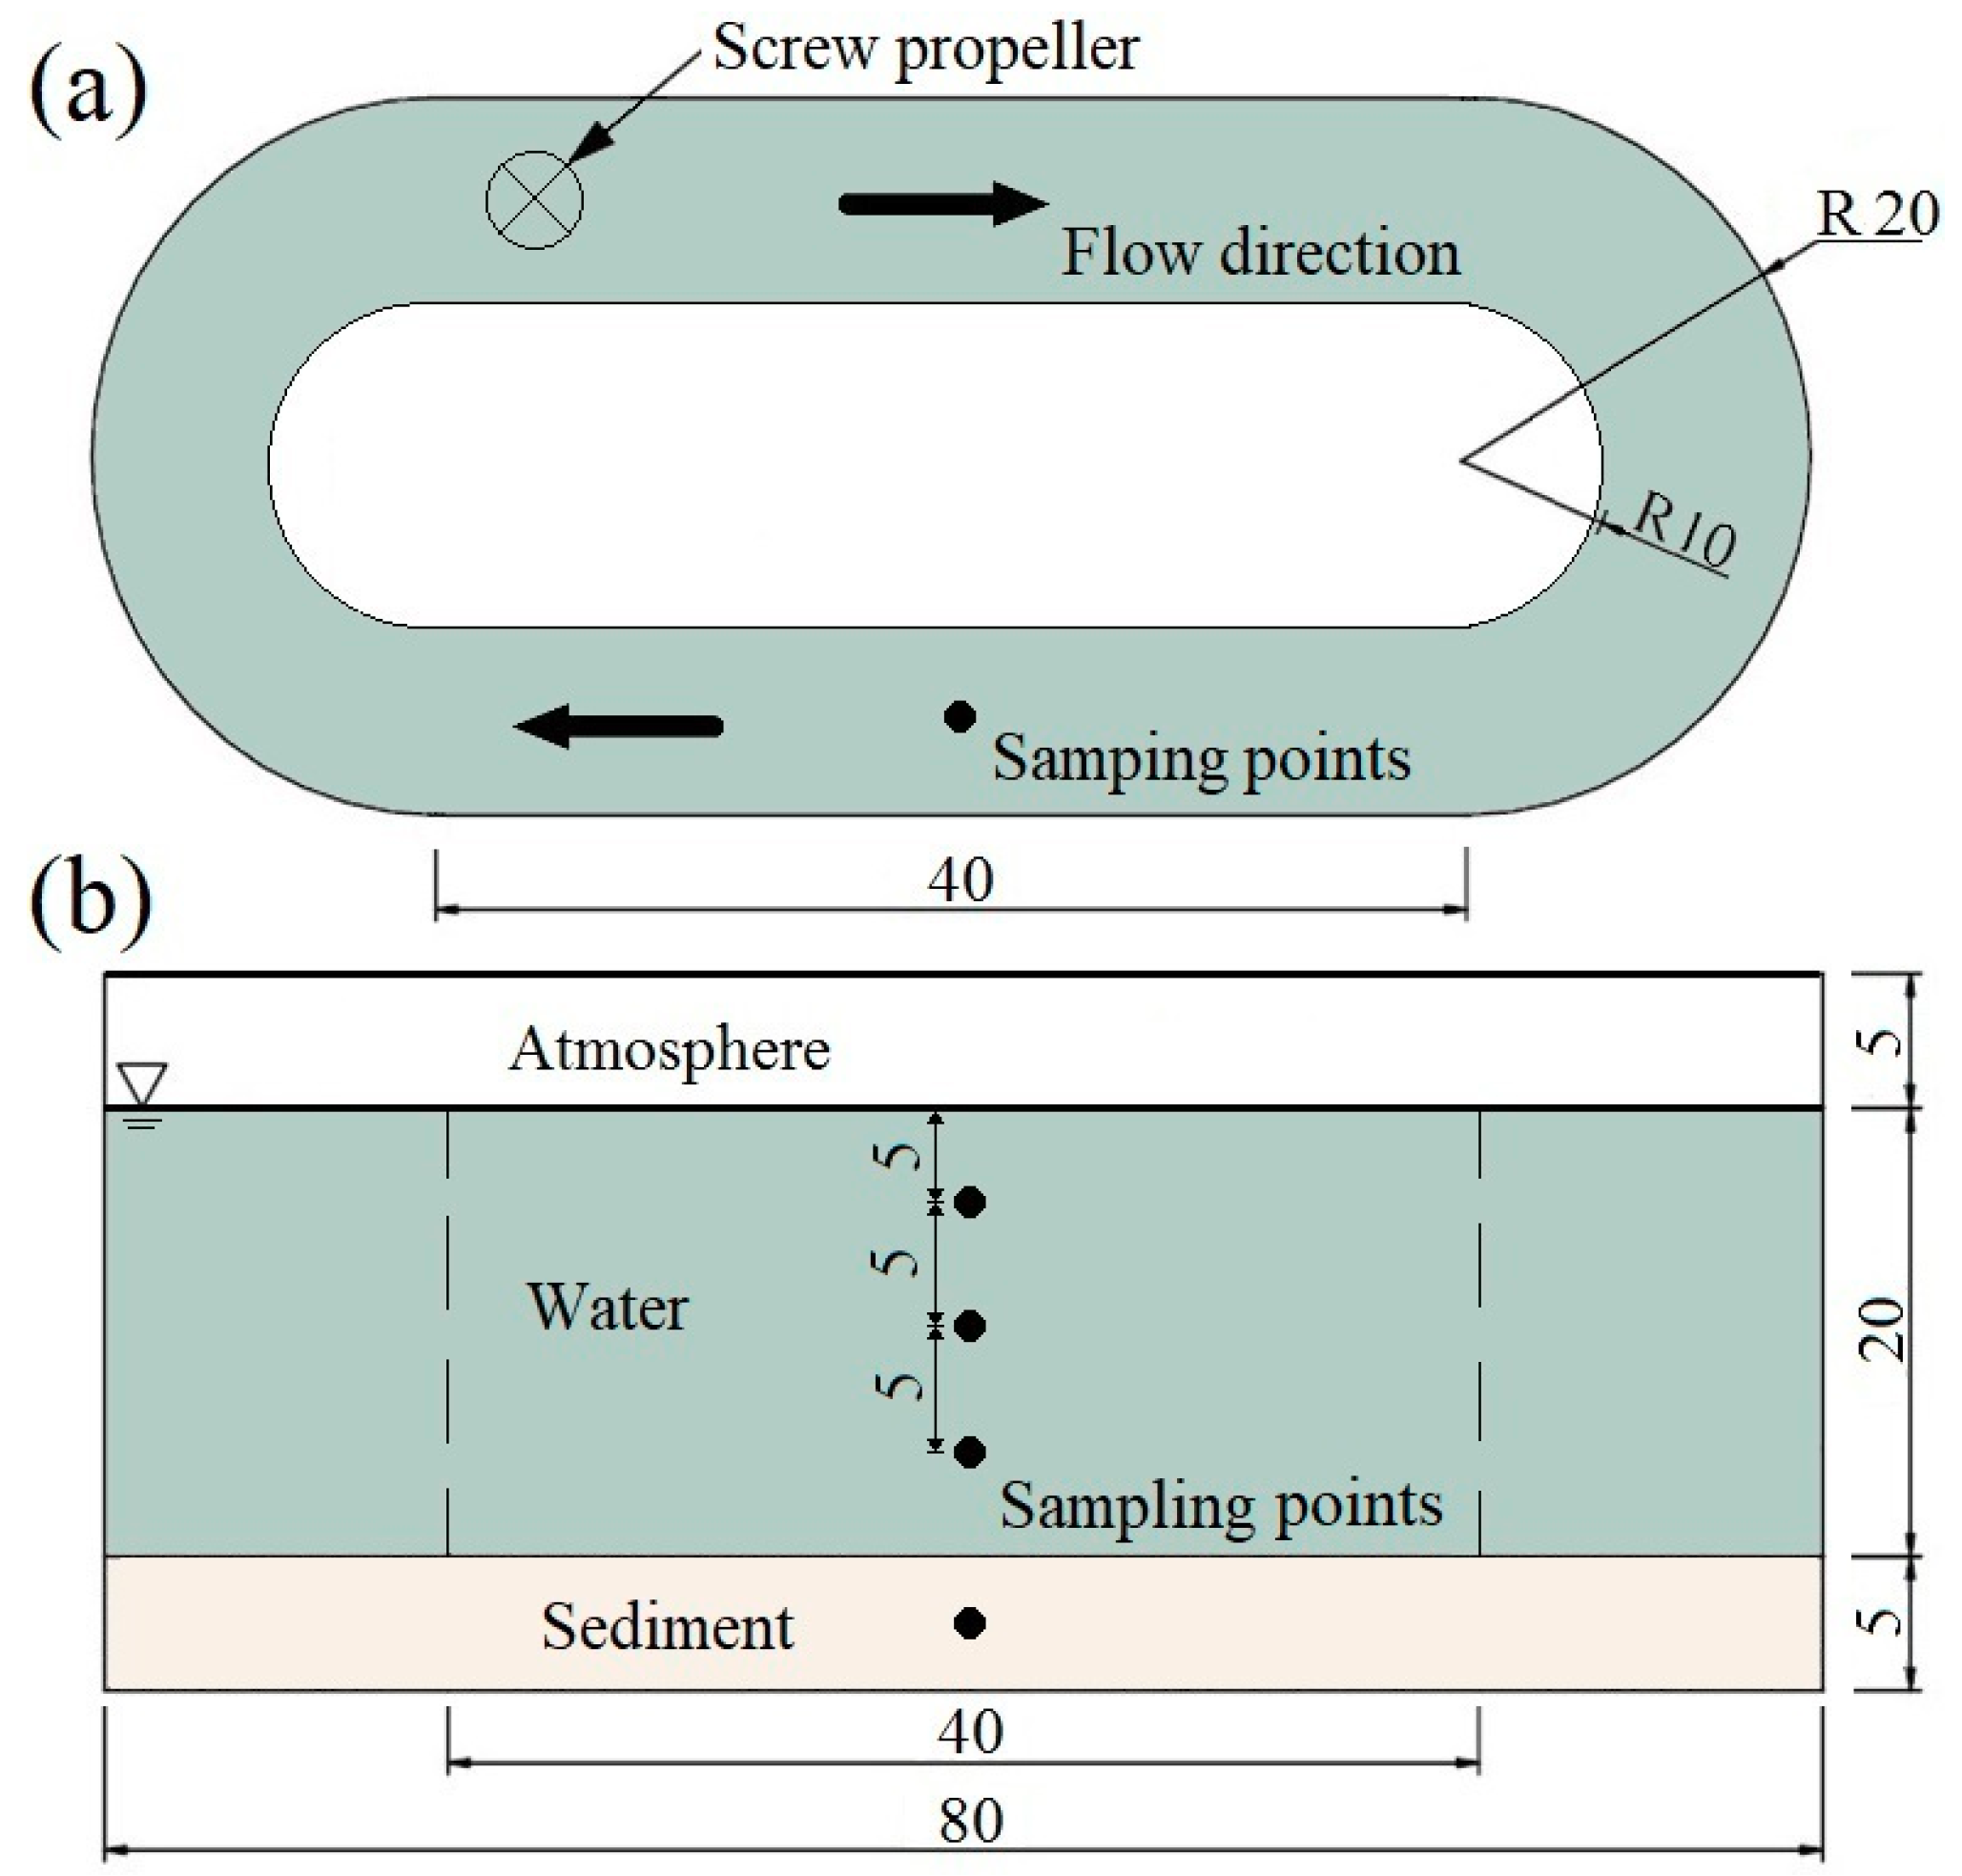
2.2. Experimental Facilities and Method
2.3. Sample Analysis
2.4. Multivariate Statistics
3. Results and Discussion
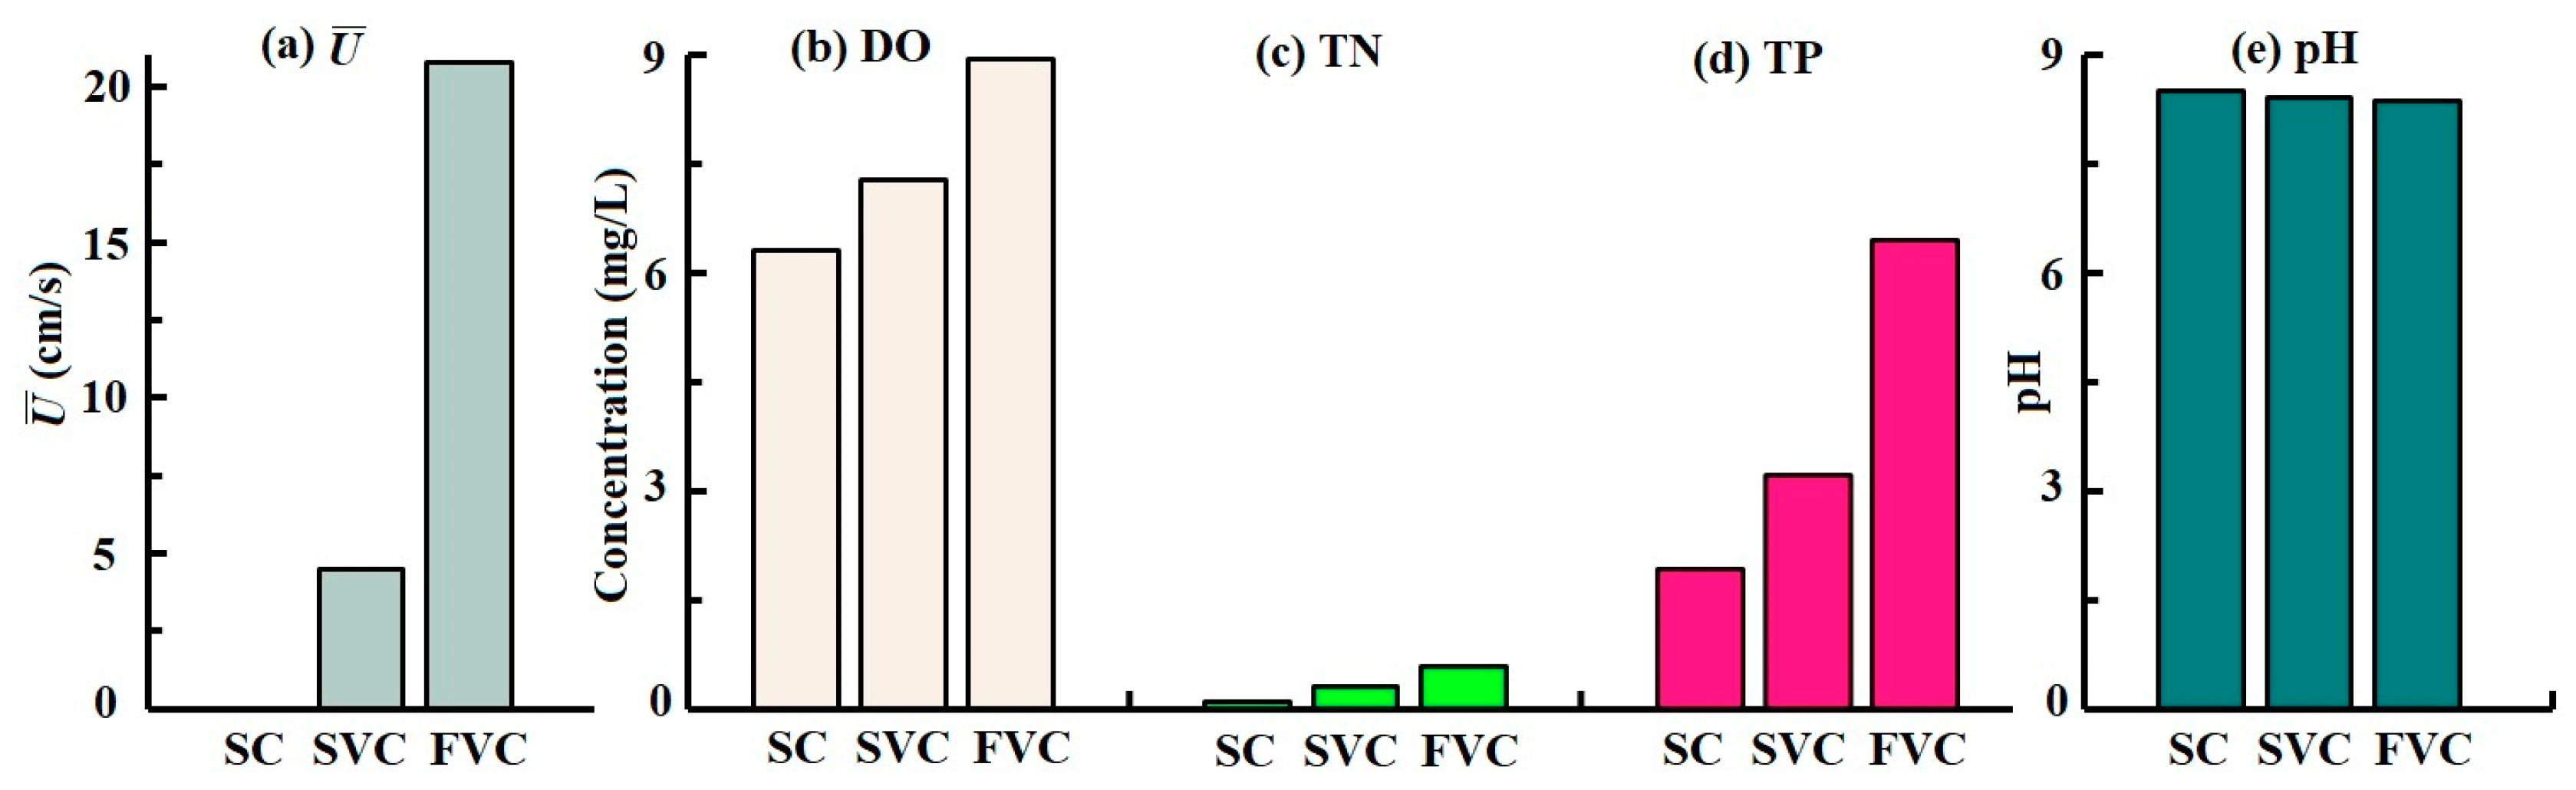
3.1. Physicochemical Properties in the Water-Sediment Systems
3.2. Diversity of Bacterial Communities
3.3. Composition Evolution of Bacterial Community
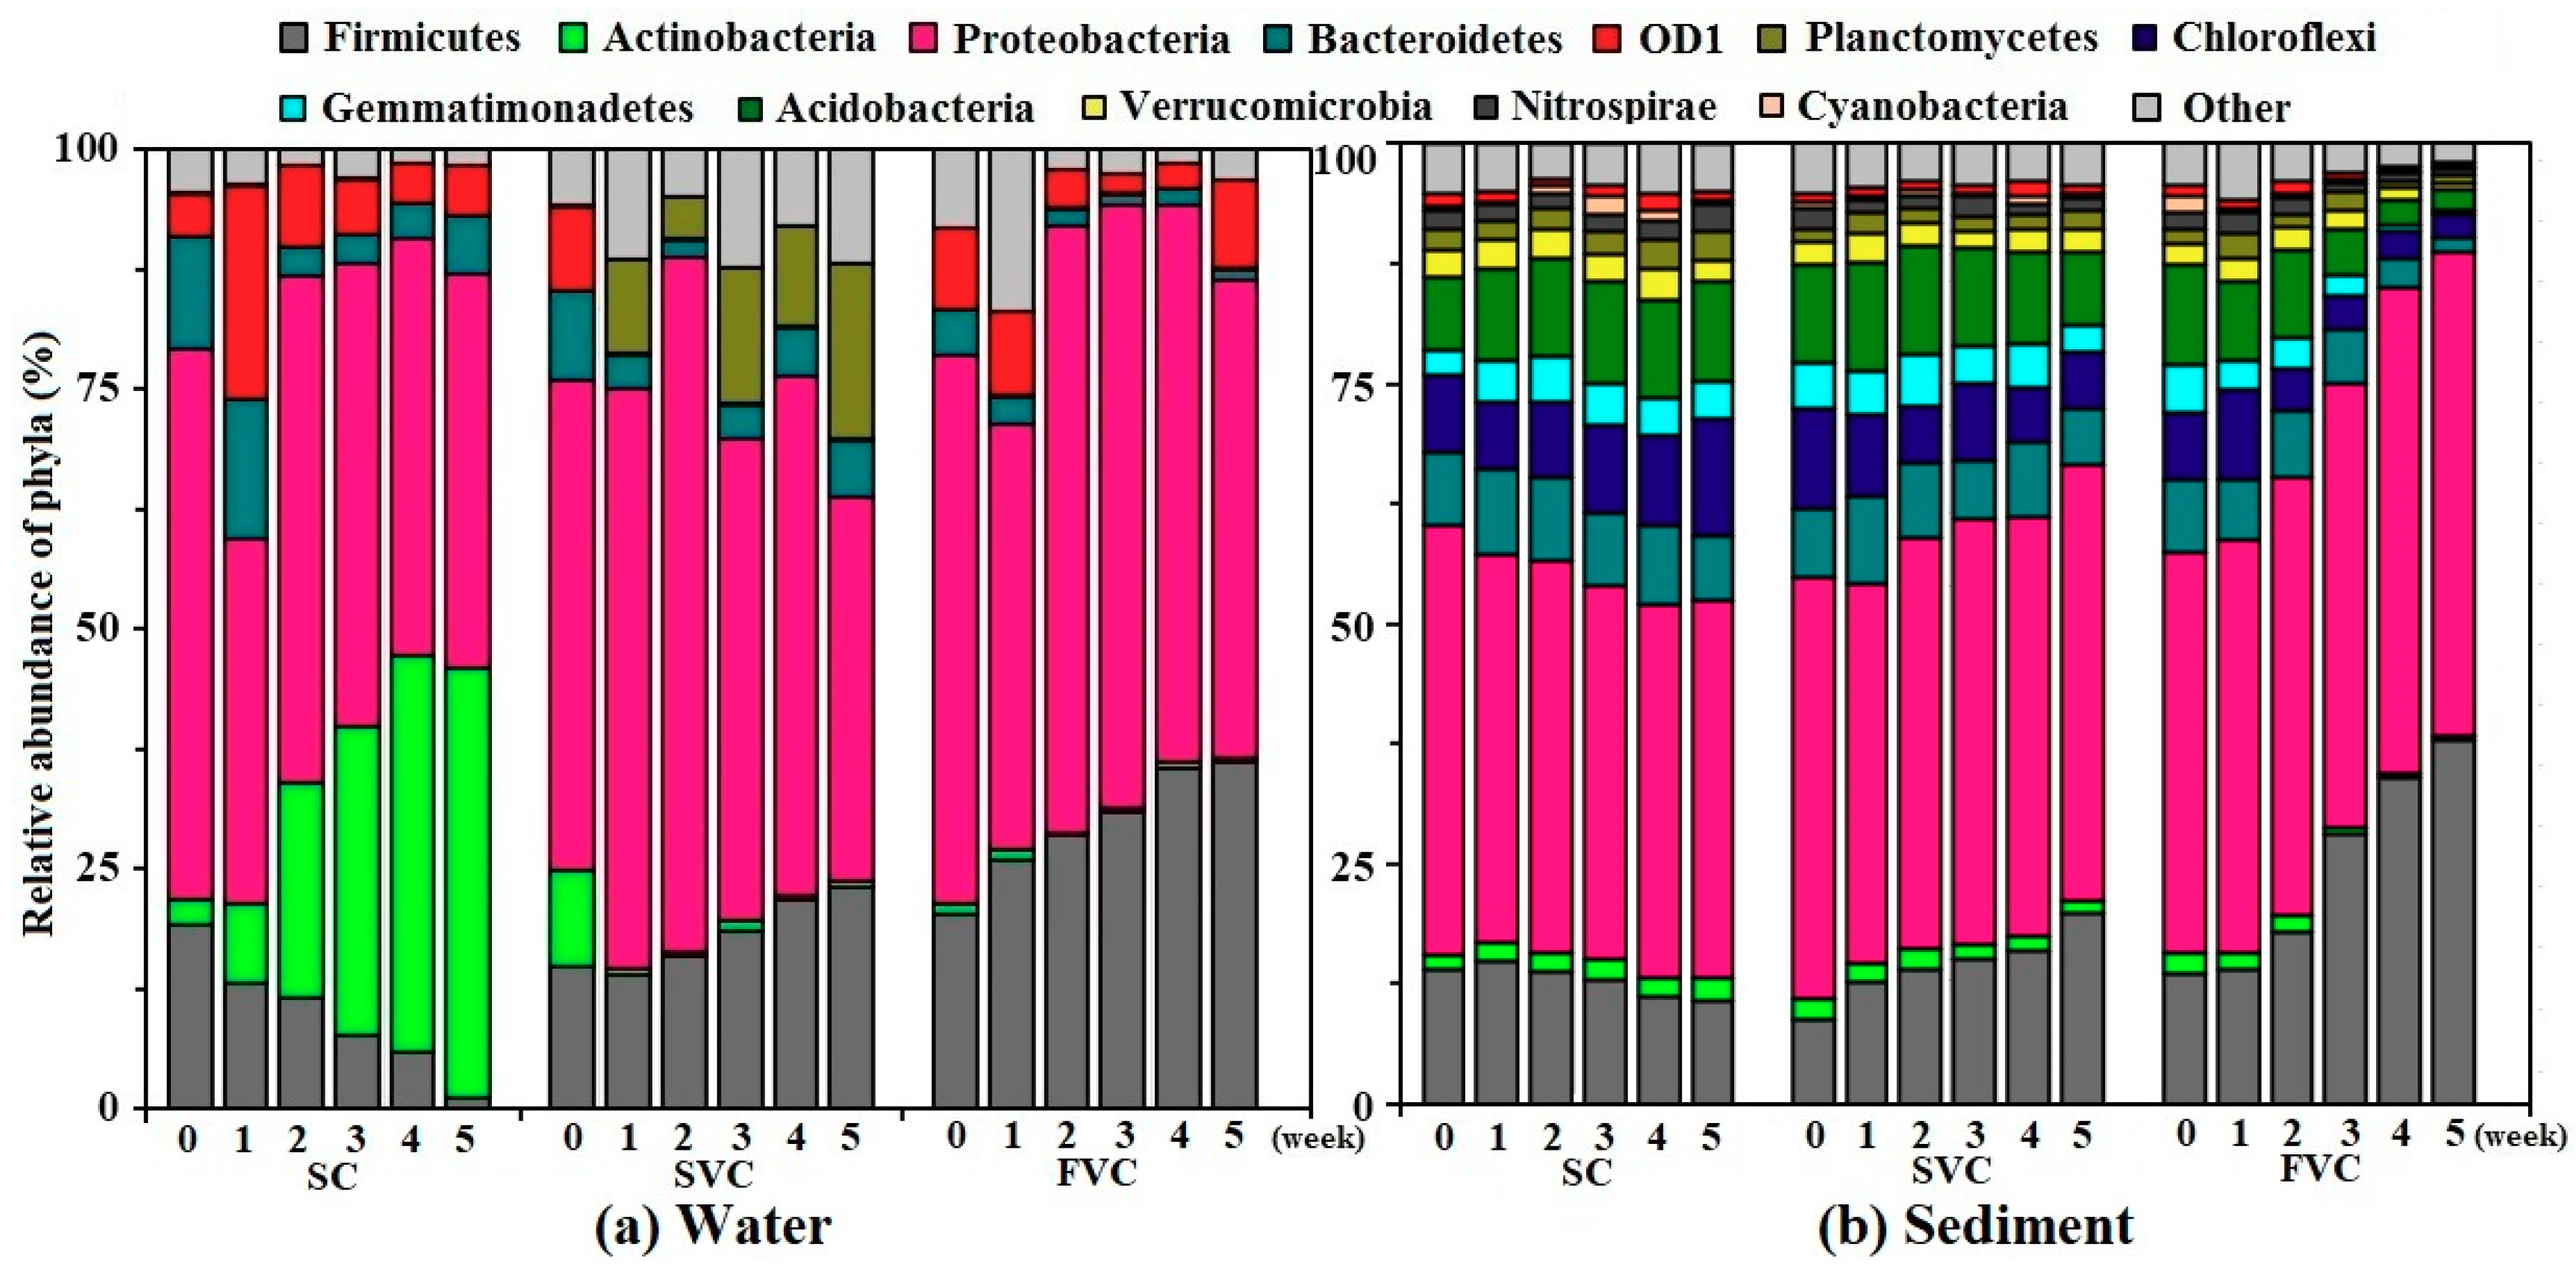
3.3.1. Phylum
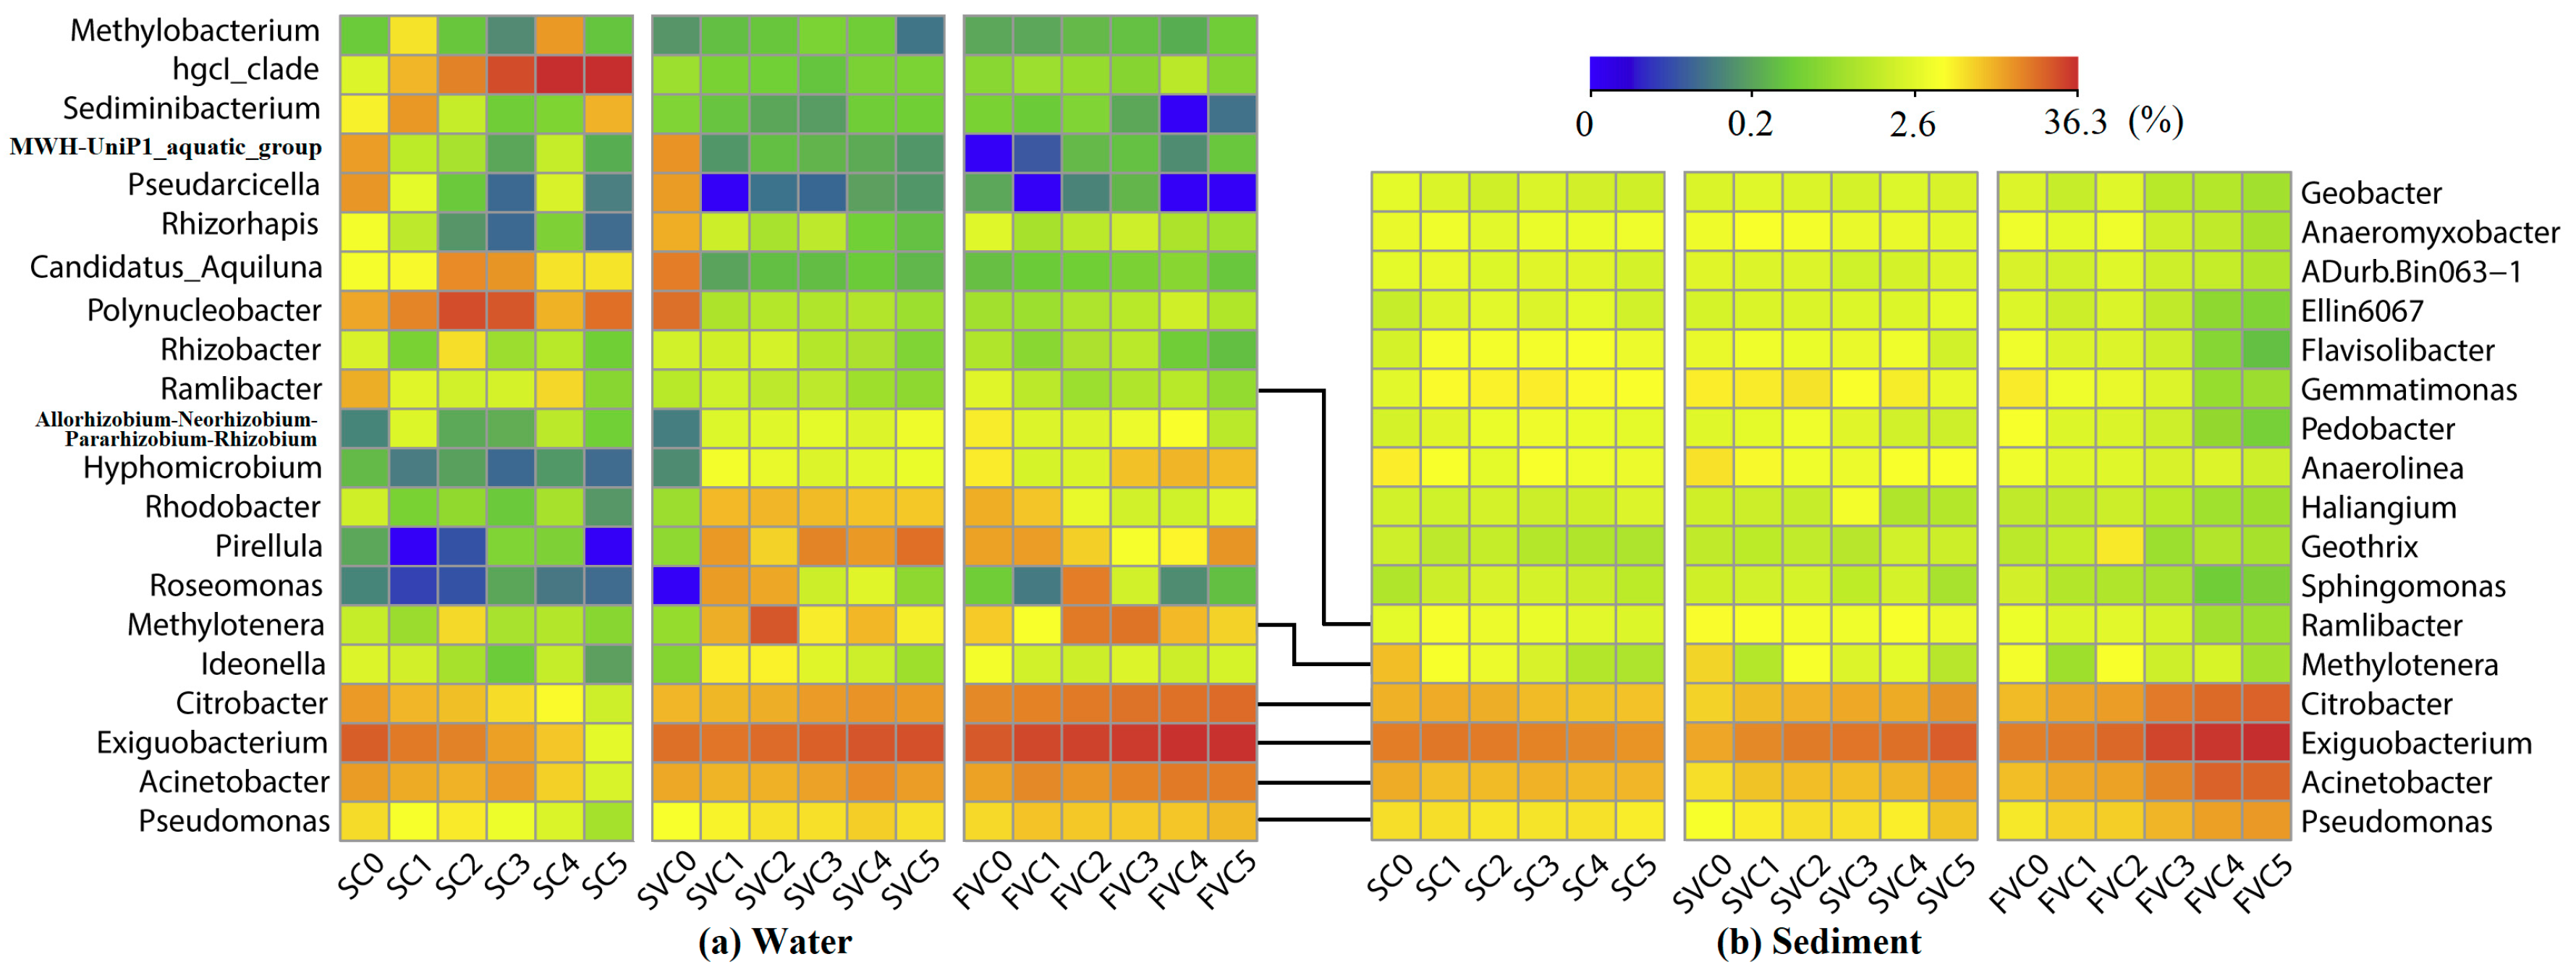
3.3.2. Genus
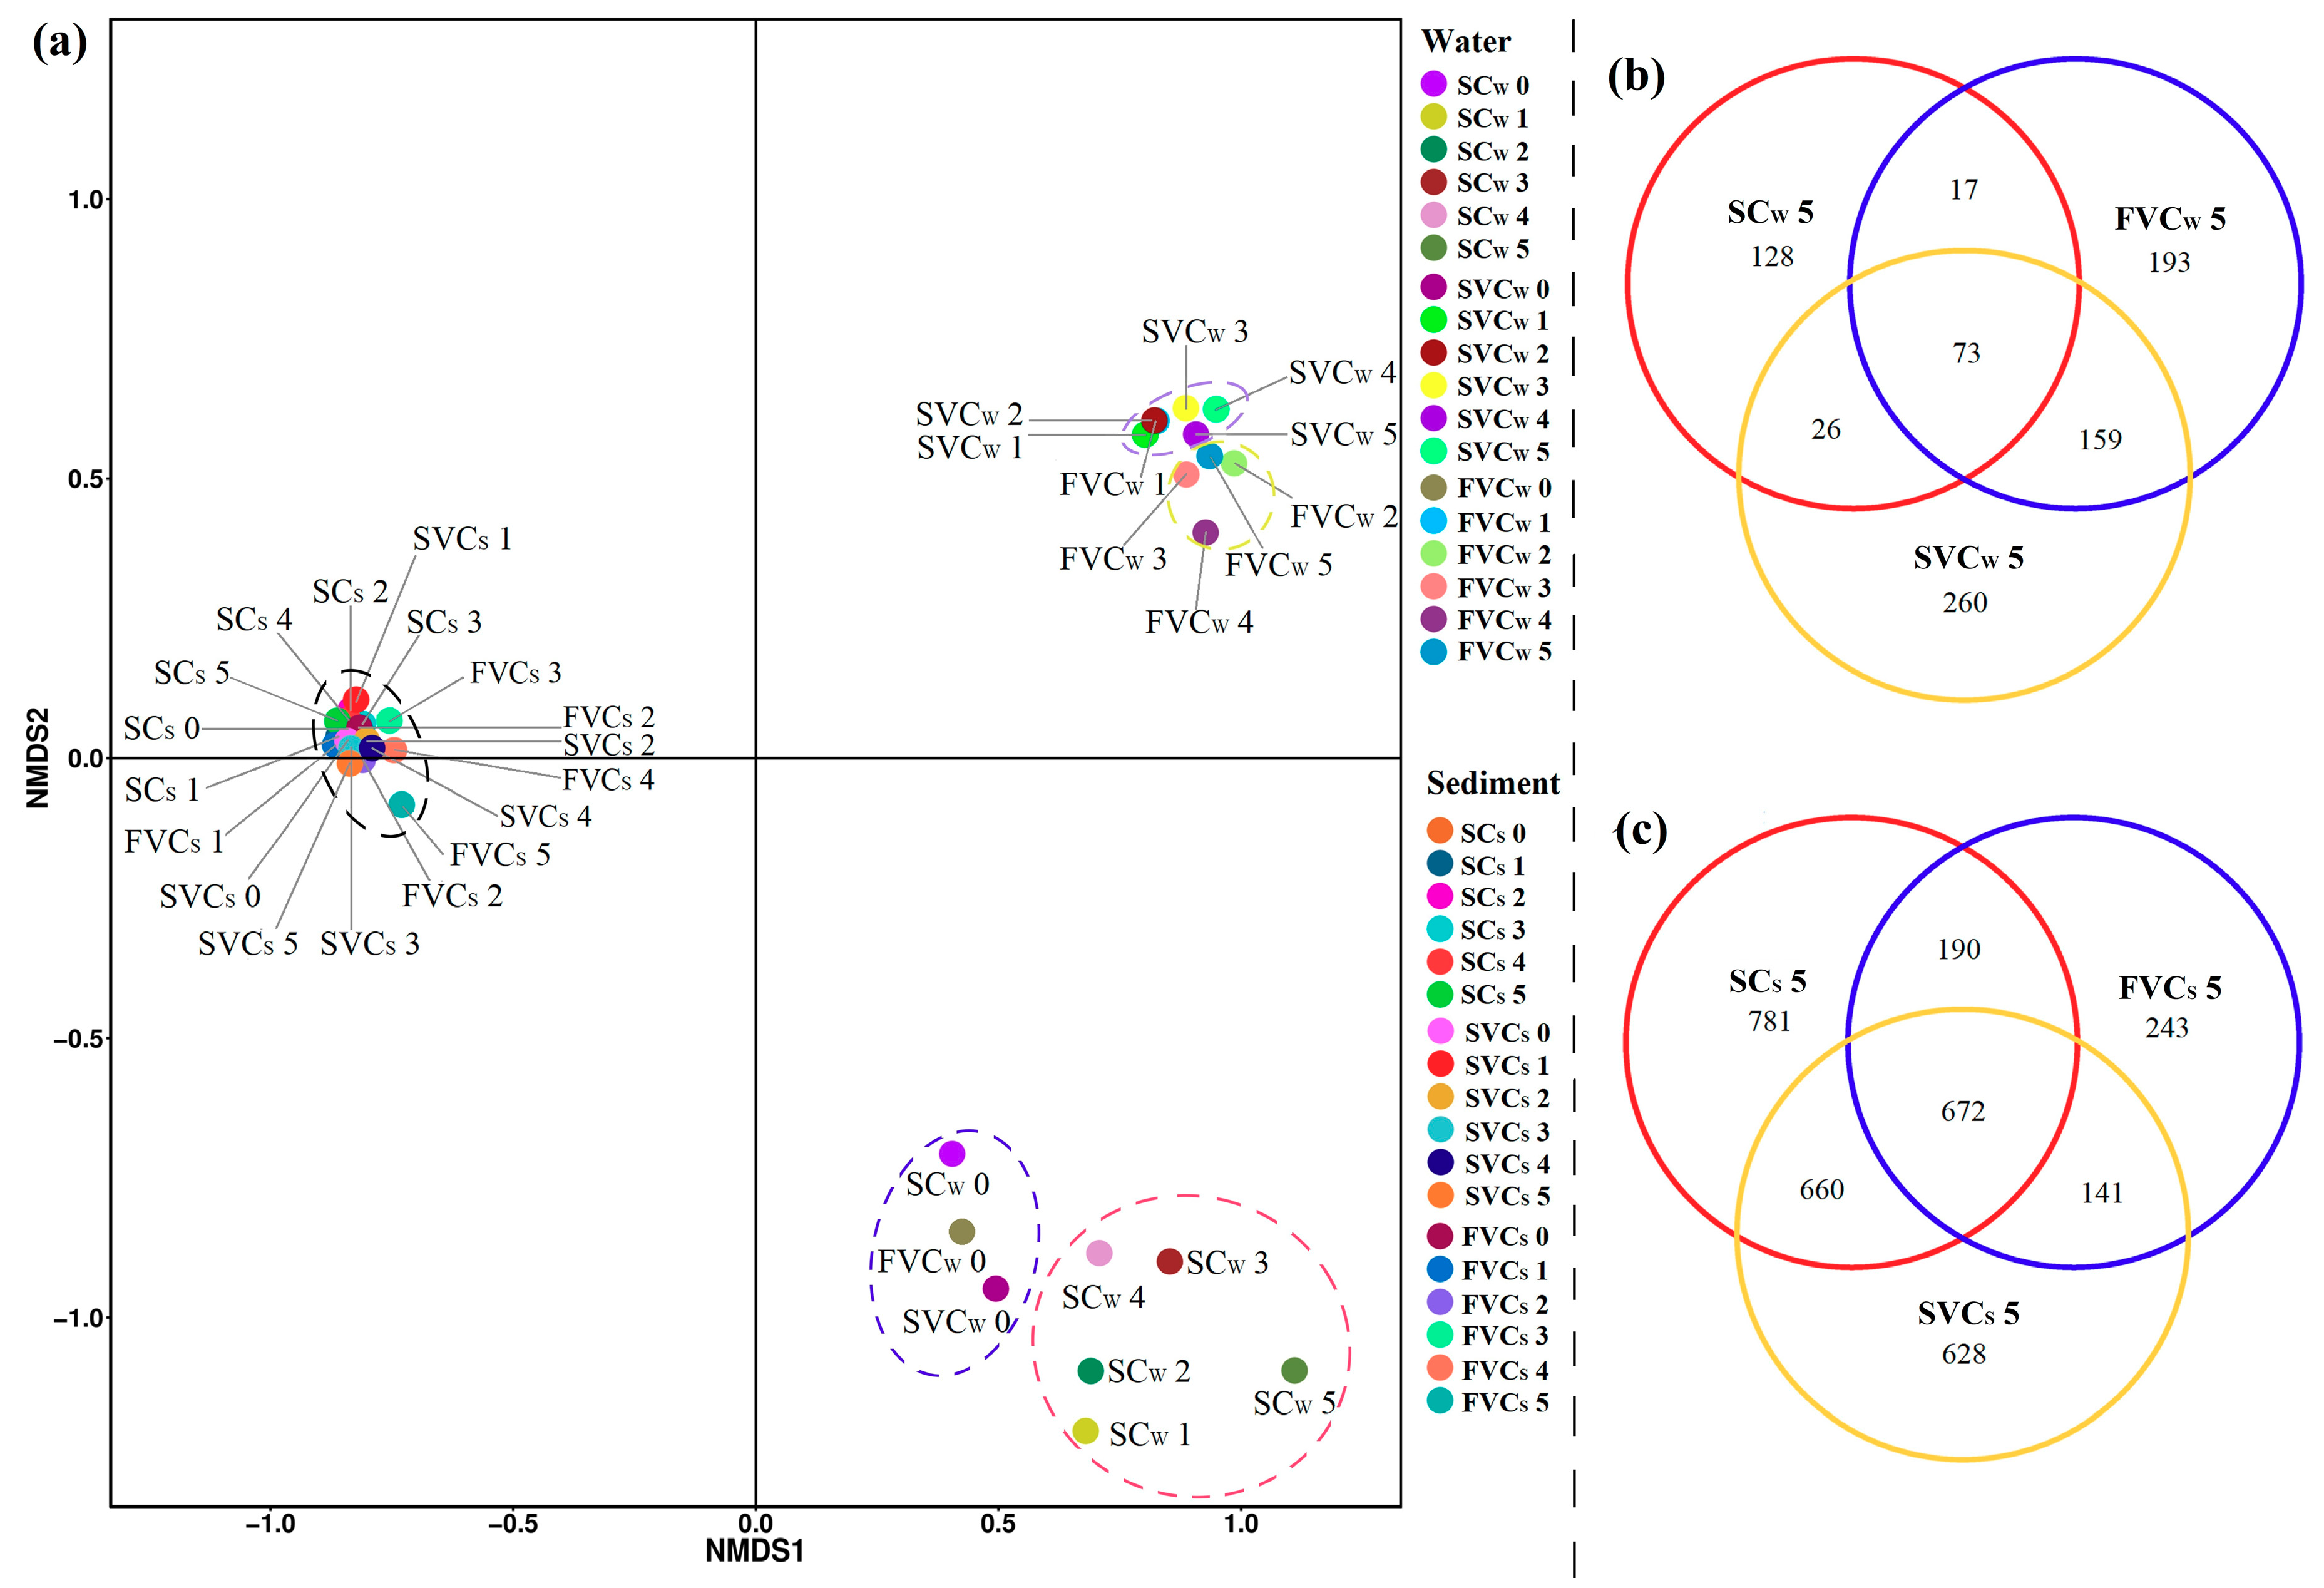
3.4. Spatial Distribution of Bacterial Communities
4. Conclusions
Supplementary Materials
Author Contributions
Funding
Conflicts of Interest
References
- Van der Gucht, K.; Cottenie, K.; Muylaert, K.; Vloemans, N.; Cousin, S.; Declerck, S.; Jeppesen, E.; Conde-Porcuna, J.M.; Schwenk, K.; Zwart, G.; et al. The power of species sorting: Local factors drive bacterial community composition over a wide range of spatial scales. Proc. Natl. Acad. Sci. USA 2007, 104, 20404–20409. [Google Scholar] [CrossRef] [PubMed] [Green Version]
- Battin, T.J.; Besemer, K.; Bengtsson, M.M.; Romani, A.M.; Packmann, A.I. The ecology and biogeochemistry of stream biofilms. Nat. Rev. Microbiol. 2016, 14, 251–263. [Google Scholar] [CrossRef] [PubMed] [Green Version]
- Wang, Q.; Wang, R.Q.; Tian, C.Y.; Yu, Y.; Zhang, Y.L.; Dai, J.L. Using microbial community functioning as the complementary environmental condition indicator: A case study of an iron deposit tailing area. Eur. J. Soil Biol. 2012, 51, 22–29. [Google Scholar] [CrossRef]
- Sims, A.; Zhang, Y.Y.; Galaraj, S.; Brown, P.B.; Hu, Z.Q. Toward the development of microbial indicators for wetland assessment. Water Res. 2013, 47, 1711–1725. [Google Scholar] [CrossRef] [PubMed]
- Qu, J.Q.; Jia, C.X.; Liu, Q.; Li, Z.; Liu, P.; Yang, M.; Zhao, M.; Li, W.T.; Zhu, H.; Zhang, Q.J. Dynamics of Bacterial Community Diversity and Structure in the Terminal Reservoir of the South-To-North Water Diversion Project in China. Water 2018, 10, 709. [Google Scholar] [CrossRef]
- Langenheder, S.; Lindstrom, E.S. Factors influencing aquatic and terrestrial bacterial community assembly. Environ. Microbiol. Rep. 2019, 11, 306–315. [Google Scholar] [CrossRef] [PubMed]
- Adams, H.E.; Crump, B.C.; Kling, G.W. Isolating the effects of storm events on arctic aquatic bacteria: Temperature, nutrients, and community composition as controls on bacterial productivity. Front. Microbiol. 2015, 6, 251. [Google Scholar] [CrossRef]
- Staley, C.; Gould, T.J.; Wang, P.; Phillips, J.; Cotner, J.B.; Sadowsky, M.J. Bacterial community structure is indicative of chemical inputs in the Upper Mississippi River. Front. Microbiol. 2014, 5, 524. [Google Scholar] [CrossRef]
- Liu, J.W.; Fu, B.B.; Yang, H.M.; Zhao, M.X.; He, B.Y.; Zhang, X.H. Phylogenetic shifts of bacterioplankton community composition along the Pearl Estuary: The potential impact of hypoxia and nutrients. Front. Microbiol. 2015, 6, 64. [Google Scholar] [CrossRef]
- Ibekwe, A.M.; Ma, J.C.; Murinda, S.E. Bacterial community composition and structure in an Urban River impacted by different pollutant sources. Sci. Total Environ. 2016, 566, 1176–1185. [Google Scholar] [CrossRef]
- Ruuskanen, M.O.; St Pierre, K.A.; St Louis, V.L.; Aris-Brosou, S.; Poulain, A.J. Physicochemical Drivers of Microbial Community Structure in Sediments of Lake Hazen, Nunavut, Canada. Front. Microbiol. 2018, 9, 1138. [Google Scholar] [CrossRef] [PubMed]
- Eggleton, J.; Thomas, K.V. A review of factors affecting the release and bioavailability of contaminants during sediment disturbance events. Environ. Int. 2004, 30, 973–980. [Google Scholar] [CrossRef] [PubMed]
- Cheng, H.M.; Hua, Z.L. Distribution, release and removal behaviors of tetrabromobisphenol A in water-sediment systems under prolonged hydrodynamic disturbances. Sci. Total Environ. 2018, 636, 402–410. [Google Scholar] [CrossRef] [PubMed]
- Cheng, H.M.; Hua, Z.L. Effects of hydrodynamic disturbances and resuspension characteristics on the release of tetrabromobisphenol A from sediment. Environ. Pollut. 2016, 219, 785–793. [Google Scholar] [CrossRef]
- Pascolo, S.; Petti, M.; Bosa, S. On the Wave Bottom Shear Stress in Shallow Depths: The Role of Wave Period and Bed Roughness. Water 2018, 10, 1348. [Google Scholar] [CrossRef]
- Li, Y.; Wang, C.; Zhang, W.L.; Wang, P.F.; Niu, L.H.; Hou, J.; Wang, J.; Wang, L.Q. Modeling the Effects of Hydrodynamic Regimes on Microbial Communities within Fluvial Biofilms: Combining Deterministic and Stochastic Processes. Environ. Sci. Technol. 2015, 49, 12869–12878. [Google Scholar] [CrossRef]
- Santos, L.; Cunha, A.; Silva, H.; Cacador, I.; Dias, J.M.; Almeida, A. Influence of salt marsh on bacterial activity in two estuaries with different hydrodynamic characteristics (Ria de Aveiro and Tagus Estuary). FEMS Microbiol. Ecol. 2007, 60, 429–441. [Google Scholar] [CrossRef]
- Rochex, A.; Godon, J.J.; Bernet, N.; Escudie, R. Role of shear stress on composition, diversity and dynamics of biofilm bacterial communities. Water Res. 2008, 42, 4915–4922. [Google Scholar] [CrossRef]
- Besemer, K.; Singer, G.; Hodl, I.; Battin, T.J. Bacterial community composition of stream biofilms in spatially variable-flow environments. Appl. Environ. Microbiol. 2009, 75, 7189–7195. [Google Scholar] [CrossRef]
- Chen, X.; Yang, X.D.; Dong, X.H.; Liu, E.F. Environmental changes in Chaohu Lake (southeast, China) since the mid 20th century: The interactive impacts of nutrients, hydrology and climate. Limnologica 2013, 43, 10–17. [Google Scholar] [CrossRef]
- Duan, H.T.; Tao, M.; Loiselle, S.A.; Zhao, W.; Cao, Z.G.; Ma, R.H.; Tang, X.X. MODIS observations of cyanobacterial risks in a eutrophic lake: Implications for long-term safety evaluation in drinking-water source. Water Res. 2017, 122, 455–470. [Google Scholar] [CrossRef] [PubMed]
- Huang, J.C.; Zhang, Y.J.; Huang, Q.; Gao, J.F. When and where to reduce nutrient for controlling harmful algal blooms in large eutrophic lake Chaohu, China? Ecol. Indic. 2018, 89, 808–817. [Google Scholar] [CrossRef]
- Qin, B.Q.; Hu, W.P.; Gao, G.; Luo, L.C.; Zhang, J.S. Dynamics of sediment resuspension and the conceptual schema of nutrient release in the large shallow Lake Taihu, China. Chin. Sci. Bull. 2004, 49, 54–64. [Google Scholar] [CrossRef]
- Tsertova, N.; Kisand, A.; Baty, F.; Kisand, V. Homogeneous microbial diversity in the upper sediment layers of a shallow lake. Aquat. Microb. Ecol. 2013, 70, 77–85. [Google Scholar] [CrossRef] [Green Version]
- Hua, Z.L.; Tang, Z.Q.; Bai, X.; Zhang, J.A.; Yu, L.; Cheng, H.M. Aggregation and resuspension of graphene oxide in simulated natural surface aquatic environments. Environ. Pollut. 2015, 205, 161–169. [Google Scholar] [CrossRef] [PubMed]
- Cheng, H.M.; Hua, Z.L.; Wang, L.; Wang, Y.L.; Xie, Z.X.; Zhu, T.Y. Relative effects of wind-induced disturbances and vegetation on tetrabromobisphenol A cycling in shallow lakes: Direct and indirect effects. Environ. Pollut. 2019, 252, 794–803. [Google Scholar] [CrossRef] [PubMed]
- Pinto, A.J.; Xi, C.W.; Raskin, L. Bacterial Community Structure in the Drinking Water Microbiome Is Governed by Filtration Processes. Environ. Sci. Technol. 2012, 46, 8851–8859. [Google Scholar] [CrossRef] [PubMed]
- Li, Y.; Zhang, J.J.; Zhang, J.Q.; Xu, W.L.; Mou, Z.S. Microbial Community Structure in the Sediments and Its Relation to Environmental Factors in Eutrophicated Sancha Lake. Int. J. Environ. Res. Public Health 2019, 16, 1931. [Google Scholar] [CrossRef]
- Bates, S.T.; Berg-Lyons, D.; Caporaso, J.G.; Walters, W.A.; Knight, R.; Fierer, N. Examining the global distribution of dominant archaeal populations in soil. ISME J. 2011, 5, 908–917. [Google Scholar] [CrossRef]
- Febria, C.M.; Beddoes, P.; Fulthorpe, R.R.; Williams, D.D. Bacterial community dynamics in the hyporheic zone of an intermittent stream. ISME J. 2012, 6, 1078–1088. [Google Scholar] [CrossRef]
- Oksanen, J.; Blanchet, F.G.; Friendly, M.; Kindt, R.; Legendre, P.; McGlinn, D.; Minchin, P.R.; O’Hara, R.B.; Simpson, G.L.; Solymos, P.; et al. Package “Vegan“. Community Ecol. Package Version 2.5-6. 2019. Available online: https://cran.r-project.org/package=vegan (accessed on 1 September 2019).
- R Development Core Team. R: A Language and Environment for Statistical Computing; R Foundation for Statistical Computing: Vienna, Austria, 2016. [Google Scholar]
- Oliveros, J.C. Venny an Interactive Tool for Comparing Lists with Venn Diagrams. Available online: http://bioinfogp.cnb.csic.es/tools/venny/index.html (accessed on 1 September 2019).
- Raboni, M.; Gavasci, R.; Viotti, P. Influence of denitrification reactor retention time distribution (RTD) on dissolved oxygen control and nitrogen removal efficiency. Water Sci. Technol. 2015, 72, 45–51. [Google Scholar] [CrossRef] [PubMed]
- Poindexter, C.M.; Variano, E.A. Gas exchange in wetlands with emergent vegetation: The effects of wind and thermal convection at the air-water interface. J. Geophys. Res. Biogeosciences 2013, 118, 1297–1306. [Google Scholar] [CrossRef]
- Roberts, D.A. Causes and ecological effects of resuspended contaminated sediments (RCS) in marine environments. Environ. Int. 2012, 40, 230–243. [Google Scholar] [CrossRef] [PubMed]
- Zhu, L.; Li, X.; Zhang, C.; Duan, Z.Q. Pollutants’ Release, Redistribution and Remediation of Black Smelly River Sediment Based on Re-Suspension and Deep Aeration of Sediment. Int. J. Environ. Res. Public Health 2017, 14, 374. [Google Scholar] [CrossRef] [PubMed]
- Wu, D.; Hua, Z.L. The effect of vegetation on sediment resuspension and phosphorus release under hydrodynamic disturbance in shallow lakes. Ecol. Eng. 2014, 69, 55–62. [Google Scholar] [CrossRef]
- Gremare, A.; Amouroux, J.M.; Cauwet, G.; Charles, F.; Courties, C.; De Bovee, F.; Dinet, A.; Devenon, J.L.; De Madron, X.D.; Ferre, B.; et al. The effects of a strong winter storm on physical and biological variables at a shelf site in the Mediterranean. Oceanol. Acta 2003, 26, 407–419. [Google Scholar] [CrossRef] [Green Version]
- Luo, X.; Xiang, X.Y.; Huang, G.Y.; Song, X.R.; Wang, P.J.; Fu, K.D. Bacterial Abundance and Physicochemical Characteristics of Water and Sediment Associated with Hydroelectric Dam on the Lancang River China. Int. J. Environ. Res. Public Health 2019, 16, 2031. [Google Scholar] [CrossRef] [PubMed]
- Santos, L.; Santos, A.L.; Coelho, F.J.R.C.; Gomes, N.C.M.; Dias, J.M.; Cunha, A.; Almeida, A. Relation between bacterial activity in the surface microlayer and estuarine hydrodynamics. FEMS Microbiol. Ecol. 2011, 77, 636–646. [Google Scholar] [CrossRef] [PubMed] [Green Version]
- Battin, T.J.; Sloan, W.T.; Kjelleberg, S.; Daims, H.; Head, I.M.; Curtis, T.P.; Eberl, L. Microbial landscapes: New paths to biofilm research. Nat. Rev. Microbiol. 2007, 5, 76–81. [Google Scholar] [CrossRef]
- Crump, B.C.; Amaral-Zettler, L.A.; Kling, G.W. Microbial diversity in arctic freshwaters is structured by inoculation of microbes from soils. ISME J. 2012, 6, 1629–1639. [Google Scholar] [CrossRef]
- De Wever, A.; Muylaert, K.; Van der Gucht, K.; Pirlot, S.; Cocquyt, C.; Descy, J.P.; Plisnier, P.D.; Vyverman, W. Bacterial community composition in Lake Tanganyika: Vertical and horizontal heterogeneity. Appl. Environ. Microbiol. 2005, 71, 5029–5037. [Google Scholar] [CrossRef] [PubMed]
- Kaevska, M.; Videnska, P.; Sedlar, K.; Slana, I. Seasonal changes in microbial community composition in river water studied using 454-pyrosequencing. SpringerPlus 2016, 5, 409. [Google Scholar] [CrossRef] [PubMed]
- Xie, Y.W.; Wang, J.Z.; Wu, Y.; Ren, C.; Song, C.; Yang, J.H.; Yu, H.X.; Giesy, J.P.; Zhang, X.W. Using in situ bacterial communities to monitor contaminants in river sediments. Environ. Pollut. 2016, 212, 348–357. [Google Scholar] [CrossRef] [PubMed]
- Fan, Y.Y.; Li, B.B.; Yang, Z.C.; Cheng, Y.Y.; Liu, D.F.; Yu, H.Q. Mediation of functional gene and bacterial community profiles in the sediments of eutrophic Chaohu Lake by total nitrogen and season. Environ. Pollut. 2019, 250, 233–240. [Google Scholar] [CrossRef]
- Sahinkaya, E.; Kilic, A.; Calimlioglu, B.; Toker, Y. Simultaneous bioreduction of nitrate and chromate using sulfur-based mixotrophic denitrification process. J. Hazard. Mater. 2013, 262, 234–239. [Google Scholar] [CrossRef] [PubMed]
- Zhou, S.L.; Zhang, Y.R.; Huang, T.L.; Liu, Y.F.; Fang, K.K.; Zhang, C.H. Microbial aerobic denitrification dominates nitrogen losses from reservoir ecosystem in the spring of Zhoucun reservoir. Sci. Total Environ. 2019, 65, 998–1010. [Google Scholar] [CrossRef]
- Wu, Y.F.; Lin, H.; Yin, W.Z.; Shao, S.C.; Lv, S.H.; Hu, Y.Y. Water Quality and Microbial Community Changes in an Urban River after Micro-Nano Bubble Technology in Situ Treatment. Water 2019, 11, 66. [Google Scholar] [CrossRef]
- Jung, J.; Park, W. Acinetobacter species as model microorganisms in environmental microbiology: Current state and perspectives. Appl. Microbiol. Biotechnol. 2015, 99, 2533–2548. [Google Scholar] [CrossRef]
- Keshri, J.; Ram, A.S.P.; Sime-Ngando, T. Distinctive Patterns in the Taxonomical Resolution of Bacterioplankton in the Sediment and Pore Waters of Contrasted Freshwater Lakes. Microb. Ecol. 2018, 75, 662–673. [Google Scholar] [CrossRef]
- Aguilar, P.; Dorador, C.; Vila, I.; Sommaruga, R. Bacterioplankton composition in tropical high-elevation lakes of the Andean plateau. FEMS Microbiol. Ecol. 2018, 94, fiy004. [Google Scholar] [CrossRef]
- Abia, A.L.K.; James, C.; Ubomba-Jaswa, E.; Momba, M.N.B. Microbial Remobilisation on Riverbed Sediment Disturbance in Experimental Flumes and a Human-Impacted River: Implication for Water Resource Management and Public Health in Developing Sub-Saharan African Countries. Int. J. Environ. Res. Public Health 2017, 14, 306. [Google Scholar] [CrossRef] [PubMed]


© 2019 by the authors. Licensee MDPI, Basel, Switzerland. This article is an open access article distributed under the terms and conditions of the Creative Commons Attribution (CC BY) license (http://creativecommons.org/licenses/by/4.0/).
Share and Cite
Cheng, H.; Cheng, L.; Wang, L.; Zhu, T.; Cai, W.; Hua, Z.; Wang, Y.; Wang, W. Changes of Bacterial Communities in Response to Prolonged Hydrodynamic Disturbances in the Eutrophic Water-Sediment Systems. Int. J. Environ. Res. Public Health 2019, 16, 3868. https://0-doi-org.brum.beds.ac.uk/10.3390/ijerph16203868
Cheng H, Cheng L, Wang L, Zhu T, Cai W, Hua Z, Wang Y, Wang W. Changes of Bacterial Communities in Response to Prolonged Hydrodynamic Disturbances in the Eutrophic Water-Sediment Systems. International Journal of Environmental Research and Public Health. 2019; 16(20):3868. https://0-doi-org.brum.beds.ac.uk/10.3390/ijerph16203868
Chicago/Turabian StyleCheng, Haomiao, Ling Cheng, Liang Wang, Tengyi Zhu, Wei Cai, Zulin Hua, Yulin Wang, and Wenfen Wang. 2019. "Changes of Bacterial Communities in Response to Prolonged Hydrodynamic Disturbances in the Eutrophic Water-Sediment Systems" International Journal of Environmental Research and Public Health 16, no. 20: 3868. https://0-doi-org.brum.beds.ac.uk/10.3390/ijerph16203868