Climate-Driven Adaptation, Household Capital, and Nutritional Outcomes among Farmers in Eswatini


Abstract
:1. Introduction
2. Materials and Methods
2.1. Study Design
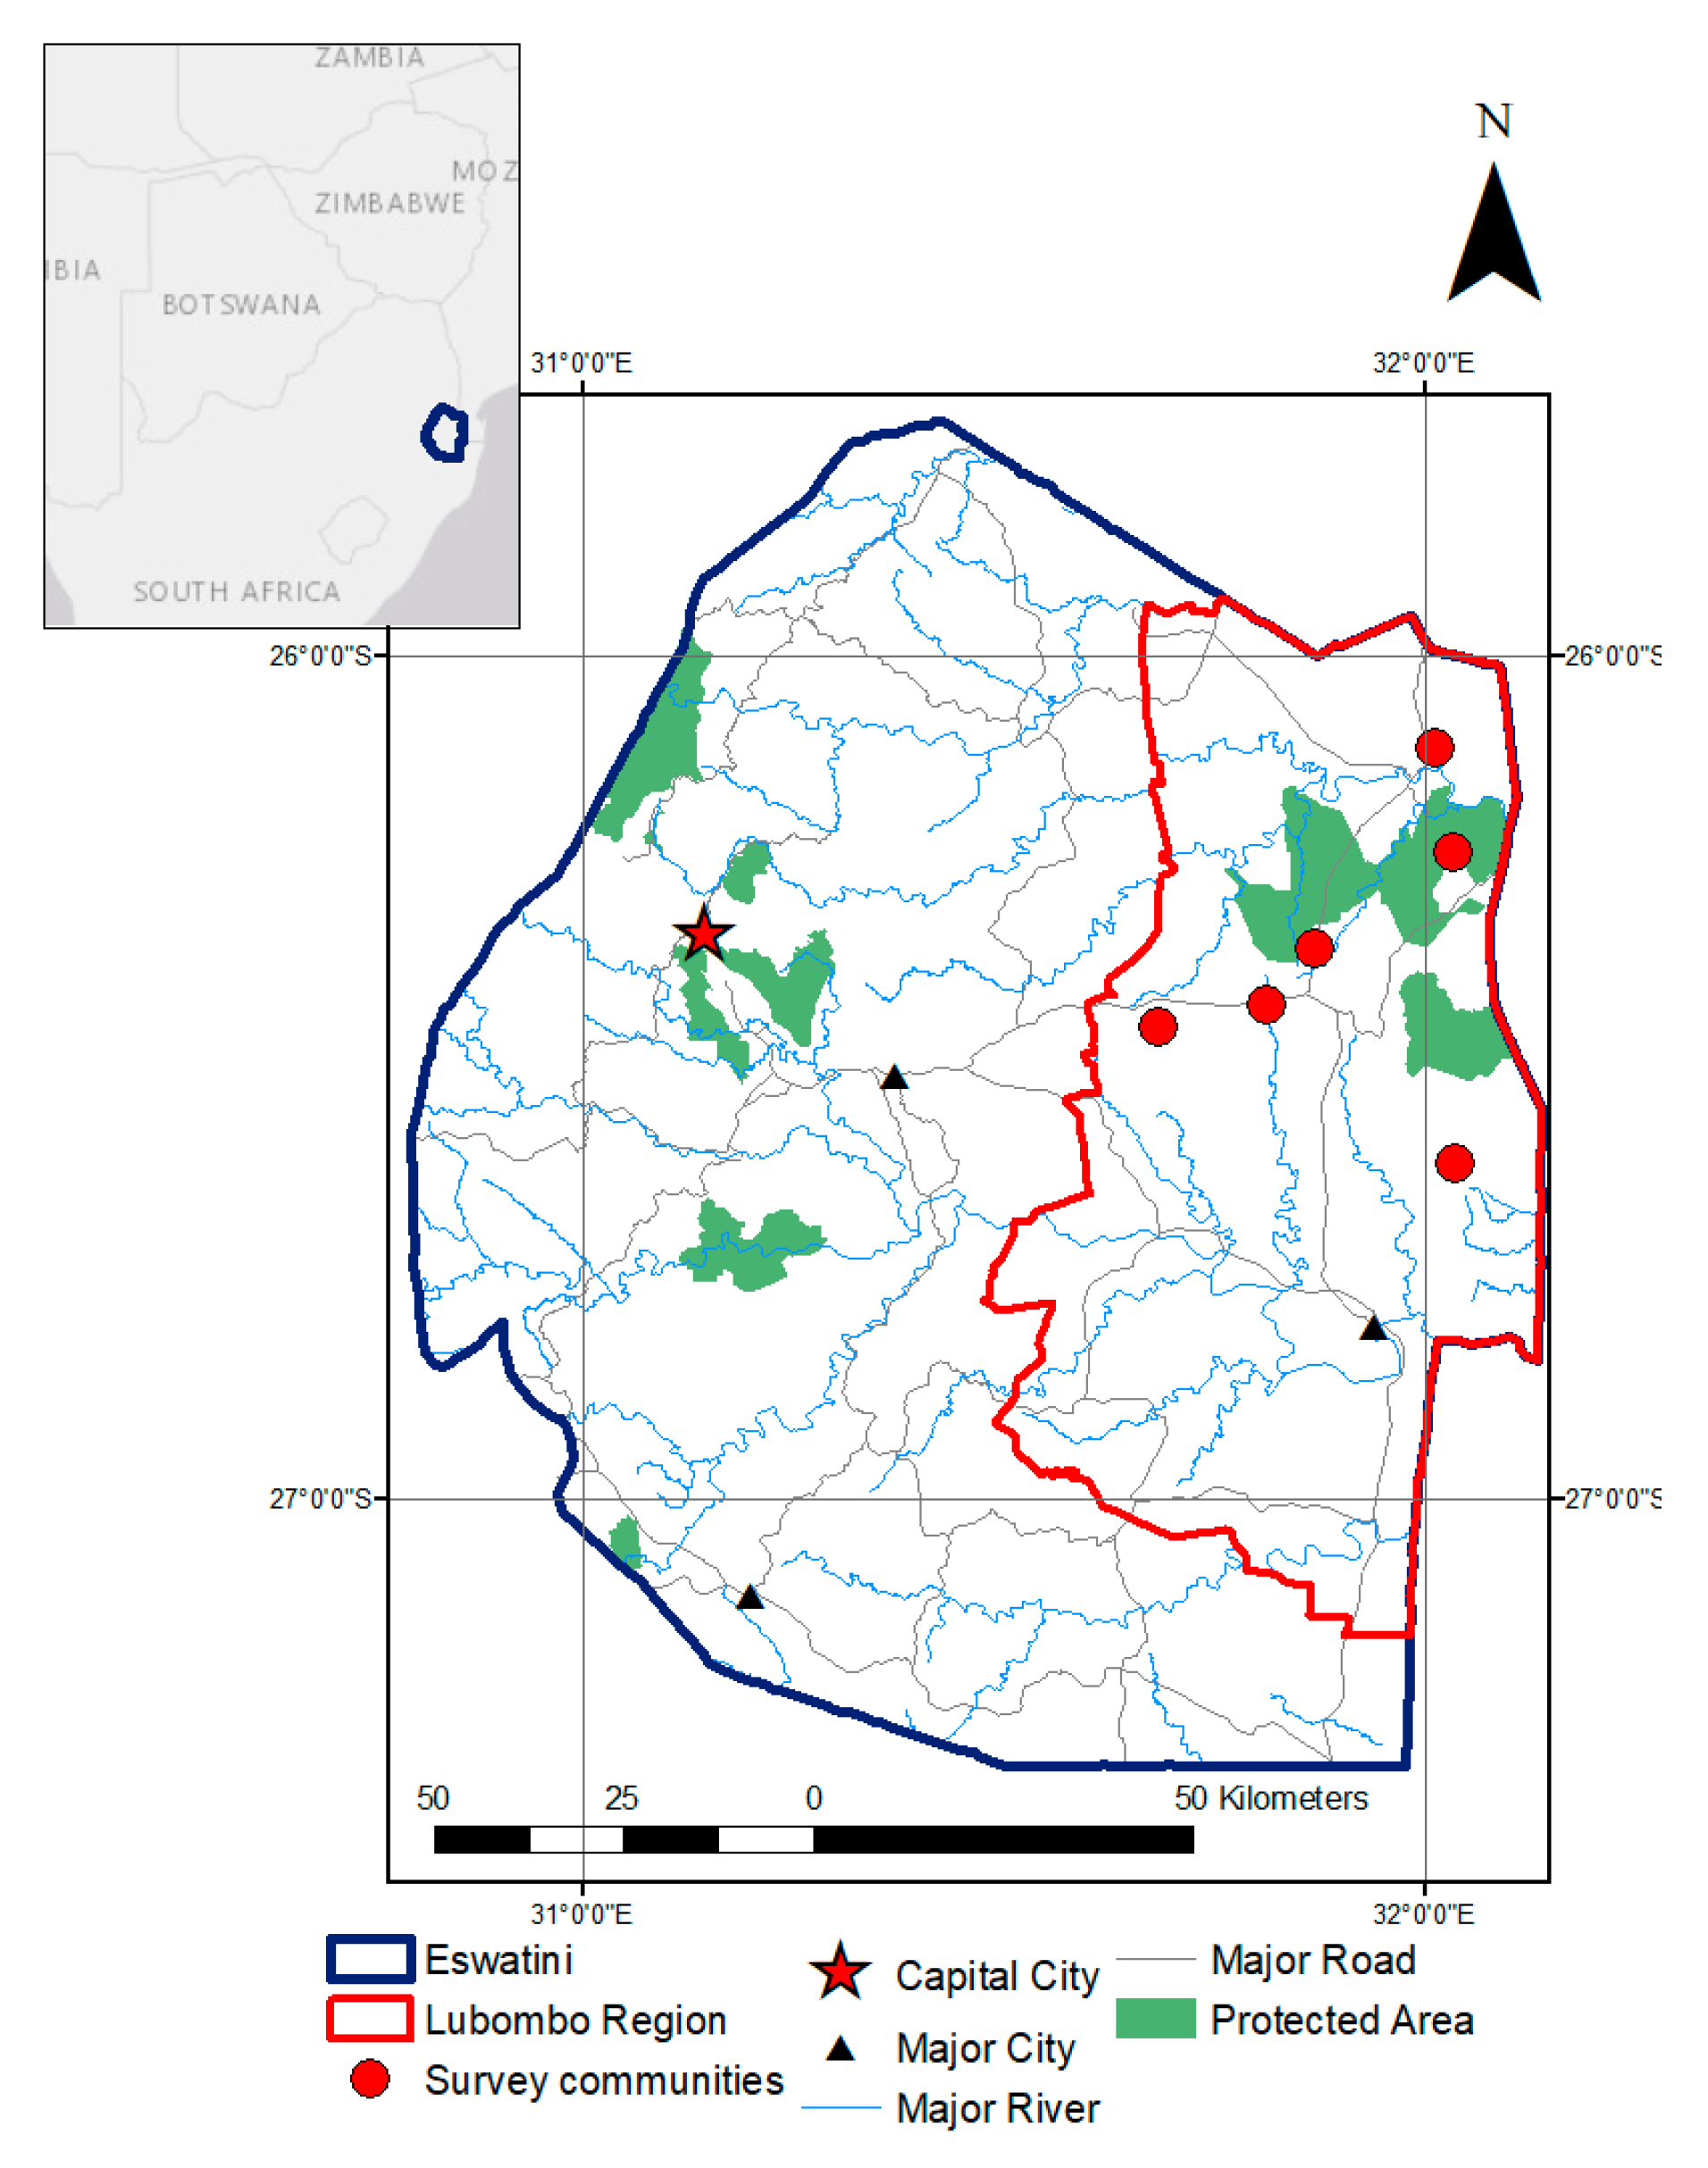
2.2. Study Area
2.3. Preliminary Data
2.4. Nutrition
2.5. Statistical Analysis
2.5.1. Adaptation and Nutrition
2.5.2. Adaptation, Nutrition, and Capital
2.5.3. The Role of Individual Adaptations
3. Results
3.1. Adaptation and Nutrition
3.2. Adaptation, Nutrition, and Capital
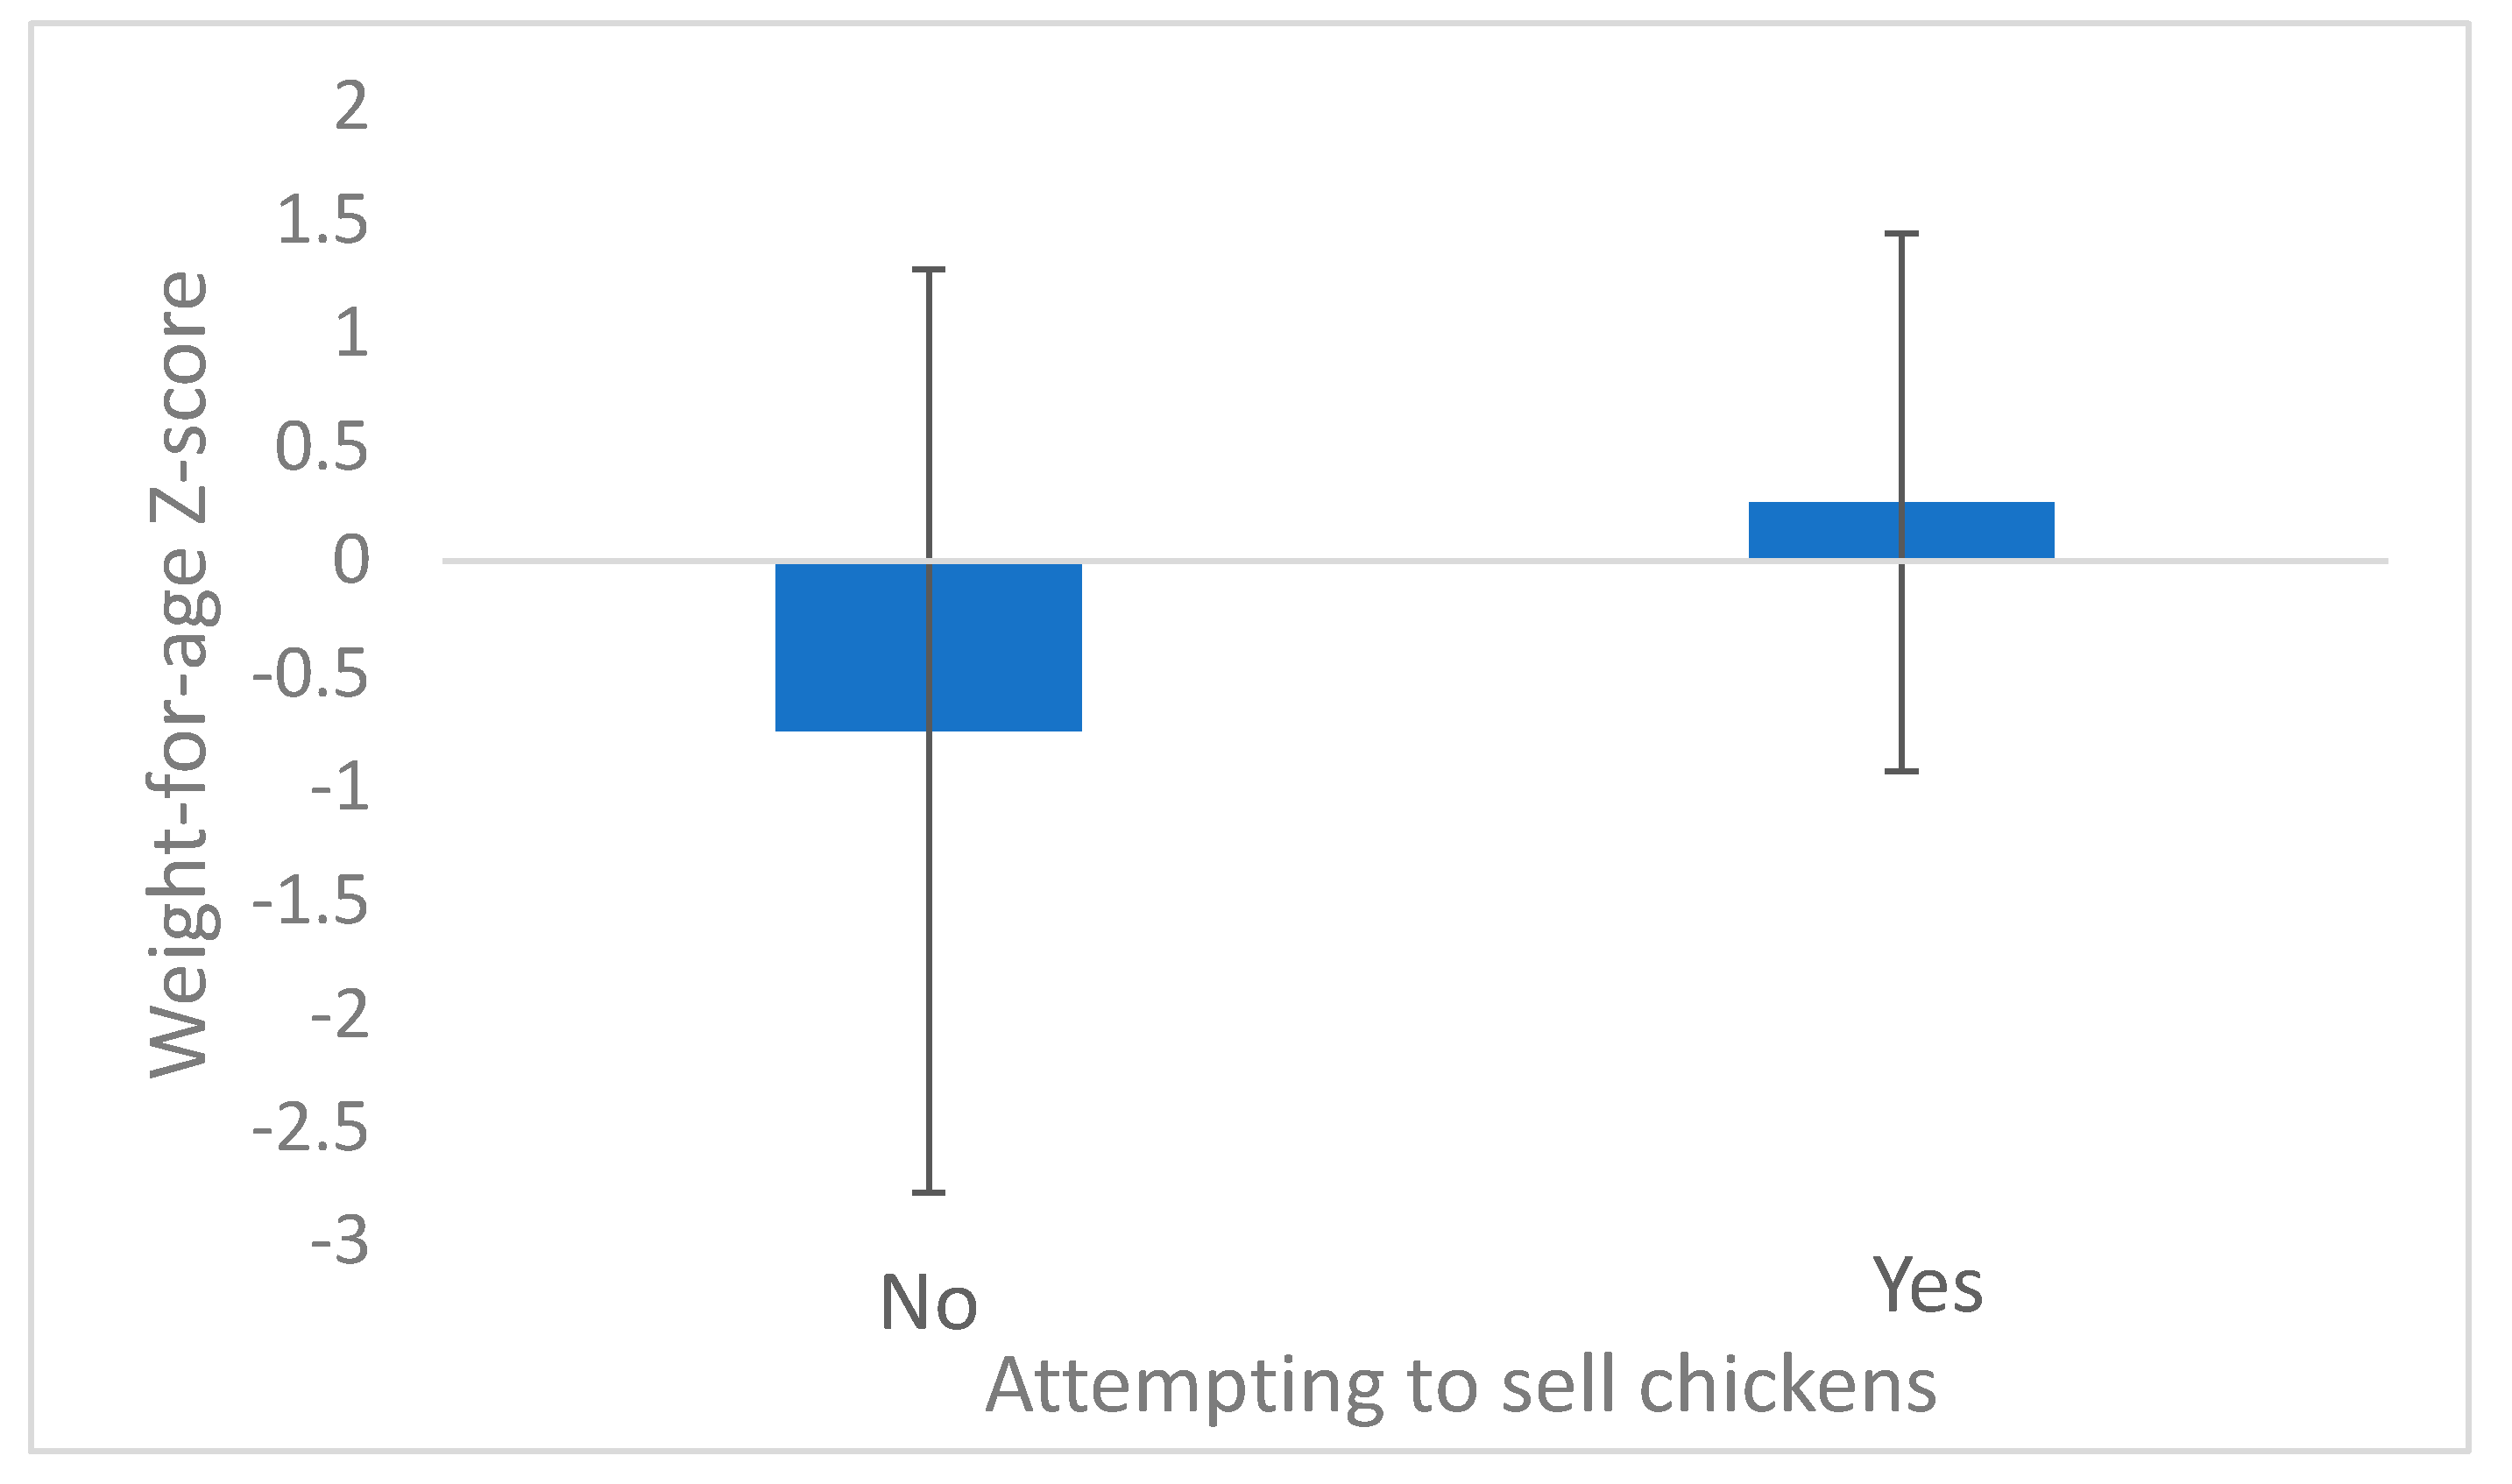
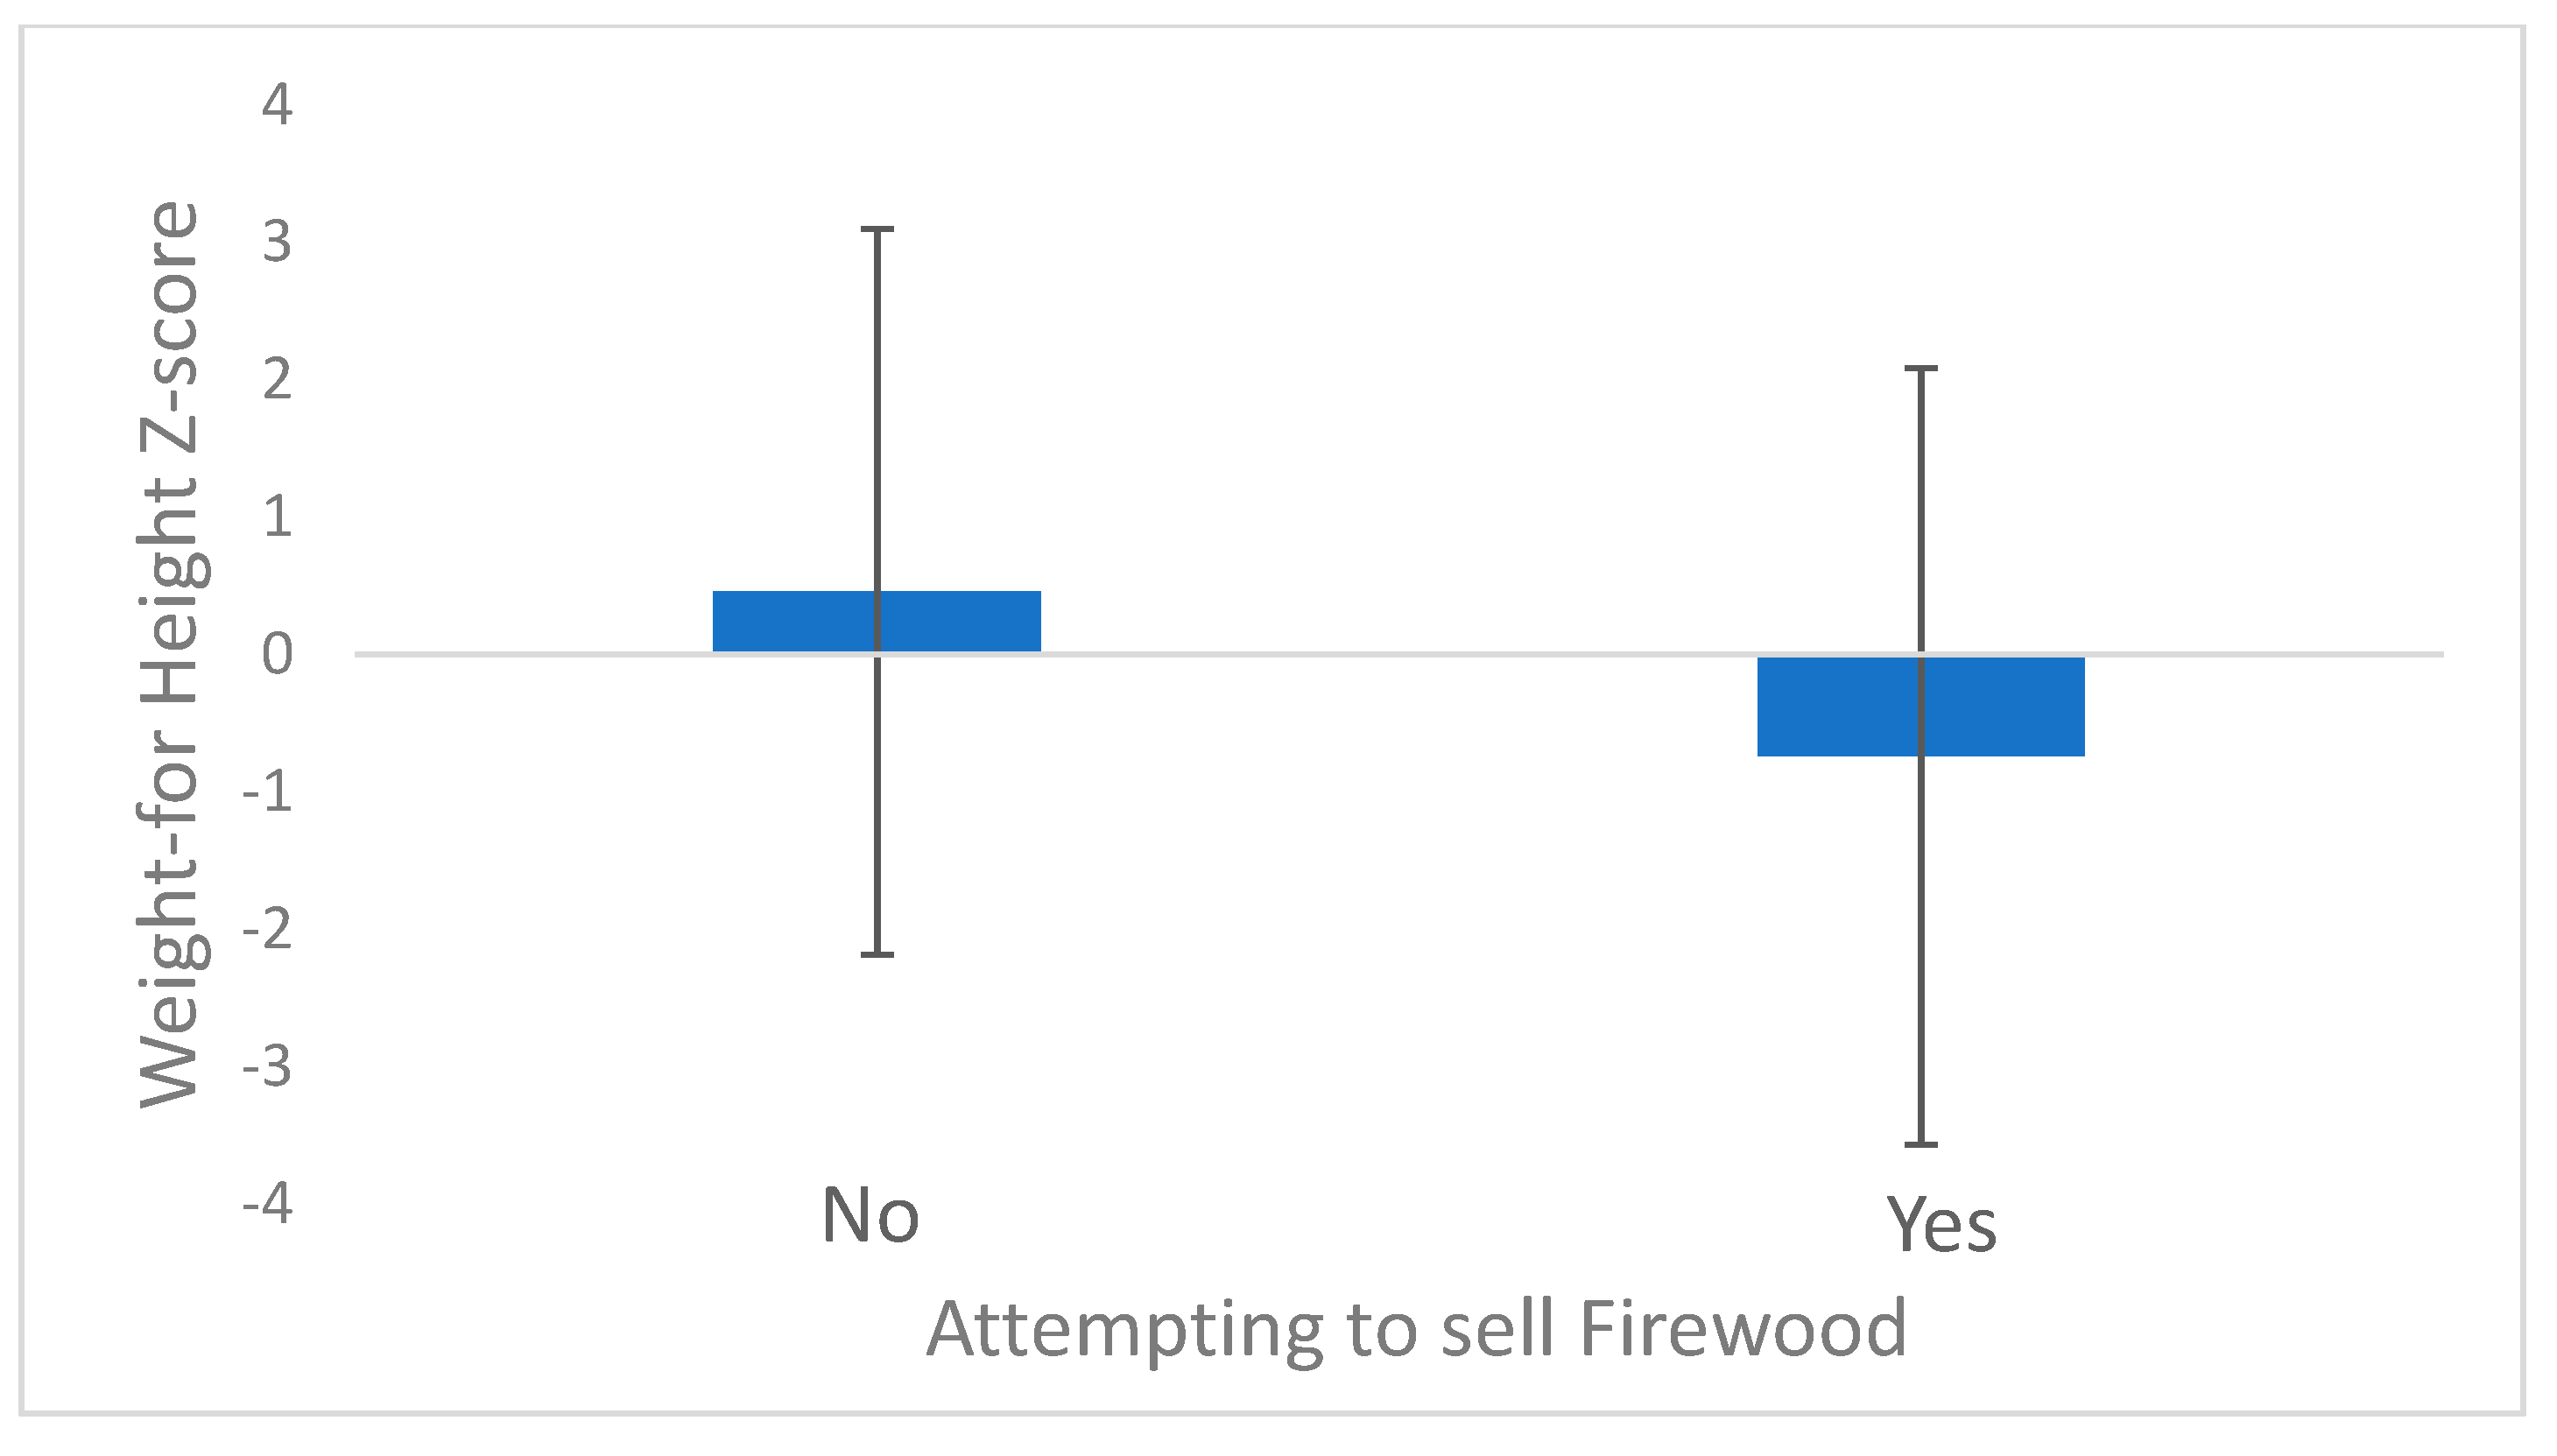
3.3. The Role of Individual Adaptations
3.4. Drivers of Adaptation
4. Discussion
4.1. Adaptation, Nutrition, and Capital
4.2. The Role of Individual Adaptations
5. Conclusions
Supplementary Materials
Supplementary File 1Author Contributions
Funding
Acknowledgments
Conflicts of Interest
Appendix A. Household Survey
| Enumerator Name | Translator name |
| Date of Survey | Community Name |
| Time survey start | Time Survey End |
| Sex of Interviewee(s) | Household head (Y/N) |
| Household Code |
| Section A-Homestead Data | ||
| A.1 | Date of Settlement at homestead | │_____________________________________│ |
| A.2 | What is the main type of roof? | |
| 1. Thatched Grass | ||
| 2. Corrugated Iron | ||
| 3. Other (specify) | │_____________________________________│ | |
| A.3 | What is the main type of floor? | |
| 1. Mud | ||
| 2. Cement/stone | ||
| 3. Other (Specify) | │_____________________________________│ | |
| A.4 | What is the main type of floor? | |
| 1. Mud | ||
| 2. Cement/stone | ||
| 3. Other (Specify) | │_____________________________________│ | |
| A.5 | What is the main type of wall? | |
| 1. Mud and sticks | ||
| 2. Mud and stones | ||
| 3. Cement, cinderblock | ||
| 4. Other (specify) | │_____________________________________│ | |
| A.6 | Do you have electricity at the homestead? | |
| 1. No | ||
| 2. Yes | │_____________________________________│ | |
| A.7 | What fuel is used to cook with? | |
| 1. Dung | ||
| 2. Wood | ||
| 3. Coal/charcoal | ||
| 4. LPG | ||
| 5. Kerosene | ||
| 6. Electricity | │_____________________________________│ | |
| A.7 | How many children <16 years old live at the homestead? | │_____________________________________│ |
| A.8 | Answer the Following for All Family Members 16 and Older | |
| HH ID | ID Code | Sex | Age | Marital Status | Literate (Yes/No) | Years of Education | Months/Years at Homestead | Principal Occupation | Secondary Occupation |
| 01 | |||||||||
| 02 | |||||||||
| 03 | |||||||||
| 04 | |||||||||
| 05 | |||||||||
| 06 |
| B.1 | What is the primary livelihood activity?
|
| B.2 | What is the secondary livelihood activity? (Use codes from above |
| B.3 | What is the tertiary livelihood activity? (Use codes from above) |
| B.4 | Does the primary livelihood activity account for more than 50 percent of your household’s livelihood?
|
| B.5 | Who is the main breadwinner in the household? (Use individual ID Code) |
| B.6 | For household members who work off-farm, how far do they travel for work, on average?
|
| B.7 | What is the primary food source?
|
| B.8 | What is the secondary food source? (Use codes from question B.7) |
| B.9 | What are the primary crops that you cultivate at home (20% or more of total planted crops)? |
| B.9 | In a good year, how many bags does your household harvest?
|
| Section C-Financial Capital | |
| C.1 | Does your household own any of the following? (1 if No, 2 if yes) Radio/Cassette player? Bicycle? Motorcycle/scooter? Refrigerator? Tractor? Plow? Television? Telephone/cell phone? |
| C.2 | What is your average total monthly household income?
|
| C.3 | When was the last time someone in your household received money for work (a paycheck), government money, money for services, or payment for product sales?
|
| Section D-Natural Capital | |
| D.1 | Have you planted anything this season?
|
| D.2 | If no, do you plan to plant this season?
|
| D.3 | If yes, what proportion of your farmland are you currently using for farming?
|
| D.4 | What percentage of your farmland did you farm last year?
|
| D.5 | Does your household collect wild food?
|
| D.6 | What proportion of your diet comes from wild foods?
|
| D.7 | How far do you travel to collect wild foods?
|
| D.8 | How far do you travel to collect fuel wood?
|
| D.9 | Please look at the map and outline the following: Where your farmland is located Where you travel to collect firewood Where you travel to collect wild foods |
| Section E-Physical Capital | ||||
| E.1 | How far (Km) do you travel to reach the [FACILITY]:
| How do you travel to get to [FACILITY]?
| How long does it take you to reach [FACILITY]? | |
| Hours | Minutes | |||
| Primary School | ||||
| Middle School | ||||
| Secondary School | ||||
| Clinic | ||||
| Market | ||||
| E.2 | How many do you own of each of the following?
|
| E.3 | What is the main source for your drinking water?
|
| E.4 | How far is this drinking source from the homestead?
|
| E.5 | How many months of the year is this water source available?
|
| E.6 | What is the distance to the water sources used for livestock (cattle)?
|
| Section F-Social Capital | |
| F.1 | Are you or any member of your household a member of a community organization?
|
| F.2 | How many times in the last month did you attend: Church Community Meeting Organizational meeting |
| F.3 | Do you or any household member have any leadership positions in the community?
|
| F.4 | If so, how long have they held the leadership position |
| F.5 | How many times in the last month have you received gifts from friends or community member? |
| F.6 | Does your household trade goods with your neighbors?
|
| F.7 | If, so, how often do you trade, on average?
|
| F.8 | Does your household work for your neighbors?
|
| F.9 | If, so, how often do you work for your neighbors, on average?
|
| F.10 | Do you hire your neighbors?
|
| F.11 | If, so, how often do you hire your neighbors, on average?
|
| F.12 | Where do you get information about farming and weather?
|
| Section G-Health and Food Security | |
| G.1 | In the past 24 h how many times have household women eaten? |
| G.2 | In the past 24 h how many times have household men eaten? |
| G.3 | In the past 24 h how many times have household children eaten? |
| G.4 | In the past 24 HOURS has anyone in your household eaten the following? (1 if No, 2 if yes) Maize Rice Sorghum Other grains? Bread Chicken Fish Beef Pork Other meat Eggs Beans Vegetables Milk or dairy Other food (specify) │______________________________________________________│ |
| G.5 | In the past 7 DAYS has anyone in your household eaten the following? (1 if No, 2 if yes) Maize Rice Sorghum Other grains? Bread Chicken Fish Beef Pork Other meat Eggs Beans Vegetables Milk or dairy Other food (specify) │______________________________________________________│ |
| G.6 | How many household children 0–5 years old have died recently (in the past 2 years)? |
| G.7 | (If 0, Skip to next question) By what cause(s)? _____________________________________________ |
| G.8 | How many household adults have died recently (in the past 2 years)? |
| G.9 | In the past 30 days, how many household members have visited a hospital or clinic? |
| Section H-Drought & Adaptation | |
| H.1 | How do you know when there is a drought? (What cues, evidence, and trends do you use)? _________________________________________________________________________________________ |
| H.2 | Thinking back over the last 30 years (or when you first moved to the community) how have the impacts of drought changed compared to the past?
|
| H.4 | In the past 5 years, have you and your household experienced drought? 1. No 2. Yes |
| H.5 | Excluding the last 6 months, has your household done any of the following over the past 5 years in response to drought? (1 if no, 2 if yes) Planting Alternative crops Conservation farming Bee Keeping Raising Indigenous Chickens Collecting natural resources to sell Handicrafts Sending family to work in cities Sending family to work in Sugarcane Participated in training provided by aid organizations Other (specify) ________________________________________________________________________________________ |
| H.6 | What were the results of each adaptation (prompt if necessary, increase in production, increased income, increased food consumption, etc.). Planting Alternative crops ________________________________________________________________________________________ Conservation farming ________________________________________________________________________________________ Bee Keeping ________________________________________________________________________________________ Raising Indigenous Chickens ________________________________________________________________________________________ Collecting natural resources to sell ________________________________________________________________________________________ Handicrafts ________________________________________________________________________________________ Sending family to work in cities ________________________________________________________________________________________ Sending family to work in Sugarcane ________________________________________________________________________________________ Participated in training provided by aid organizations ________________________________________________________________________________________ Other (specify) ________________________________________________________________________________________ |
| H.7 | In response to drought this year, in the last 6 months, has your household done any of the following? (1 if no, 2 if yes) Planting Alternative crops Conservation farming Bee Keeping Raising Indigenous Chickens Collecting natural resources to sell Handicrafts Sending family to work in cities Sending family to work in Sugarcane Participated in training provided by aid organizations Other (specify) ________________________________________________________________________________________ |
| If Adaptation Was Done in the Last 6 Months Ask | |
| I.1 | What did [the adaptation] involve, describe what you and your household changed? __________________________________________________________________________________________ |
| I.2 | How much money did your household spend to do [the adaptation]?
|
| I.3 | Did [the adaptation] require more time spent working or more people? If so, how much _________________________________________________________________________________________ |
| I.4 | How has [the adaptation] impacted the following
Total number of meals eaten by the household │________________│ Amount of food eaten per meal by the household │________________│ Total Household Income │________________│ |
| I.5 | Did [the adaptation] have any other impacts to you or your household? ____________________________________________________________________________________ |
| If the Adaptation WASN’T Done, Ask the Following Questions | |
| I.6 | Which of the following BEST explains why you didn’t do [the adaptation]?
|
| I.7 | Which of the following are additional reasons why you didn’t do [the adaptation]?
|
| I.8 | Are there other things you would like to be able to do in response to drought that you can’t? Specify________________________________________________________________________________________ |
Appendix B. A Qualitative Description of Each Adaptation Included in Our Survey in eSwatini in 2016
Appendix C

| Adaptation | Most Commonly Cited Barrier |
|---|---|
| Planting drought/heat resistant crops | Insufficient money/income |
| Conservation farming | Insufficient training/knowledge |
| Bee keeping | Insufficient training/knowledge |
| Chicken husbandry | Insufficient money/income |
| Selling natural resources | Insufficient Market/Infrastructure |
| Selling crafts | Insufficient training/knowledge |
| Other salaried off-farm work | Insufficient household labor available |
| Participating in local organizations | Insufficient opportunities/availability |
References
- Adger, W.N.; Huq, S.; Brown, K.; Conway, D.; Hulme, M. Adaptation to climate change in the developing world. Prog. Dev. Stud. 2003, 3, 179–195. [Google Scholar] [CrossRef]
- McMichael, A.J. Globalization, Climate Change, and Human Health. N. Engl. J. Med. 2013, 368, 1335–1343. [Google Scholar] [CrossRef] [PubMed] [Green Version]
- Lloyd, S.J.; Sari Kovats, R.; Chalabi, Z. Climate change, crop yields, and undernutrition: Development of a model to quantify the impact of climate scenarios on child undernutrition. Environ. Health Perspect. 2011, 119, 1817–1823. [Google Scholar] [CrossRef] [PubMed]
- Bizikova, L.; Parry, J.; Karami, J.; Echeverria, D. Review of key initiatives and approaches to adaptation planning at the national level in semi-arid areas. Reg. Environ. Chang. 2015, 15, 837–850. [Google Scholar] [CrossRef] [Green Version]
- Brooks, N. Vulnerability, Risk and Adaptation: A Conceptual Framework; Tyndall Centre for Climate Change Research: Norwich, UK, 2003. [Google Scholar]
- Chambers, R.; Conway, G.R. Sustainable rural livelihoods: Practical concepts for the 21st century. IDS Discuss. Pap. 1992, 296, 1–42. [Google Scholar]
- Brown, K. Sustainable adaptation: An oxymoron? Clim. Dev. 2011, 3, 21–31. [Google Scholar] [CrossRef]
- Tirado, M.C.; Crahay, P.; Mahy, L.; Zanev, C.; Neira, M.; Msangi, S.; Brown, R.; Scaramella, C.; Coitinho, D.C.; Müller, A. Climate change and nutrition: Creating a climate for nutrition security. Food Nutr. Bull. 2013, 34, 533–547. [Google Scholar] [CrossRef]
- Ziervogel, G.; Taylor, A. Feeling Stressed: Integrating Climate Adaptation with Other Priorities in South Africa. Environ. Sci. Policy Sustain. Dev. 2008, 50, 32–41. [Google Scholar] [CrossRef]
- Di Falco, S.; Veronesi, M.; Yesuf, M. Does adaptation to climate change provide food security? A micro-perspective from Ethiopia. Am. J. Agric. Econ. 2011, 93, 825–842. [Google Scholar] [CrossRef]
- Lipper, L.; Thornton, P.; Campbell, B.M.; Baedeker, T.; Braimoh, A.; Bwalya, M.; Caron, P.; Cattaneo, A.; Garrity, D.; Henry, K.; et al. Climate-smart agriculture for food security. Nat. Clim. Chang. 2014, 4, 1068–1072. [Google Scholar] [CrossRef]
- Misselhorn, A.A. What drives food insecurity in southern Africa? A meta-analysis of household economy studies. Glob. Environ. Chang. 2005, 15, 33–43. [Google Scholar] [CrossRef]
- Below, T.B.; Mutabazi, K.D.; Kirschke, D.; Franke, C.; Sieber, S.; Siebert, R.; Tscherning, K. Can farmers’ adaptation to climate change be explained by socio-economic household-level variables? Glob. Environ. Chang. 2012, 22, 223–235. [Google Scholar] [CrossRef]
- Ferrer-i-Carbonell, A. Income and well-being: An empirical analysis of the comparison income effect. J. Public Econ. 2005, 89, 997–1019. [Google Scholar] [CrossRef]
- Healy, T.; Côté, S.; Helliwell, J.F.; Field, S.; Centre for Educational Research and Innovation. The Well-Being of Nations: The Role of Human and Social Capital; Organisation for Economic Co-operation and Development: Paris, France, 2001; ISBN 9264185895.
- Diener, E.; Sandvik, E.; Seidlitz, L.; Diener, M. The relation between income and subjective well-being: Relative or absolute? Soc. Lndicators Res. 1993, 28, 195–223. [Google Scholar] [CrossRef]
- Murungweni, C.; van Wijk, M.T.; Giller, K.E.; Andersson, J.A.; Smaling, E.M.A. Adaptive livelihood strategies employed by farmers to close the food gap in semi-arid south eastern Zimbabwe. Food Secur. 2014, 6, 313–326. [Google Scholar] [CrossRef]
- Pavageau, C.; Locatelli, B.; Sonwa, D.; Tiani, A. What drives the vulnerability of rural communities to climate variability? Consensus and diverging views in the Congo Basin. Clim. Dev. 2016. [Google Scholar] [CrossRef]
- Fischer, A.P.; Jasny, L. Capacity to adapt to environmental change: Evidence from a network of organizations concerned with increasing wildfire risk. Ecol. Soc. 2017, 22. [Google Scholar] [CrossRef]
- Euler, M.; Krishna, V.; Schwarze, S.; Siregar, H.; Qaim, M. Oil Palm Adoption, Household Welfare, and Nutrition Among Smallholder Farmers in Indonesia. World Dev. 2017, 93, 219–235. [Google Scholar] [CrossRef] [Green Version]
- Lovo, S.; Veronesi, M. Crop Diversification and Child Health: Empirical Evidence from Tanzania. Ecol. Econ. 2019, 158, 168–179. [Google Scholar] [CrossRef]
- Tanner, T.; Mitchell, T. Entrenchment or enhancement: Could climate change adaptation help to reduce chronic poverty? IDS Bull. 2008, 39, 6–15. [Google Scholar] [CrossRef]
- Adger, W.N.; Brown, K.; Nelson, D.R.; Berkes, F.; Eakin, H.; Folke, C.; Galvin, K.; Gunderson, L.; Goulden, M.; O’Brien, K.; et al. Resilience implications of policy responses to climate change. Wiley Interdiscip. Rev. Clim. Chang. 2011, 2, 757–766. [Google Scholar] [CrossRef]
- Parry, M.L.; Canziani, O.F.; Palutikof, J.P.; van der Linden, P.J.; Hanson, C.E. Climate Change 2007: Impacts, Adaptation and Vulnerability: Contribution of Working Group II to the Fourth Assessment Report of the Intergovernmental Panel; IPPC: Cambridge, UK, 2007. [Google Scholar]
- Bryan, E.; Deressa, T.T.; Gbetibouo, G.A.; Ringler, C. Adaptation to climate change in Ethiopia and South Africa: Options and constraints. Environ. Sci. Policy 2009, 12, 413–426. [Google Scholar] [CrossRef]
- AghaKouchak, A.; Cheng, L.; Mazdiyasni, O.; Farahmand, A. Global warming and changes in risk of concurrent climate extremes: Insights from the 2014 California drought. Geophys. Res. Lett. 2014, 41, 8847–8852. [Google Scholar] [CrossRef] [Green Version]
- Paavola, J. Livelihoods, vulnerability and adaptation to climate change in Morogoro, Tanzania. Environ. Sci. Policy 2008, 11, 642–654. [Google Scholar] [CrossRef]
- Eriksen, S.; Lind, J. Adaptation as a political process: Adjusting to drought and conflict in Kenya’s Drylands. Environ. Manag. 2009, 43, 817–835. [Google Scholar] [CrossRef]
- Kiem, A.S.; Austin, E.K. Drought and the future of rural communities: Opportunities and challenges for climate change adaptation in regional Victoria, Australia. Glob. Environ. Chang. 2013, 23, 1307–1316. [Google Scholar] [CrossRef] [Green Version]
- Dai, A. Increasing drought under global warming in observations and models. Nat. Clim. Chang. 2012, 3, 52–58. [Google Scholar] [CrossRef]
- Stringer, L.C.; Dyer, J.C.; Reed, M.S.; Dougill, A.J.; Twyman, C.; Mkwambisi, D. Adaptations to climate change, drought and desertification: Local insights to enhance policy in southern Africa. Environ. Sci. Policy 2009, 12, 748–765. [Google Scholar] [CrossRef]
- Brown, O.; Hammill, A.; McLeman, R. Climate change as the “new” security threat: Implications for Africa. Int. Aff. 2007, 83, 1141–1154. [Google Scholar] [CrossRef]
- Gentle, P.; Maraseni, T.N. Climate change, poverty and livelihoods: Adaptation practices by rural mountain communities in Nepal. Environ. Sci. Policy 2012, 21, 24–34. [Google Scholar] [CrossRef]
- Sovacool, B.K.; D’agostino, A.L.; Rawlani, A.; Meenawat, H. Improving climate change adaptation in least developed Asia. Environ. Sci. Policy 2012, 21, 112–125. [Google Scholar] [CrossRef]
- Swindale, A.; Bilinsky, P. Advances in Developing Country Food Insecurity Measurement Development of a Universally Applicable Household Food Insecurity Measurement Tool: Process, Current Status, and Outstanding Issues 1 – 3. J. Nutr. 2006, 136, 1449–1452. [Google Scholar] [CrossRef] [PubMed]
- Humphries, D.L.; Dearden, K.A.; Crookston, B.T.; Fernald, L.C.; Stein, A.D.; Woldehanna, T.; Penny, M.E.; Behrman, J.R.; Young Lives Determinants and Consequences of Child Growth Project Team. Cross-Sectional and Longitudinal Associations between Household Food Security and Child Anthropometry at Ages 5 and 8 Years in Ethiopia, India, Peru, and Vietnam. J. Nutr. 2015, 145, 1924–1933. [Google Scholar] [PubMed] [Green Version]
- Watkins, K. A Fair Chance for Every Child; UNICEF: New York, NY, USA, 2016. [Google Scholar]
- Maslow, A.H. A theory of human motivation. Psychol. Rev. 1943, 50, 370–396. [Google Scholar] [CrossRef]
- Jaffe, K.; Bernal, J.; Herrera, H.A. Relation between Shame, Nutrition and Happiness in Children. SSRN Electron. J. 2014. [Google Scholar]
- Drewnowski, A.; Evans, W.J. Nutrition, Physical Activity, and Quality of Life in Older Adults: Summary. J. Gerontol. Ser. A Biol. Sci. Med. Sci. 2001, 56, 89–94. [Google Scholar] [CrossRef] [PubMed] [Green Version]
- Jyoti, D.F.; Frongillo, E.A.; Jones, S.J. Food insecurity affects school children’s academic performance, weight gain, and social skills. J. Nutr. 2005, 135, 2831–2839. [Google Scholar] [CrossRef]
- Callanan, A. Food and Nutrition Handbook; The Food and Agriculture Organization of the United Nations (FAO): Rome, Italy, 2000. [Google Scholar]
- De Onis, M.; Frongillo, E.A.; Blössner, M. Is malnutrition declining? An analysis of changes in levels of child malnutrition since 1980. Bull. World Health Organ. 2000, 78, 1222–1233. [Google Scholar]
- Caulfield, L.E.; de Onis, M.; Blössner, M.; Black, R.E. Undernutrition as an underlying cause of child deaths associated with diarrhea, pneumonia, malaria, and measles. Am. J. Clin. Nutr. 2004, 80, 193–198. [Google Scholar] [CrossRef] [Green Version]
- Black, R.E.; Victora, C.G.; Walker, S.P.; Bhutta, Z.A.; Christian, P.; De Onis, M.; Ezzati, M.; Grantham-Mcgregor, S.; Katz, J.; Martorell, R.; et al. Maternal and child undernutrition and overweight in low-income and middle-income countries. Lancet 2013, 382, 427–451. [Google Scholar] [CrossRef]
- Pelletier, D.L.; Frongillo, E.A.; Schroeder, D.G.; Habicht, J.P. The effects of malnutrition on child mortality in developing countries. Bull. World Health Organ. 1995, 73, 443–448. [Google Scholar] [PubMed]
- Frison, S.; Kerac, M.; Checchi, F.; Prudhon, C. Anthropometric indices and measures to assess change in the nutritional status of a population: A systematic literature review. BMC Nutr. 2016, 2, 76. [Google Scholar] [CrossRef]
- Hong, R.; Banta, J.E.; Betancourt, J.A. Relationship between household wealth inequality and chronic childhood under-nutrition in Bangladesh. Int. J. Equity Health 2006, 5, 15. [Google Scholar] [CrossRef] [PubMed]
- Wamani, H.; Nordrehaug, A.S.; Peterson, S.; Tumwine, J.K.; Tylleska, T. Predictors of poor anthropometric status among children under 2 years of age in rural Uganda. Public Health Nutr. 2006, 9, 320–326. [Google Scholar] [CrossRef]
- Nandy, S.; Irving, M.; Gordon, D.; Subramanian, S.V.; Smith, G.D. Policy and Practice Poverty, child undernutrition and morbidity: New evidence from India. Bull. World Health Organ. 2005, 011650, 210–216. [Google Scholar]
- Scoones, I. Sustainable rural livelihoods: A framework for analysis. Ids Work. Pap. 1998, 72, 22. [Google Scholar]
- Mabuza, K. Swaziland Rapid Assessment Summary Report 2016; Deputy Prime Minister’s Office: Mbabane, Swaziland, 2016.
- Mohammed, M.; Dlamini, T. Predictors of food insecurity in Eswatini: Lessons from the 2015/16 El Niño induced drought. Afr. Rev. Econ. Financ. 2018, 10, 69–96. [Google Scholar]
- Goudie, A.; Williams, D.P. The Atlas of Swaziland; Swaziland National Trust Commission: Lobamba, Swaziland, 1983.
- Boudreau, T. LIFT Swaziland Livelihood Data Analysis; The Food Economy Group (FEG): Herts, UK, 2010. [Google Scholar]
- Forster, P.G.; Nsibande, B.J. Swaziland: Contemporary Social and Economic Issues; Ashgate: Farnham, UK, 2000; ISBN 1840143312. [Google Scholar]
- Bailey, K.M.; McCleery, R.A.; Binford, M.W.; Zweig, C. Land-cover change within and around protected areas in a biodiversity hotspot. J. Land Use Sci. 2015, 4248, 1–23. [Google Scholar] [CrossRef]
- Department of Water Affairs and Forestry. Report on the Social Aspects on the Usuthu River: Swaziland and Mozambique; Department for International Development: KwaNgwanase, South Africa, 2002.
- Bailey, K.M.; McCleery, R.A.; Barnes, G. The role of capital in drought adaptation among rural communities in Eswatini. Ecol. Soc. 2019. [Google Scholar] [CrossRef]
- Zere, E.; McIntyre, D. Inequities in under-five child malnutrition in South Africa. Int. J. Equity Health 2003, 2, 7. [Google Scholar] [CrossRef]
- Thomas, D.; Strauss, J.; Henriques, M.-H. Child survival, height for age and household characteristics in Brazil. J. Dev. Econ. 1990, 33, 197–234. [Google Scholar] [CrossRef]
- Ellis, F. Rural Livelihood Diversity in Developing Countries: Evidence and Policy Implications. Odi Nat. Resour. Perspect. 1999, 40, 1–10. [Google Scholar]
- Mason, J.B.; Chotard, S.; Cercone, E.; Dieterich, M.; Oliphant, N.P.; Mebrahtu, S.; Hailey, P. Identifying priorities for emergency intervention from child wasting and mortality estimates in vulnerable areas of the Horn of Africa. Food Nutr. Bull. 2011, 32. [Google Scholar] [CrossRef] [PubMed]
- Barrett, C.B. Measuring food insecurity. Science 2010, 327, 825–828. [Google Scholar] [CrossRef] [PubMed]
- Psaki, S.; Bhutta, Z.A.; Ahmed, T.; Ahmed, S.; Bessong, P.; Islam, M.; John, S.; Kosek, M.; Lima, A.; Nesamvuni, C.; et al. Household food access and child malnutrition: Results from the eight-country MAL-ED study. Popul. Health Metr. 2012, 10, 24. [Google Scholar] [CrossRef] [PubMed]
- Fink, G.; Günther, I.; Hill, K. The effect of water and sanitation on child health: Evidence from the demographic and health surveys 1986–2007. Int. J. Epidemiol. 2011, 40, 1196–1204. [Google Scholar] [CrossRef] [PubMed]
- Ngure, F.M.; Reid, B.M.; Humphrey, J.H.; Mbuya, M.N.; Pelto, G.; Stoltzfus, R.J. Water, sanitation, and hygiene (WASH), environmental enteropathy, nutrition, and early child development: Making the links. Ann. N. Y. Acad. Sci. 2014, 1308, 118–128. [Google Scholar] [CrossRef]
- Crane, R.J.; Jones, K.D.J.; Berkley, J.A. Environmental enteric dysfunction: An overview. Food Nutr. Bull. 2015, 36, S76–S87. [Google Scholar] [CrossRef]
- Davies, P.S.W.; Roodveldt, R.; Marks, G. Standard Methods for the Collection and Collation of Anthropometric Data in Children; National Food and Nutrition Monitoring and Surveillance Project: Canberra, Australia, 2001. [Google Scholar]
- Centers for Disease Control and Prevention (CDC). National Health and Nutrition Examination Survey: Anthropometry Procedures Manual; Centers for Disease Control and Prevention (CDC): Atlanta, GA, USA, 2007.
- World Health Organization. WHO Multicentre Growth Reference Study Group. WHO Child Growth Standards: Growth Velocity Based on Weight, Length and Head Circumference: Methods and Development; World Health Organization: Geneva, Switzerland, 2009. [Google Scholar]
- World Health Organization (WHO). Child Growth Standards R Igrowup Package; World Health Organization (WHO): Geneva, Switzerland, 2011. [Google Scholar]
- R Core Development Team. R: A language and Environment for Statistical Computing. 2016. Available online: https://www.r-project (accessed on 23 October 2019).
- RSudio Team. RStudio: Integrated Development for R. 2015. Available online: http://www.rstudio (accessed on 23 October 2019).
- Schumacher, D.; Borghi, E.; Polonsky, J. Anthro: Computation of the WHO Child Growth Standards; WHO: Geneva, Switzerland, 2019. [Google Scholar]
- McDonald, C.M.; McLean, J.; Kroeun, H.; Talukder, A.; Lynd, L.D.; Green, T.J. Household food insecurity and dietary diversity as correlates of maternal and child undernutrition in rural Cambodia. Eur. J. Clin. Nutr. 2015, 69, 242–246. [Google Scholar] [CrossRef]
- Luby, S.P.; Agboatwalla, M.; Feikin, D.R.; Painter, J.; Billhimer, W.; Altaf, A.; Hoekstra, R.M. Effect of handwashing on child health: A randomised controlled trial. Lancet 2005, 366, 225–233. [Google Scholar] [CrossRef]
- Engle, R.F. Wald, Likelihood Ration, and Lagrange Multiplier tests in econometrics. Handb. Econ. 1983, II, 796–801. [Google Scholar]
- Di Falco, S. Adaptation to climate change in sub-Saharan agriculture: Assessing the evidence and rethinking the drivers. In Agricultural Adaptation to Climate Change in Africa: Food Security in a Changing Environment; Narnia; CRC Press: Boca Raton, FL, USA, 2018; Volume 41, pp. 83–106. ISBN 9781351369510. [Google Scholar]
- Mertz, O.; Mbow, C.; Reenberg, A.; Diouf, A. Farmers’ Perceptions of Climate Change and Agricultural Adaptation Strategies in Rural Sahel. Environ. Manag. 2009, 43, 804–816. [Google Scholar] [CrossRef] [PubMed]
- Berman, R.J.; Quinn, C.H.; Paavola, J. Identifying drivers of household coping strategies to multiple climatic hazards in Western Uganda: Implications for adapting to future climate change. Clim. Dev. 2015, 7, 71–84. [Google Scholar] [CrossRef]
- Mutisya, M.; Kandala, N.-B.; Ngware, M.W.; Kabiru, C.W. Household food (in)security and nutritional status of urban poor children aged 6 to 23 months in Kenya. BMC Public Health 2015, 15, 1052. [Google Scholar] [CrossRef]
- Ellis, F. Household strategies and rural livelihood diversification. J. Dev. Stud. 1998, 35, 1–38. [Google Scholar] [CrossRef]
- Kangalawe, R.Y.M.; Lyimo, J.G. Climate Change, Adaptive Strategies and Rural Livelihoods in Semiarid Tanzania. Nat. Resour. 2013, 04, 266–278. [Google Scholar] [CrossRef] [Green Version]
- Smith, D.R.; Gordon, A.; Meadows, K.; Zwick, K. Livelihood diversification in Uganda: Patterns and determinants of change across two rural districts. Food Policy 2001, 26, 421–435. [Google Scholar] [CrossRef]
- Nielsen, J.Ø.; Reenberg, A. Cultural barriers to climate change adaptation: A case study from Northern Burkina Faso. Glob. Environ. Chang. 2010, 20, 142–152. [Google Scholar] [CrossRef]
- Smit, B.; Burton, I.; Klein, R.J.T.; Wandel, J. An Anatomy of Adaptation to Climate Change and Variability. Clim. Chang. 2000, 45, 223–251. [Google Scholar] [CrossRef]
- Gautam, Y.; Andersen, P. Rural livelihood diversification and household well-being: Insights from Humla, Nepal. J. Rural Stud. 2016, 44, 239–249. [Google Scholar] [CrossRef] [Green Version]
- Michalos, A.C. Education, happiness and wellbeing. Soc. Indic. Res. 2008, 87, 347–366. [Google Scholar] [CrossRef]
- Bryan, E.; Ringler, C.; Okoba, B.; Roncoli, C.; Silvestri, S.; Herrero, M. Adapting agriculture to climate change in Kenya: Household strategies and determinants. J. Environ. Manag. 2013, 114, 26–35. [Google Scholar] [CrossRef] [PubMed]
- Thomas, D.S.G.; Twyman, C. Equity and justice in climate change adaptation amongst natural-resource-dependent societies. Glob. Environ. Chang. 2005, 15, 115–124. [Google Scholar] [CrossRef]
- Siyaya, B.J.J.; Masuku, M.B. Factors Affecting Commercialisation of Indigenous Chickens in Swaziland. J. Agric. Stud. 2013, 1, 86. [Google Scholar] [CrossRef]
- Fakudze, R. Swaziland Annual Vulnerability Assessment & Analysis Report 2016; Swaziland Vulnerability Assessment Committee: Mbabane, Swaziland, 2016. [Google Scholar]
- Odede, R.; Radosavljevic, T.; Dladla, B. Swaziland Humanitarian Situation Report Situation Overview & Humanitarian Needs; UNICEF: Mbabane, Swaziland, 2016. [Google Scholar]
- Barrett, C.; Reardon, T.; Webb, P. Nonfarm income diversification and household livelihood strategies in rural Africa: Concepts, dynamics, and policy implications. Food Policy 2001, 26, 315–331. [Google Scholar] [CrossRef]
- Niehof, A. The significance of diversification for rural livelihood systems. Food Policy 2004, 29, 321–338. [Google Scholar] [CrossRef]


| Average Z Scores (SD) | N Malnourished (%) | ||||||
|---|---|---|---|---|---|---|---|
| Age (Months) | N | HAZ | WAZ | WHZ | HAZ < −2 | WAZ < −2 | WHZ < −2 |
| 0–12 | 47 | −0.39 (2.7) | 0.21 (2.4) | 1.08 (2.9) | 11 (23) | 8 (17) | 6 (13) |
| 13–24 | 51 | −1.47 (2.2) | −0.42 (1.9) | 0.39 (2.5) | 19 (37) | 9 (18) | 10 (20) |
| 25–36 | 43 | −1.91 (1.7) | −0.31 (1.5) | 0.91 (1.8) | 22 (51) | 6 (14) | 2 (5) |
| 37–48 | 53 | −0.60 (2.2) | −0.69 (1.4) | −0.55 (2.3) | 10 (19) | 8(15) | 14 (26) |
| 49–60 | 55 | −1.39 (1.5) | −0.67 (1.5) | 0.19 (2.0) | 15 (27) | 9 (16) | 5 (9) |
| Total | 249 | −1.16 (2.1) | −0.41 (1.8) | 0.34 (2.4) | 77 (31) | 40 (16) | 37 (15) |
| Adaptation | Households Attempting (N) | Reported Success Rate |
|---|---|---|
| Planting drought/heat resistant crops | 51% (152) | 28% (43) |
| Conservation farming | 30% (88) | 33% (29) |
| Bee keeping | 6% (19) | 5% (1) |
| Chicken husbandry | 23% (69) | 67% (46) |
| Selling natural resources | 19% (55) | 98% (54) |
| Selling crafts | 22% (66) | 86% (57) |
| Other salaried off-farm work | 24% (72) | 32% (23) |
| Participating in local organizations | 17% (50) | 36% (18) |
| Predictor Variables | Weight for Age (Undernutrition) | Weight for Height (Wasting) | Height for Age (Stunting) |
|---|---|---|---|
| Adaptation Attempts | - | 0.34 | - |
| Ratio of successful to attempted adaptations | −1.28 | −1.77 | - |
© 2019 by the authors. Licensee MDPI, Basel, Switzerland. This article is an open access article distributed under the terms and conditions of the Creative Commons Attribution (CC BY) license (http://creativecommons.org/licenses/by/4.0/).
Share and Cite
Bailey, K.M.; McCleery, R.A.; Barnes, G.; McKune, S.L. Climate-Driven Adaptation, Household Capital, and Nutritional Outcomes among Farmers in Eswatini. Int. J. Environ. Res. Public Health 2019, 16, 4063. https://0-doi-org.brum.beds.ac.uk/10.3390/ijerph16214063
Bailey KM, McCleery RA, Barnes G, McKune SL. Climate-Driven Adaptation, Household Capital, and Nutritional Outcomes among Farmers in Eswatini. International Journal of Environmental Research and Public Health. 2019; 16(21):4063. https://0-doi-org.brum.beds.ac.uk/10.3390/ijerph16214063
Chicago/Turabian StyleBailey, Karen M., Robert A. McCleery, Grenville Barnes, and Sarah L. McKune. 2019. "Climate-Driven Adaptation, Household Capital, and Nutritional Outcomes among Farmers in Eswatini" International Journal of Environmental Research and Public Health 16, no. 21: 4063. https://0-doi-org.brum.beds.ac.uk/10.3390/ijerph16214063