Quantification of Internal and External Load in School Football According to Gender and Teaching Methodology


Abstract
:1. Introduction
2. Materials and Methods
2.1. Design
2.2. Sample and Setting
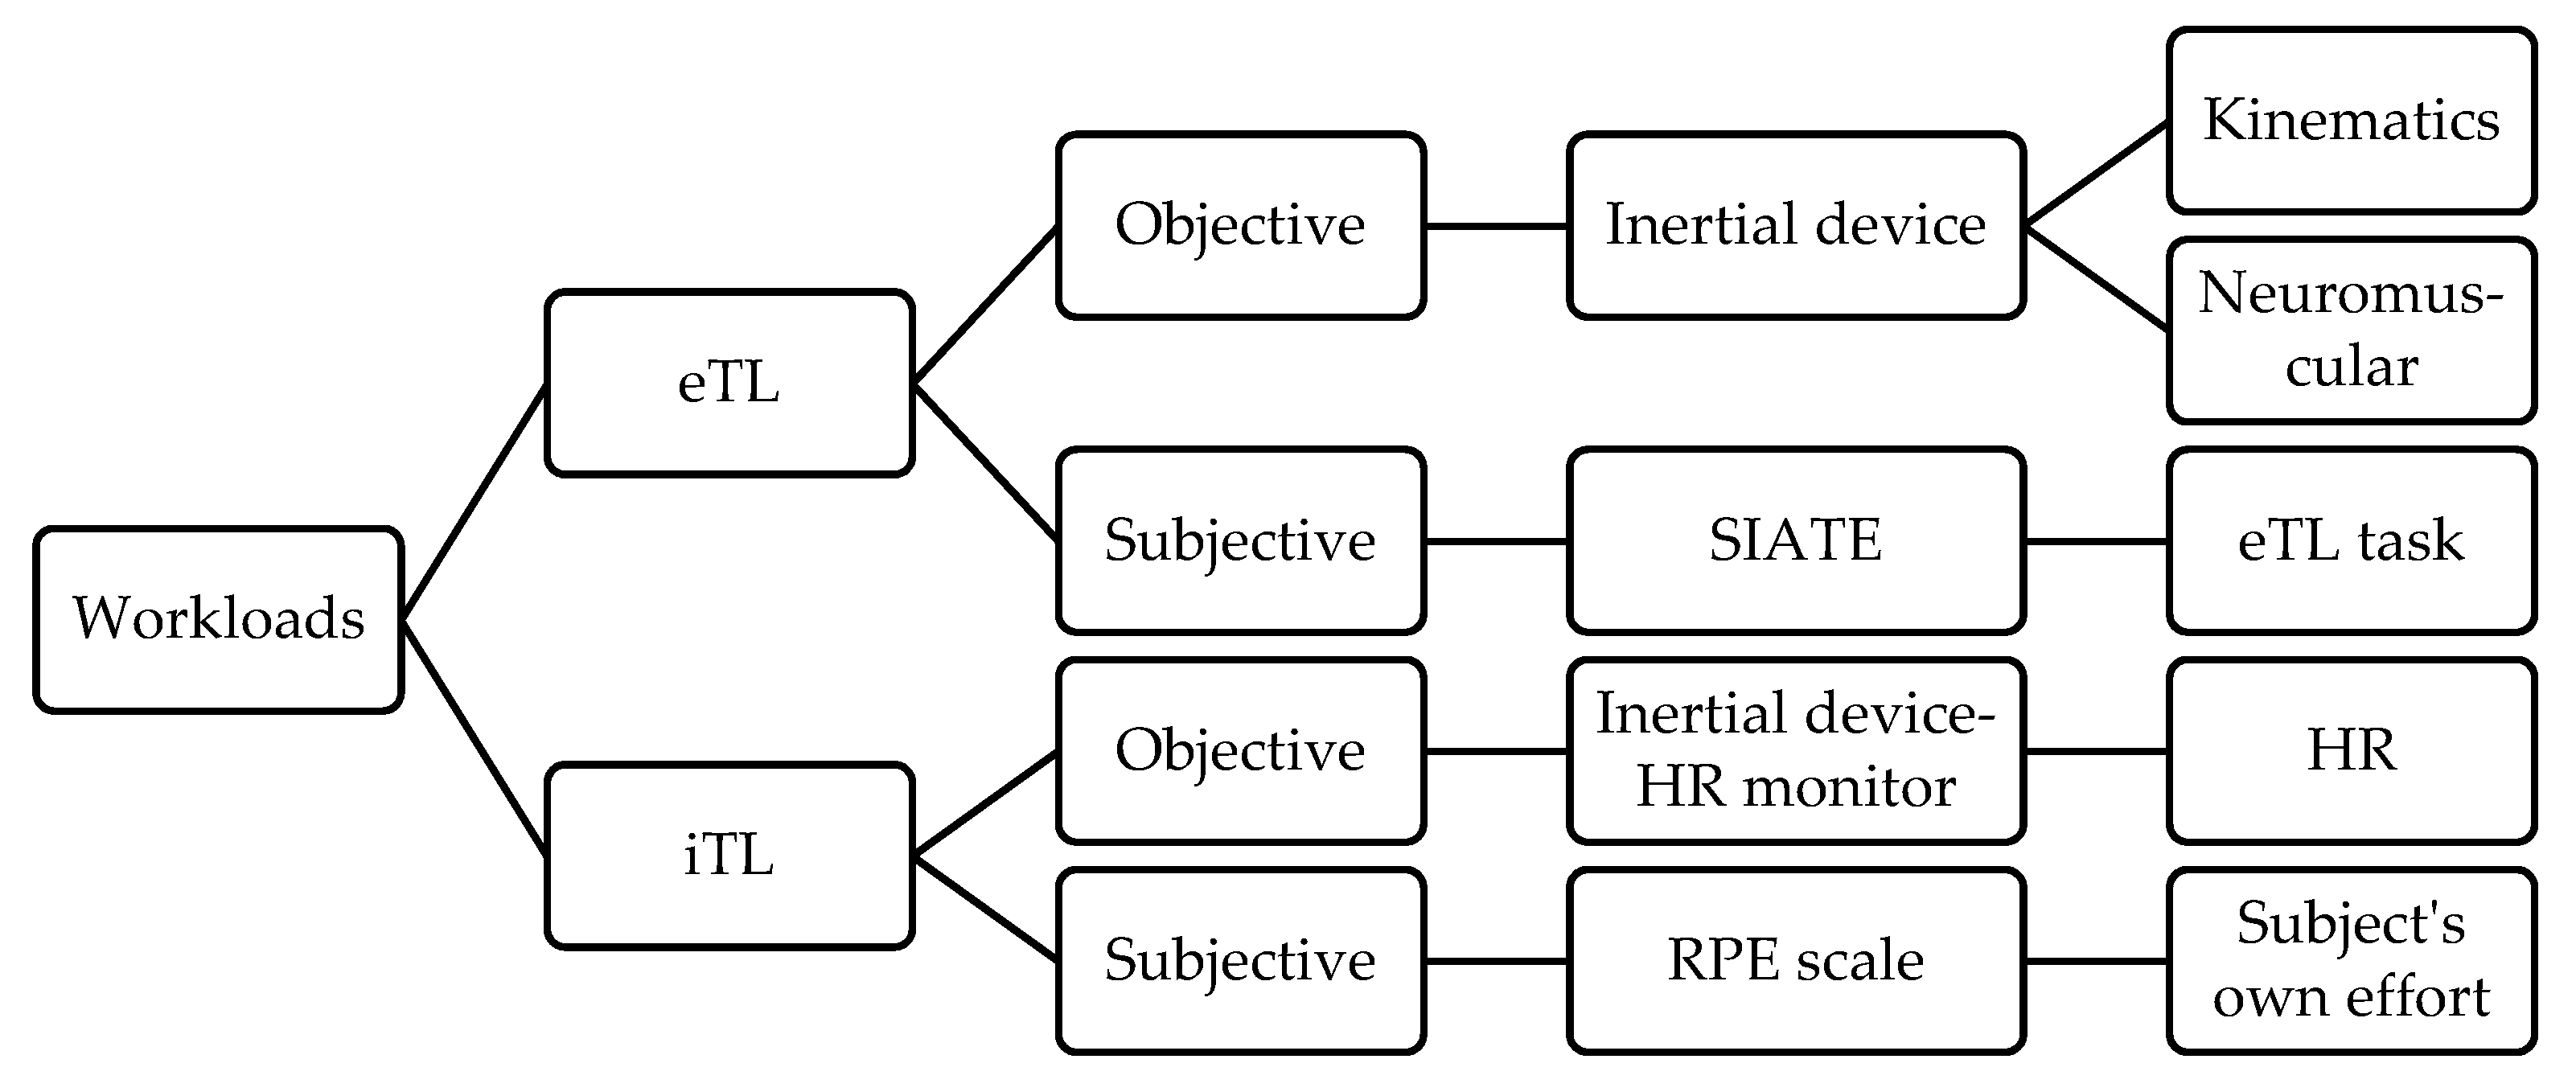
2.3. Variables
2.4. Instruments
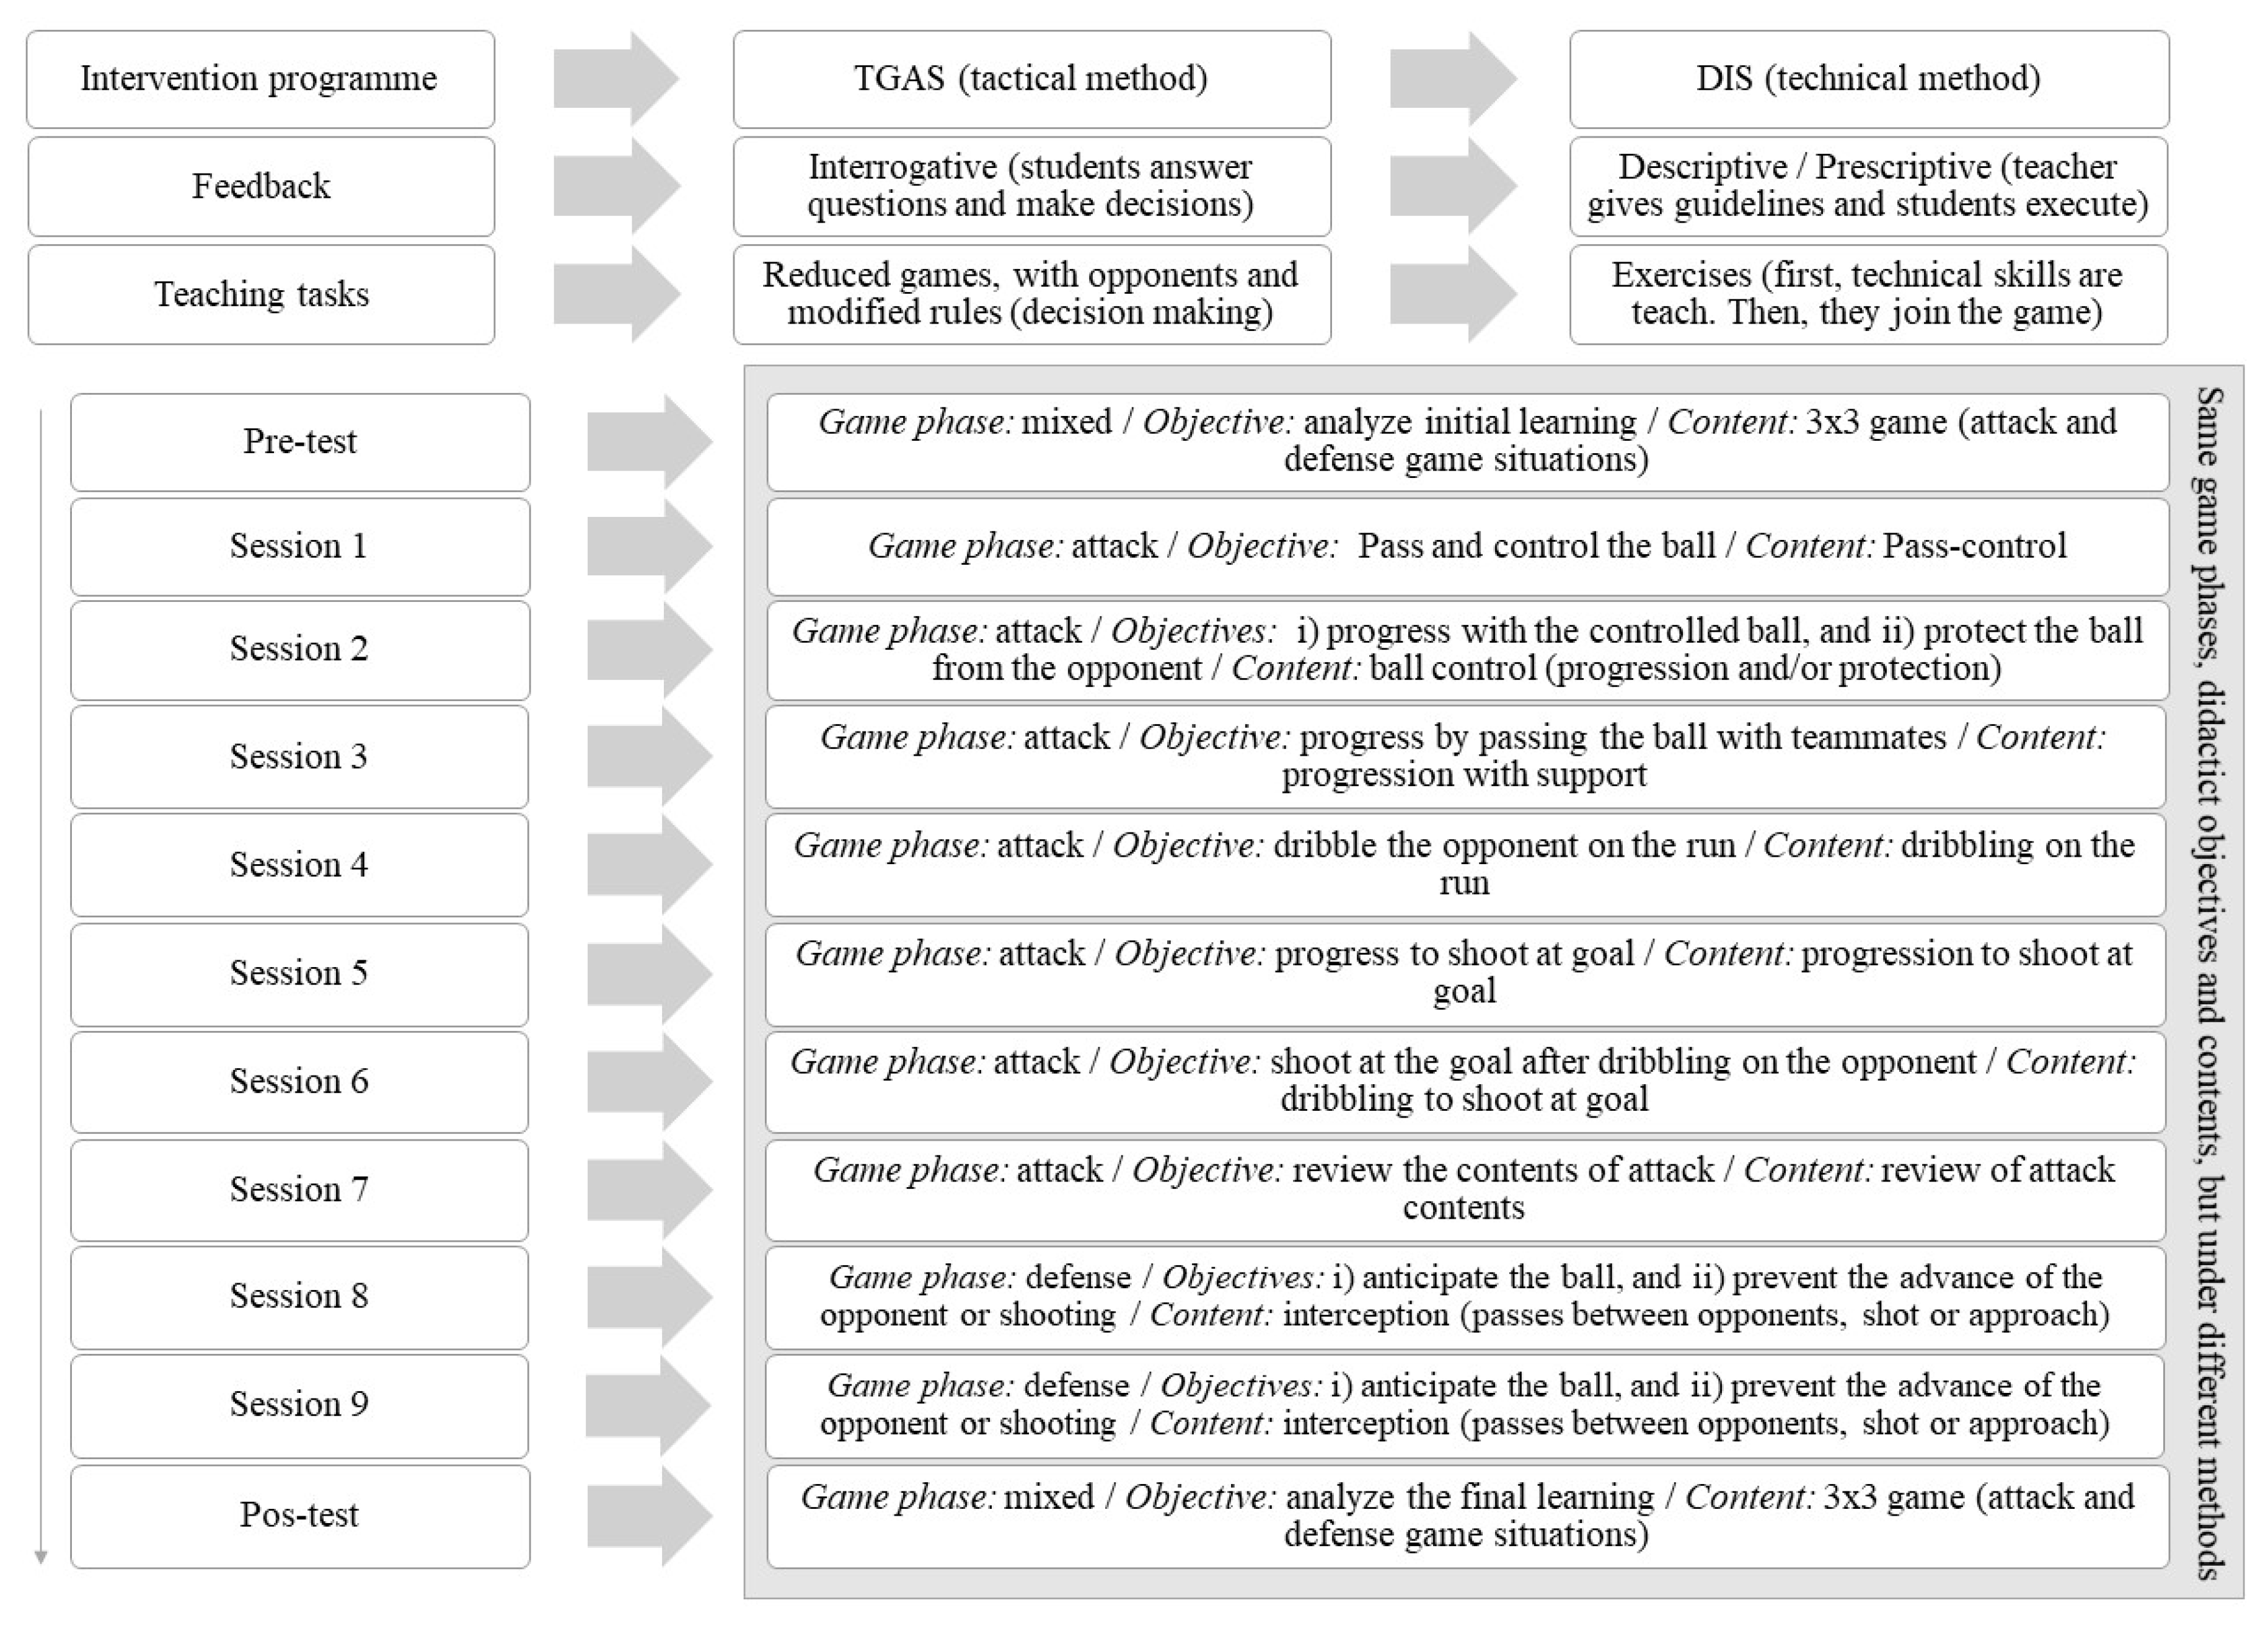
2.5. Procedure
2.6. Statistical Analyses
3. Results
4. Discussion
5. Conclusions
Author Contributions
Funding
Acknowledgments
Conflicts of Interest
References
- Kirk, D.; MacPhail, A. Teaching Games for Understanding and Situated Learning: Rethinking the Bunker-Thorpe Model. J. Teach. Phys. Educ. 2002, 21, 177–192. [Google Scholar] [CrossRef]
- Fernández-Río, J.; Calderón, A.; Hortigüela, D.; Pérez-Pueyo, A.; Aznar, M. Modelos pedagógicos en educación física: Consideraciones teórico-prácticas para docentes. Rev. Española de Educación Física y Deportes 2016, 413, 55–75. [Google Scholar]
- Feu, S.; García-Rubio, J.; Gamero, M.G.; Ibáñez, S.J. Task planning for sports learning by physical education teachers in the pre-service phase. PLoS ONE 2019, 14. [Google Scholar] [CrossRef] [PubMed]
- Alarcón, F.; Cárdenas, D.; Miranda, M.T.; Ureña, N.; Piñar, M.I. La metodología de enseñanza en los deportes de equipo. Revista de Investigación en Educación 2010, 7, 91–103. [Google Scholar]
- Metzler, M.W. Instructional Models for Physical Education; Holocomb Hathaway: Scottsdale, AZ, USA, 2011. [Google Scholar]
- Pill, S. Implementing game sense coaching approach in australian football through action research. Ágora para la Educación Física y el Deporte 2016, 18, 1–19. [Google Scholar]
- Light, R.L.; Kentel, J.A. Soft pedagogy for a hard sport (?) Disrupting hegemonic masculinity in high school rugby through feminist-informed pedagogy. In Boys’ Bodies; Kehlen, M., Atkinson, M., Eds.; Peter Lang Publishers: Oxford, UK, 2010; pp. 133–152. [Google Scholar]
- Cañadas, M.; Gómez, M.A.; García-Rubio, J.; Ibáñez, S.J. Analysis of Training Plans in Basketball: Gender and Formation Stage Differences. J. Hum. Kinet. 2018, 62, 123–134. [Google Scholar] [CrossRef] [Green Version]
- García, L.M.; Gutiérrez, D. Aprendiendo a Enseñar Deporte: Modelos de Enseñanza Comprensiva y Educación Deportiva; Inde: Barcelona, Spain, 2016. [Google Scholar]
- 1Bunker, D.; Thorpe, R. A model for the teaching of games in secondary schools. Bull. Phys. Educ. 1982, 18, 1–4. [Google Scholar]
- Cañadas, M.; Ibáñez, S.J.; García, J.; Parejo, I.; Feu, S. Las situaciones de juego en el entrenamiento de baloncesto en categorías base/Game situations in youth basketball practices. Revista Internacional de Medicina y Ciencias de la Actividad Fisica y del Deporte 2013, 13, 41–54. [Google Scholar]
- Memmert, D.; Harvey, S. Identification of non-specific tactical tasks in invasion games. Phys. Educ. Sport Pedagog. 2010, 15, 287–305. [Google Scholar] [CrossRef]
- González-Espinosa, S.; Antúnez, A.; Feu, S.; Ibáñez, S.J. Monitoring the External and Internal Load Under 2 Teaching Methodologies. J. Strength Cond. Res. 2018. [Google Scholar] [CrossRef]
- Harvey, S.; Song, Y.; Baek, J.-H.; van der Mars, H. Two sides of the same coin: Student physical activity levels during a game-centred soccer unit. Eur. Phys. Educ. Rev. 2016, 22, 411–429. [Google Scholar] [CrossRef]
- Roberts, S.; Fairclough, S. Observational analysis of student activity modes, lesson contexts and teacher interactions during games classes in high school (11–16 years) physical education. Eur. Phys. Educ. Rev. 2011, 17, 255–268. [Google Scholar] [CrossRef]
- Slingerland, M.; Haerens, L.; Cardon, G.; Borghouts, L. Differences in perceived competence and physical activity levels during single-gender modified basketball game play in middle school physical education. Eur. Phys. Educ. Rev. 2014, 20, 20–35. [Google Scholar] [CrossRef]
- Miller, A.; Christensen, E.; Eather, N.; Gray, S.; Sproule, J.; Keay, J.; Lubans, D. Can physical education and physical activity outcomes be developed simultaneously using a game-centered approach? Eur. Phys. Educ. Rev. 2015, 22. [Google Scholar] [CrossRef] [Green Version]
- Mancha, D.; Ibanez, S.J.; Reina, M.; Antunez, A. Comparative study about aerobic and anaerobic endurance for basketball players based on the training methodology. Sport Tk-Rev. Euroam. Cienc. Del Deporte 2017, 6, 183–192. [Google Scholar]
- Corral, J.A.; Del Castillo, O. La valoración del VO2 máx. y su relación con el riesgo cardiovascular como medio de enseñanza-aprendizaje. Cuad. Psicol. Deporte 2010, 10, 25–30. [Google Scholar]
- Kulinna, P.H.; Martin, J.; Lai, Q.; Kliber, A.; Reed, B. Student physical activity patterns: Grade, gender, and activity influences. J. Teach. Phys. Educ. 2003, 22, 298–310. [Google Scholar] [CrossRef] [Green Version]
- Ruiz, L.M.; Graupera, J.L.; Mata, E. Preferencias participativas en Educación Física de los chicos y chicas de educación secundaria mediante la escala GR de participación social en el aprendizaje. Mot. Eur. J. Hum. Mov. 2004, 12, 151–168. [Google Scholar]
- Mesquita, I.; Farias, C.; Hastie, P. The impact of a hybrid Sport Education-Invasion Games Competence Model soccer unit on students decision making, skill execution and overall game performance. Eur. Phys. Educ. Rev. 2012, 18, 205–219. [Google Scholar] [CrossRef] [Green Version]
- Miller, A. Games Centered Approaches in Teaching Children & Adolescents: Systematic Review of Associated Student Outcomes. J. Teach. Phys. Educ. 2015, 34, 36–58. [Google Scholar] [CrossRef]
- Joo, C.H.; Hwang-Bo, K.; Jee, H. Technical and physical activities of small-sided games in young korean soccer players. J. Strength Cond. Res. 2016, 30, 2164–2173. [Google Scholar] [CrossRef] [PubMed]
- Clemente, F.M.; Sarmento, H.; Rabbani, A.; Van der Linden, C.M.I.; Kargarfard, M.; Costa, I.T. Variations of external load variables between medium- and large-sided soccer games in professional players. Res. Sports Med. 2019, 27, 50–59. [Google Scholar] [CrossRef] [PubMed]
- Buchheit, M.; Lacome, M.; Cholley, Y.; Simpson, B. Neuromuscular Responses to Conditioned Soccer Sessions Assessed via GPS-Embedded Accelerometers: Insights Into Tactical Periodization. Int. J. Sports Physiol. Perform. 2018, 13, 577–583. [Google Scholar] [CrossRef] [PubMed]
- Aughey, R.J. Applications of GPS Technologies to Field Sports. Int. J. Sports Physiol. Perform. 2011, 6, 295–310. [Google Scholar] [CrossRef] [Green Version]
- Leser, R.; Schleindlhuber, A.; Lyons, K.; Baca, A. Accuracy of an UWB-based position tracking system used for time-motion analyses in game sports. Eur. J. Sport Sci. 2014, 14, 635–642. [Google Scholar] [CrossRef]
- Boyd, L.J.; Ball, K.; Aughey, R.J. Quantifying External Load in Australian Football Matches and Training Using Accelerometers. Int. J. Sports Physiol. Perform. 2013, 8, 44–51. [Google Scholar] [CrossRef] [Green Version]
- Fox, J.L.; Stanton, R.; Sargent, C.; Wintour, S.A.; Scanlan, A.T. The Association Between Training Load and Performance in Team Sports: A Systematic Review. Sports Med. 2018, 48, 2743–2774. [Google Scholar] [CrossRef]
- Akubat, I.; Barrett, S.; Abt, G. Integrating the Internal and External Training Loads in Soccer. Int. J. Sports Physiol. Perform. 2014, 9, 457–462. [Google Scholar] [CrossRef]
- Strauss, A.; Sparks, M.; Pienaar, C. The Use of GPS Analysis to Quantify the Internal and External Match Demands of Semi-Elite Level Female Soccer Players during a Tournament. J. Sports Sci. Med. 2019, 18, 73–81. [Google Scholar]
- Cummins, C.; Orr, R.; O’Connor, H.; West, C. Global Positioning Systems (GPS) and Microtechnology Sensors in Team Sports: A Systematic Review. Sports Med. 2013, 43, 1025–1042. [Google Scholar] [CrossRef]
- Dempsey, G.M.; Gibson, N.V.; Sykes, D.; Pryjmachuk, B.; Turner, A.P. Match demands of Senior and Junior players during International Rugby League. J. Strength Cond. Res. 2017, 32, 1678–1684. [Google Scholar] [CrossRef] [PubMed] [Green Version]
- Inglés-Bolumar, P.; Pino-Ortega, J.; Bastida-Castillo, A.; Gómez-Carmona, C.D. Análisis Cinemático de las Exigencias en Futbolistas de Categoría Benjamín Mediante un Dispositivo Inercial (WIMU PROTM). Kronos 2018, 17, 1–11. [Google Scholar]
- Hulin, B.T.; Gabbett, T.J.; Johnston, R.D.; Jenkins, D.G. Wearable microtechnology can accurately identify collision events during professional rugby league match-play. J. Sci. Med. Sport 2017, 20, 638–642. [Google Scholar] [CrossRef] [PubMed] [Green Version]
- Raper, D.P.; Witchalls, J.; Philips, E.J.; Knight, E.; Drew, M.K.; Waddington, G. Use of a tibial accelerometer to measure ground reaction force in running: A reliability and validity comparison with force plates. J. Sci. Med. Sport 2018, 21, 84–88. [Google Scholar] [CrossRef] [PubMed]
- Ibáñez, S.J.; Feu, S.; Cañadas, M. Sistema integral para el análisis de las tareas de entrenamiento, SIATE, en deportes de invasión. E-balonmano.com Revista de Ciencias del Deporte 2016, 12, 3–30. [Google Scholar]
- Datson, N.; Hulton, A.; Andersson, H.; Lewis, T.; Weston, M.; Drust, B.; Gregson, W. Applied Physiology of Female Soccer: An Update. Sports Med. 2014, 44, 1225–1240. [Google Scholar] [CrossRef] [Green Version]
- Borg, G. Borg’s Perceived Exertion and Pain Scales; Human Kinetics: Champaign, IL, USA, 1998. [Google Scholar]
- Jeong, T.S.; Reilly, T.; Morton, J.; Bae, S.W.; Drust, B. Quantification of the physiological loading of one week of “pre-season” and one week of “in-season” training in professional soccer players. J. Sports Sci. 2011, 29, 1161–1166. [Google Scholar] [CrossRef]
- Lovell, T.W.J.; Sirotic, A.C.; Impellizzeri, F.M.; Coutts, A.J. Factors Affecting Perception of Effort (Session Rating of Perceived Exertion) During Rugby League Training. Int. J. Sports Physiol. Perform. 2013, 8, 62–69. [Google Scholar] [CrossRef] [Green Version]
- Reina, M.; Mancha-Triguero, D.; García-Santos, D.; García-Rubio, J.; Ibáñez, S.J. Comparación de tres métodos de cuantificación de la carga de entrenamiento en baloncesto. RICYDE. Rev. Int. de Ciencias del Deporte 2019, 58, 368–382. [Google Scholar] [CrossRef]
- Gómez-Carmona, C.D.; Gamonales, J.M.; Feu, S.; Ibáñez, S.J. Estudio de la carga interna y externa a través de diferentes instrumentos. Un estudio de casos en fútbol formativo. Sportis 2019, 5, 444–468. [Google Scholar] [CrossRef] [Green Version]
- Bravo-Sanchez, A.; Abian-Vicen, J.; Abian, P. Analysis of the physical and technical differences between 7-a-side and 8-a-side game modalities in official under 12 soccer matches. Int. J. Perform. Anal. Sport 2017, 17, 545–554. [Google Scholar] [CrossRef]
- Rojas-Inda, S. Análisis de carga interna y externa de futbolistas jóvenes en juegos reducidos/Analysis of Internal and External Load in Small Games in Young Football Players. Revista Int. de Med. y Cienc. de la Act. Física y del Deporte 2018, 18, 463–477. [Google Scholar] [CrossRef]
- Gómez-Carmona, C.D.; Gamonales, J.M.; Pino-Ortega, J.; Ibáñez, S.J. Comparative Analysis of Load Profile between Small-Sided Games and Official Matches in Youth Soccer Players. Sports 2018, 6, 173. [Google Scholar] [CrossRef] [PubMed] [Green Version]
- Ato, M.; López, J.J.; Benavente, A. Un sistema de clasificación de los diseños de investigación en psicología. An. de Psicol. 2013, 29, 1038–1059. [Google Scholar] [CrossRef] [Green Version]
- García-Ceberino, J.M.; Feu, S.; Ibáñez, S.J. Comparative Study of Two Intervention Programmes for Teaching Soccer to School-Age Students. Sports 2019, 7, 74. [Google Scholar] [CrossRef] [Green Version]
- García-Ceberino, J.M.; Antúnez, A.; Feu, S.; Ibánez, S.J. Validación de dos programas de intervención para la enseñanza del fútbol escolar/Validation of Two Intervention Programs for Teaching School Soccer. Revista Internacional de Medicina y Ciencias de la Actividad Física y el Deporte 2020, in press. [Google Scholar]
- Schelling, X.; Torres-Ronda, L. An Integrative Approach to Strength and Neuromuscular Power Training for Basketball. Strength Cond. J. 2016, 38, 72–80. [Google Scholar] [CrossRef]
- Tanaka, H.; Monahan, K.D.; Seals, D.R. Age-predicted maximal heart rate revisited. J. Am. Coll. Cardiol. 2001, 37, 153–156. [Google Scholar] [CrossRef] [Green Version]
- Reina, M.; García-Rubio, J.; Feu, S.; Ibanez, S.J. Training and Competition Load Monitoring and Analysis of Women’s Amateur Basketball by Playing Position: Approach Study. Front. Psychol. 2019, 9, 2689. [Google Scholar] [CrossRef] [Green Version]
- Bastida Castillo, A.; Gomez Carmona, C.D.; De la cruz Sanchez, E.; Pino Ortega, J. Accuracy, intra- and inter-unit reliability, and comparison between GPS and UWB-based position-tracking systems used for time-motion analyses in soccer. Eur. J. Sport Sci. 2018, 18, 450–457. [Google Scholar] [CrossRef]
- Hernandez-Belmonte, A.; Bastida-Castillo, A.; Gomez-Carmona, C.D.; Pino-Ortega, J. Validity and reliability of an inertial device (WIMU PRO (TM)) to quantify physical activity level through steps measurement. J. Sports Med. Phys. Fit. 2019, 59, 587–592. [Google Scholar] [CrossRef]
- Eston, R.G.; Parfitt, C.G. Effort Perception. In Paediatric Exercise Physiology; Armstrong, N., Ed.; Elsevier: London, UK, 2007; pp. 275–297. [Google Scholar]
- Field, A. Discovering Statistics Using SPSS; Sage Publications: London, UK, 2009. [Google Scholar]
- Lenhard, W.; Lenhard, A. Calculation of Effect Sizes; Psychometrica: Bibergau, Germany, 2016. [Google Scholar]
- Ballesta, A.S.; Abrunedo, J.; Caparros, T. Accelerometry in Basketball. Study of External Load during Training. Apunt. Educ. Fis. Deportes 2019, 100–117. [Google Scholar] [CrossRef]
- Gaudino, P.; Alberti, G.; Iaia, F.M. Estimated metabolic and mechanical demands during different small-sided games in elite soccer players. Hum. Mov. Sci. 2014, 36, 123–133. [Google Scholar] [CrossRef] [PubMed]
- Akenhead, R.; Hayes, P.R.; Thompson, K.G.; French, D. Diminutions of acceleration and deceleration output during professional football match play. J. Sci. Med. Sport 2013, 16, 556–561. [Google Scholar] [CrossRef] [PubMed]
- Dwyer, D.B.; Gabbett, T.J. Global Positioning System Data Analysis: Velocity Ranges and a New Definition of Sprinting for Field Sport Athletes. J. Strength Cond. Res. 2012, 26, 818–824. [Google Scholar] [CrossRef] [PubMed]
- Sampaio, J.; McGarry, T.; Calleja-González, J.; Sáiz, S.J.; Schelling, X.; Balciunas, M. Exploring game performance in the National Basketball Association using player tracking data. PLoS ONE 2015, 10. [Google Scholar] [CrossRef] [Green Version]
- Clemente, F.M.; Praça, G.; Bredt, S.; van der Linden, C.M.I.; Serra-Olivares, J. External load variations between medium- and large-sided soccer games: Ball possession games vs regular games with small goals. J. Hum. Kinet. 2019, 191–198. [Google Scholar] [CrossRef] [Green Version]
- Ingebrigtsen, J.; Dalen, T.; Hjelde, G.H.; Drust, B.; Wisloff, U. Acceleration and sprint profiles of a profesional elite football team in match play. Eur. J. Sport Sci. 2014, 15, 101–110. [Google Scholar] [CrossRef]
- Torres-Ronda, L.; Gonçalves, B.; Marcelino, R.; Torrents, C.; Vicente, E.; Sampaio, J. Heart rate, time-motion, and body impacts when changing the number of teammates and opponents in soccer small-sided games. J. Strength Cond. Res. 2015, 29, 2723–2730. [Google Scholar] [CrossRef]
- McKenzie, T.L.; Marshall, S.J.; Sallis, J.F.; Conway, T.L. Student activity levels, lesson context, and teacher behavior during middle school physical education. Res. Q. Exerc. Sport 2000, 71, 249–259. [Google Scholar] [CrossRef]


| Study Variables | Application of the Programs (Sessions) | Pre and Post (Assessment Tests) | |||||||||||||
|---|---|---|---|---|---|---|---|---|---|---|---|---|---|---|---|
| K-S | Rachas | Levene | Test | K-S | Rachas | Levene | Test | ||||||||
| Kinematic eTL | dis(m) | 0.000 | * | 0.000 | * | 0.000 | * | N-P | 0.200 a | 0.001 | * | 0.186 | N-P | ||
| m/min | 0.036 | * | 0.000 | * | 0.276 | N-P | 0.021 | * | 0.001 | * | 0.050 | N-P | |||
| Nacc | 0.008 | * | 0.000 | * | 0.709 | N-P | 0.200 a | 0.123 | 0.008 | * | N-P | ||||
| acc/min | 0.036 | * | 0.000 | * | 0.000 | * | N-P | 0.200 a | 0.004 | * | 0.149 | N-P | |||
| Ndec | 0.009 | * | 0.000 | * | 0.689 | N-P | 0.200 a | 0.174 | 0.009 | * | N-P | ||||
| dec/min | 0.048 | * | 0.000 | * | 0.000 | * | N-P | 0.200 a | 0.014 | * | 0.151 | NP | |||
| MAX Speed | 0.002 | * | 0.000 | * | 0.000 | * | N-P | 0.200 a | 0.324 | 0.927 | P | ||||
| AVG Speed | 0.058 | 0.000 | * | 0.389 | N-P | 0.019 | * | 0.031 | * | 0.717 | N-P | ||||
| HIA% | 0.000 | * | - | 0.147 | N-P | 0.000 | * | - | 0.050 | N-P | |||||
| walk% | 0.009 | * | 0.000 | * | 0.002 | * | N-P | 0.200 a | 0.324 | 0.720 | P | ||||
| jog% | 0.186 | 0.000 | * | 0.435 | N-P | 0.096 | 0.006 | * | 0.278 | N-P | |||||
| run% | 0.000 | * | 0.000 | * | 0.312 | N-P | 0.000 | * | 0.114 | 0.038 | * | N-P | |||
| sprint% | 0.000 | * | - | 0.001 | * | N-P | 0.000 | * | - | 0.585 | N-P | ||||
| Nsprints | 0.000 | * | - | 0.000 | * | N-P | 0.000 | * | - | 0.651 | N-P | ||||
| Nsteps | 0.000 | * | 0.000 | * | 0.052 | N-P | 0.004 | * | 0.000 | * | 0.013 | * | N-P | ||
| steps/min | 0.000 | * | 0.000 | * | 0.994 | N-P | 0.001 | * | 0.000 | * | 0.006 | * | N-P | ||
| Njumps | 0.000 | * | - | 0.030 | * | N-P | 0.000 | * | - | 0.047 | * | N-P | |||
| jumps/min | 0.000 | * | 0.003 | * | 0.189 | N-P | 0.000 | * | 0.000 | * | 0.026 | * | N-P | ||
| Neuromus-cular eTL | Nimpacts | 0.000 | * | 0.000 | * | 0.145 | N-P | 0.009 | * | 0.000 | * | 0.506 | N-P | ||
| PL | 0.000 | * | 0.000 | * | 0.057 | N-P | 0.200 a | 0.000 | * | 0.412 | N-P | ||||
| PL/min | 0.000 | * | 0.000 | * | 0.756 | N-P | 0.200 a | 0.000 | * | 0.366 | N-P | ||||
| iTL | HRmax | 0.000 | * | 0.040 | * | 0.690 | N-P | 0.000 | * | 0.019 | * | 0.023 | * | N-P | |
| AVG HR | 0.000 | * | 0.143 | 0.373 | N-P | 0.000 | * | 0.370 | 0.085 | N-P | |||||
| rel HR% | 0.000 | * | 0.143 | 0.373 | N-P | 0.000 | * | 0.370 | 0.085 | N-P | |||||
| 50–60% HR | 0.000 | * | - | 0.000 | * | N-P | 0.000 | * | - | 0.124 | N-P | ||||
| 60–70% HR | 0.000 | * | 0.112 | 0.138 | N-P | 0.000 | * | - | 0.084 | N-P | |||||
| 70–80% HR | 0.000 | * | 0.007 | * | 0.001 | * | N-P | 0.000 | * | 0.369 | 0.392 | N-P | |||
| 80–90% HR | 0.000 | * | 0.640 | 0.000 | * | N-P | 0.000 | * | 0.618 | 0.002 | * | N-P | |||
| 90–95% HR | 0.000 | * | 0.003 | * | 0.000 | * | N-P | 0.000 | * | 0.549 | 0.583 | N-P | |||
| 95–200% HR | 0.000 | * | 0.004 | * | 0.191 | N-P | 0.000 | * | 0.764 | 0.037 | * | N-P | |||
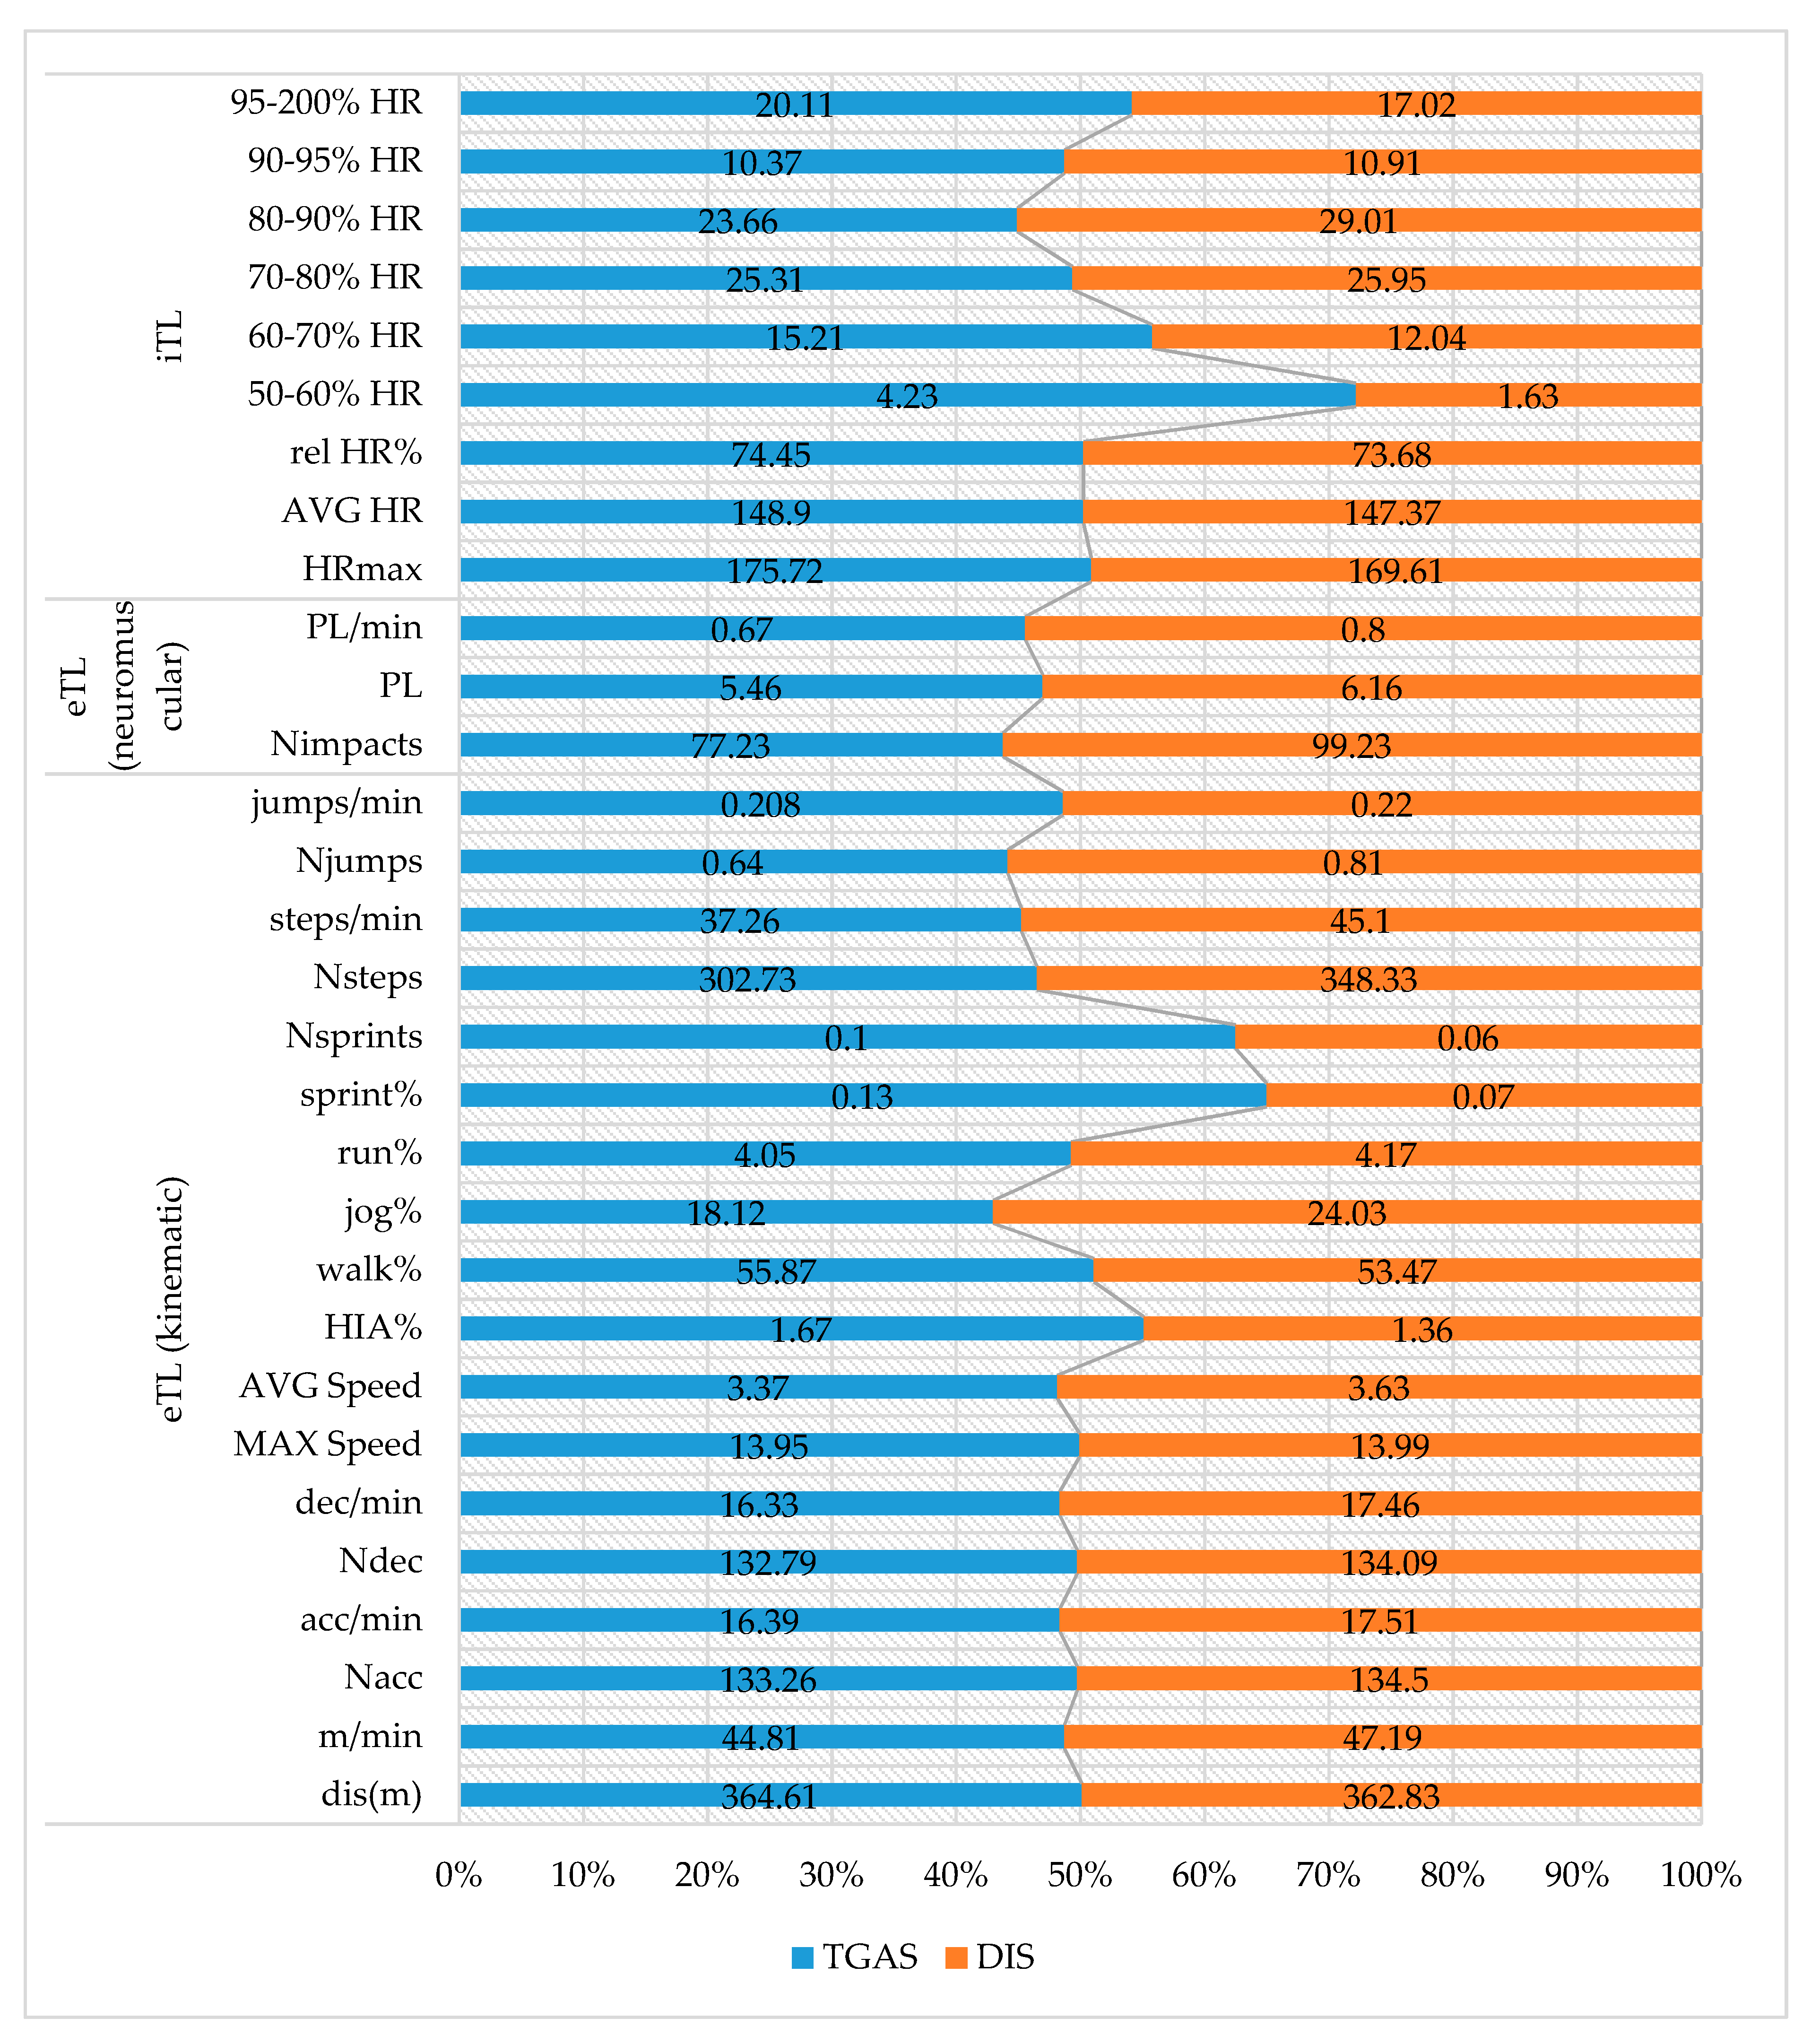
| Study Variables | TGAS/ M ± SD | DIS/ M ± SD | U | p | dCohen | ||
|---|---|---|---|---|---|---|---|
| Kinematic eTL | dis(m) | 364.61 ± 143.44 | 362.83 ± 113.16 | 145,025.000 | 0.630 | 0.029 | |
| m/min | 44.81 ± 13.82 | 47.19 ± 13.55 | 133,634.500 | 0.007 | * | 0.163 | |
| Nacc | 133.26 ± 57.68 | 134.50 ± 55.93 | 146,650.000 | 0.867 | 0.010 | ||
| acc/min | 16.39 ± 6.02 | 17.51 ± 7.04 | 137,734.500 | 0.059 | 0.115 | ||
| Ndec | 132.79 ± 57.82 | 134.09 ± 56.14 | 146,566.500 | 0.854 | 0.011 | ||
| dec/min | 16.33 ± 6.05 | 17.46 ± 7.07 | 137,679.500 | 0.057 | 0.115 | ||
| MAX Speed | 13.95 ± 3.33 | 13.99 ± 2.58 | 142,996.500 | 0.382 | 0.053 | ||
| AVG Speed | 3.37 ± 0.73 | 3.63 ± 0.73 | 120,076.000 | 0.000 | * | 0.326 | |
| HIA% | 1.67 ± 2.82 | 1.36 ± 2.98 | 134,827.000 | 0.005 | * | 0.149 | |
| walk% | 55.87 ± 13.28 | 53.47 ± 14.35 | 134,603.000 | 0.013 | * | 0.152 | |
| jog% | 18.12 ± 10.60 | 24.03 ± 10.70 | 102,498.000 | 0.000 | * | 0.547 | |
| run% | 4.05 ± 4.45 | 4.17 ± 5.05 | 146,777.500 | 0.885 | 0.009 | ||
| sprint% | 0.13 ± 0.52 | 0.07 ± 0.51 | 140,593.500 | 0.004 | * | 0.081 | |
| Nsprints | 0.10 ± 0.30 | 0.06 ± 0.23 | 140,788.000 | 0.005 | * | 0.079 | |
| Nsteps | 302.73 ± 176.90 | 348.33 ± 158.03 | 118,470.500 | 0.000 | * | 0.345 | |
| steps/min | 37.26 ± 19.72 | 45.10 ± 19.70 | 111,538.500 | 0.000 | * | 0.431 | |
| Njumps | 0.64 ± 1.00 | 0.81 ± 1.18 | 135,990.000 | 0.013 | * | 0.135 | |
| jumps/min | 0.21 ± 0.14 | 0.23 ± 0.15 | 24,354.500 | 0.094 | 0.155 | ||
| Neuromus-cular eTL | Nimpacts | 77.23 ± 62.07 | 99.23 ± 69.79 | 114,177.500 | 0.000 | * | 0.398 |
| PL | 5.46 ± 2.56 | 6.16 ± 2.32 | 119,110.500 | 0.000 | * | 0.338 | |
| PL/min | 0.67 ± 0.28 | 0.80 ± 0.28 | 108,586.500 | 0.000 | * | 0.469 | |
| iTL | HRmax | 175.72 ± 21.16 | 169.61 ± 24.07 | 115,053.500 | 0.000 | * | 0.233 |
| AVG HR | 148.90 ± 20.78 | 147.37 ± 22.04 | 131,202.500 | 0.730 | 0.021 | ||
| rel HR% | 74.45 ± 10.39 | 73.68 ± 11.02 | 131,202.500 | 0.730 | 0.021 | ||
| 50–60% HR | 4.23 ± 12.09 | 1.63 ± 6.18 | 120,060.500 | 0.000 | * | 0.167 | |
| 60–70% HR | 15.21 ± 19.55 | 12.04 ± 19.48 | 115,351.500 | 0.000 | * | 0.229 | |
| 70–80% HR | 25.31 ± 19.73 | 25.95 ± 23.07 | 130,436.000 | 0.613 | 0.031 | ||
| 80–90% HR | 23.66 ± 17.16 | 29.01 ± 22.97 | 118,374.500 | 0.002 | * | 0.189 | |
| 90–95% HR | 10.37 ± 10.88 | 10.91 ± 13.57 | 128,038.500 | 0.309 | 0.063 | ||
| 95–200% HR | 20.11 ± 26.54 | 17.02 ± 26.29 | 118,988.000 | 0.003 | * | 0.181 | |
| Study Variables | Boys/ M ± SD | Girls/ M ± SD | U/t | p | dCohen | ||
|---|---|---|---|---|---|---|---|
| Kinematic eTL | dis(m) | 289.31 ± 64.04 | 275.37 ± 70.80 | 18,225.500 a | 0.017 | * | 0.236 |
| m/min | 55.11 ± 12.35 | 52.78 ± 13.24 | 18,681.000 a | 0.046 | * | 0.198 | |
| Nacc | 126.93 ± 28.64 | 117.42 ± 26.40 | 17,199.000 a | 0.001 | * | 0.322 | |
| acc/min | 24.13 ± 5.17 | 22.54 ± 5.05 | 17,629.500 a | 0.004 | * | 0.286 | |
| Ndec | 126.75 ± 28.67 | 117.28 ± 26.40 | 17,220.000 a | 0.001 | * | 0.321 | |
| dec/min | 24.09 ± 5.18 | 22.52 ± 5.05 | 17,648.500 a | 0.004 | * | 0.284 | |
| MAX Speed | 14.67 ± 2.65 | 13.61 ± 2.62 | 4.081 b | 0.000 | * | 0.403 | |
| AVG Speed | 3.59 ± 0.56 | 3.38 ± 0.55 | 16,606.500 a | 0.000 | * | 0.373 | |
| HIA% | 1.73 ± 2.74 | 1.34 ± 2.56 | 18,835.000 a | 0.034 | * | 0.185 | |
| walk% | 62.71 ± 9.31 | 65.20 ± 8.94 | -2.757 b | 0.006 | * | 0.272 | |
| jog% | 22.23 ± 8.64 | 18.88 ± 7.96 | 16,284.000 a | 0.000 | * | 0.401 | |
| run% | 4.62 ± 4.02 | 3.56 ± 4.09 | 17,045.500 a | 0.001 | * | 0.335 | |
| sprint% | 0.16 ± 0.60 | 0.02 ± 0.13 | 19,249.000 a | 0.001 | * | 0.151 | |
| Nsprints | 0.12 ± 0.34 | 0.03 ± 0.17 | 19,283.000 a | 0.001 | * | 0.148 | |
| Nsteps | 287.74 ± 97.03 | 238.06 ± 93.26 | 14,885.000 a | 0.000 | * | 0.525 | |
| steps/min | 54.87 ± 19.01 | 45.73 ± 18.32 | 15,159.000 a | 0.000 | * | 0.500 | |
| Njumps | 0.72 ± 0.99 | 0.63 ± 0.92 | 20,067.000 a | 0.342 | 0.084 | ||
| jumps/min | 0.31 ± 0.17 | 0.30 ± 0.16 | 3717.000 a | 0.580 | 0.080 | ||
| Neuromus-cular eTL | Nimpacts | 87.68 ± 50.75 | 56.66 ± 33.61 | 13,196.000 a | 0.000 | * | 0.682 |
| PL | 5.06 ± 1.45 | 3.91 ± 1.20 | 10,942.500 a | 0.000 | * | 0.912 | |
| PL/min | 0.96 ± 0.29 | 0.75 ± 0.24 | 11,360.500 a | 0.000 | * | 0.867 | |
| iTL | HRmax | 185.42 ± 28.24 | 182.25 ± 23.70 | 17,509.000 a | 0.024 | * | 0.227 |
| AVG HR | 163.54 ± 26.47 | 162.18 ± 22.78 | 19,024.000 a | 0.337 | 0.096 | ||
| rel HR% | 81.77 ± 13.24 | 81.09 ± 11.39 | 19,024.000 a | 0.337 | 0.096 | ||
| 50–60% HR | 1.10 ± 6.10 | 0.36 ± 2.33 | 19,451.500 a | 0.133 | 0.059 | ||
| 60–70% HR | 6.02 ± 15.31 | 5.08 ± 15.34 | 18,382.500 a | 0.50 | 0.151 | ||
| 70–80% HR | 13.77 ± 16.92 | 12.85 ± 18.51 | 18,494.500 a | 0.143 | 0.141 | ||
| 80–90% HR | 17.93 ± 16.92 | 23.21 ± 18.13 | 16,433.500 a | 0.001 | * | 0.322 | |
| 90–95% HR | 12.20 ± 11.43 | 14.24 ± 12.34 | 18,452.500 a | 0.146 | 0.145 | ||
| 95–200% HR | 46.14 ± 34.42 | 41.86 ± 32.85 | 18,541.000 a | 0.168 | 0.137 | ||
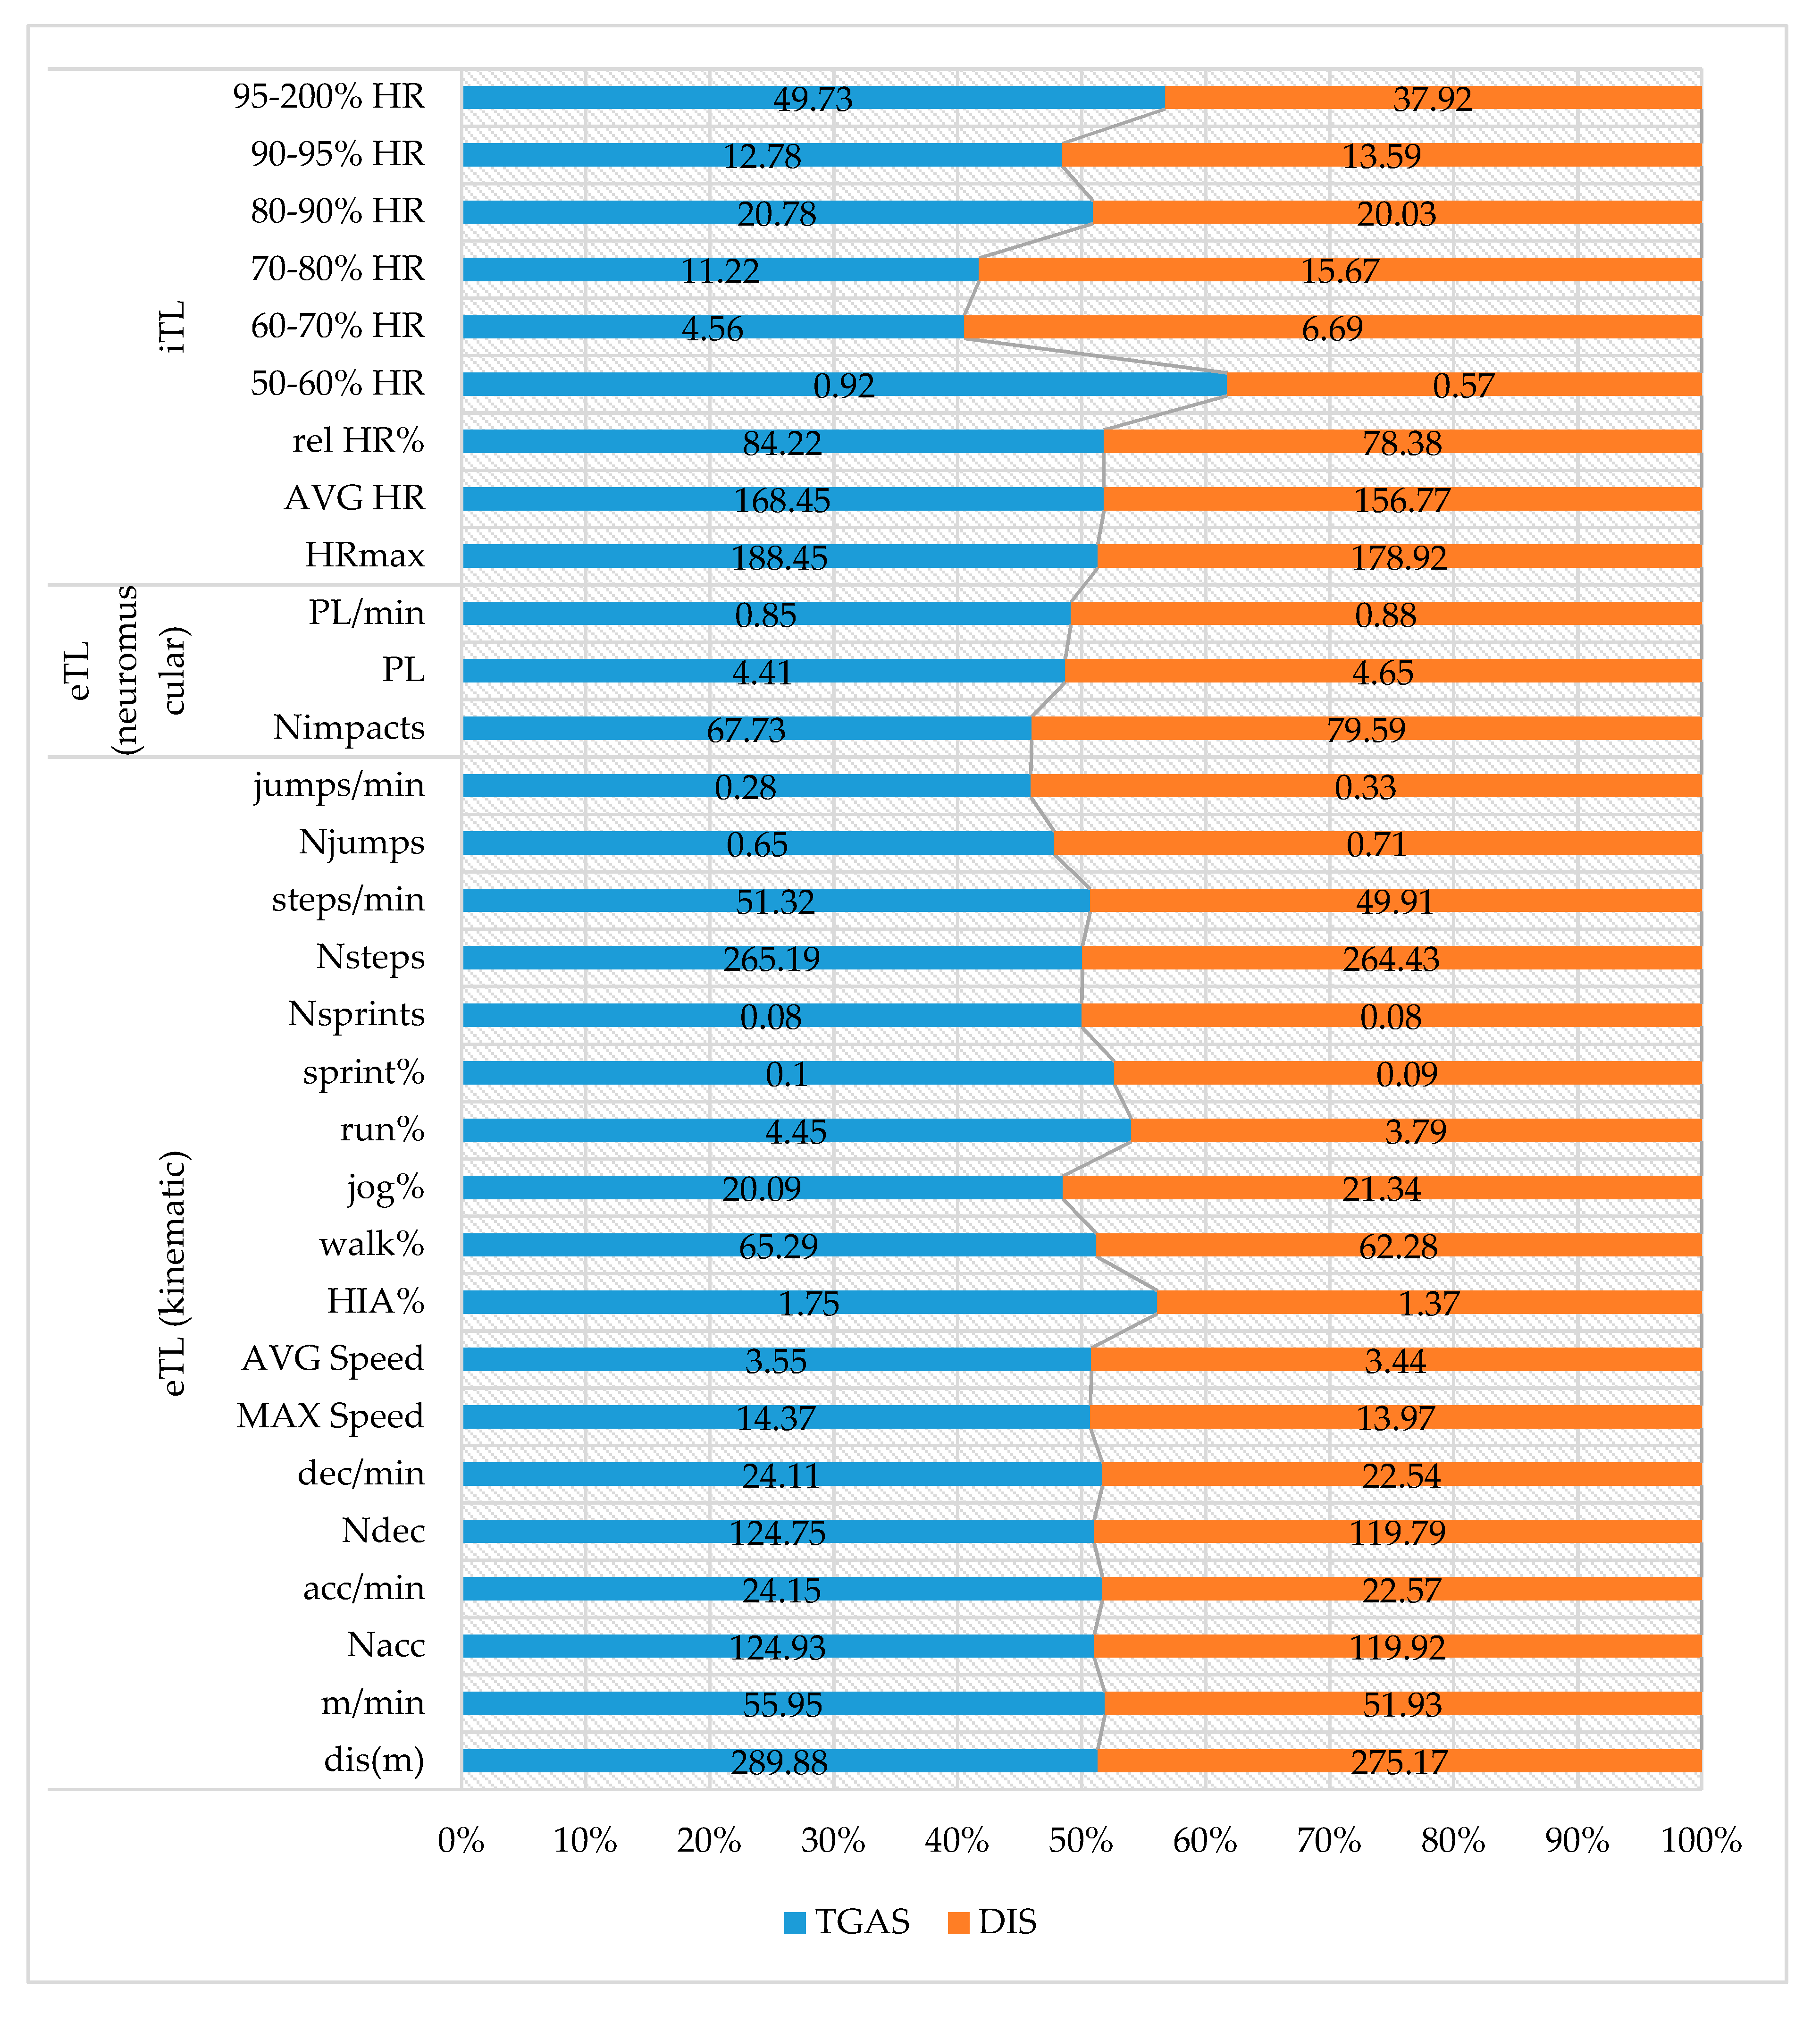
| Study Variables | TGAS/ M ± SD | DIS/ M ± SD | U/t | p | dCohen | ||
|---|---|---|---|---|---|---|---|
| Kinematic eTL | dis(m) | 289.88 ± 69.03 | 275.17 ± 65.12 | 19,081.500 a | 0.084 | 0.171 | |
| m/min | 55.95 ± 13.20 | 51.93 ± 12.03 | 17,845.500 a | 0.006 | * | 0.274 | |
| Nacc | 124.93 ± 23.63 | 119.92 ± 32.00 | 18,948.000 a | 0.066 | 0.182 | ||
| acc/min | 24.15 ± 4.69 | 22.57 ± 5.55 | 17,921.500 a | 0.007 | * | 0.267 | |
| Ndec | 124.75 ± 23.64 | 119.79 ± 32.02 | 18,947.500 a | 0.066 | 0.182 | ||
| dec/min | 24.11 ± 4.69 | 22.54 ± 5.55 | 17,960.000 a | 0.008 | * | 0.264 | |
| MAX Speed | 14.37 ± 2.62 | 13.97 ± 2.74 | 1.517 b | 0.130 | 0.150 | ||
| AVG Speed | 3.55 ± 0.54 | 3.44 ± 0.58 | 19,367.500 a | 0.136 | 0.147 | ||
| HIA% | 1.75 ± 2.85 | 1.37 ± 2.43 | 19,981.000 a | 0.265 | 0.097 | ||
| walk% | 65.29 ± 9.03 | 62.29 ± 9.18 | 3.341 b | 0.001 | * | 0.330 | |
| jog% | 20.09 ± 8.14 | 21.34 ± 8.83 | 18,809.500 a | 0.051 | 0.193 | ||
| run% | 4.45 ± 4.37 | 3.79 ± 3.72 | 19,674.500 a | 0.214 | 0.122 | ||
| sprint% | 0.10 ± 0.40 | 0.09 ± 0.50 | 20,901.000 a | 0.634 | 0.022 | ||
| Nsprints | 0.08 ± 0.27 | 0.08 ± 0.28 | 20,925.000 a | 0.664 | 0.020 | ||
| Nsteps | 265.19 ± 105.97 | 264.43 ± 89.51 | 20,257.500 a | 0.451 | 0.074 | ||
| steps/min | 51.32 ± 21.00 | 49.91 ± 17.09 | 21,022.500 a | 0.904 | 0.012 | ||
| Njumps | 0.65 ± 0.87 | 0.71 ± 1.05 | 21,132.000 a | 0.973 | 0.003 | ||
| jumps/min | 0.28 ± 0.14 | 0.33 ± 0.19 | 3324.000 a | 0.065 | 0.270 | ||
| Neuromus-cular eTL | Nimpacts | 67.73 ± 44.49 | 79.59 ± 47.56 | 17,509.500 a | 0.002 | * | 0.302 |
| PL | 4.41 ± 1.48 | 4.65 ± 1.42 | 17,616.500 a | 0.003 | * | 0.293 | |
| PL/min | 0.85 ± 0.29 | 0.88 ± 0.28 | 18,593.000 a | 0.033 | * | 0.211 | |
| iTL | HRmax | 188.45 ± 20.22 | 178.92 ± 30.82 | 16,826.500 a | 0.004 | * | 0.288 |
| AVG HR | 168.45 ± 20.31 | 156.77 ± 27.70 | 14,814.500 a | 0.000 | * | 0.470 | |
| rel HR% | 84.22 ± 10.16 | 78.38 ± 13.85 | 14,814.500 a | 0.000 | * | 0.470 | |
| 50–60% HR | 0.92 ± 5.84 | 0.57 ± 3.04 | 19,667.000 a | 0.292 | 0.041 | ||
| 60–70% HR | 4.56 ± 13.46 | 6.69 ± 17.09 | 17,316.000 a | 0.002 | * | 0.245 | |
| 70–80% HR | 11.22 ± 18.41 | 15.67 ± 16.56 | 14,783.500 a | 0.000 | * | 0.473 | |
| 80–90% HR | 20.78 ± 19.34 | 20.03 ± 15.68 | 19,830.000 a | 0.782 | 0.027 | ||
| 90–95% HR | 12.78 ± 11.57 | 13.59 ± 12.27 | 19,546.500 a | 0.603 | 0.052 | ||
| 95–200% HR | 49.73 ± 34.97 | 37.92 ± 31.20 | 16,226.000 a | 0.001 | * | 0.341 | |
| Gender | Boys/M ± SD | Girls/M ± SD | t | df | p | dCohen | |
| Pretest | 3.12 ± 1.15 | 3.09 ± 1.43 | 0.071 | 36 | 0.944 | 0.023 | |
| Posttest | 2.81 ± 0.76 | 2.30 ± 0.77 | 2.041 | 36 | 0.049 | * | 0.666 |
| Methodology | TGAS/M ± SD | DIS/M ± SD | t | df | p | dCohen | |
| Pretest | 2.66 ± 1.39 | 3.56 ± 0.96 | 2.308 | 36 | 0.027 | * | 0.749 |
| Posttest | 2.21 ± 0.91 | 2.92 ± 0.50 | 3.034 | 36 | 0.004 | * | 0.986 |
© 2020 by the authors. Licensee MDPI, Basel, Switzerland. This article is an open access article distributed under the terms and conditions of the Creative Commons Attribution (CC BY) license (http://creativecommons.org/licenses/by/4.0/).
Share and Cite
García-Ceberino, J.M.; Antúnez, A.; Feu, S.; Ibáñez, S.J. Quantification of Internal and External Load in School Football According to Gender and Teaching Methodology. Int. J. Environ. Res. Public Health 2020, 17, 344. https://0-doi-org.brum.beds.ac.uk/10.3390/ijerph17010344
García-Ceberino JM, Antúnez A, Feu S, Ibáñez SJ. Quantification of Internal and External Load in School Football According to Gender and Teaching Methodology. International Journal of Environmental Research and Public Health. 2020; 17(1):344. https://0-doi-org.brum.beds.ac.uk/10.3390/ijerph17010344
Chicago/Turabian StyleGarcía-Ceberino, Juan M., Antonio Antúnez, Sebastián Feu, and Sergio J. Ibáñez. 2020. "Quantification of Internal and External Load in School Football According to Gender and Teaching Methodology" International Journal of Environmental Research and Public Health 17, no. 1: 344. https://0-doi-org.brum.beds.ac.uk/10.3390/ijerph17010344