Child Nutrition Trends Over the Past Two Decades and Challenges for Achieving Nutrition SDGs and National Targets in China

Abstract
:1. Introduction
2. Materials and Methods
2.1. Source of Data
2.2. Child Nutrition-Related Indicators
2.3. Statistical Analysis
3. Results
3.1. Status, Trends and Sex/regional Disparities of Child Nutrition Indicators
3.1.1. Undernutrition of Children Under 5 Years Old
3.1.2. Overweight and Obesity of Children Aged 1–4 Years Old
3.1.3. EBF of Infants under 6 Months and Newborns Aged 7–28 days
3.1.4. Low Birthweight
3.2. Gaps in Achieving Nutrition-Related SDGs and National Nutrition Targets in China
4. Discussion
5. Conclusions
Supplementary Materials
Author Contributions
Funding
Acknowledgments
Conflicts of Interest
References
- Black, R.E.; Victora, C.G.; Walker, S.P.; Bhutta, Z.A.; Christian, P.; de Onis, M.; Ezzati, M.; Grantham-McGregor, S.; Katz, J.; Martorell, R.; et al. Maternal and child undernutrition and overweight in low-income and middle-income countries. Lancet 2013, 382, 427–451. [Google Scholar] [CrossRef]
- WHO. Global Nutrition Policy Review 2016–2017. Available online: https://apps.who.int/iris/bitstream/handle/10665/275990/9789241514873-eng.pdf?ua=1 (accessed on 5 August 2019).
- International Food Policy Research Institute (IFPRI). Global Nutrition Report 2016: From Promise to Impact: Ending Malnutrition by 2030; IFPRI: Washington, DC, USA, 2016. [Google Scholar]
- United Nations Children’s Fund. Progress for Children: Beyond Averages—Learning from the MDGs. Working Papers. 2015. Available online: https://data.unicef.org/resources/progress-children-report/ (accessed on 5 August 2019).
- United Nations Children’s Fund; World Health Organization; World Bank. Levels and Trends in Child Malnutrition: UNICEF-WHO-The World Bank Joint Malnutrition Estimates, September 2014; UNICEF: New York, NY, USA; WHO: Geneva, Switzerland; World Bank: Washington, DC, USA, 2014. [Google Scholar]
- United Nations. Sustainable Development Goals, Goal 2: Zero Hunger. Available online: https://www.un.org/sustainabledevelopment/ (accessed on 6 August 2019).
- Chang, J.L. Comprehensive Monitoring Report on the Nutritional and Health Status of Chinese Residents (2010–2013); Peking University Medical Press: Beijing, China, 2016. [Google Scholar]
- Ministry of Foreign Affairs of the People’s Republic of China. China’s National Plan on Implementation of the 2030 Agenda for Sustainable Development. Available online: https://www.fmprc.gov.cn/web/zyxw/t1405173.shtml (accessed on 5 August 2019).
- State Council of the People’s Republic of China. Chinese Children’s Development Program 2011–2020. Available online: http://www.scio.gov.cn/ztk/xwfb/46/11/Document/976030/976030_1.htm (accessed on 5 August 2019).
- State Council of the People’s Republic of China. National Nutrition Plan 2017–2030. Available online: http://www.gov.cn/zhengce/content/2017-07/13/content_5210134.htm (accessed on 5 August 2019).
- About GBD. Available online: http://www.healthdata.org/gbd/about (accessed on 10 July 2019).
- Zhao, L.Y.; Ma, G.S.; Piao, J.H.; Zhang, J.; Yu, D.M.; He, Y.N.; Huo, J.S.; Hu, X.Q.; Yang, Z.Y.; Yang, X.G. Scheme of the 2010–2012 Chinese Nutrition and Health Surveillance. Chin. J. Prev. Med. 2016, 50, 204–207. [Google Scholar] [CrossRef]
- GBD 2016 SDG Collaborators. Measuring progress and projecting attainment on the basis of past trends of the health-related Sustainable Development Goals in 188 countries: An analysis from the Global Burden of Disease Study 2016. Lancet 2017, 390, 1423–1459. [Google Scholar] [CrossRef] [Green Version]
- Yang, X.G.; Kong, L.Z.; Zhai, F.Y.; Ma, G.S.; Jin, S.G. The overall scheme of the Chinese national nutrition and health survey. Chin. J. Epidemiol. 2005, 26, 471–474. [Google Scholar] [CrossRef]
- McGuire, S. World Health Organization. Comprehensive Implementation Plan on Maternal, Infant, and Young Child Nutrition. Geneva, Switzerland, 2014. Adv. Nutr. 2015, 6, 134–135. [Google Scholar] [CrossRef] [Green Version]
- National Health and Family Planning Commission Statistical Information Center. China Health Statistics Yearbook 2013. Available online: https://www.doc88.com/p-7069828452056.html (accessed on 5 August 2019).
- Zong, X.N.; Li, H.; Zhang, Y.Q.; Wu, H.H. Child nutrition to new stage in China: Evidence from a series of national surveys, 1985–2015. BMC Public Health 2019, 19, 402. [Google Scholar] [CrossRef] [PubMed]
- De Onis, M.; Blossner, M.; Borghi, E.; Frongillo, E.A.; Morris, R. Estimates of global prevalence of childhood underweight in 1990 and 2015. JAMA 2004, 291, 2600. [Google Scholar] [CrossRef] [PubMed] [Green Version]
- WHO. Childhood Stunting: Challenges and Opportunities; Report of a Promoting Healthy Growth and Preventing Childhood Stunting Colloquium; World Health Organization: Geneva, Switzerland, 2014; Available online: https://www.who.int/news-room/events/detail/2013/10/14/default-calendar/childhood-stunting-challenges-and-opportunities (accessed on 1 February 2020).
- Luo, J.; Hu, F.B. Time trends of obesity in preschool children in China from 1989 to 1997. Int. J. Obes. 2002, 26, 553–558. [Google Scholar] [CrossRef] [PubMed] [Green Version]
- Kipping, R.R.; Jago, R.; Lawlor, D.A. Obesity in children. Part 1: Epidemiology, measurement, risk factors, and screening. BMJ 2008, 337, a1824. [Google Scholar] [CrossRef] [PubMed]
- Han, J.C.; Lawlor, D.A.; Kimm, S.Y. Childhood obesity. Lancet 2010, 375, 1737–1748. [Google Scholar] [CrossRef]
- Cai, X.D.; Wardlaw, T.; Brown, D.W. Global trends in exclusive breastfeeding. Int. Breastfeed. J. 2012, 7, 12. [Google Scholar] [CrossRef] [Green Version]
- NCD Risk Factor Collaboration (NCD-RisC). Worldwide trends in body-mass index, underweight, overweight, and obesity from 1975 to 2016: A pooled analysis of 2416 population-based measurement studies in 128.9 million children, adolescents, and adults. Lancet 2017, 390, 2627–2642. [Google Scholar] [CrossRef] [Green Version]
- Miqueleiz, E.; Lostao, L.; Ortega, P.; Santos, J.M.; Astasio, P.; Regidor, E. Trends in the prevalence of childhood overweight and obesity according to socioeconomic status: Spain, 1987–2007. Eur. J. Clin. Nutr. 2014, 68, 209–214. [Google Scholar] [CrossRef] [PubMed]
- Lasarte-Velillas, J.J.; Hernández-Aguilar, M.T.; Martínez-Boyero, T.; Soria-Cabeza, G.; Soria-Ruiz, D.; Bastarós-García, J.C.; Pastor-Arilla, C.; Lasarte-Sanz, I. Overweight and obesity prevalence estimates in a population from Zaragoza by using different growth references. An. Pediatr. 2015, 82, 152–158. [Google Scholar] [CrossRef] [PubMed]
- Ogden, C.L.; Carroll, M.D.; Kit, B.K.; Flegal, K.M. Prevalence of Obesity and Trends in Body Mass Index Among US Children and Adolescents, 1999–2010. JAMA 2012, 307, 483–490. [Google Scholar] [CrossRef] [PubMed] [Green Version]
- Mekonen, J.; Addisu, S.; Mekonnen, H. Prevalence and associated factors of chronic undernutrition among under five children in Adama town, Central Ethiopia: A cross-sectional study design. BMC Res. Notes 2019, 12, 532. [Google Scholar] [CrossRef]
- El Taguri, A.; Betilmal, I.; Mahmud, S.M.; Monem Ahmed, A.; Goulet, O.; Galan, P.; Hercberg, S. Risk factors for stunting among under-fives in Libya. Public Health Nutr. 2008, 12, 1141–1149. [Google Scholar] [CrossRef] [Green Version]
- Zhu, Z.; Tang, Y.; Zhuang, J.; Liu, Y.; Wu, X.; Cai, Y.; Wang, L.; Cao, Z.B.; Chen, P. Physical activity, screen viewing time, and overweight/obesity among Chinese children and adolescents: An update from the 2017 physical activity and fitness in China—The youth study. BMC Public Health 2019, 19, 197. [Google Scholar] [CrossRef] [Green Version]
- Bahk, J.; Khang, Y.H. Trends in Measures of Childhood Obesity in Korea From 1998 to 2012. J. Epidemiol. 2016, 26, 199–207. [Google Scholar] [CrossRef] [Green Version]
- Mansori, K.; Khateri, S.; Moradi, Y.; Khazaei, Z.; Mirzaei, H.; Hanis, S.M.; Aliabadi, M.A.; Ranjbaran, M.; Varse, F.; Parang, S. Prevalence of obesity and overweight in Iranian children aged less than 5 years: A systematic review and meta-analysis. Korean J. Pediatr. 2019, 62, 206–212. [Google Scholar] [CrossRef]
- Rachmi, C.N.; Agho, K.E.; Li, M.; Baur, L.A. Stunting, Underweight and Overweight in Children Aged 2.0–4.9 Years in Indonesia: Prevalence Trends and Associated Risk Factors. PLoS ONE 2016, 11, e0154756. [Google Scholar] [CrossRef] [PubMed] [Green Version]
- Kumar, R.; Abbas, F.; Mahmood, T.; Somrongthong, R. Prevalence and factors associated with underweight children: A population-based subnational analysis from Pakistan. BMJ Open 2019, 9, e028972. [Google Scholar] [CrossRef] [PubMed] [Green Version]
- Dereń, K.; Nyankovskyy, S.; Nyankovska, O.; Łuszczki, E.; Wyszyńska, J.; Sobolewski, M.; Mazur, A. The prevalence of underweight, overweight and obesity in children and adolescents from Ukraine. Sci. Rep. 2018, 8, 3625. [Google Scholar] [CrossRef] [PubMed]
- Arnold, F.; Liu, Z.X. Sex preference, fertility, and family planning in China. In The Population of Modern China; Springer: Boston, MA, USA, 1986; Volume 1, pp. 221–246. [Google Scholar]
- Ren, W.W.; Rammohan, A.; Wu, Y.R. Is there a gender gap in child nutritional outcomes in rural China? China Econ. Rev. 2014, 31, 145–155. [Google Scholar] [CrossRef]
- National Bureau of Statistics. China Statistical Yearbook 2019. Available online: http://www.stats.gov.cn/tjsj/ndsj/2019/indexch.htm (accessed on 1 February 2020).
- Kickbusch, I.; Allen, L.; Franz, C. The commercial determinants of health. Lancet Glob. Health 2016, 4, e895–e896. [Google Scholar] [CrossRef] [Green Version]
- Bauman, A.; Rutter, H.; Baur, L. Too little, too slowly: International perspectives on childhood obesity. Public Health Res. Pract. 2019, 29, 2911901. [Google Scholar] [CrossRef] [Green Version]
- Vartanian, L.R.; Schwartz, M.B.; Brownell, K.D. Effects of soft drink consumption on nutrition and health: A systematic review and meta-analysis. Am. J. Public Health 2007, 97, 667–675. [Google Scholar] [CrossRef]
- Jou, J.; Techakehakij, W. International application of sugar-sweetened beverage (SSB) taxation in obesity reduction: Factors that may influence policy effectiveness in country-specific contexts. Health Policy 2012, 107, 83–90. [Google Scholar] [CrossRef]
- World Health Orgnization. Taxes on Sugary Drinks. Available online: https://www.who.int/southeastasia/news/feature-stories/detail/taxes-on-sugary-drinks (accessed on 12 November 2019).
- World Health Orgnization. Technical Report on: Taxation for Sugar Sweetened Beverages in Sri Lanka. Available online: https://www.who.int/docs/default-source/searo/obesity/technical-report-taxation-for-sugar-sweetened-beverages-in-sri-lanka.pdf?sfvrsn=ca7d262b_2 (accessed on 12 November 2019).
- Otsuka, K.; Dennis, C.L.; Tatsuoka, H.; Jimba, M. The relationship between breastfeeding self-efficacy and perceived insufficient milk among Japanese mothers. J. Obstet. Gynecol. Neonatal Nurs. 2008, 37, 546–555. [Google Scholar] [CrossRef]
- Scott, J.A.; Binns, C.W.; Oddy, W.H.; Graham, K.I. Predictors of breastfeeding duration: Evidence from a cohort study. Pediatrics 2006, 117, e645–e655. [Google Scholar] [CrossRef] [Green Version]
- Chapman, D.J.; Morel, K.; Anderson, A.K.; Damio, G.; Pérez-Escamilla, R. Breastfeeding Peer Counselling: From Efficacy Through Scale-Up. J. Hum. Lact. 2010, 26, 314–326. [Google Scholar] [CrossRef] [PubMed]
- Jolly, K.; Ingram, L.; Khan, K.S.; Deeks, J.J.; Freemantle, N.; MacArthur, C. Systematic review of peer support for breastfeeding continuation: Meta regression analysis of the effect of setting, intensity, and timing. BMJ 2012, 344, d8287. [Google Scholar] [CrossRef] [PubMed] [Green Version]
- Pérez-Escamilla, R. Breastfeeding in the 21st century: How we can make it work. Soc. Sci. Med. 2019, 9, 112331. [Google Scholar] [CrossRef] [PubMed]
- GBD 2016 Mortality Collaborators. Global, Regional, and National under-5 Mortality, Adult Mortality, Age-Specific Mortality, and Life Expectancy, 1970–2016: A Systematic Analysis for the Global Burden of Disease Study 2016. Lancet 2017, 390, 1084–1150. [Google Scholar] [CrossRef] [Green Version]


| 1990 | 1995 | 2000 | 2005 | 2010 | 2016 | |
|---|---|---|---|---|---|---|
| Stunting b (%) | 28.1 | 26.0 | 19.9 | 15.1 | 13.4 | 11.6 |
| Wasting b (%) | 5.8 | 5.5 | 4.0 | 3.2 | 2.9 | 2.7 |
| Underweight b (%) | 12.0 | 10.4 | 7.5 | 5.1 | 4.5 | 3.7 |
| Overweight c (%) | 6.3 | 8.2 | 9.5 | 9.4 | 10.1 | 11.9 |
| Obesity c (%) | 2.2 | 2.7 | 3.9 | 4.4 | 5.3 | 6.9 |
| EBF d (%) | 30.0 | 30.7 | 31.8 | 33.0 | 32.1 | 30.2 |
| Indicators | Status (2016) | Target Value | Predictive Value | |||||
|---|---|---|---|---|---|---|---|---|
| National Level | National Level | National Level | Boys | Girls | Eastern China | Central China | Western China | |
| Stunting a (NO. in 10 000) | 704.3 | 422.6 # | 424.8 | 250.5 | 175.3 | 165.8 | 149.5 | 113.3 |
| Wasting a (%) | 2.7 | 5.0 # | 2.0 | 2.3 | 1.7 | 1.5 | 2.4 | 2.4 |
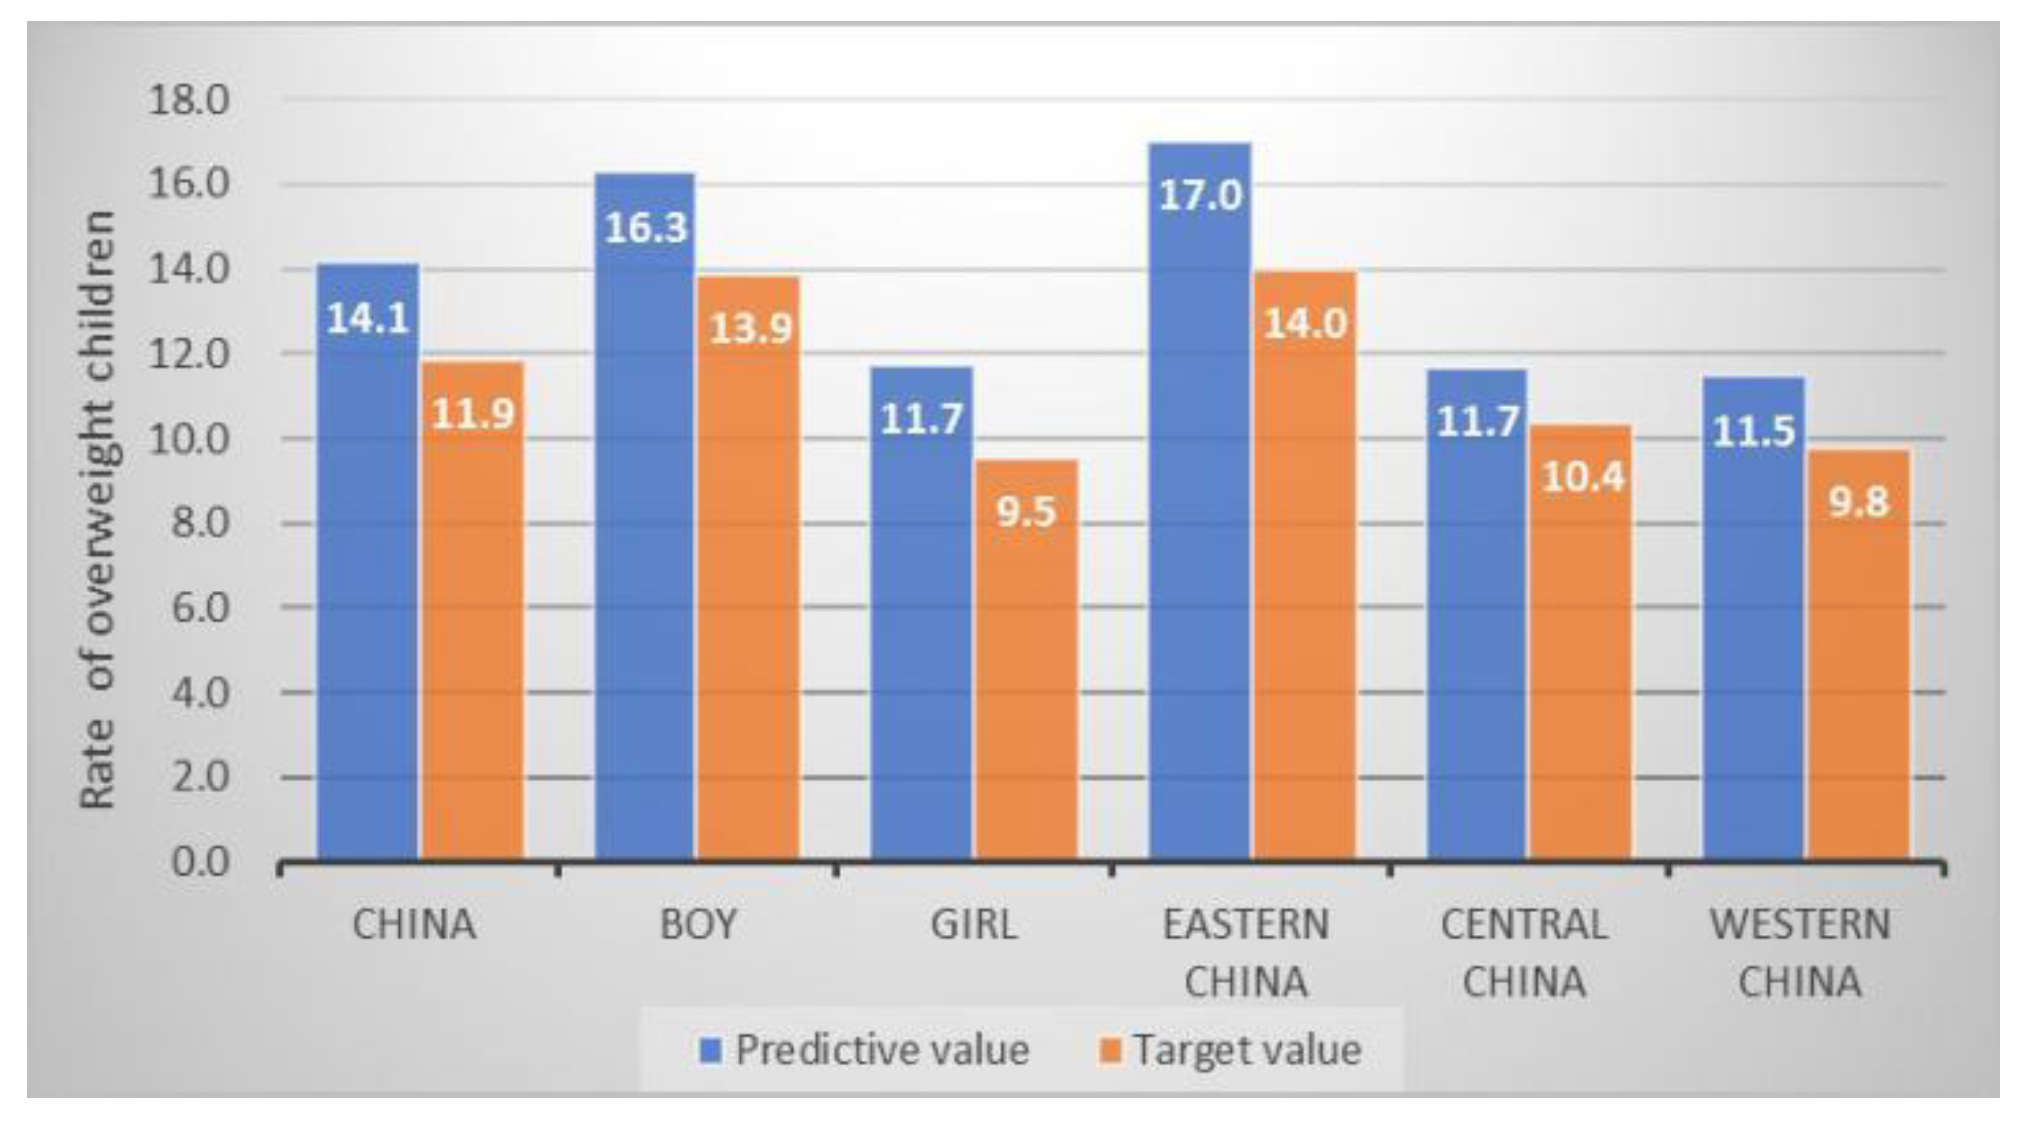
| Overweight b (%) | 11.9 | 11.9 # | 14.1 | 16.3 | 11.7 | 17.0 | 11.7 | 11.5 |
| EBF c (%) | 30.2 | 50.0 # | 30.3 | 30.3 | 30.3 | 26.9 | 33.2 | 33.7 |
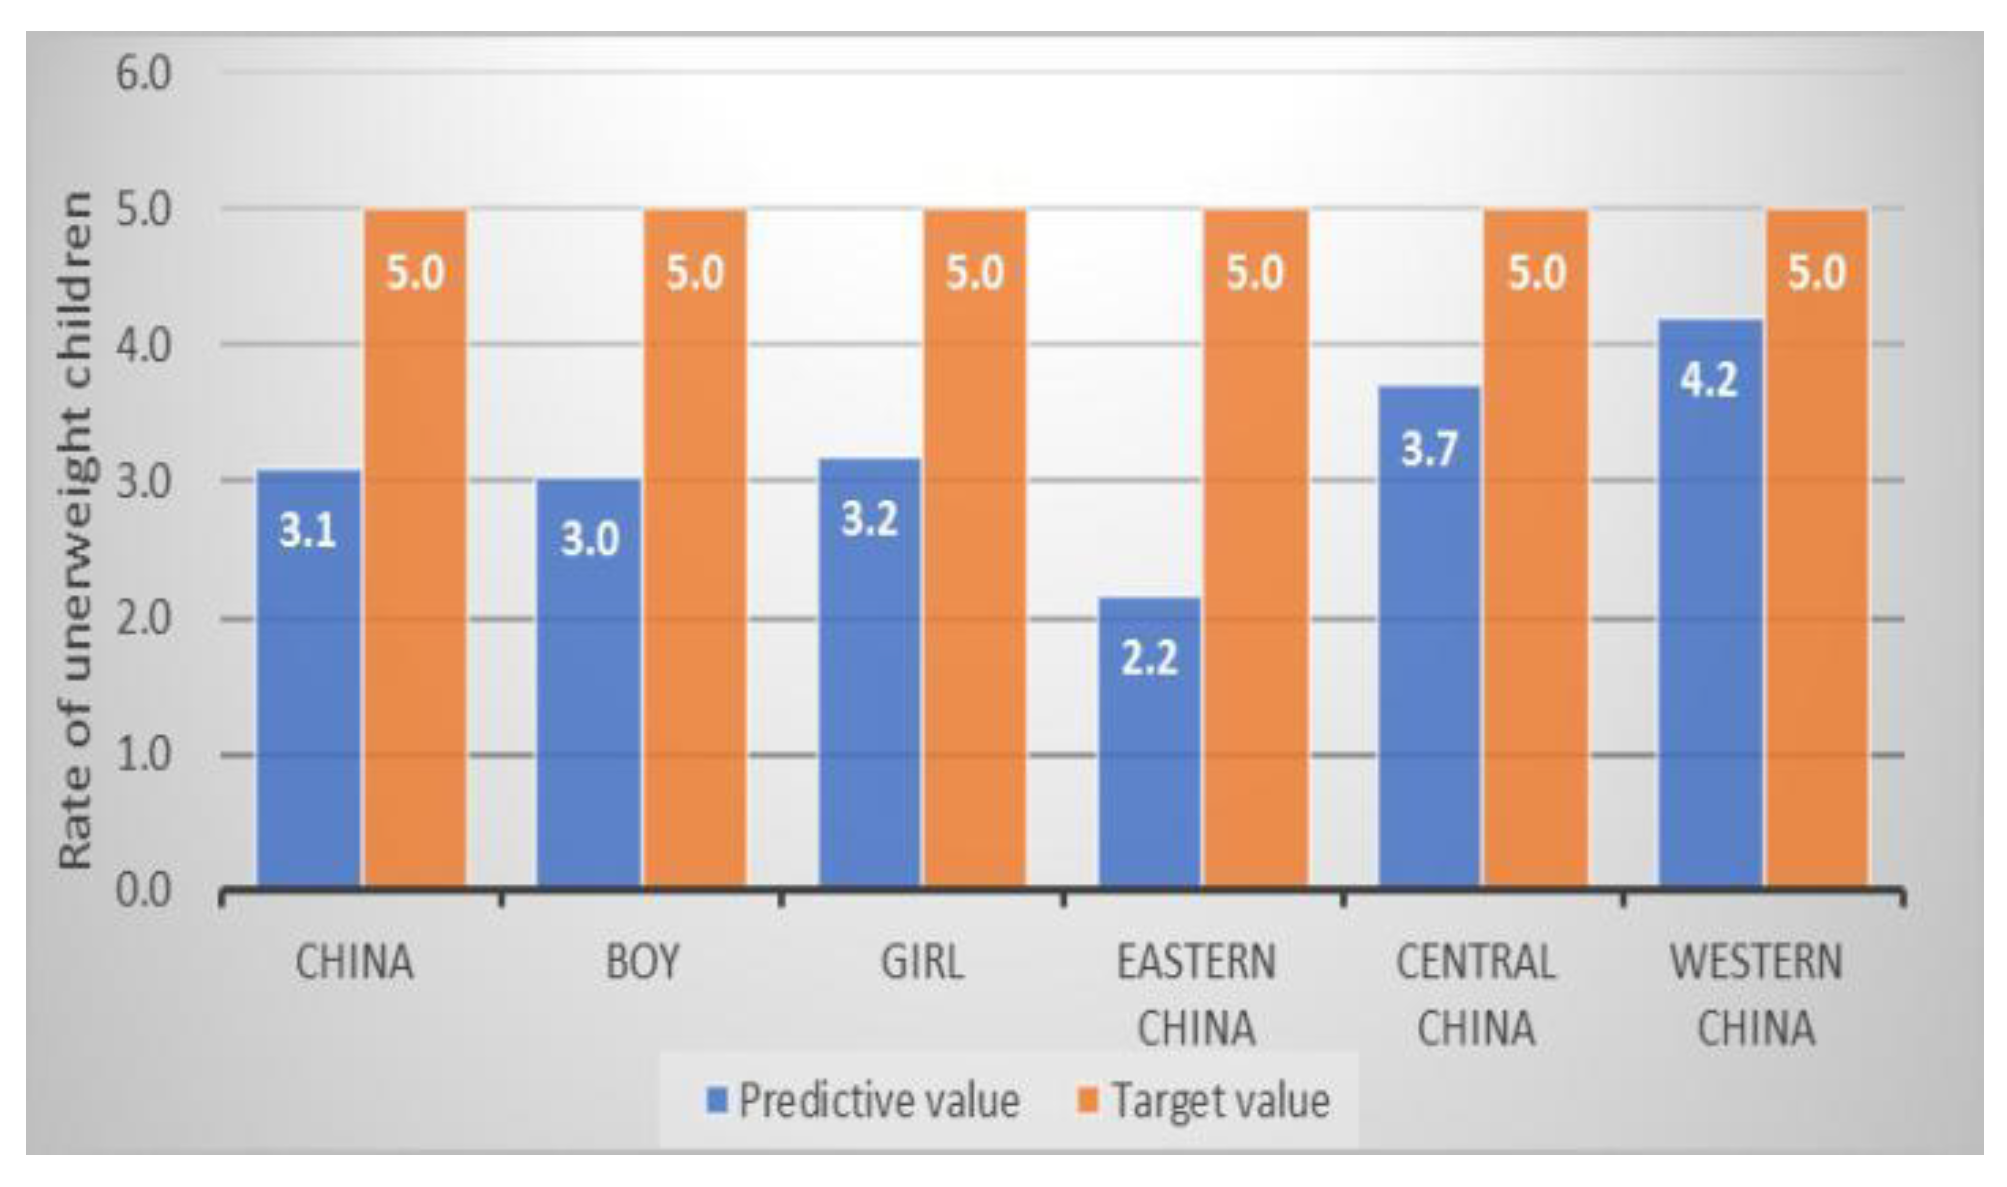
| Underweight a (%) | 3.7 | 5.0 * | 3.1 | 3.0 | 3.2 | 2.2 | 3.7 | 4.2 |
| Stunting a (%) | 11.6 | 7.0 * | 8.3 | 9.0 | 7.4 | 6.7 | 9.9 | 9.7 |
| 11.6 | 5.0 * | 6.8 | 7.5 | 6.0 | 5.6 | 8.3 | 8.0 | |
| Low birthweight (%) | 3.3 | 4.0 * | — | — | — | — | — | — |
© 2020 by the authors. Licensee MDPI, Basel, Switzerland. This article is an open access article distributed under the terms and conditions of the Creative Commons Attribution (CC BY) license (http://creativecommons.org/licenses/by/4.0/).
Share and Cite
Yang, B.; Huang, X.; Liu, Q.; Tang, S.; Story, M.; Chen, Y.; Zhou, M. Child Nutrition Trends Over the Past Two Decades and Challenges for Achieving Nutrition SDGs and National Targets in China. Int. J. Environ. Res. Public Health 2020, 17, 1129. https://0-doi-org.brum.beds.ac.uk/10.3390/ijerph17041129
Yang B, Huang X, Liu Q, Tang S, Story M, Chen Y, Zhou M. Child Nutrition Trends Over the Past Two Decades and Challenges for Achieving Nutrition SDGs and National Targets in China. International Journal of Environmental Research and Public Health. 2020; 17(4):1129. https://0-doi-org.brum.beds.ac.uk/10.3390/ijerph17041129
Chicago/Turabian StyleYang, Bo, Xin Huang, Qin Liu, Shenglan Tang, Mary Story, Yiwen Chen, and Maigeng Zhou. 2020. "Child Nutrition Trends Over the Past Two Decades and Challenges for Achieving Nutrition SDGs and National Targets in China" International Journal of Environmental Research and Public Health 17, no. 4: 1129. https://0-doi-org.brum.beds.ac.uk/10.3390/ijerph17041129