Temporal Trends in the Association between Participation in Physical Education and Physical Activity among U.S. High School Students, 2011–2017


Abstract
:1. Introduction
2. Materials and Methods
2.1. Study Design and Participants
2.2. Physical Education Class
2.3. Physical Activity
2.4. Body Mass Index (BMI)
2.5. Statistical Analysis
3. Results
4. Discussion
5. Conclusions
Author Contributions
Funding
Conflicts of Interest
References
- NASPE. Instructional Framework for Fitness Education in Physical Education (PDF File). Available online: https://www.shapeamerica.org/upload/Instructional-Framework-for-Fitness-Education-in-Physical-Education.pdf (accessed on 24 February 2020).
- Sallis, J.F.; McKenzie, T.L.; Alcaraz, J.E.; Kolody, B.; Faucette, N.; Hovell, M.F. The effects of a 2-year physical education program (SPARK) on physical activity and fitness in elementary school students. Sports, Play and Active Recreation for Kids. Am. J. Public Health 1997, 87, 1328–1334. [Google Scholar] [CrossRef] [PubMed] [Green Version]
- Trudeau, F.; Shephard, R.J. Physical education, school physical activity, school sports and academic performance. Int. J. Behav. Nutr. Phys. Act. 2008, 5, 10. [Google Scholar] [CrossRef] [PubMed] [Green Version]
- Weiss, M.R.; Bredemeier, B.J.L. Moral development in sport. Exerc. Sport Sci. Rev. 1990, 18, 331–378. [Google Scholar] [CrossRef] [PubMed]
- Beller, J.M.; Stoll, S.K. Moral reasoning of high school student athletes and general students: An empirical study versus personal testimony. Pediatr. Exerc. Sci. 1995, 7, 352–363. [Google Scholar] [CrossRef]
- Staiano, A.E.; Calvert, S.L. Exergames for physical education courses: Physical, social, and cognitive benefits. Child Dev. Perspect. 2011, 5, 93–98. [Google Scholar] [CrossRef]
- Dishman, R.K. Physical activity and public health: Mental health. Quest 1995, 47, 362–385. [Google Scholar] [CrossRef]
- Hassmen, P.; Koivula, N.; Uutela, A. Physical exercise and psychological well-being: A population study in Finland. Prev. Med. 2000, 30, 17–25. [Google Scholar] [CrossRef] [Green Version]
- Snyder, E.E.; Spreitzer, E. Sport, education and schools. Sport Educ. School. 1981, 119–146. [Google Scholar]
- Loprinzi, P.D.; Kane, C.J. Exercise and cognitive function: A randomized controlled trial examining acute exercise and free-living physical activity and sedentary effects. Mayo Clin. Proc. 2015, 90, 450–460. [Google Scholar] [CrossRef] [Green Version]
- Castelli, D.M.; Hillman, C.H.; Buck, S.M.; Erwin, H.E. Physical fitness and academic achievement in third-and fifth-grade students. J. Sport Exerc. Psychol. 2007, 29, 239–252. [Google Scholar] [CrossRef]
- Caspersen, C.J.; Powell, K.E.; Christenson, G.M. Physical activity, exercise, and physical fitness: Definitions and distinctions for health-related research. Public Health Rep. 1985, 100, 126. [Google Scholar]
- Luepker, R.V.; Perry, C.L.; McKinlay, S.M.; Nader, P.R.; Parcel, G.S.; Stone, E.J.; Webber, L.S.; Elder, J.P.; Feldman, H.A.; Johnson, C.C. Outcomes of a field trial to improve children’s dietary patterns and physical activity: The Child and Adolescent Trial for Cardiovascular Health (CATCH). JAMA 1996, 275, 768–776. [Google Scholar] [CrossRef] [PubMed]
- Hills, A.P.; Andersen, L.B.; Byrne, N.M. Physical activity and obesity in children. Br. J. Sports Med. 2011, 45, 866–870. [Google Scholar] [CrossRef] [PubMed] [Green Version]
- Pan, Y.; Pratt, C.A. Metabolic syndrome and its association with diet and physical activity in US adolescents. J. Am. Diet. Assoc. 2008, 108, 276–286. [Google Scholar] [CrossRef] [PubMed]
- Boreham, C.; Riddoch, C. The physical activity, fitness and health of children. J. Sports Sci. 2001, 19, 915–929. [Google Scholar] [CrossRef] [PubMed]
- Malina, R.M. Adherence to physical activity from childhood to adulthood: A perspective from tracking studies. Quest 2001, 53, 346–355. [Google Scholar] [CrossRef]
- Wallhead, T.L.; Buckworth, J. The role of physical educationin the promotionof youth physical activity. Quest 2004, 56, 285–301. [Google Scholar] [CrossRef]
- Yli-Piipari, S.; Watt, A.; Jaakkola, T.; Liukkonen, J.; Nurmi, J.-E. Relationships between physical education students’ motivational profiles, enjoyment, state anxiety, and self-reported physical activity. J. Sports Sci. Med. 2009, 8, 327. [Google Scholar]
- Dollman, J.; Norton, K.; Norton, L. Evidence for secular trends in children’s physical activity behaviour. Br. J. Sports Med. 2005, 39, 892–897. [Google Scholar] [CrossRef]
- Bailey, R. Physical education and sport in schools: A review of benefits and outcomes. J. School Health 2006, 76, 397–401. [Google Scholar] [CrossRef]
- Lowry, R.; Wechsler, H.; Kann, L.; Collins, J. Recent trends in participation in physical education among US high school students. J. School Health 2001, 71, 145–152. [Google Scholar] [CrossRef] [PubMed]
- Lee, S.M.; Burgeson, C.R.; Fulton, J.E.; Spain, C.G. Physical education and physical activity: Results from the school health policies and programs study 2006. J. School Health 2007, 77, 435–463. [Google Scholar] [CrossRef] [PubMed]
- Kalman, M.; Inchley, J.; Sigmundova, D.; Iannotti, R.J.; Tynjälä, J.A.; Hamrik, Z.; Haug, E.; Bucksch, J. Secular trends in moderate-to-vigorous physical activity in 32 countries from 2002 to 2010: A cross-national perspective. Eur. J. Public Health 2015, 25 (Suppl. 2), 37–40. [Google Scholar] [CrossRef] [PubMed] [Green Version]
- Gortmaker, S.L.; Lee, R.; Cradock, A.L.; Sobol, A.M.; Duncan, D.T.; Wang, Y.C. Disparities in youth physical activity in the United States: 2003–2006. Med. Sci. Sports Exerc. 2012, 44, 888–893. [Google Scholar] [CrossRef] [PubMed] [Green Version]
- Kann, L. Youth risk behavior surveillance—United States, 2015. MMWR. Surveill. Summ. 2016, 65, 1–174. [Google Scholar] [PubMed]
- Biddle, S.J.H.; Sallis, J.F.; Cavill, N. Young and Active? Young People and Health-Enhancing Physical Activity-Evidence and Implications; Health Education Authority: London, UK, 1998. [Google Scholar]
- Hallal, P.C.; Victora, C.G.; Azevedo, M.R.; Wells, J.C. Adolescent physical activity and health. Sports Med. 2006, 36, 1019–1030. [Google Scholar] [CrossRef] [PubMed]
- Galper, D.I.; Trivedi, M.H.; Barlow, C.E.; Dunn, A.L.; Kampert, J.B. Inverse association between physical inactivity and mental health in men and women. Med. Sci. Sport. Exerc. 2006, 38, 173–178. [Google Scholar] [CrossRef] [Green Version]
- Lang, J.J.; Larouche, R.; Tremblay, M.S. The association between physical fitness and health in a nationally representative sample of Canadian children and youth aged 6 to 17 years. Health Promot. Chron. Dis. Prev. Can. Res. Policy Pract. 2019, 39, 104–111. [Google Scholar] [CrossRef]
- Rasberry, C.N.; Lee, S.M.; Robin, L.; Laris, B.; Russell, L.A.; Coyle, K.K.; Nihiser, A.J. The association between school-based physical activity, including physical education, and academic performance: A systematic review of the literature. Prev. Med. 2011, 52, S10–S20. [Google Scholar] [CrossRef]
- Ross, C.E.; Wu, C.-L. The links between education and health. Am. Sociol. Rev. 1995, 60, 719–745. [Google Scholar] [CrossRef]
- Marques, A.; Corrales, F.R.G.; Martins, J.; Catunda, R.; Sarmento, H. Association between physical education, school-based physical activity, and academic performance: A systematic review. Retos Nuevas tendencias en educación física, deporte y recreación 2017, 31, 316–320. [Google Scholar]
- Biddle, S.J.; Ciaccioni, S.; Thomas, G.; Vergeer, I. Physical activity and mental health in children and adolescents: An updated review of reviews and an analysis of causality. Psychol. Sport Exerc. 2019, 42, 146–155. [Google Scholar] [CrossRef]
- Caruso, R. Crime and sport participation: Evidence from Italian regions over the period 1997–2003. J. Socio-Econ. 2011, 40, 455–463. [Google Scholar] [CrossRef]
- Gómez, J.E.; Johnson, B.A.; Selva, M.; Sallis, J.F. Violent crime and outdoor physical activity among inner-city youth. Prev. Med. 2004, 39, 876–881. [Google Scholar] [CrossRef] [PubMed]
- NASPE. Opposing Substitution and Waiver/Exemptions for Required Physical Education; National Association for Sport and Physical Education: Reston, VA, USA, 2006. [Google Scholar]
- Peart, T.; Velasco Mondragon, H.E.; Rohm-Young, D.; Bronner, Y.; Hossain, M.B. Weight status in US youth: The role of activity, diet, and sedentary behaviors. Am. J. Health Behav. 2011, 35, 756–764. [Google Scholar] [CrossRef] [PubMed]
- Jeffery, R.W.; French, S.A. Epidemic obesity in the United States: Are fast foods and television viewing contributing? Am. J. Public Health 1998, 88, 277–280. [Google Scholar] [CrossRef] [PubMed] [Green Version]
- Hitchings, E.; Moynihan, P. The relationship between television food advertisements recalled and actual foods consumed by children. J. Human Nutr. Diet. 1998, 11, 511–517. [Google Scholar] [CrossRef]
- Marshall, S.J.; Biddle, S.J.; Gorely, T.; Cameron, N.; Murdey, I. Relationships between media use, body fatness and physical activity in children and youth: A meta-analysis. Int. J. Obes. 2004, 28, 1238. [Google Scholar] [CrossRef] [Green Version]
- Morgan, C.F.; Beighle, A.; Pangrazi, R.P. What are the contributory and compensatory relationships between physical education and physical activity in children? Res. Q. Exerc. Sport 2007, 78, 407–412. [Google Scholar] [CrossRef]
- Kang, M.; Brinthaupt, T.M. Effects of group-and individual-based step goals on children’s physical activity levels in school. Pediatr. Exerc. Sci. 2009, 21, 148–158. [Google Scholar] [CrossRef]
- Cawley, J.; Meyerhoefer, C.; Newhouse, D. The impact of state physical education requirements on youth physical activity and overweight. Health Econ. 2007, 16, 1287–1301. [Google Scholar] [CrossRef] [PubMed]


| Characteristic | 2011 (n = 13,516) | 2013 (n = 12,020) | 2015 (n = 13,643) | 2017 (n = 12,437) |
|---|---|---|---|---|
| Gender (%) | ||||
| Male | 50.87 (49.06–52.68) | 49.36 (48.11–50.60) | 51.02 (47.77–54.26) | 48.71 (46.43–51.00) |
| Female | 49.13 (47.32–50.94) | 50.64 (49.40–51.89) | 48.98 (45.74–52.23) | 51.29 (49.00–53.57) |
| Race/Ethnicity (%) | ||||
| White | 58.82 (51.61–66.04) | 57.21 (49.11–65.31) | 56.14 (48.59–63.70) | 54.90 (48.56–61.24) |
| Black or African American | 13.12 (9.54–16.69) | 13.47 (8.88–18.06) | 12.82 (9.21–16.44) | 12.27 (9.42–15.12) |
| Hispanic/Latino | 19.33 (13.95–24.72) | 20.56 (15.24–25.87) | 21.58 (15.61–27.55) | 22.43 (17.01–27.87) |
| Other | 8.73 (6.69–10.76) | 8.76 (6.79–10.74) | 9.45 (7.33–11.57) | 10.40 (8.76–12.03) |
| BMI (%) | ||||
| Obese | 13.76 (12.34–15.17) | 14.67 (13.33–16.00) | 14.82 (13.19–16.45) | 15.65 (14.40–16.90) |
| Overweight | 16.65 (15.70–17.59) | 18.06 (16.98–19.15) | 17.73 (16.76–18.70) | 17.28 (16.45–18.11) |
| Normal | 67.44 (65.69–69.18) | 64.76 (62.71–66.81) | 65.19 (63.11–67.27) | 64.58 (62.95–66.22) |
| Sample | 2011 (n = 13,516) | 2013 (n = 12,020) | 2015 (n = 13,643) | 2017 (n = 12,437) | P-Trendlinear b | P-Trendquadratic c |
|---|---|---|---|---|---|---|
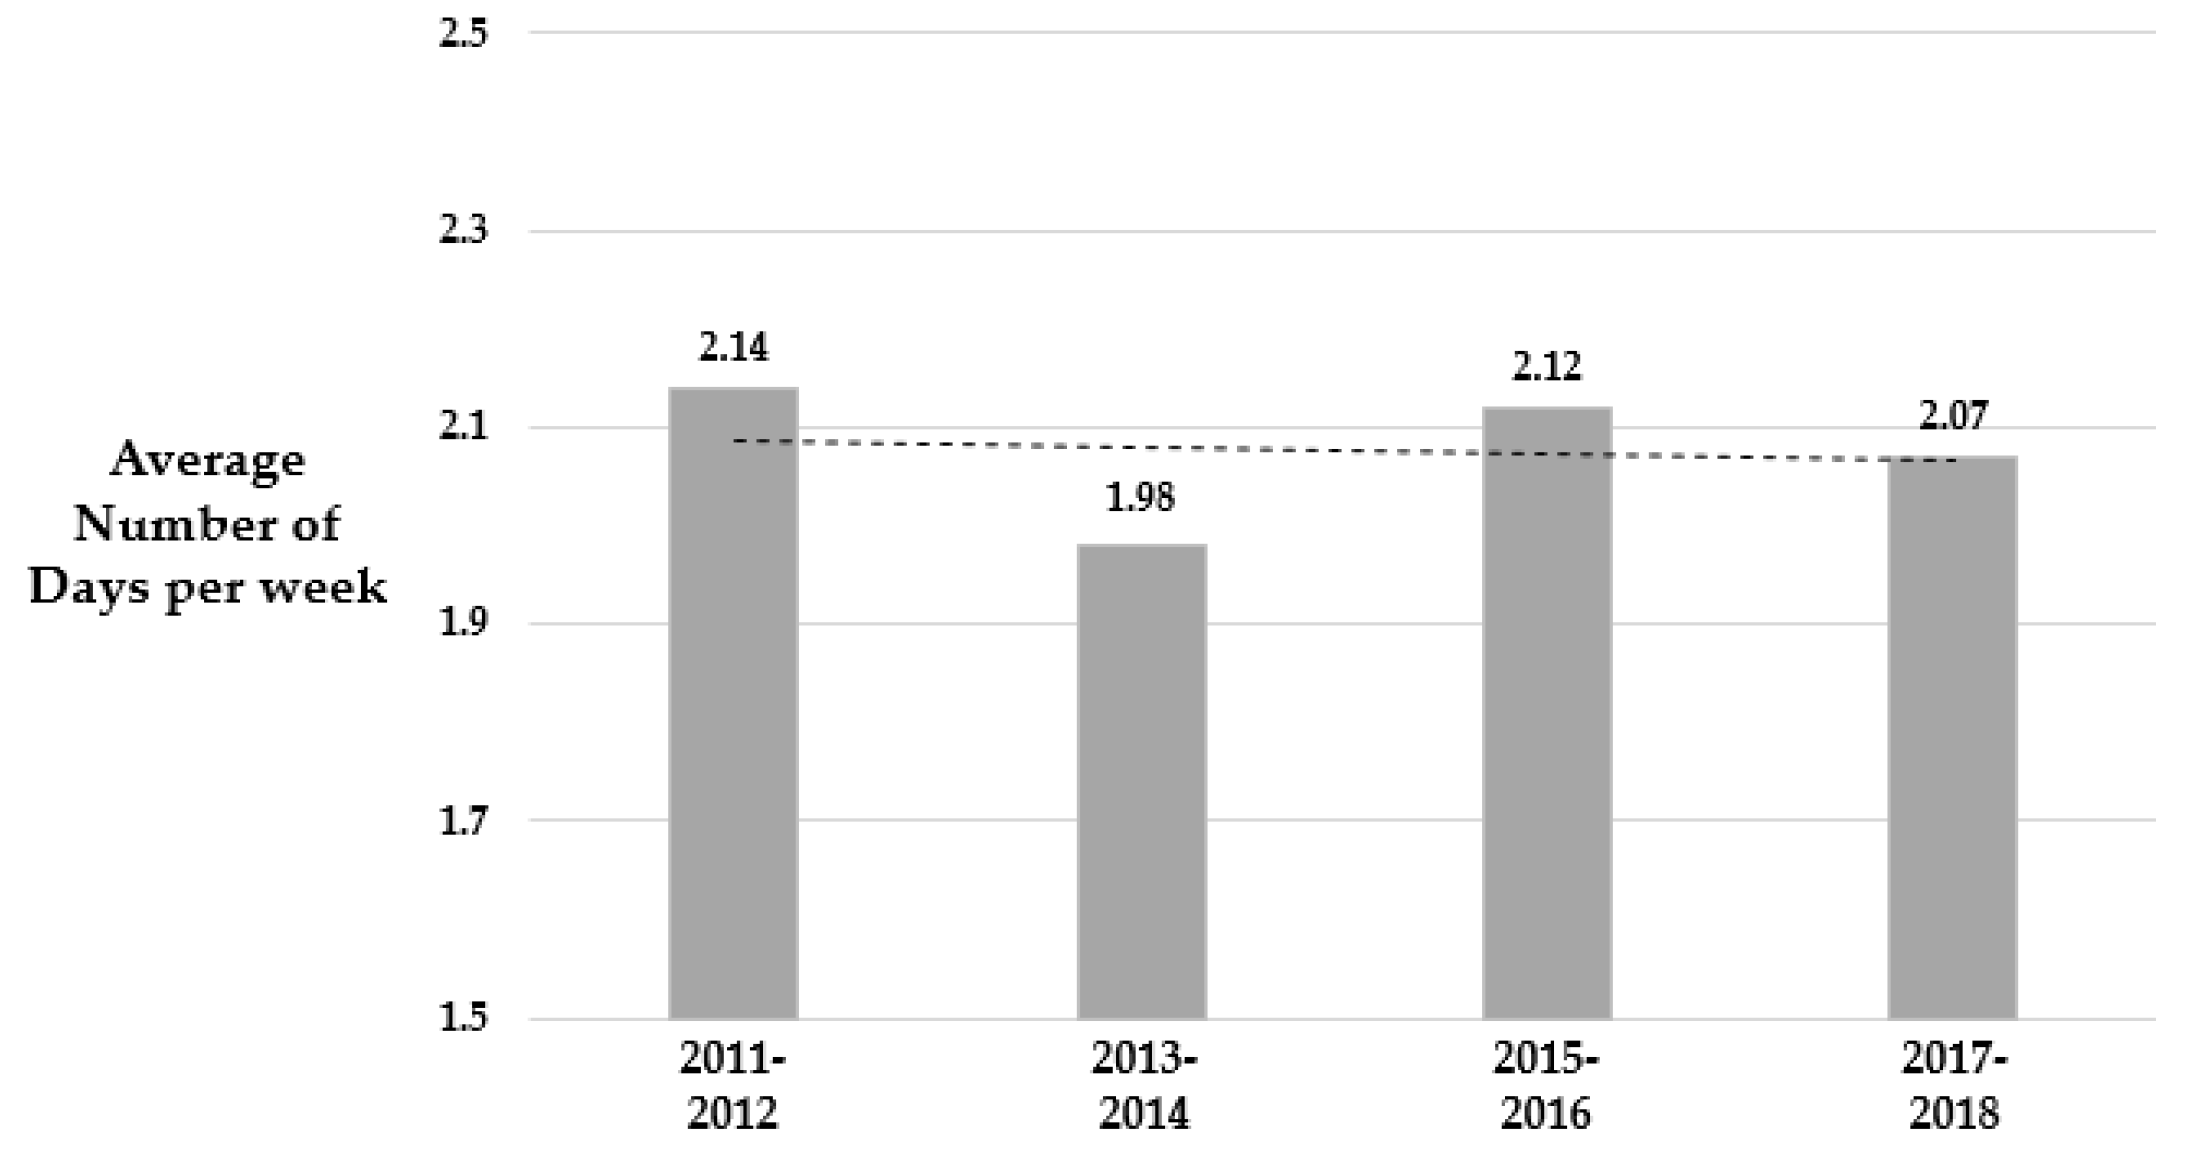
| Overall Sample | 2.14 (1.89–2.39) | 1.98 (1.75–2.22) | 2.12 (1.86–2.38) | 2.07 (1.83–2.31) | 0.44 | 0.37 |
| Gender | ||||||
| Male | 2.35 (2.12–2.58) | 2.26 (2.05–2.46) | 2.30 (2.01–2.59) | 2.32 (2.06–2.58) | 0.24 | 0.45 |
| Female | 1.91 (1.61–2.21) | 1.72 (1.44–2.00) | 1.93 (1.67–2.20) | 1.84 (1.61–2.07) | 0.27 | 0.26 |
| Race/Ethnicity | ||||||
| White | 2.18 (1.85–2.52) | 1.80 (1.57–2.02) | 1.96 (1.67–2.25) | 1.92 (1.66–2.18) | 0.38 | 0.15 |
| Black or African American | 1.96 (1.69–2.22) | 2.00 (1.63–2.37) | 2.39 (2.10–2.68) | 2.11 (1.89–2.34) | 0.10 | 0.30 |
| Hispanic/Latino | 2.16 (1.93–2.40) | 2.47 (2.17–2.75) | 2.37 (2.05–2.69) | 2.40 (2.06–2.74) | 0.69 | 0.44 |
| Other | 2.04 (1.78–2.29) | 2.09 (1.80–2.37) | 2.12 (1.70–2.55) | 2.13 (1.83–2.44) | 0.88 | 0.92 |
| BMI | ||||||
| Obese | 2.05 (1.77–2.34) | 2.03 (1.75–2.30) | 2.14 (1.87–2.41) | 1.98 (1.72–2.25) | 0.57 | 0.75 |
| Overweight | 2.15 (1.94–2.36) | 1.99 (1.74–2.24) | 2.24 (1.98–2.51) | 2.13 (1.88–2.37) | 0.18 | 0.18 |
| Normal | 2.16 (1.89–2.43) | 1.97 (1.74–2.21) | 2.10 (1.83–2.37) | 2.09 (1.84–2.34) | 0.49 | 0.34 |
| Sample | 2011 (n = 13,516) | 2013 (n = 12,020) | 2015 (n = 13,643) | 2017 (n = 12,437) | P-Trendlinear b | P-Trendquadratic c |
|---|---|---|---|---|---|---|
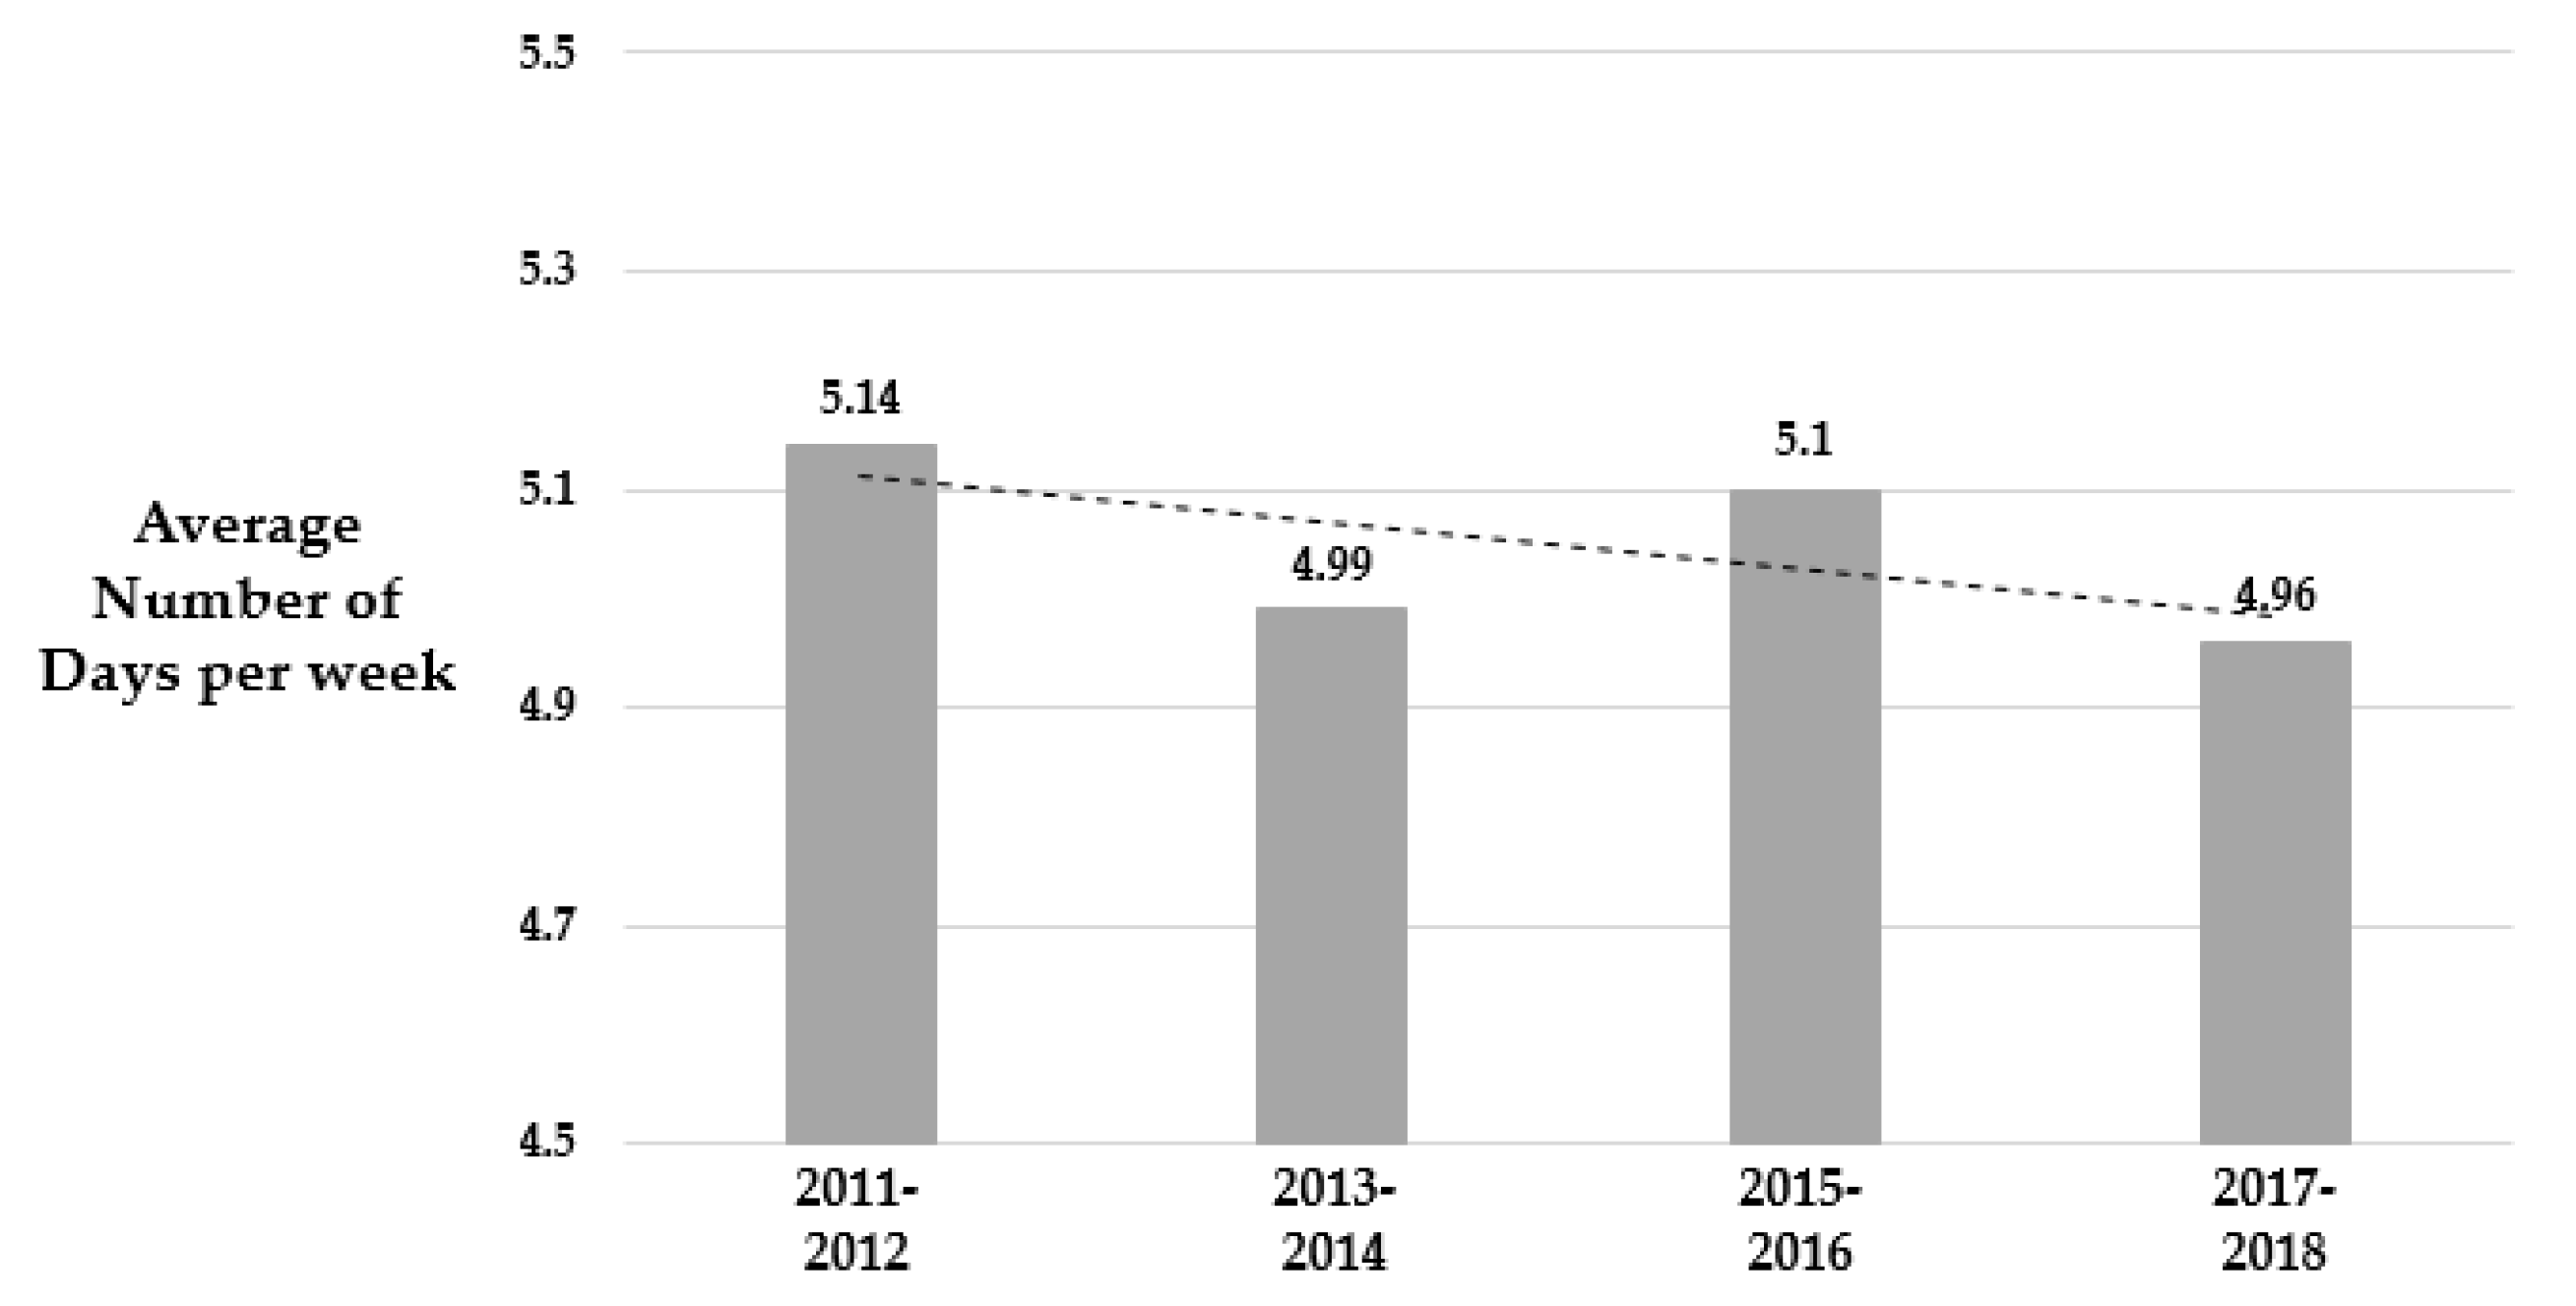
| Overall Sample | 5.14 (5.03–5.26) | 4.99 (4.88–5.10) | 5.10 (4.95–5.24) | 4.96 (4.79–5.13) | 0.27 | 0.25 |
| Gender | ||||||
| Male | 5.74 (5.63–5.86) | 5.57 (5.49–5.66) | 5.62 (5.45–5.79) | 5.56 (5.44–5.68) | 0.63 | 0.33 |
| Female | 4.52 (4.39–4.66) | 4.42 (4.28–4.57) | 4.55 (4.36–4.74) | 4.39 (4.17–4.61) | 0.31 | 0.40 |
| Race/Ethnicity | ||||||
| White | 5.34 (5.20–5.49) | 5.17 (5.02–5.31) | 5.32 (5.13–5.52) | 5.07 (4.84–5.31) | 0.21 | 0.28 |
| Black or African American | 4.78 (4.60–4.96) | 4.58 (4.42–4.74) | 4.71 (4.42–4.99) | 4.64 (4.40–4.87) | 0.47 | 0.27 |
| Hispanic/Latino | 4.89 (4.76–5.01) | 4.84 (4.64–5.06) | 4.85 (4.69–5.00) | 4.89 (4.70–5.09) | 0.93 | 0.74 |
| Other | 4.91 (4.70–5.13) | 4.85 (4.64–5.05) | 4.84 (4.58–5.09) | 4.86 (4.65–5.08) | 0.96 | 0.90 |
| BMI | ||||||
| Obese | 4.73 (4.57–4.90) | 4.53 (4.32–4.74) | 4.83 (4.67–4.98) | 4.61 (4.42–4.81) | p = 0.03 | 0.07 |
| Overweight | 5.14 (5.00–5.29) | 5.00 (4.83–5.18) | 5.00 (4.79–5.21) | 4.91 (4.72–5.10) | 0.98 | 0.91 |
| Normal | 5.24 (5.12–5.37) | 5.11 (5.01–5.21) | 5.20 (5.04–5.37) | 5.07 (4.87–5.27) | 0.34 | 0.30 |
© 2020 by the authors. Licensee MDPI, Basel, Switzerland. This article is an open access article distributed under the terms and conditions of the Creative Commons Attribution (CC BY) license (http://creativecommons.org/licenses/by/4.0/).
Share and Cite
Ryu, S.; Loprinzi, P.; Kim, H.; Kang, M. Temporal Trends in the Association between Participation in Physical Education and Physical Activity among U.S. High School Students, 2011–2017. Int. J. Environ. Res. Public Health 2020, 17, 2357. https://0-doi-org.brum.beds.ac.uk/10.3390/ijerph17072357
Ryu S, Loprinzi P, Kim H, Kang M. Temporal Trends in the Association between Participation in Physical Education and Physical Activity among U.S. High School Students, 2011–2017. International Journal of Environmental Research and Public Health. 2020; 17(7):2357. https://0-doi-org.brum.beds.ac.uk/10.3390/ijerph17072357
Chicago/Turabian StyleRyu, Seungho, Paul Loprinzi, Heontae Kim, and Minsoo Kang. 2020. "Temporal Trends in the Association between Participation in Physical Education and Physical Activity among U.S. High School Students, 2011–2017" International Journal of Environmental Research and Public Health 17, no. 7: 2357. https://0-doi-org.brum.beds.ac.uk/10.3390/ijerph17072357