Review

Concentration, Spatial Distribution, Contamination Degree and Human Health Risk Assessment of Heavy Metals in Urban Soils across China between 2003 and 2019—A Systematic Review

1
Key Laboratory of Land Surface Pattern and Simulation, Institute of Geographical Sciences and Natural Resources Research, Chinese Academy of Sciences, 11 A Datun Road, Beijing 100101, China
2
College of Resources and Environment, University of Chinese Academy of Sciences, Beijing 100049, China
3
College of Tourism and Historical Culture, Liupanshui Normal University, Liupanshui 553004, China
*
Author to whom correspondence should be addressed.
Int. J. Environ. Res. Public Health 2020, 17(9), 3099; https://0-doi-org.brum.beds.ac.uk/10.3390/ijerph17093099
Submission received: 26 March 2020 / Revised: 14 April 2020 / Accepted: 16 April 2020 / Published: 29 April 2020

Abstract

:
This study provides an overview of the studies of heavy metal pollution regarding As, Cd, Cr, Hg, Pb, Cu, Zn and Ni in the urban soils throughout 71 cities of China, based on data from online literature, during the period 2003–2019. The concentrations, spatial distributions, contamination degrees and health risks of heavy metals in the urban soils were evaluated. The results demonstrated that the mean values of eight heavy metals all exceeded the soil background values in China, and the kriging interpolation method showed that the hot-spot cities with heavy metal contamination in urban soils were mainly concentrated in the southwest, southcentral, southeast coast, northcentral and northwest regions of China. The geoaccumulation index (Igeo) indicated that Hg and Cd were at moderate contamination levels and that the levels of the other six metals did not appear contamination. The pollution index (PI) showed that Cd and Hg reached high contamination levels, and the other metals reached moderate contamination levels. The integrated pollution index (IPI) and potential ecological risk index (PRI) indicated that the integral urban soils in the study areas ranked high contamination levels and moderate ecological risk degree, respectively, and Cd and Hg should be labeled as priority metals for control in the urban soils around China. The human health risk assessments for the heavy metals indicated that ingestion was the dominant exposure pathway for having adverse effects on human health. The mean Hazard index (HI) values of eight heavy metals all showed that adverse effects on human health were unlikely, and the mean carcinogenic (CR) values of As, Cr and Ni for children and adults all suggested an acceptable carcinogenic risk to human beings. In addition, children exposed to these heavy metals faced more serious non-carcinogenic and carcinogenic health threats compared to adults. The results could provide valuable information for demanding the better control of heavy metal pollution and mitigation of the adverse effects on residents by environmental regulators in national urban regions.

1. Introduction

As a crucial component of urban ecosystems, soil plays a principal role in biochemical transformation, the cycling of elements, supporting plants and many recreational activities. In addition, it is meanwhile considered to be a mixture of heavy metals, mineral constituents, organic matter (humus), living organisms, air and water [1,2,3]. Urban areas are the hot-spots for environmental hazards at multiple scales, as a result of increased population, industrial growth and vehicular transport increase [4]. With the rapid development of urbanization and the increase in the urban population, the disturbance by human activities of the urban soil environment has led to varying degrees of deterioration in urban soil environment quality. Urban soils, acting as a reservoir of contaminants, are excellent indicators of pollution [5], and heavy metals in soil are considered as important indicators to monitor the impact of human activities on soil environmental quality [6,7,8].
Owing to the toxic effects, long-term persistence and bio-magnification traits, even at low concentrations, heavy metal pollution has attracted widespread attention and heavy metals are considered to be the most important pollutants among the multitudinous soil contaminants [9,10,11]. Urban soils can serve as recipients of large amounts of heavy metals from multiple sources. Heavy metals that accumulate in soils simultaneously originate from natural and other anthropogenic sources [6,12]. Urban soils differ greatly from natural ones, as they are more strongly influenced by anthropogenic activities [1,13]; thus, anthropogenic sources are considered to be the primary source cause of soil contamination; for instance, industrial waste, automobile exhausts and domestic waste are seen as major causes of the increased content of potentially toxic elements (PTEs), such as Pb, Cd, Cu and Zn [4,14]. As a result, they are more prone to containing and accumulating high concentrations of heavy metals in comparison with the natural soils [5]. The accumulation of heavy metals in soils can inevitably affect environmental quality, such as through urban soil, water and crop contamination. Pollutants can be transferred into the human body through the food chain, ultimately posing direct or indirect health hazards to the human beings in the long-term [15,16]. For example, heavy metals accumulated in the tissues and internal organs of human body can affect the central nervous system and may act as cofactors, initiators or promoters of other diseases [3,17]. Furthermore, exposure to mixed metals can result in numerous adverse health effects on humans due to synergistic interactions, even when concentrations of the individual metals are below their ecotoxicological benchmark levels [18]. The adverse effects of heavy metals on human health are mainly conferred through three pathways: ingestion, inhalation and dermal contact absorption; numerous studies have shown that ingestion is the primary exposure pathway for human health risks; in addition, children are especially susceptible to health risks from heavy metal toxicity [17,19,20,21].
As the largest developing country in the world, since 1978, China has witnessed a dramatic growth in urbanization along with unprecedented economic growth [22]; however, heavy metal pollution has become a serious environmental problem in different functional regions, such as urban soils, urban road dust and agricultural soils, with rapid industrialization and urbanization over the past two decades [23,24]. The national soil pollution survey bulletin of China in 2014 showed that the proportions of slight, mild, moderate and severe pollution spots around China were 11.2%, 2.3%, 1.5% and 1.1%, respectively. Therefore, to provide guidance for the prevention and remediation of soil pollution in China over the next 30 years, the Chinese government issued a regulation in 2016, the “Soil Contamination Prevention and Control Action Plan” [9].
Studies of urban soils in China started in the 1980s, whereas discussions of the impact of urbanization on soil resources in China have been more in recent years; in addition, more than 100 cities have been studied [22,25,26]. In China, numerous research studies have been conducted on metal concentrations, spatial distributions, contamination assessments, source identification and health risk assessments, while the vast majority of studies have focused on heavy metals in the urban soil of a single city [19,27,28,29,30]. In recent decades, more research has paid attention to the extensive range of heavy metal pollution in urban soil across China. For example, Pan et al. reviewed heavy metal pollution levels and performed a health risk assessment of urban soils in 32 Chinese cities [31]. Wei and Yang reviewed heavy metal contamination in urban soils, urban road dusts and agricultural soils from China [32]. Luo et al. examined trace metal concentrations, pollution levels and sources identification in 21 Chinese cities [1]. Zhang et al. assessed the spatial distribution of metal pollution in the soils of Chinese provincial capital cities [33]. Guo et al. reported the spatial distribution and pollution assessment of heavy metals in urban soils from southwest China [6]. However, there was very limited report in the aforementioned studies regarding the assessment of the urban soils throughout China in vast quantity and scope; thus, carrying out a further, comprehensive and national scale study across China is urgently needed.
Therefore, this study focuses on the concentrations, contamination, spatial distribution and human health risks of heavy metals in the urban soils throughout China on a national scale, based on the online literature data. The main objectives of this study are (a) to determine the concentrations and spatial distribution of As, Cd, Cr, Hg, Pb, Cu, Zn and Ni—eight heavy metals—in urban soils; (b) to evaluate the pollution characteristics of the heavy metals using the geoaccumulation index (Igeo), pollution index (PI) and integrated pollution index (IPI); (c) to discriminate the possible hot-spots of heavy metal contamination in urban soils; (d) to investigate the potential ecological risk degree and detect the risk factors that contribute most to national urban soil contamination, using the potential ecological risk index (PRI) ; and (e) to evaluate the human health risks to the child and adult communities through different exposure pathways.

2. Data Source and Research Methods
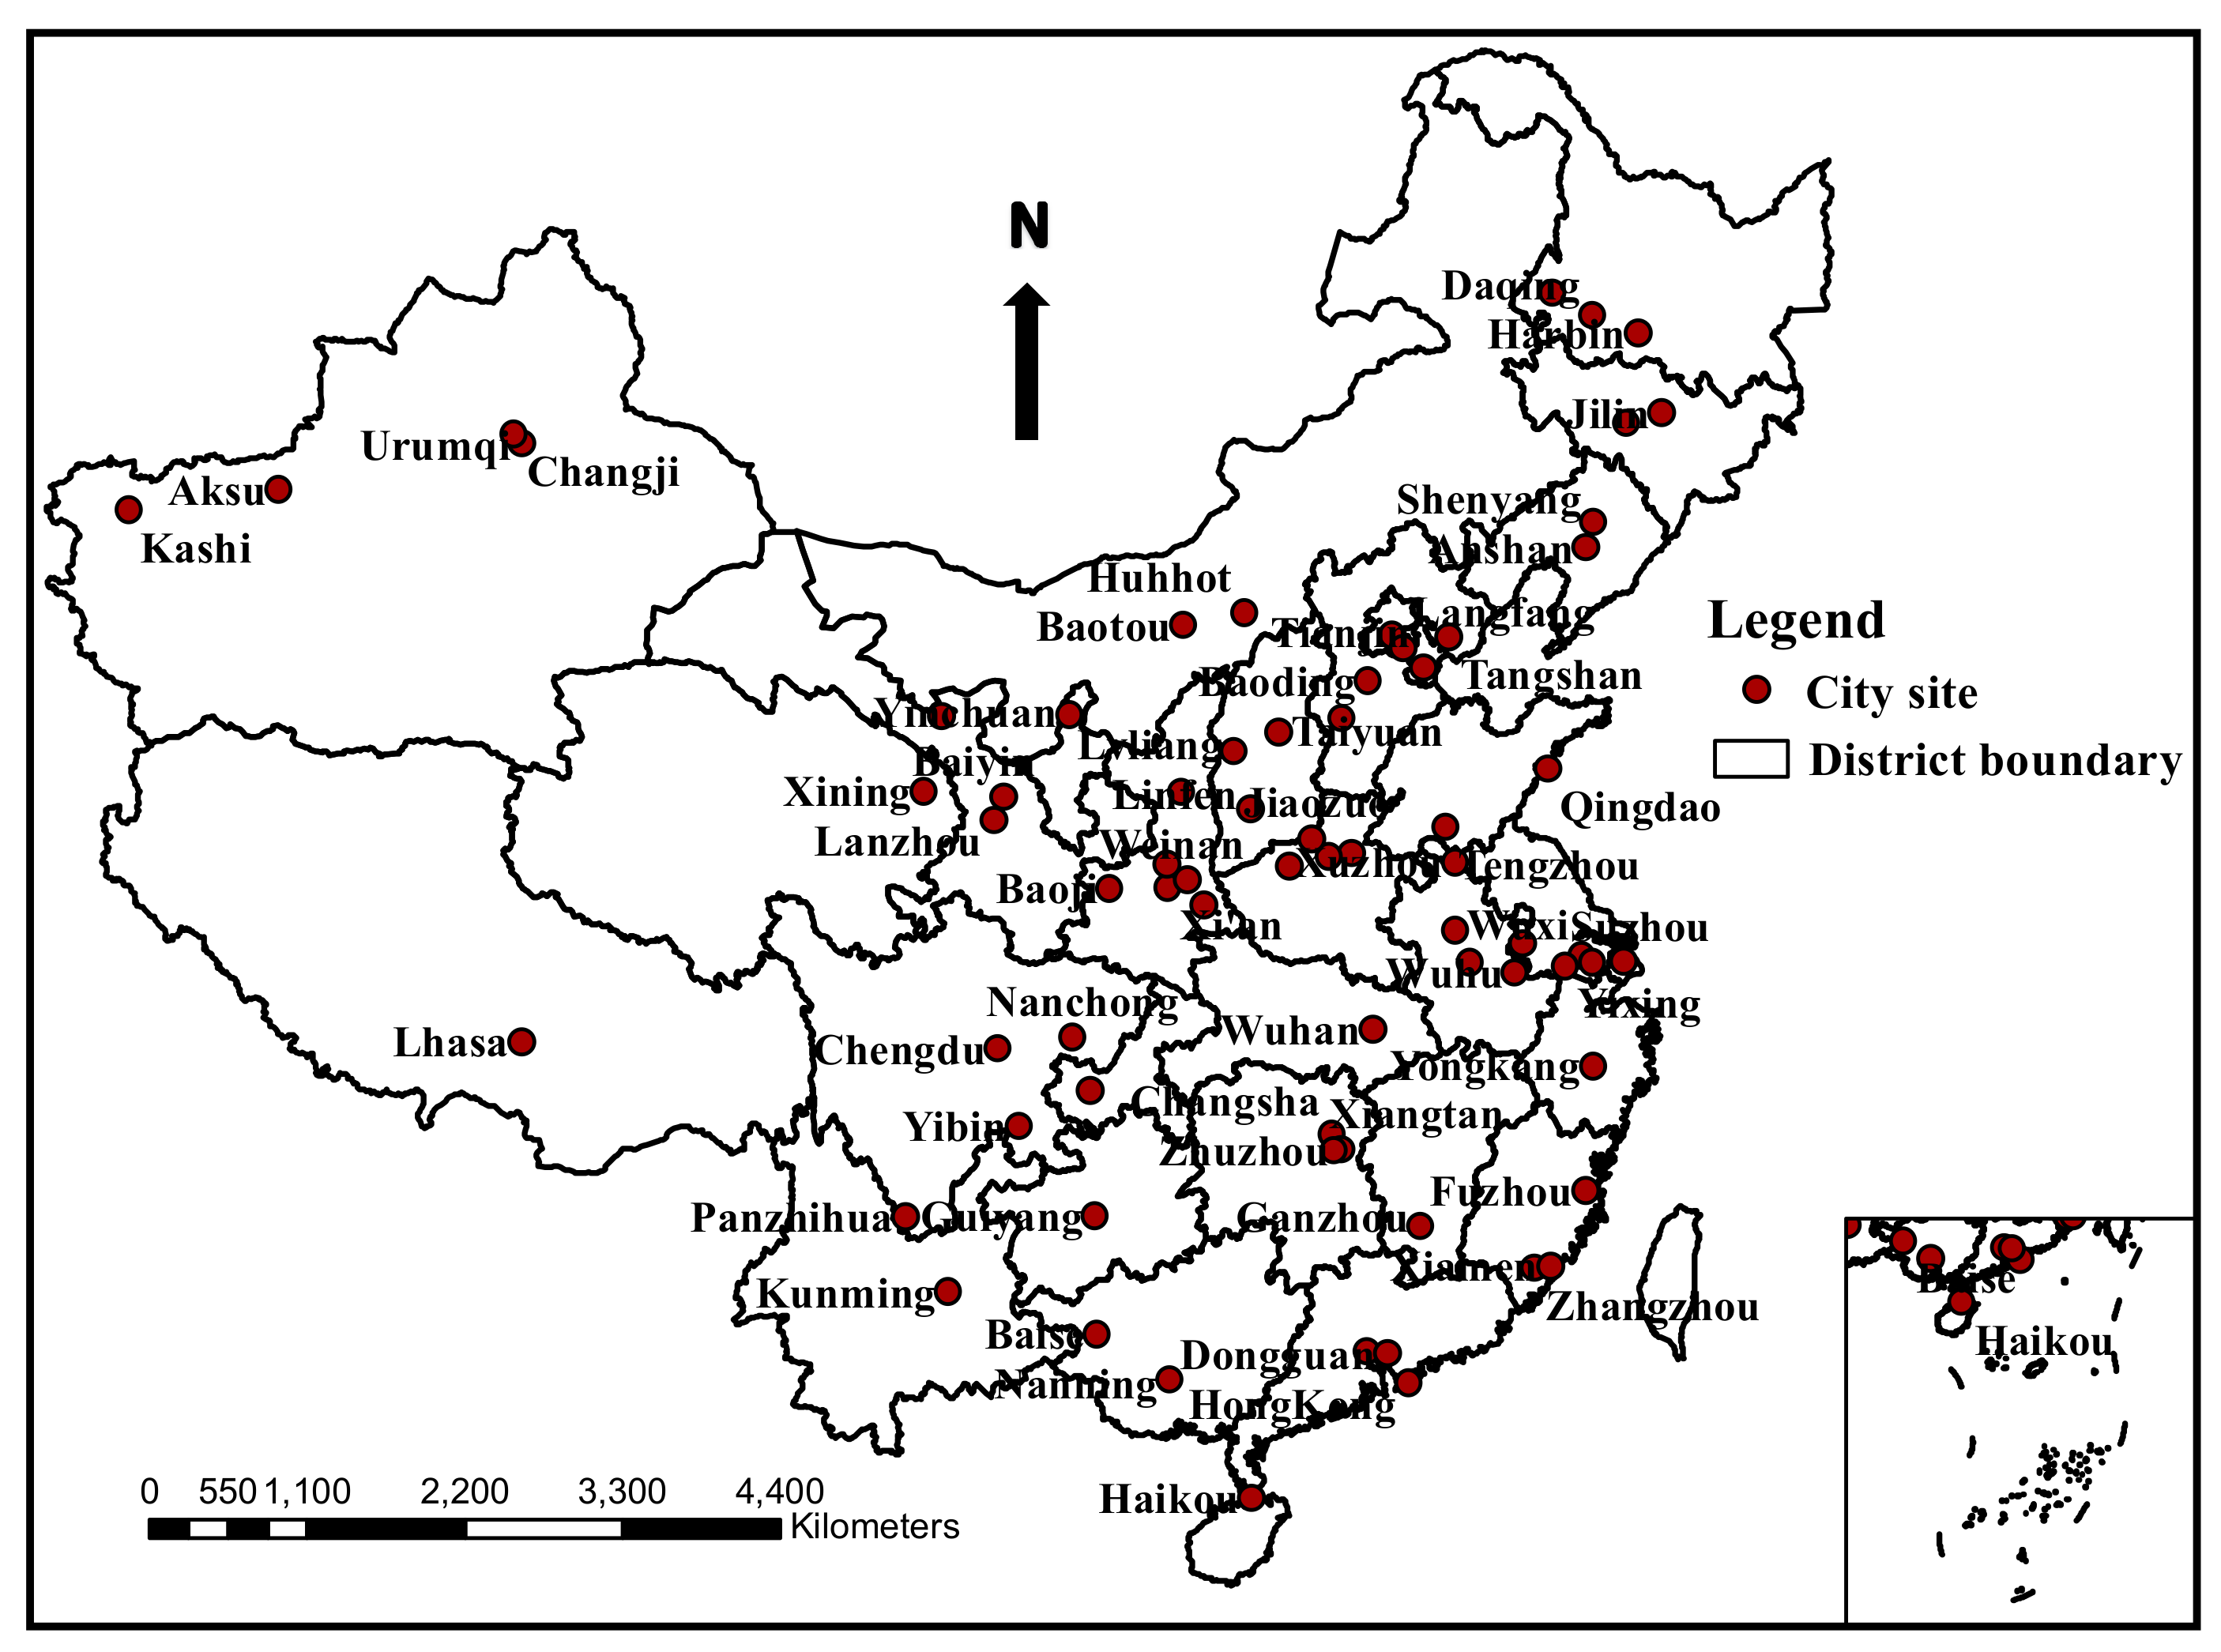
2.1. Data Source

2.1.1. Search Method

The study chose As, Cd, Cr, Hg, Pb, Cu, Zn and Ni—eight elements—as the target contaminants, all of which were listed as priority pollutants for control by the United States Environmental Protection Agency (USEPA). The information sources for the systematic literature review were located in three databases: China National Knowledge Internet (CNKI), Web of Science and Google Scholar. We used three categories of keyword by connecting the same group with “OR” and combining the different group with “AND”, which comprised the following: (a) metals—heavy metals, metal element, trace element, and metallic element; (b) status—concentration, levels, contents, contamination, pollution, degree, quality, spatial distribution, health risk, assessment, evaluation, and condition; (c) settings—urban, soil, city, capital, metropolitan, district, region, functional zone, area, China, and Chinese. The eligibility criteria comprised the following: (a) the study area was restricted to the urban areas of China, and the research medium was soil; (b) the papers were published between 2003 and 2019 and in the most recent years; (c) the published papers included as many of the eight elements of the review as possible, with at least three elements involved; (d) the papers focused on urban soils with surface layers with a depth of 0–20 cm; (e) the studies could well reflect the overall soil pollution characteristics of the urban environment, including no less than two functional regions (such as an industrial region, a residential district, etc.); (d) the studies were conducted with scientific sampling, analytical methods and strict quality assurance or quality control procedures; and (f) the papers were published in full text, excluding abstracts or news reports.

2.1.2. Screening Method

We tried to select the studies published during the most recent years, and those can best reflect the overall soil pollution characteristics of the urban situation, from the three databases of China National Knowledge Internet (CNKI), Web of Science and Google Scholar according to the search strategy from the period 2003–2019. Furthermore, we tried to obtain as many data as possible, to cover every province and present the overall contamination condition of urban soils throughout the country. The soil samples in the selected articles were digested with mixed acids such as HF + HCLO4 + HNO3, HNO3 + H2O2 or HNO3 + HF + HCL. Afterwards, the total concentrations of As, Cd, Cr, Hg, Cu, Pb, Zn and Ni were determined by ICP, ICP-MS, ICP-OES, ICP-AES or AAS. All of the sample processing and analytical methods were controlled with strict quality assurance and are accepted by the scientific community. In addition, abnormal values were eliminated. The non- qualified articles were excluded by means of title review, abstract review and full text review based on the eligibility criteria. Finally, a total of urban soil heavy metal pollution datasets from 71 Chinese cities, including 10,071 sample sites covering almost every province across China—with the exception of Taiwan—were collected. The distribution of the cities is presented in Figure 1.

2.2. Research Methods

2.2.1. Geoaccumulation Index (Igeo)

Since 1969, the geoaccumulation index (Igeo) has been commonly used as a geochemical criterion to evaluate the contamination degree of a single element in environmental sediments or soils. The equation to calculate Igeo values is shown as follows [34]:
Igeo = log2 (Cn/1.5Bn)
where Cn represents the concentration of the measured element in the sediment and Bn is the geochemical background value of the given metal. The constant 1.5 is a background matrix correction factor considering the natural fluctuations influenced by lithogenic effects. In this study, the geometric means of background values of the corresponding metal in the control district in which the city is located were chosen as the background values according to the background values of the elements in the soils of China [35]. The Igeo is divided into seven levels: Igeo ≤0, uncontaminated; 0 < Igeo ≤ 1, uncontaminated to moderately contaminated; 1 < Igeo ≤ 2, moderately contaminated; 2 < Igeo ≤ 3, moderately to heavily contaminated; 3 < Igeo ≤ 4, heavily contaminated; 4 < Igeo ≤ 5, heavily contaminated to extremely contaminated; and 5 ≤ Igeo, extremely contaminated.

2.2.2. Pollution Index

The pollution index (PI) is defined as the ratio of the heavy metal concentration to the geometric mean of background concentrations, which is generally used to calculate the pollution level of individual elements; the integrated pollution index (IPI) is defined as the mean value of all of the PI of all considered metals. In addition, the IPI is used for the determination of heavy metal contamination in individual samples in the area, rather than revealing the general contamination degree of the whole area [11,36,37]. The calculation of PI is as follows:
PI = Ci/Bi
where Ci represents the concentration of the measured metal i in the sediment, and Bi represents the background value of corresponding metal i [35]. The PI value of each metal and the IPI value of each sample site are calculated and classified respectively as low contamination (PI ≤ 1.0), moderate contamination (1.0 < PI≤ 3.0) or high contamination (PI > 3.0); and low contamination (IPI ≤ 1.0), moderate contamination (1.0 < IPI ≤ 2.0), high contamination (2.0 < IPI ≤ 5.0) or extremely high contamination (IPI > 5) [11,32,36].

2.2.3. Potential ecological Risk and Health Risk Assessment

The potential ecological risk index (PRI) was initially introduced by Hakanson, with the purpose of quantifying the ecological risk of one or multiple target contaminants in a specific environment medium [11,37,38], which reflected the side effects of toxic elements on the environment. The formulas for PRI are evaluated as follows:
E r i = T r i × C f i , C f i = C s i / C n i
P R I = i = 1 n E r i
where C f i refers to the contamination coefficient of heavy metal i, T r i is the biological toxic response factor for heavy metal i, C s i is the measured concentration of heavy metal i, C n i is the background value of heavy metal i [35], E r i refers to the potential ecological risk factor of a single metal, and PRI refers to the potential ecological risk index of multiple elements. The toxic response factors T r i for As, Cd, Cr, Hg, Pb, Cu, Zn and Ni are 10, 30, 2, 40, 5, 5, 1 and 5 respectively [39]. The classifications for ecological risk degree are presented as low ecological risk ( E r i < 40 or PRI < 150), moderate ecological risk (40 ≤ E r i < 80 or 150 ≤ PRI < 300), considerable ecological risk (80 ≤ E r i < 160 or 300 ≤ PRI < 600), high ecological risk (160 ≤ E r i < 320 or 600 ≤ PRI) or very high ecological risk (320 ≤ E r i ) [11,40].
Human health risk assessment is widely used to quantify the exposure of humans to chemical elements and carcinogenic and noncarcinogenic risks, with ingestion, inhalation and dermal contact as the three exposure pathways [15,36]. In this study, the exposure model is based on the method developed by the Environmental Protection Agency of the United States [41]. The calculation formulas for the average daily doses (ADD) (mg kg−1 d−1) of potentially toxic metals in adults and children via the three exposure pathways are as follows [42,43]:
ADDing = (C × IngR × CF × EF × ED)/(BW × AT)
ADDinh = (C × InhR × EF × ED)/(PEF × BW × AT)
ADDderm = (C × SA × CF × SL × ABS × EF × ED)/(BW × AT)
where ADDing, ADDinh and ADDderm are the average daily doses of exposure to toxic metals through ingestion (mg kg−1 d−1), inhalation (mg kg−1 d−1) and dermal contact (mg kg−1 d−1) by the three pathways, respectively. The exposure parameters for the three models are listed in Table 1 and are based on the USEPA (2001) [44] and environmental site assessment guidelines in China (2009) [45].
The Hazard index (HI) was introduced to assess the overall potential noncarcinogenic risks induced by the toxic metals, the carcinogenic risk (CR) was regarded as the probability of an individual developing any type of cancer over the whole lifetime due to exposure to carcinogenic hazards [46,47]. In this study, eight heavy metals—As, Cd, Cr, Hg, Pb, Cu, Zn and Ni—were all considered to be existing noncarcinogenic risks; furthermore, the carcinogenic risks of As, Cr and Ni were evaluated due to the unavailable carcinogenic slope factors of other toxic metals. The calculations of the Hazard index (HI) and carcinogenic risks (CR) are as follows:
H I = H Q i = A D D i / R f D i
C R = A D D i × S F i
where RfD (mg kg−1 d−1) is the reference dose for each heavy metal, SF (mg kg−1 d−1) −1 is the carcinogenic risk probability, and the parameter values of RfD and SF for the toxic metals are derived from the research conducted in China (Table 2) [15,48]. HQ refers to the hazard quotient generated for each element and exposure pathway and HI is the comprehensive noncarcinogenic risk equal to the total of HQ. When the value of HI is less than 1, adverse health effects are unlikely; when the value of HI is more than 1, adverse health effects may occur. If CR <10−6, the carcinogenic risk is considered to be negligible; if CR >10−4, there is high risk of developing cancer in human beings; and when 10−6 < CR < 10−4, there is an acceptable risk to human beings [17,46,49].

2.2.4. Statistical Analysis

The mean values, minimum values, maximum values, standard deviations, coefficients of variation (CV), Igeo, PI, IPI, E r i , PRI, HI and CR of heavy metals were calculated and summarized in Microsoft Excel (Microsoft Inc., Redmond, Washington, USA). The spatial distributions of heavy metals were determined using the kriging interpolation method, performed by the geostatistical analysis GIS software ArcGIS 10.1 (ESRI Inc, Redlands, California, USA). Box-plots for the Igeo, PI, IPI, E r i and PRI of heavy metals were created by the software package SPSS 25.0, and the distributions of the IPI, PRI and CR of heavy metals were created by the ArcGIS 10.1 software.

3. Results and Discussion

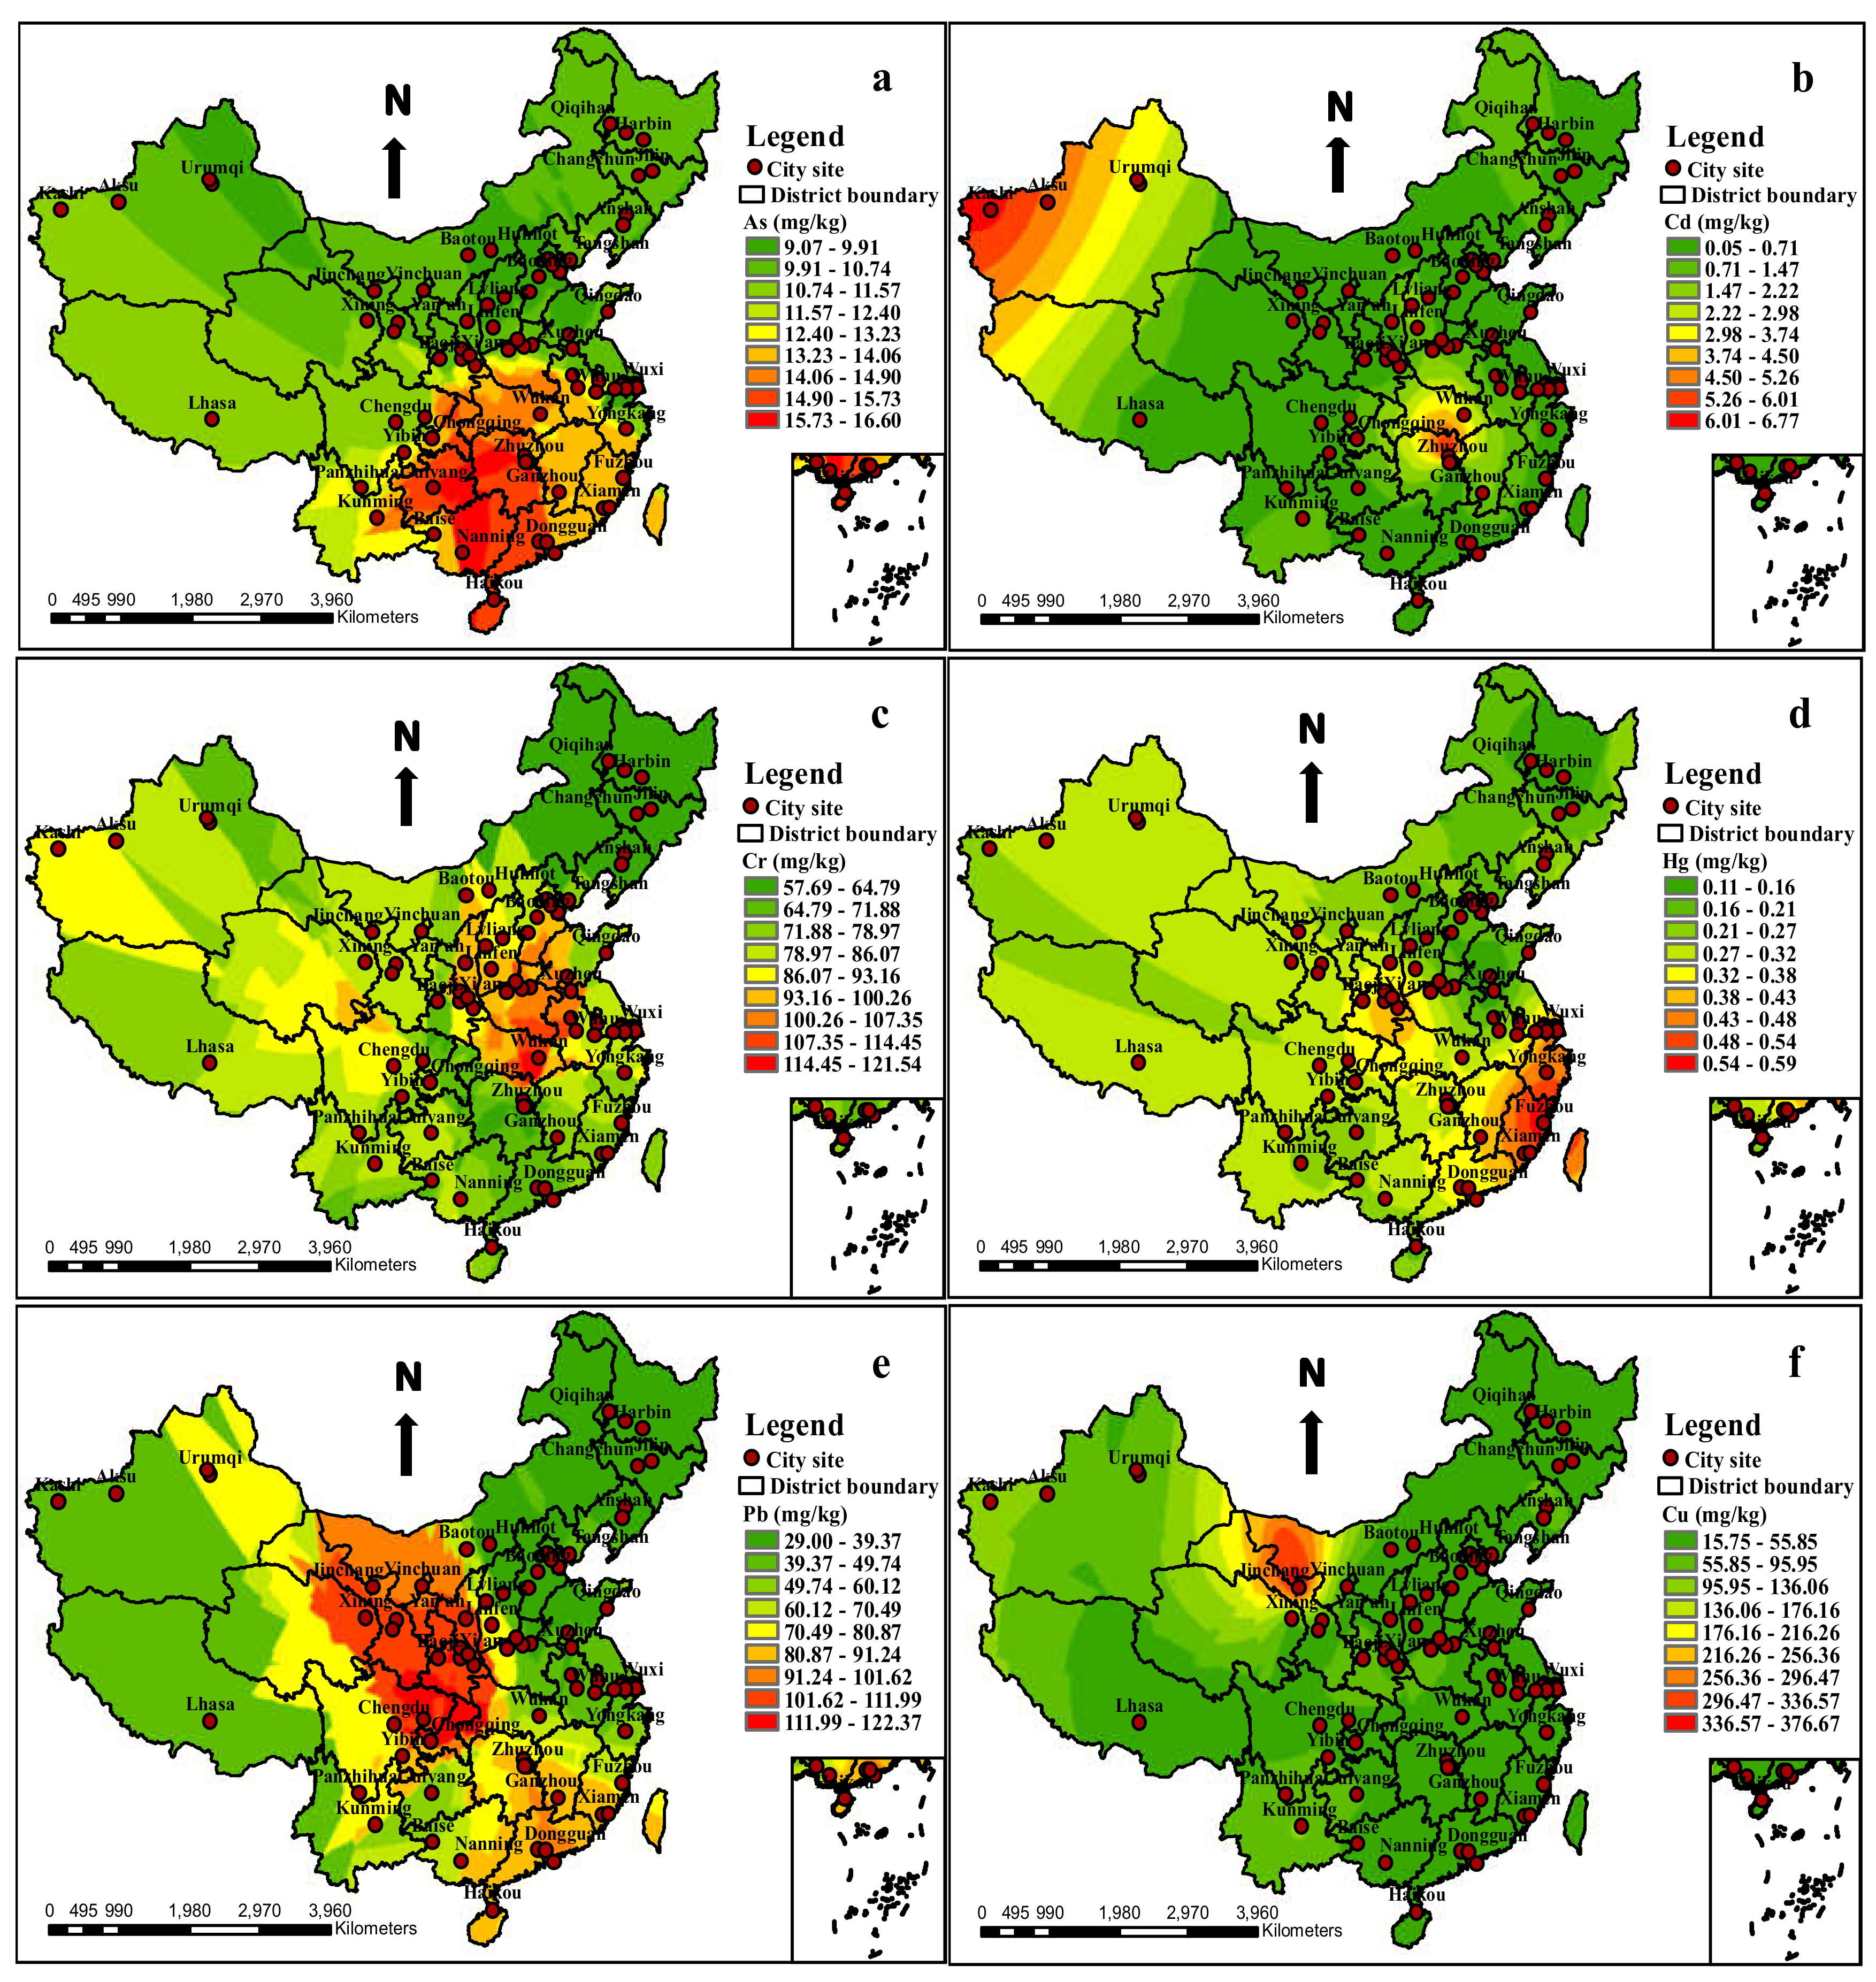
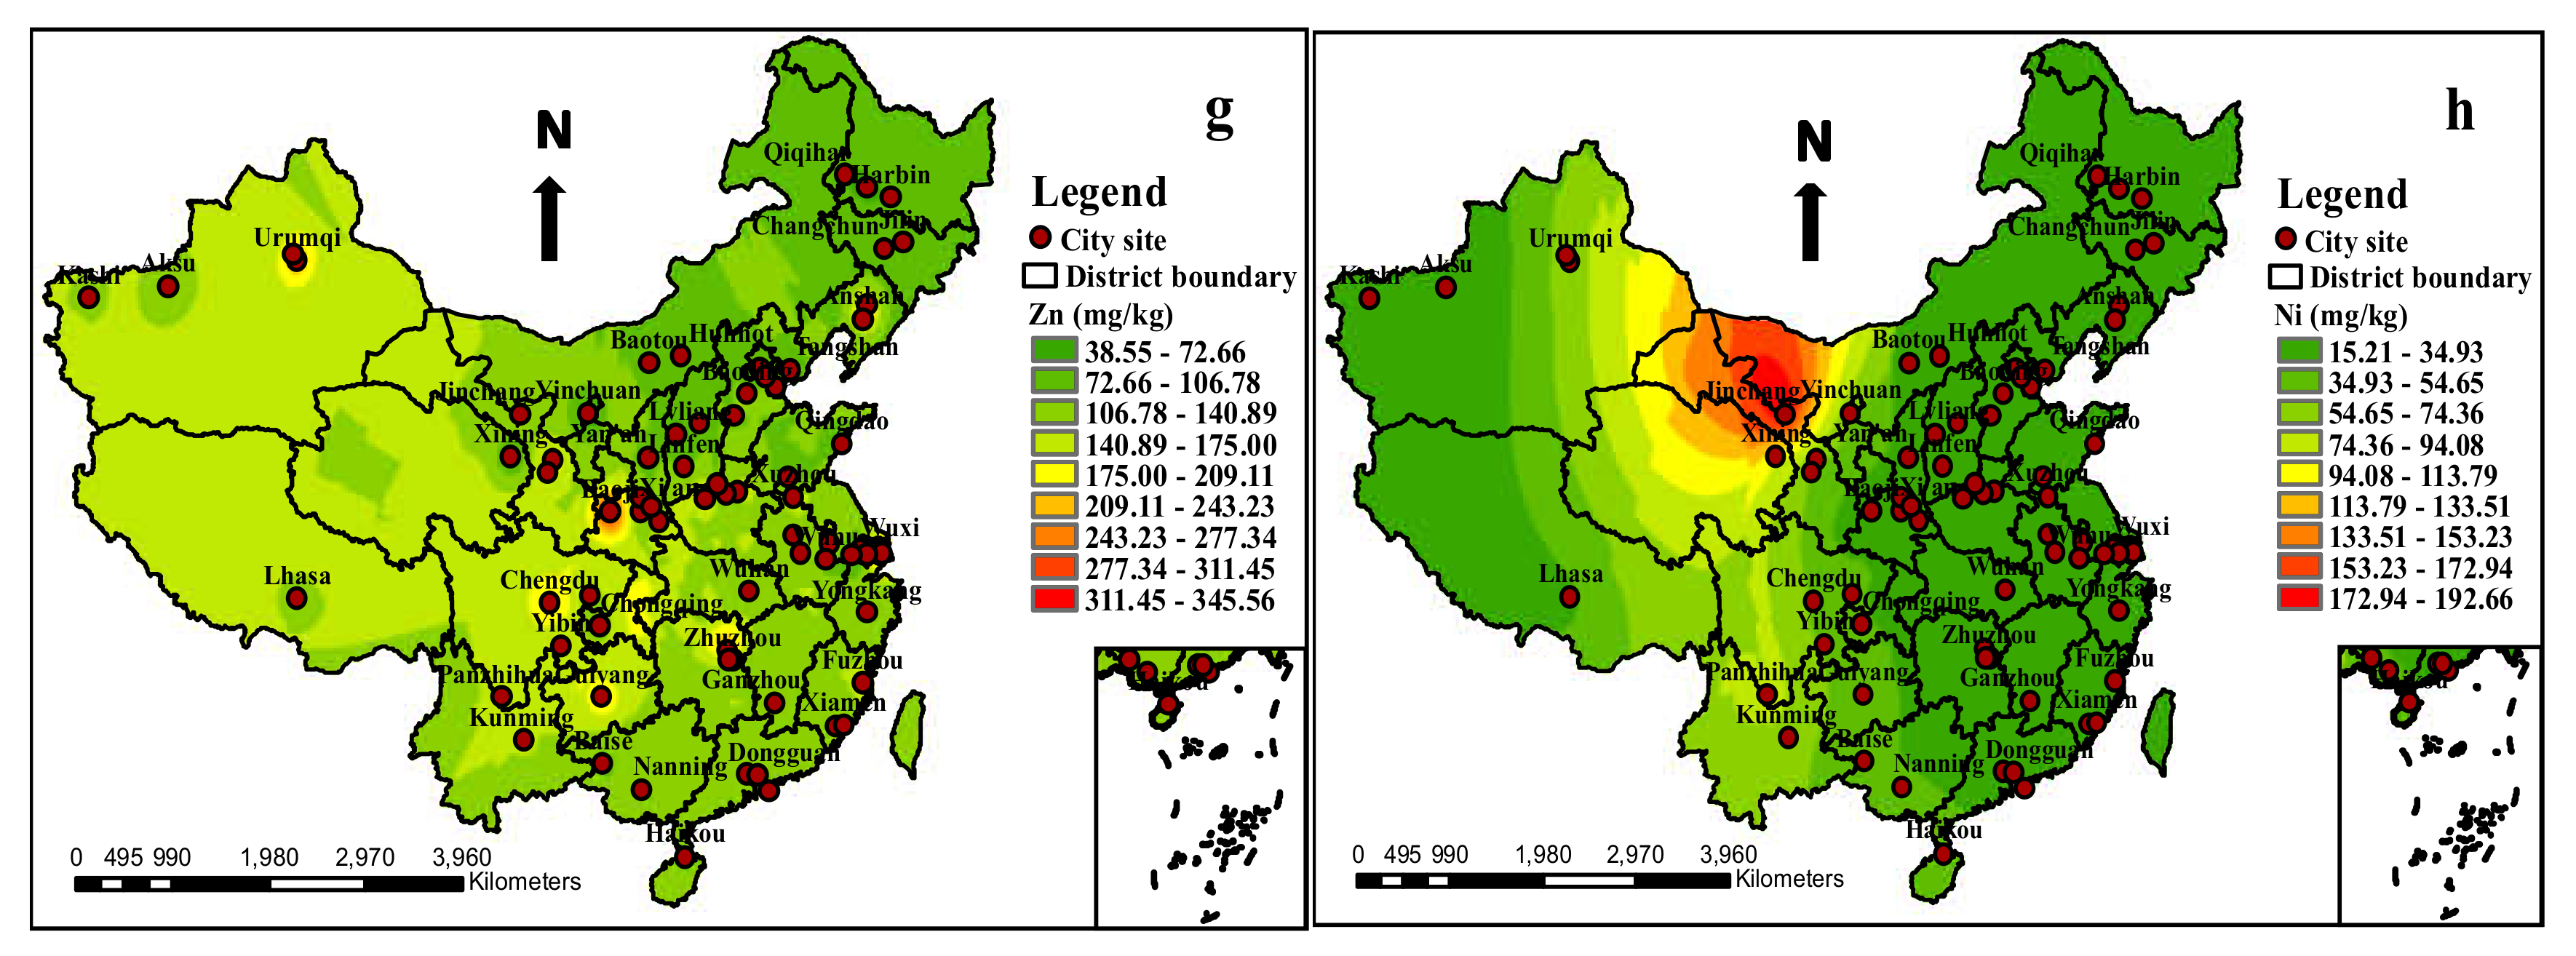
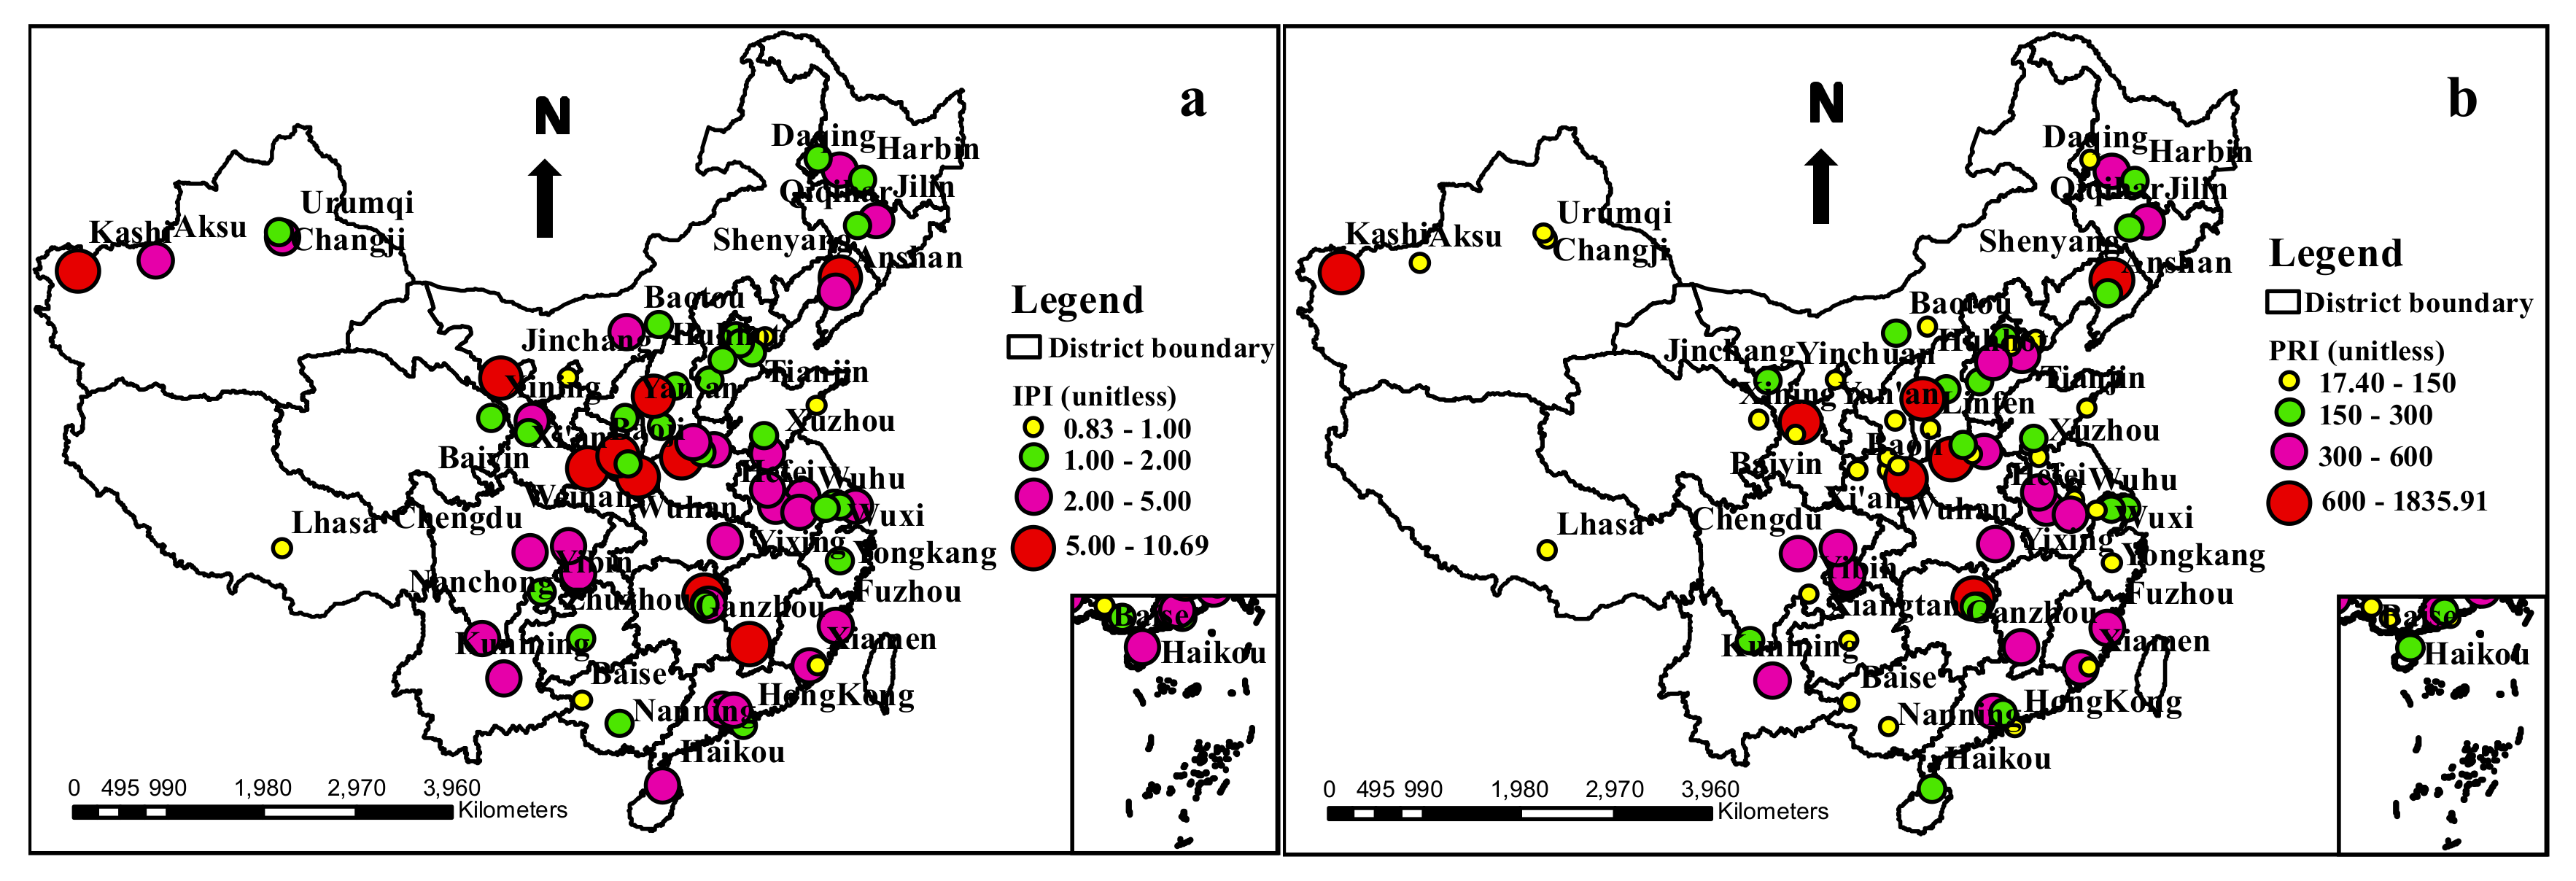
3.1. Heavy Metal Concentrations and Spatial Distributions

The minimum, maximum, mean, median, standard deviation and coefficient of variation statistical characteristics and the spatial distributions of the eight heavy metals in the urban soils of 71 cities, at the national scale in China, are presented in Table 3 and Figure 2, respectively. As shown in Table 3, the concentrations of the heavy metals were in the following ranges: As: 3.82–32.80 mg/kg, with a mean value of 11.53 mg/kg; Cd: 0.10–6.90 mg/kg, with a mean value of 0.79 mg/kg; Cr: 15.32–378.86 mg/kg, with a mean value of 77.86 mg/kg; Hg: 0.04–0.77 mg/kg, with a mean value of 0.27 mg/kg; Pb: 7.52–409.20 mg/kg, with a mean value of 60.26 mg/kg; Cu: 13.55–430.00 mg/kg, with a mean value of 47.72 mg/kg; Zn: 26.00–374.47 mg/kg, with a mean value of 128.21 mg/kg; and Ni: 8.41–361.00 mg/kg, with a mean value of 37.99 mg/kg. All of the mean values exceeded the soil background values of China [35]; in particular, Cd and Hg were 8.14 and 4.15times higher than the national background, respectively, indicating the influence of urbanization and industrialization on urban soil pollution and that the pollutants’ influence on the soil environment is serious [26,28]. The results showed that the median concentrations of all the elements were slightly lower than their mean concentrations. In addition, the CV of heavy metals in urban soils decreased in the following order: Cd > Ni > Cu > Pb > Cr > Hg > Zn > As, all of which manifested a high degree of variability and a much stronger nonhomogeneous distribution of concentrations, due to anthropogenically emitted heavy metals, with increasing CV values, especially for Cu, Ni and Cd [6,15,47].
In order to identify the spatial distributions of the heavy metal concentrations in reviewed urban soils across China, the ordinary kriging interpolation method was used to obtain the spatial distribution patterns of the elements, performed by the GIS software (ArcGIS 10.1) (Figure 2). It should be mentioned that any interpolation methods involve uncertainty, and the results from specific sites should be taken as the expected possible values but not the true values [115]. As shown in Figure 2, the element of As presented high concentrations in the south region and low concentrations in the north, northwest and northeast regions; the hot−spot locations were concentrated in several cities, including Guiyang, Zhuzhou, Changsha and Lanzhou. The high concentrations of Cd were mainly distributed in the southcentral and northwest region, and the hot-spots were located in Kashi, Wuhan and Changsha cities. For Cr, the high concentrations were mainly concentrated in the northcentral, and north regions, including Panzhihua, Ganzhou, Xuzhou, Changsha, Jiaozuo, Yongkang, Xining and Yinchuan hot−spot cities. The high concentrations of Hg were mainly distributed in the northcentral and east coastal regions, with the hot-spots located in Shangluo, Guangzhou, Zhangzhou, Fuzhou and Suzhou cities. The element of Pb presented high concentrations in the southeast and northwest regions, with the hot-spot cities being located in Hong Kong, Dongguan, Guangzhou, Ganzhou, Baoji, Tongchuan and Shangluo. Similar distribution patterns manifested for Cu and Ni, both of which had hot-spots situated in Kunming, Panzhihua, Guiyang and Jinchang cities. As for Zn, the high concentrations were concentrated in Chengdu, Guiyang, Changsha, Baoji, Lanzhou, Luoyang, Shenyang, Changji, Shanghai and Urumqi cities.
On the whole, the hot-spot cities for heavy metals in urban soils were mainly concentrated in the southwest, southcentral, southeast, east coast, northwest and northcentral regions of China, which should be labeled as priority regions for controlling heavy metal contamination. It was indicated that the southern part was more contaminated than the northern part, which may be associated with the high geochemical background in the southwest regions and long-term industrial activities. For example, Yunnan Gejiu Tin capital, Lanping Zinc capital, Sichuan Panzhihua V-Ti magnetite, Guizhou Liupanshui coal mine, Gansu Jinchang nickel capital, Hunan Shizhuyuan polymetallic mine, Guangxi Dachang Sb polymetallic mine, Guangdong Dabaoshan polymetallic mine, and Fujian Youxi Pb-Zn mine are all located in the highly-contaminated regions, which could generate other accompanying heavy metals such as Cd and Cr [116]. Furthermore, the increasing urban populations and manufacturing industries activities may also be significant contributors to the pollution [27,47,117]. In addition, since the data collected in Xizang, Xinjiang and Gansu provinces had less published literature and several abnormal values were eliminated in Qingdao, the authentic contamination levels of that region might not have been accurately determined.

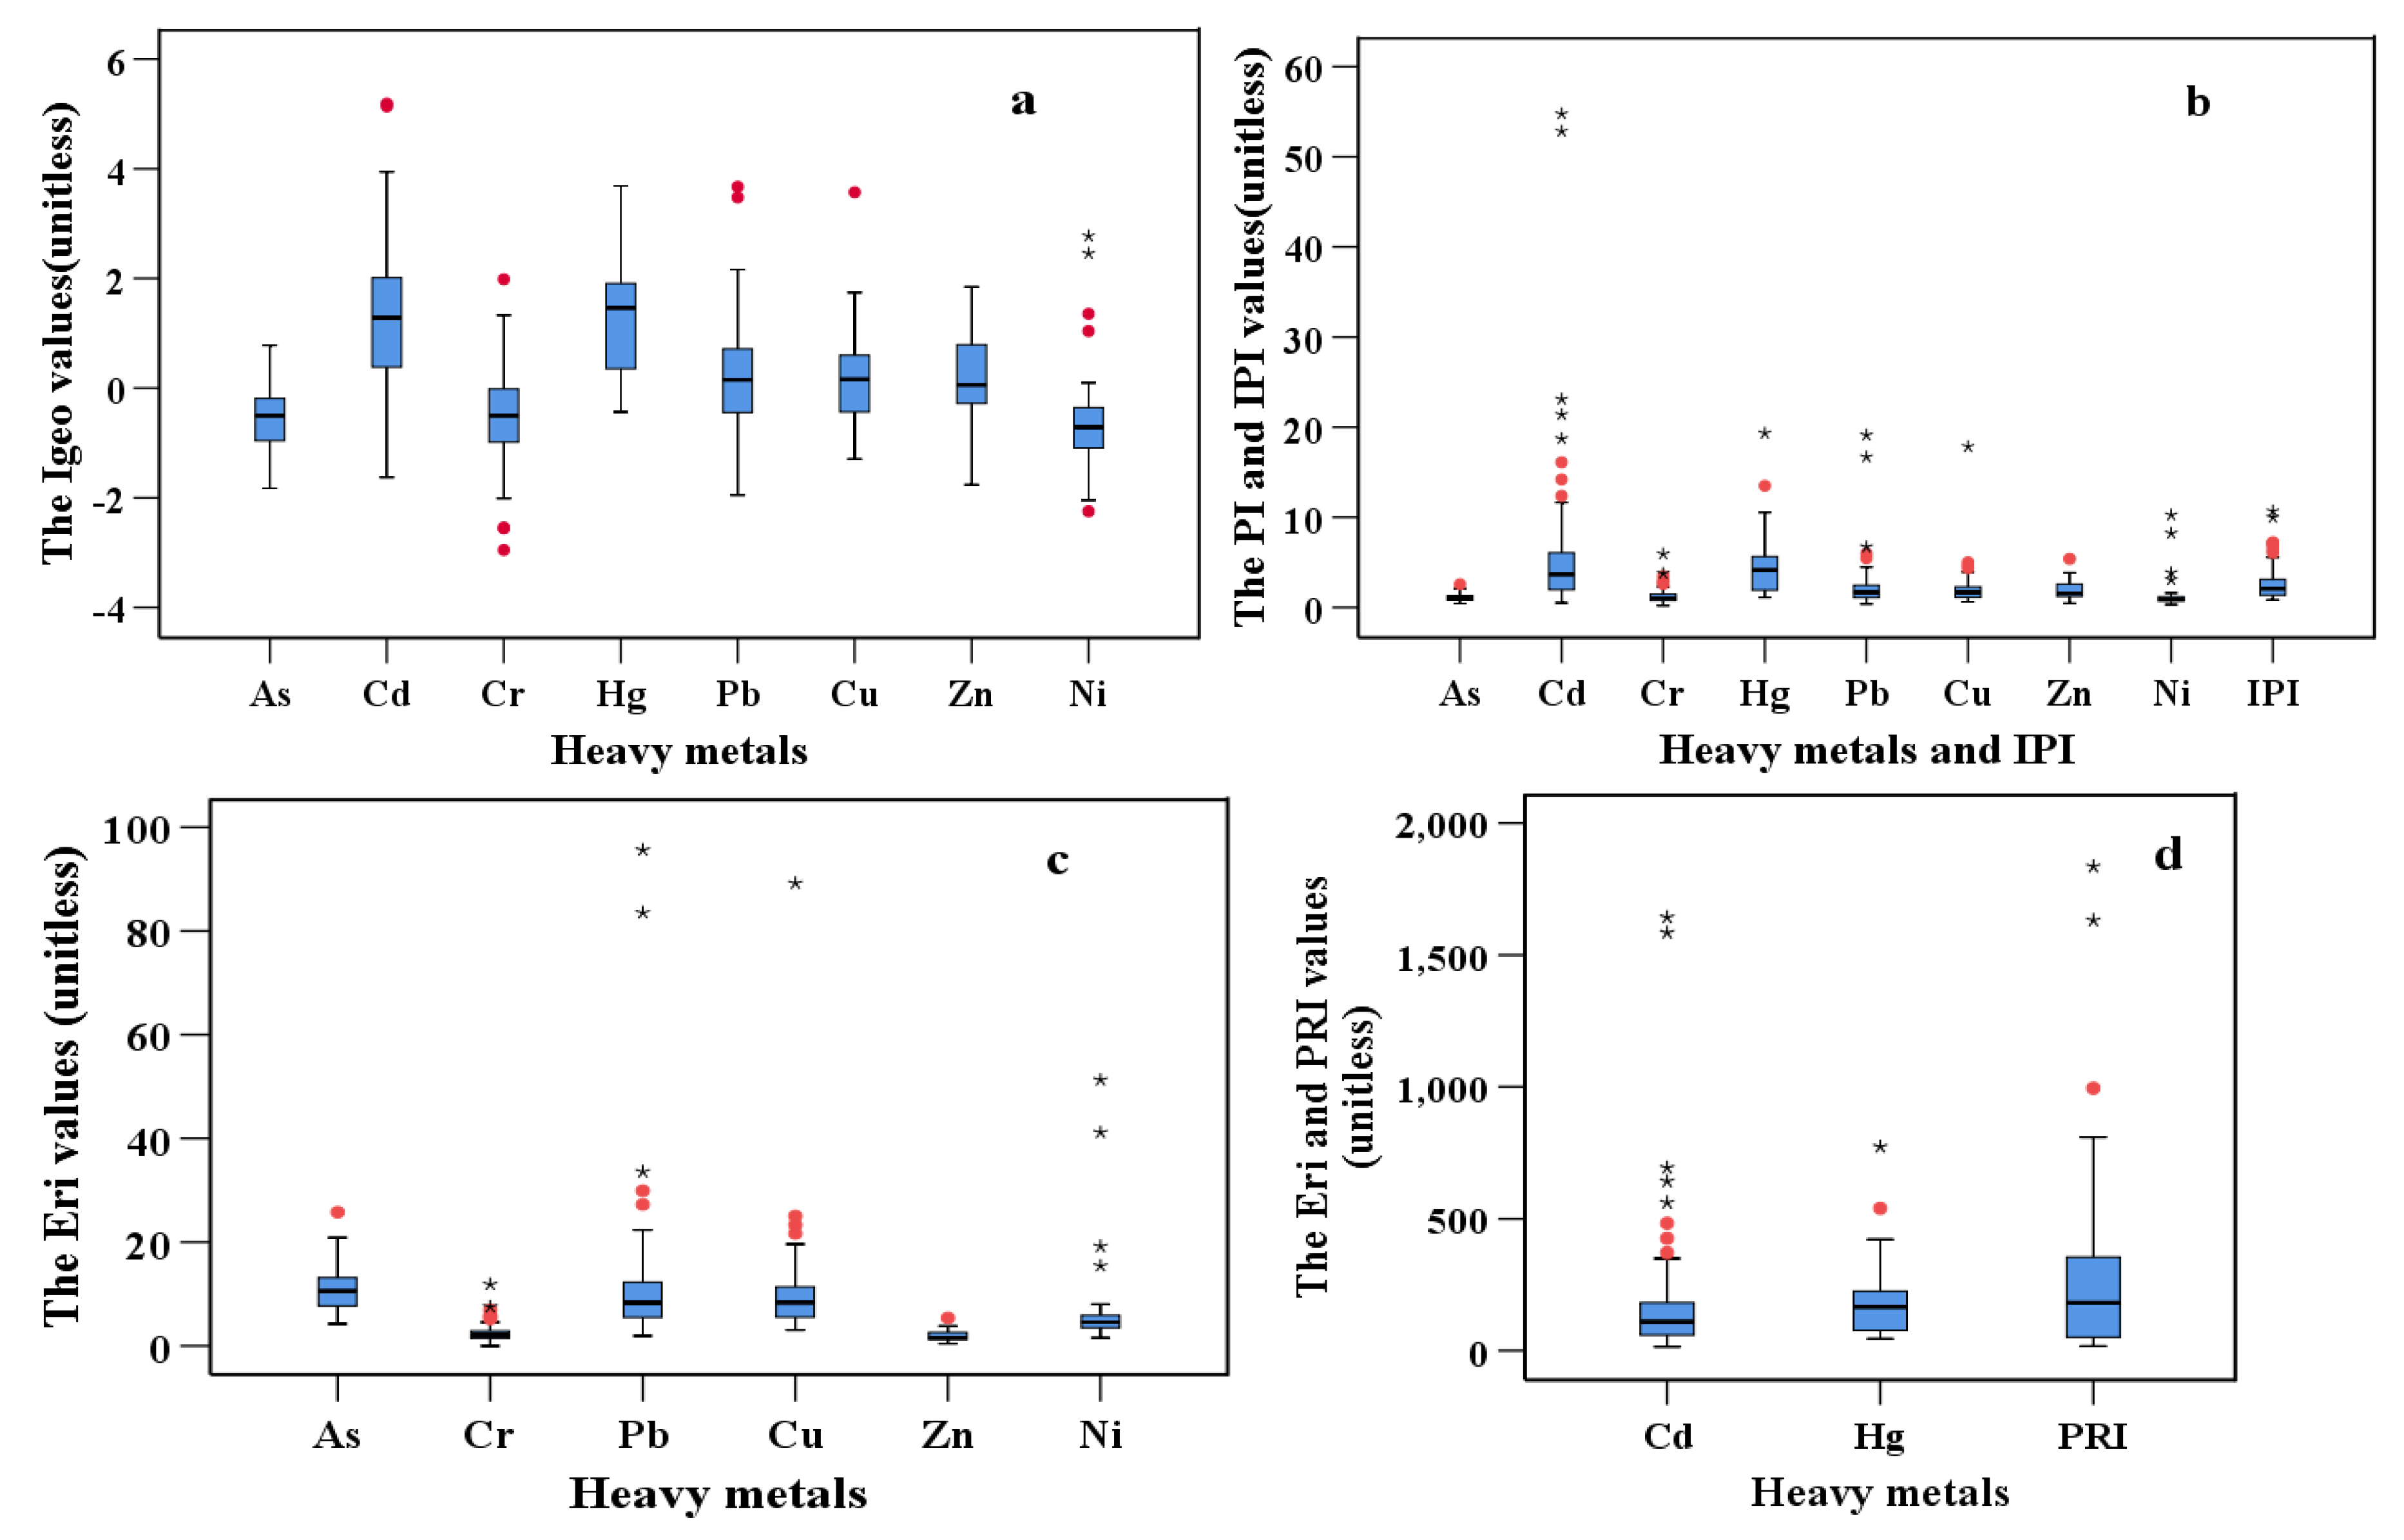
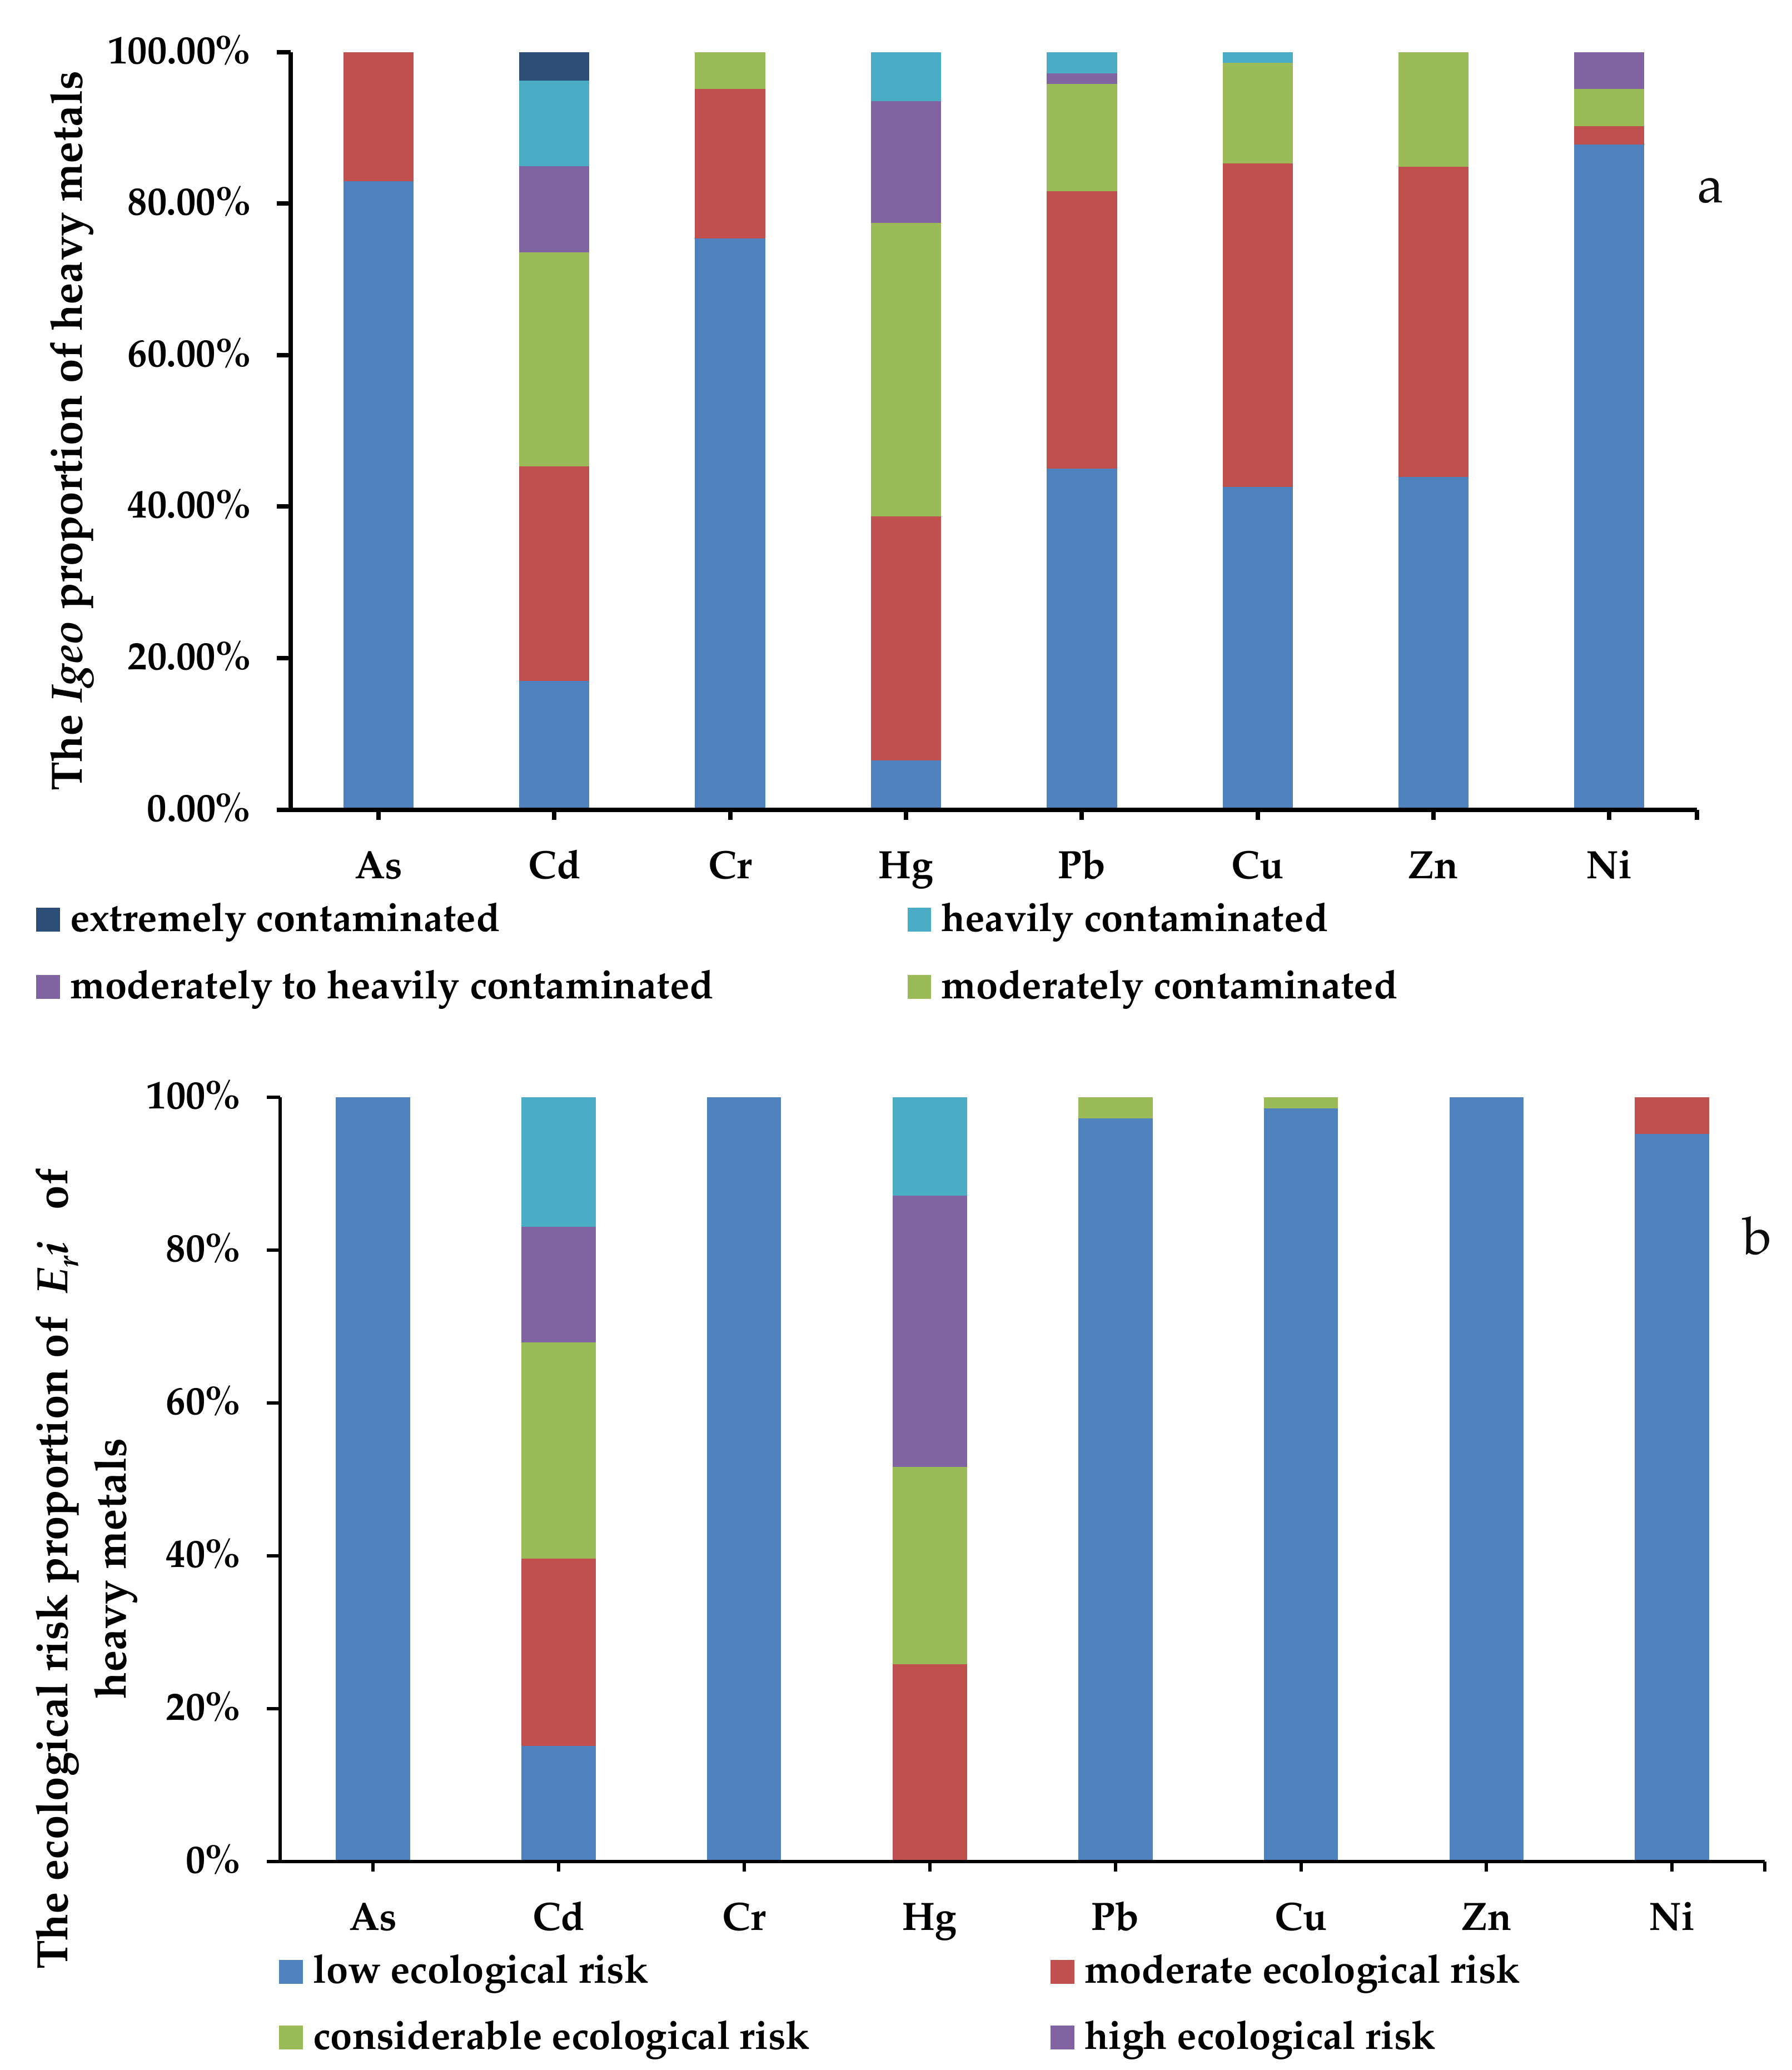
3.2. Assessment of Heavy Metals Pollution in Urban Soils Using Geochemical Indicators

The Box-plots of the Igeo, PI, IPI, E r i and PRI of the heavy metals in urban soil around China are presented in Figure 3; as shown in Figure 3, the Igeo, PI, IPI, E r i PRI values of the heavy metals varied significantly across different sites. The Igeo values for As, Cd, Cr, Hg, Pb, Cu, Zn and Ni ranged from −1.82 to 0.78, −1.63 to 5.19, −2.95 to 1.99, −0.43 to 3.69, −1.95 to 3.67, −1.29 to 3.57, −1.76 to 1.85 and −2.25 to 2.77, respectively, and the mean values decreased in the following order: Cd (1.35) > Hg (1.32) > Pb (0.26)> Cu (0.18) > Zn (0.16) > Cr (−0.51) > Ni (−0.56) > As (−0.59). The mean pollution levels of Hg and Cd represented moderate contamination levels, Pb, Cu and Zn indicated uncontaminated to moderately contaminated levels, and the levels of Cr, Ni and As represented non−contamination levels, based on the Igeo classification criterion. As was shown in Figure 4, As manifested at uncontaminated and uncontaminated to moderately contaminated levels in 82.98% and 17.02% of sites, respectively. Cd manifested the most serious contamination in the study area, manifesting at the different levels in the following proportions of sites: uncontaminated, 16.98%; uncontaminated to moderately contaminated, 28.30%; moderately contaminated, 28.30%; moderately to heavily contaminated, 11.32%; heavily contaminated, 11.32%; and extremely contaminated, 3.77%. The Igeo values of Cd in the cities of Changsha and Kashi reached 5.19 and 5.14, respectively, all of which denoted extreme contamination. For Cr and Zn, uncontaminated, uncontaminated to moderately contaminated and moderately contaminated levels represented 75.41%, 19.67% and 4.92%; and 43.94%, 40.91% and 15.15% of sites, respectively. Hg manifested at different levels of contamination according to the following proportions: uncontaminated, 6.45%; uncontaminated to moderately contaminated, 32.26%; moderately contaminated, 38.71%; moderately to heavily contaminated, 16.13%; and heavily contaminated, 6.45%. The higher Igeo values for Hg were located in Shangluo (3.69) and Baiyin (3.17) cities, all of which reached heavily contaminated levels. Pb manifested contamination levels with uncontaminated, uncontaminated to moderately contaminated, moderately contaminated, moderately to heavily contaminated and heavily contaminated levels in 45.07%, 36.62%, 14.08%, 1.41% and 2.82% of sites, respectively; and Baoji and Tongchuan cities showed heavily contaminated levels, the Igeo values of which reached 3.67 and 3.48, respectively. For Cu, contamination levels with uncontaminated, uncontaminated to moderately contaminated, moderately contaminated, and heavily contaminated levels were in 42.65%, 42.65%, 13.24% and 1.47% of sites, respectively; and the most serious contamination was located in Jinchang, which showed heavily contaminated levels, with Igeo values reaching 3.57. Ni had the most sites with uncontaminated levels, with uncontaminated, uncontaminated to moderately contaminated, moderately contaminated, moderately to heavily contaminated levels in 87.80%, 2.44%, 4.88% and 4.88% of sites, respectively.
The mean PI values decreased in the following order: Cd (7.07) > Hg (4.85) > Pb (2.45) > Cu (2.10) > Zn (1.91) > Ni (1.43) > Cr (1.28) > As (1.09) (Figure 3). The mean values of Cd and Hg reached high contamination levels, and the mean values of Pb, Cu, Zn, Ni, Cr and As reached moderate contamination levels, based on the PI classification criterion. The PI values of Cd in Changsha (54.76) and Kashi (52.83) manifested the highest contamination levels among all the cities; for Hg, the highest contamination levels were located in Shangluo, Baiyin and Shenyang cities, with PI values of 19.33, 13.50 and 10.54, respectively. For Pb, the highest contamination levels were located in Tongchuan and Baoji cities, with PI values of 16.70 and 19.12, respectively. The highest contamination levels of Cu and Ni were located in Jinchang city, with PI values of 17.84 and 10.26, respectively. For Zn and As, the highest contamination sites were located in Baoji, Jiaozuo and Shenyang cities, respectively, and the PI values of were 5.40, 5.94 and 2.58, respectively. All of the high PI value cities, for every metal mentioned in the former, reached high contamination levels, with the exception of the PI value of As in Shenyang, which reached moderate contamination levels.
The IPI values ranged between 0.83 and 10.69 among all of the cities, with a mean value of 2.73 (Figure 3), which showed that the mean contamination of all of the urban soils in the study areas was at a high contamination level, based on the IPI classification criterion. As shown in Figure 5, the low contamination levels were mainly distributed in the northern region, and the high contamination and extremely high contamination levels were mainly distributed in the northwest, north center, southwest, south center, east and east coast regions of China. The extremely high contamination levels of the cities were mainly located in Kashi, Changsha, Shangluo, Tongchuan, Luoyang, Jinchang, Baoji and Ganzhou, Lvliang, and Shenyang, the IPI values of which were 10.69, 9.99, 7.23, 7.16 7.10, 6.82, 6.38, 6.06, 5.56 and 5.47, respectively.
The mean E r i values decreased in the following order: Cd (212.23) > Hg (194.17) > Pb (12.26) > As (10.91) > Cu (10.50) > Ni (7.13) > Cr (2.48) > Zn (1.91). Based on the E r i classification criterion, the mean E r i values of Cd and Hg showed high ecological risks degrees; the mean E r i values of other six metals were below 40, representing low ecological risk degrees. As shown in Figure 4, the percentages of ecological risk degrees for As, Cr and Zn were at low ecological risk degree in 100% of sites; Pb, Cu and Ni manifested low ecological risk degrees in 97.18%, 98.53% and 95.12% of sites, respectively; for Cd, low, moderate, considerable, high and very high ecological risk degrees presented in 15.09%, 24.53%, 28.30%, 15.09% and 16.98% of sites, respectively; and Hg manifested moderate, considerable, high and very high ecological risk degrees in 25.81%, 25.81%, 35.48% and 12.90% of sites, respectively. Therefore, it could be inferred that Cd and Hg served as the predominant ecological risk factors amongst the eight metals, and contributed the most to the ecological risk degree of urban soils among all of the study cities.
The PRI values ranged between 17.40 and 1835.91 among all of the cities, with a mean value of 280.93 (Figure 3), which demonstrated that the mean ecological risk of all the urban soils in the study areas was moderate, based on the PRI classification criterion. As shown in Figure 5, the low ecological risk degrees and moderate ecological risk degrees were mainly distributed in the north of China, while the considerable ecological risk degrees and high ecological risk degrees were mainly distributed in the southwest, south center, north center, east and east coast regions of China, which presented similar distributions of the IPI. High ecological risk degrees were mainly located in Changsha (1835.91), Kashi (1631.60), Shangluo (994.86), Lvliang (671.64), Shenyang (809.63), Luoyang (737.56) and Baiyin (655.60).
On the whole, the Igeo, PI and E r i values of Cd and Hg were all higher than those of the other six metals, and these manifested the highest contamination levels and ecological risk degrees among the eight metals; consequently, Cd and Hg should be labeled as the priority metals for control in the urban soils around China. Furthermore, according to the IPI and PRI values (Figure 5), the high contamination and ecological risk regions were mainly concentrated in the southwest, south center, north center, east and east coast regions of China, while the cities were mainly located in Kashi, Changsha, Shangluo, Tongchuan, Lvliang, Jinchang, Luoyang, Baoji, Ganzhou, Shenyang and Baiyin.

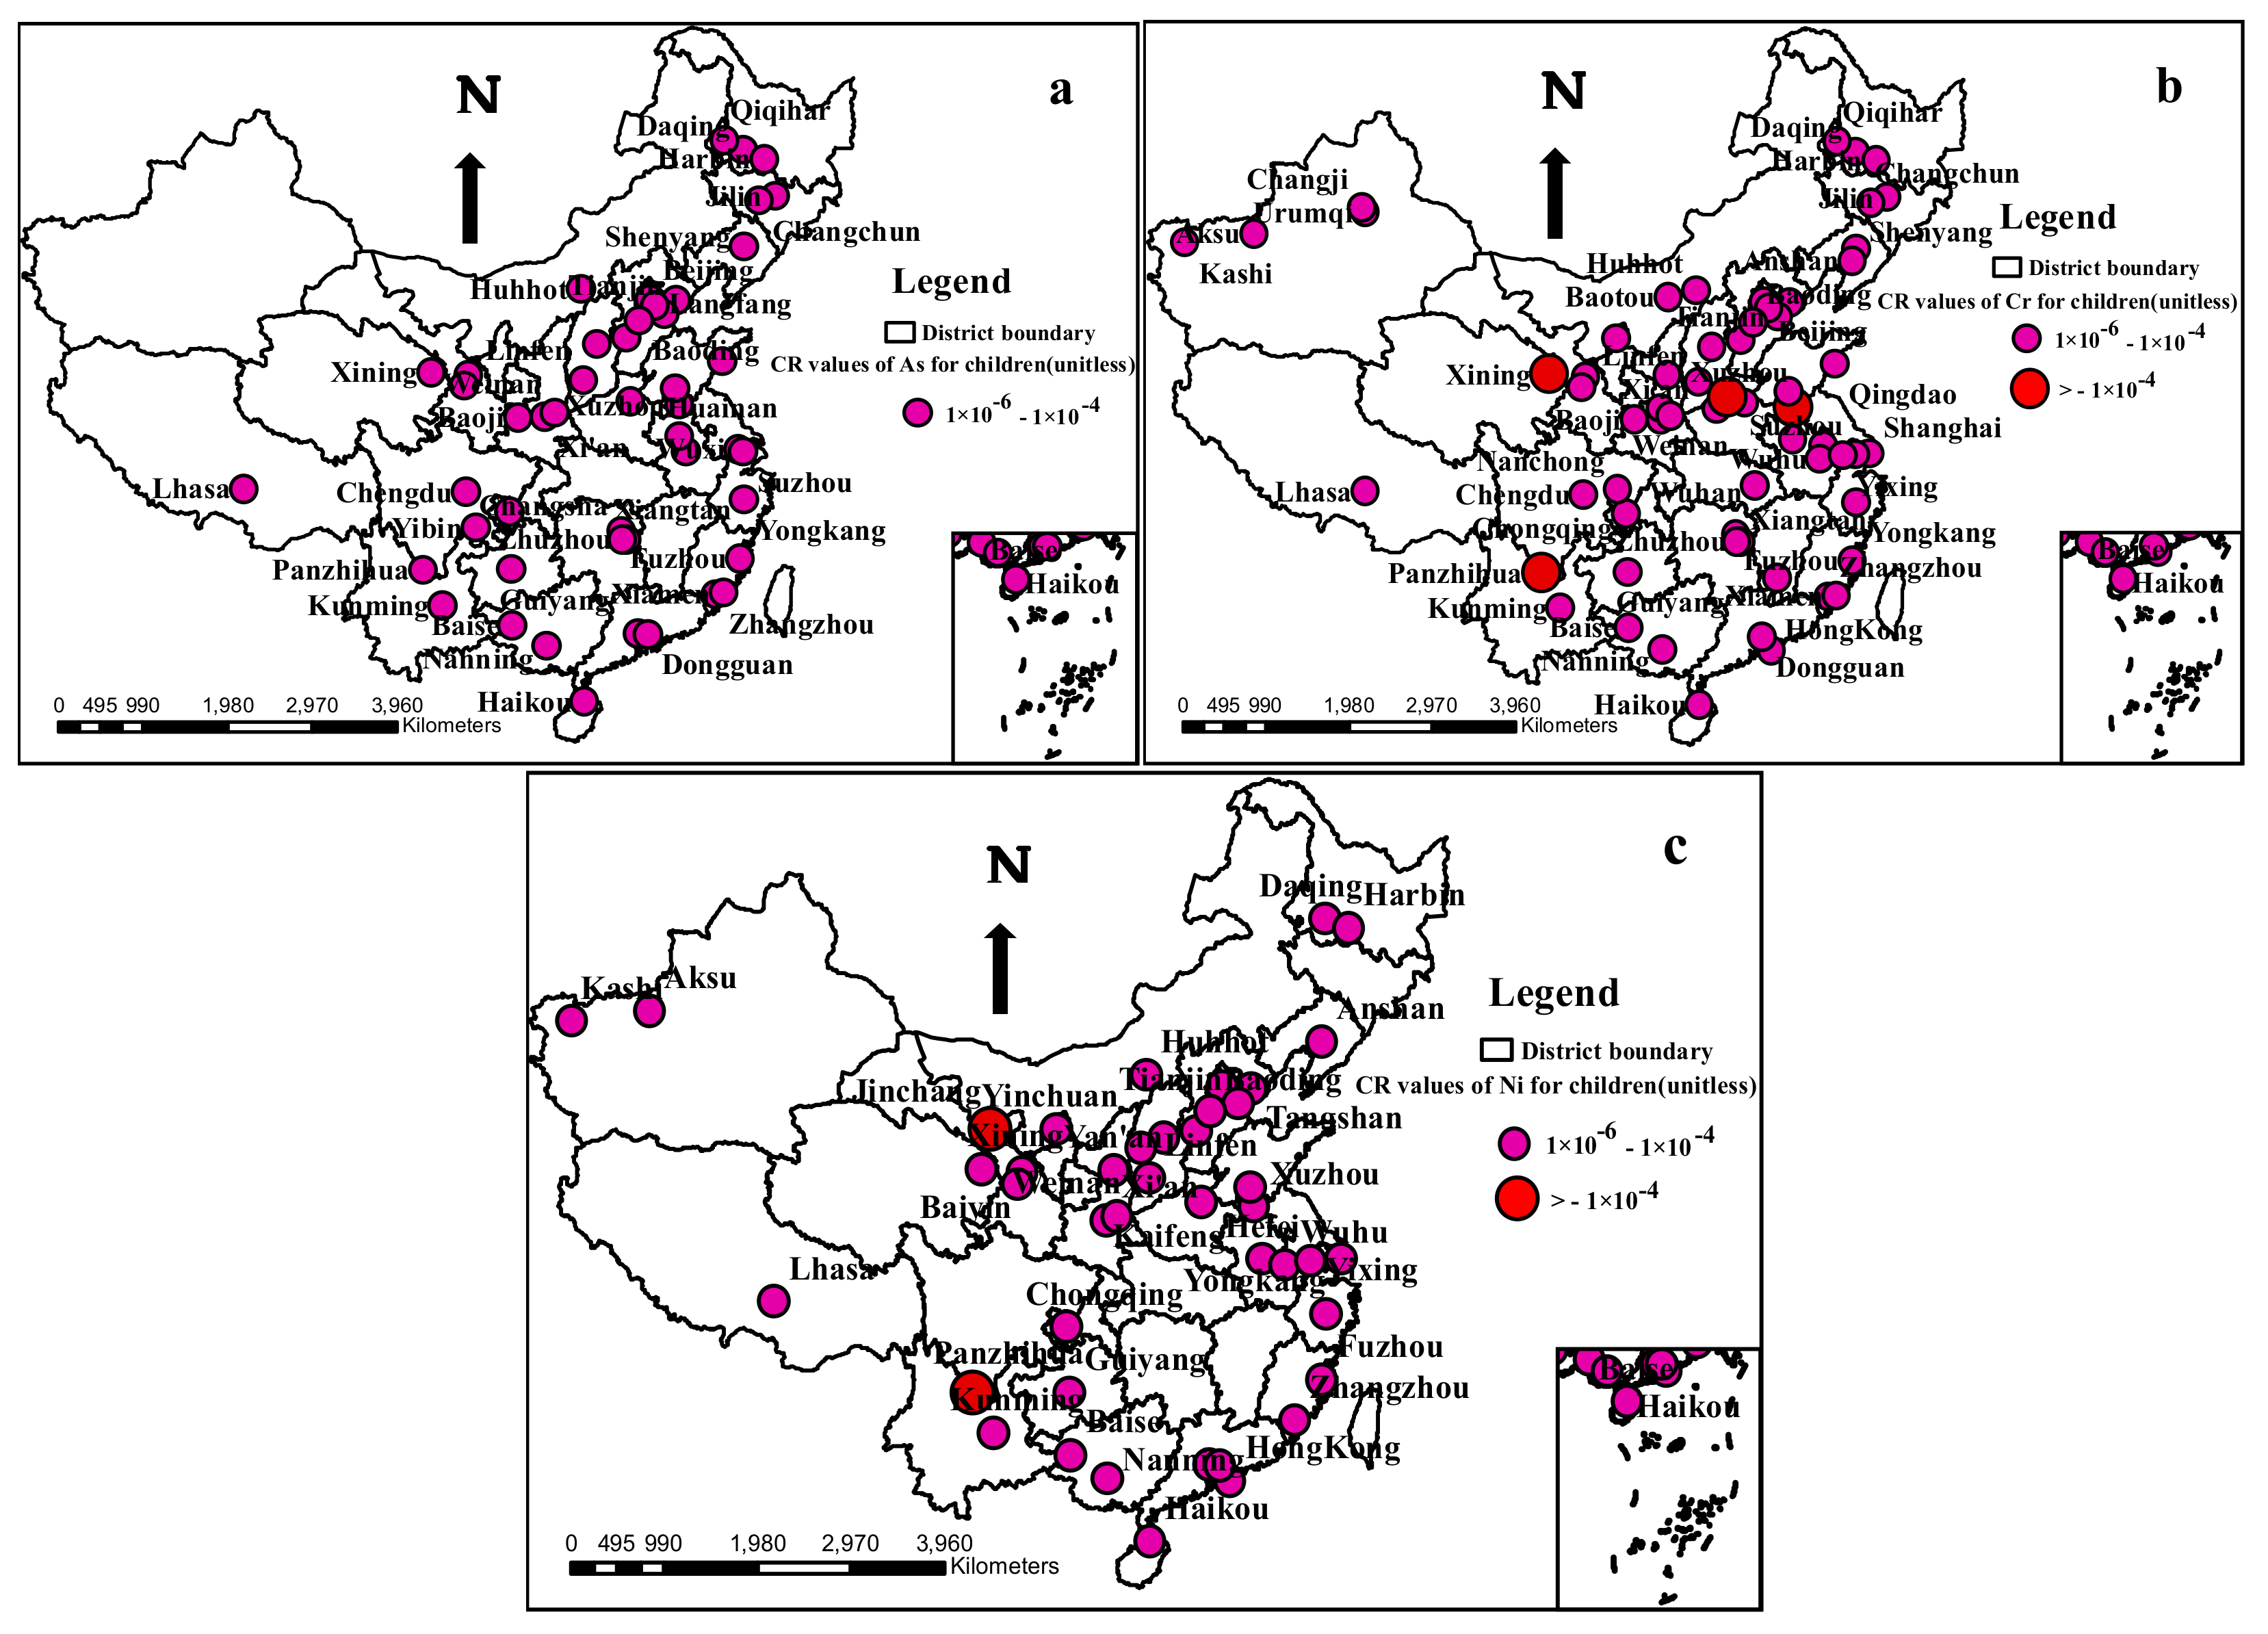
3.3. Health Risk Assessment of Heavy Metal Contamination in Urban Soils

The assessment results of the mean values of non−carcinogenic and carcinogenic risks of each element, through the three exposure pathways, in urban soils are shown in Table 4. The mean HQ values of the eight metals for children and adults via ingestion (HQing), inhalation (HQinh) and dermal contact (HQdermal) all descend in the trend HQing > HQdermal > HQinh, showing that ingestion was the predominant exposure pathway to pose adverse effects on human health, which was consistent with previous research [15,19]. In addition, the HQing and HQdermal values for children were higher than those for adults, while for the HQinh values, the opposite was true. The mean HI values of As, Cd, Cr, Hg, Pb, Cu, Zn and Ni for children and for adults were all less than 1, illustrating that adverse effects on human health were unlikely; in addition, they followed the decreasing trend for children As > Cr > Pb > Ni > Cd > Cu > Hg > Zn, and for adult Cr > As > Pb > Ni > Cd > Hg > Cu > Zn. The mean pollution levels of Hg and Cd represented moderately contaminated levels, whereas Cr and As were at uncontaminated levels, based on the Igeo classification criterion; however, Cr and As contributed most to the HI while Hg and Cd did less so, illustrating that the metals at uncontaminated levels should also be paid attention to. In term of the individual urban sites, the HI values of the eight metals for adults were all less than 1; however, some of the risk values for children exceeded 1—for example, the HI values of As in Changsha (1.45) and Nanning (1.02); Cr in Jiaozuo (2.29), Xining (1.10) and Ganzhou (1.04); and Pb in Baoji (1.60) and Tongchuan (1.39)—which demonstrated that heavy metals were unlikely to have adverse effects on adults, whereas adverse health effects may occur on children. Furthermore, the HI values for children were higher than those for adults, indicating that children are exposed more serious non−carcinogenic health threats compared to adults, which might be induced by physiological behaviors in children such as direct finger or hand sucking and higher exposure per unit of body weight [15,48]. It has been reported that the mean IQ (Intelligence Quotient) of children aged between 3 and 4 years with significantly higher blood Pb levels in the exposure area was significantly lower than that of children of the same age in the control area [31,118].
The carcinogenic risks (CRs) for As, Cr and Ni were assessed (Table 4), and Cd, Hg, Pb, Cu and Zn were excluded owing to the lack of carcinogenic slope factors. The values of CRing, CRinh and CRderm ranked in the descended order of CRing > CRdermal > CRinh, indicating that ingestion was the main exposure pathway that posed carcinogenic risks to human health, which was consistent with the non-carcinogenic risks. The values of CRing for children exceeded those of that for adults, while for CRinh and CRderm, the values for adults were higher than for children. The mean CR values of As, Cr and Ni for children and adults all lay within the range of 10−6 to 10−4, indicating an acceptable carcinogenic risk to human beings. Nevertheless, due to the cumulativity of the heavy metals, the carcinogenic risks of those metals cannot be neglected, especially for children. The CR values for children surpassed those for the adults, which were similar to the HI values. The CR values of the three metals had a trend of Ni > Cr > As for both adults and children, which was consistent with previous research in 32 urban soils in China conducted by Pan [31].
In terms of the single urban site, the carcinogenic risks of the three assessed metals for adults were all at negligible or acceptable risk levels; however, for children, the risk values in several sites surpassed 1 × 10⁻⁴. The distribution of CR for children in urban soils in China were mapped (Figure 6). According to Figure 6, all of the CRs of As for children were at acceptable risk levels; however, some values were close to the threshold value of 1 × 10⁻⁴, illustrating that the carcinogenic risk of As should also be brought to forefront. With regard to Cr and Ni, the majority of the urban sites were at acceptable risk levels for children, with the exception of several sites that reached high risk levels for developing cancer. For Cr, the high risk sites for developing cancer for children were located in Panzhihua (1.32 × 10⁻⁴), Xuzhou (1.24 × 10⁻⁴), Xining (1.03 × 10⁻⁴) and Jiaozuo (2.14 × 10⁻⁴); for Ni, such sites were distributed in Jinchang (6.86 × 10⁻⁴) and Panzhihua (2.38 × 10⁻⁴); all of the CR values of the aforementioned sites exceeded the threshold value of 1 × 10⁻⁴, suggesting that the pollution sources should be quantitively identified and that precautionary measures should be taken in these cities to reduce the cancer risks. Additionally, children’s living behaviors should be−also properly guided, such as by encouraging them to wash their hands regularly and reducing the frequency of outdoor activities.

4. Conclusions

The mean values of eight heavy metals all exceeded the soil background values in China; in particular, Cd and Hg were 8.14 and 4.15 times higher than the national background. All of the CV values of metals showed a high degree of variability and the strong influence of human activities. The hot-spot cities for heavy metals in urban soils were mainly concentrated in the southwest, southcentral, southeast coast, northcentral and northwest regions of China, based on the ordinary kriging interpolation method. The mean pollution levels of Hg and Cd represented moderately contamination levels, Pb, Cu and Zn indicated uncontaminated to moderately contaminated levels, and the levels of Cr, Ni and As represented non−contamination levels, based on the Igeo classification criterion. According to the PI classification criterion, Cd and Hg reached high contamination levels, and the other metals reached moderate contamination levels. The integral urban soils in the study areas had a high contamination level and moderate ecological risk degree, respectively. Cd and Hg posed as the dominant ecological risk factors among the eight metals, which should be labeled as priority metals for control in the urban soils around China. The high contamination and ecological risk regions were mainly concentrated in the southwest, south center, north center, east and east coast regions of China, while the hot−spot cities were mainly located in Kashi, Changsha, Shangluo, Tongchuan, Lvliang, Jinchang, Luoyang, Baoji, Ganzhou, Shenyang and Baiyin. According to the HQ values, ingestion was the dominant exposure pathway for having adverse effects on human health. Although the mean HI values of the eight heavy metals all showed that adverse effects on human health were unlikely and the mean CR values of As, Cr and Ni for children and adults all suggested an acceptable carcinogenic risk to human beings, the risks in some of the single sites should be paid significant attention. Children are exposed to more serious non-carcinogenic and carcinogenic health threats compared to adults, indicating that children’s behaviors should be adapted by reasonable guidance and paid more attention in comparison with those of adults.

Limitations and Future Work

Due to the limited online data regarding heavy metals in urban soil in the western areas of China and the lack of data, especially for the small cities in some provinces, this study may not fully reflect the overall situation of heavy metal pollution in urban soil in China. With the action plan on The Belt and Road proposed by the Chinese government and the number of tourists into the western part increasing year on year, heavy metal pollution of the urban soil will inevitably occur, so comprehensive further research into the urban soil of the western part is needed.
The bioavailability is related to the morphology of the heavy metal, so the human risk assessment may be overestimated by only taking into account the total concentrations. For lack in the parameters of Cd, Hg, Pb, Cu and Zn, the hazard of which were not assessed. In addition, the elderly and sensitive humans should be studied separately, according to their body situations. Moreover, it has been reported that synergistic interactions generated by mixed metals can result in numerous adverse health effects on humans; thus, the health risks posed by multiple heavy metals should be furtherly evaluated.
Finally, at present, many soil remediation projects have been carried out in mining areas and agricultural soils; however, there is still a lack of effective treatment in urban soils around China. Therefore, soil assessment and remediation in densely populated urban areas should be extensively emphasized in the future. Additionally, the temporal and spatial variation and quantitative source apportionment of the urban soil pollution should be further studied based on the models.

Author Contributions

Conceptualization, S.M.T.; methodology, S.M.T. and H.L.; software, S.M.T.; validation, L.Y., H.L., and L.W.; formal analysis, S.M.T. and M.T.; data curation, S.M.T. and M.T.; writing—original draft preparation, S.M.T.; writing—review and editing, S.M.T.; visualization, S.M.T.; supervision, L.Y. and H.L.; project administration, L.Y.; funding acquisition, H.L., and L.W. All authors have read and agreed to the published version of the manuscript.

Funding

This work was supported by the Strategic Priority Research Program of Chinese Academy of Sciences (XDA23100400) and the National Key R&D Program of China (No.2018YFC0407502).

Conflicts of Interest

The authors declare no conflict of interest.

References

  1. Luo, X.S.; Yu, S.; Zhu, Y.G.; Li, X.D. Trace metal contamination in urban soils of China. Sci. Total Environ. 2012, 421–422, 17–30. [Google Scholar] [CrossRef] [PubMed]
  2. Stroganova, M.N.; Myagkova, A.D.; Prokofeva, T.V. The role of soils in urban ecosystems. Eur. Soil Sci. 1997, 30, 82–86. [Google Scholar]
  3. Faiz, Y.; Tufail, M.; Javed, M.T.; Chaudhry, M.M.; Naila, S. Road dust pollution of Cd, Cu, Ni, Pb and Zn along Islamabad Expressway, Pakistan. Microchem. J. 2009, 92, 186–192. [Google Scholar] [CrossRef]
  4. Gope, M.; Masto, R.E.; George, J.; Hoque, R.R.; Balachandran, S. Bioavailability and health risk of some potentially toxic elements (Cd, Cu, Pb and Zn) in street dust of Asansol, India. Ecotoxicol. Environ. Saf. 2017, 138, 231–241. [Google Scholar] [CrossRef] [PubMed]
  5. Puskas, I.; Fairsang, A. Diagnostic indicators for characterizing urban soils of Szeged, Hungary. Geoderma 2009, 148, 267–281. [Google Scholar] [CrossRef]
  6. Guo, G.; Wu, F.; Xie, F.; Zhang, R. Spatial distribution and pollution assessment of heavy metals in urban soils from southwest China. J. Environ. Sci. 2012, 24, 410–418. [Google Scholar] [CrossRef]
  7. Kelly, J.; Thornton, I.; Simpson, P.R. Urban Geochemistry: A study of the influence of anthropogenic activity on the heavy metal content of soils in traditionally industrial and nonindustrial areas of Britain. Appl. Geochem. 1996, 11, 363–370. [Google Scholar] [CrossRef]
  8. Manta, D.S.; Angelone, M.; Bellanca, A.; Neri, R.; Sprovieri, M. Heavy metals in urban soils: A case study from the city of Palermo (Sicily), Italy. Sci. Total Environ. 2002, 300, 229–243. [Google Scholar] [CrossRef]
  9. Xiao, R.; Guo, D.; Ali, A.; Mi, S.; Liu, T.; Ren, C.; Li, R.; Zhang, Z. Accumulation, ecological−health risks assessment, and source apportionment of heavy metals in paddy soils: A case study in Hanzhong, Shaanxi, China. Environ. Pollut. 2019, 248, 349–357. [Google Scholar] [CrossRef]
  10. Jiang, X.; Zou, B.; Feng, H.; Tang, J.; Tu, Y.; Zhao, X. Spatial distribution mapping of Hg contamination in subclass agricultural soils using GIS enhanced multiple linear regression. J. Geochem. Explor. 2019, 196, 1–7. [Google Scholar] [CrossRef]
  11. Keshav Krishna, A.; Rama Mohan, K. Distribution, correlation, ecological and health risk assessment of heavy metal contamination in surface soils around an industrial area, Hyderabad, India. Environ. Earth Sci. 2016, 75, 411. [Google Scholar] [CrossRef]
  12. Zhang, Y.; Li, S.; Chen, Z.; Wang, F.; Chen, J.; Wang, L. A systemic ecological risk assessment based on spatial distribution and source apportionment in the abandoned lead acid battery plant zone, China. J. Hazard. Mater. 2018, 354, 170–179. [Google Scholar] [CrossRef] [PubMed]
  13. Bullock, P.; Gregory, P.J. Soils in the Urban. Environment; John Wiley & Sons: Hoboken, NJ, USA, 1991. [Google Scholar]
  14. Huang, S.; Wang, L.; Zhao, Y. Ecological risk assessment from the perspective of soil heavy metal accumulations in Xiamen city, China. Int. J. Sustain. Dev. World Ecol. 2018, 25, 411–419. [Google Scholar] [CrossRef]
  15. Ying, L.; Shaogang, L.; Xiaoyang, C. Assessment of heavy metal pollution and human health risk in urban soils of a coal mining city in East China. Hum. Ecol. Risk Assess. Int. J. 2016, 22, 1359–1374. [Google Scholar] [CrossRef]
  16. Wei, X.; Gao, B.; Wang, P.; Zhou, H.; Lu, J. Pollution characteristics and health risk assessment of heavy metals in street dusts from different functional areas in Beijing, China. Ecotoxicol. Environ. Saf. 2015, 112, 186–192. [Google Scholar] [CrossRef] [PubMed]
  17. Lu, X.; Zhang, X.; Li, L.Y.; Chen, H. Assessment of metals pollution and health risk in dust from nursery schools in Xi’an, China. Environ. Res. 2014, 128, 27–34. [Google Scholar] [CrossRef]
  18. Wijayawardena, M.A.A.; Megharaj, M.; Naidu, R. Exposure, Toxicity, Health Impacts, and Bioavailability of Heavy Metal Mixtures. In Advances in Agronomy; Sparks, D.L., Ed.; Elsevier Academic Press Inc.: San Diego, CA, USA, 2016; Volume 138, pp. 175–234. [Google Scholar]
  19. Qing, X.; Yutong, Z.; Shenggao, L. Assessment of heavy metal pollution and human health risk in urban soils of steel industrial city (Anshan), Liaoning, Northeast China. Ecotoxicol. Environ. Saf. 2015, 120, 377–385. [Google Scholar] [CrossRef] [PubMed]
  20. Islam, M.S.; Ahmed, M.K.; Habibullah−Al−Mamun, M.; Raknuzzaman, M. Trace elements in different land use soils of Bangladesh and potential ecological risk. Environ. Monit. Assess. 2015, 187, 587. [Google Scholar] [CrossRef] [PubMed]
  21. Lim, H.S.; Lee, J.S.; Chon, H.T.; Sager, M. Heavy metal contamination and health risk assessment in the vicinity of the abandoned Songcheon Au−Ag mine in Korea. J. Geochem. Explor. 2008, 96, 223–230. [Google Scholar] [CrossRef]
  22. Chen, J. Rapid urbanization in China: A real challenge to soil protection and food security. Catena 2007, 69, 1–15. [Google Scholar] [CrossRef]
  23. Du, Y.; Gao, B.; Zhou, H.; Ju, X.; Hao, H.; Yin, S. Health Risk Assessment of Heavy Metals in Road Dusts in Urban Parks of Beijing, China. Procedia Environ. Sci. 2013, 18, 299–309. [Google Scholar] [CrossRef] [Green Version]
  24. Li, X.; Liu, L.; Wang, Y.; Luo, G.; Chen, X.; Yang, X.; Hall, M.H.P.; Guo, R.; Wang, H.; Cui, J.; et al. Heavy metal contamination of urban soil in an old industrial city (Shenyang) in Northeast China. Geoderma 2013, 192, 50–58. [Google Scholar] [CrossRef]
  25. Xuejing, X.; Xueqiu, W.; Hangxin, C.; Zhizhong, C.; Wensheng, Y. Digital Element Earth. Acta Geol. Sin. 2011, 85, 1–16. [Google Scholar] [CrossRef]
  26. Teng, Y.; Wu, J.; Lu, S.; Wang, Y.; Jiao, X.; Song, L. Soil and soil environmental quality monitoring in China: A review. Environ. Int. 2014, 69, 177–199. [Google Scholar] [CrossRef] [PubMed]
  27. Ma, L.; Yang, Z.; Li, L.; Wang, L. Source identification and risk assessment of heavy metal contaminations in urban soils of Changsha, a mine−impacted city in Southern China. Environ. Sci. Pollut. Res. Int. 2016, 23, 17058–17066. [Google Scholar] [CrossRef]
  28. Zhao, L.; Xu, Y.; Hou, H.; Shangguan, Y.; Li, F. Source identification and health risk assessment of metals in urban soils around the Tanggu chemical industrial district, Tianjin, China. Sci. Total Environ. 2014, 468–469, 654–662. [Google Scholar] [CrossRef]
  29. Li, X.; Lee, S.L.; Wong, S.C.; Shi, W.; Thornton, I. The study of metal contamination in urban soils of Hong Kong using a GIS−based approach. Environ. Pollut. 2004, 129, 113–124. [Google Scholar] [CrossRef] [Green Version]
  30. Li, S.; Jia, Z. Heavy metals in soils from a representative rapidly developing megacity (SW China): Levels, source identification and apportionment. Catena 2018, 163, 414–423. [Google Scholar] [CrossRef]
  31. Pan, L.; Wang, Y.; Ma, J.; Hu, Y.; Su, B.; Fang, G.; Wang, L.; Xiang, B. A review of heavy metal pollution levels and health risk assessment of urban soils in Chinese cities. Environ. Sci. Pollut. Res. Int. 2018, 25, 1055–1069. [Google Scholar] [CrossRef]
  32. Wei, B.; Yang, L. A review of heavy metal contaminations in urban soils, urban road dusts and agricultural soils from China. Microchem. J. 2010, 94, 99–107. [Google Scholar] [CrossRef]
  33. Zhang, X.; Zha, T.; Guo, X.; Meng, G.; Zhou, J. Spatial distribution of metal pollution of soils of Chinese provincial capital cities. Sci. Total Environ. 2018, 643, 1502–1513. [Google Scholar] [CrossRef] [PubMed]
  34. Muller, G. Index of geo−accumulation in sediments of the Raine River. GeoJournal 1969, 2, 108–118. [Google Scholar]
  35. CMEC. Background Values of Elements in Soils of China; Environmental Science Press of China: Beijing, China, 1990. [Google Scholar]
  36. Chen, T.B.; Zheng, Y.M.; Lei, M.; Huang, Z.C.; Wu, H.T.; Chen, H.; Fan, K.K.; Yu, K.; Wu, X.; Tian, Q.Z. Assessment of heavy metal pollution in surface soils of urban parks in Beijing, China. Chemosphere 2005, 60, 542–551. [Google Scholar] [CrossRef] [PubMed]
  37. Sun, Y.; Zhou, Q.; Xie, X.; Liu, R. Spatial, sources and risk assessment of heavy metal contamination of urban soils in typical regions of Shenyang, China. J. Hazard. Mater. 2010, 174, 455–462. [Google Scholar] [CrossRef] [PubMed]
  38. Vu, C.T.; Lin, C.; Shern, C.-C.; Yeh, G.; Le, V.G.; Tran, H.T. Contamination, ecological risk and source apportionment of heavy metals in sediments and water of a contaminated river in Taiwan. Ecol. Indic. 2017, 82, 32–42. [Google Scholar] [CrossRef]
  39. Hakanson, L. An ecological risk index for aquatic pollution control: A sedimentological approach. Water Resour. 1980, 14, 975–1001. [Google Scholar]
  40. Ke, X.; Gui, S.; Huang, H.; Zhang, H.; Wang, C.; Guo, W. Ecological risk assessment and source identification for heavy metals in surface sediment from the Liaohe River protected area, China. Chemosphere 2017, 175, 473–481. [Google Scholar] [CrossRef]
  41. USEPA. Superfund Public Health Evaluation Manual; USEPA: Washington, DC, USA, 1986; p. 86.
  42. USEPA. Risk Assessment Guidance for Superfund. Human Health Evaluation Manual (Part. A); USEPA: Washington, DC, USA, 1989; p. 89.
  43. USEPA. Soil Screening Guidance: Technical Background Document; USEPA: Washington, DC, USA, 1996.
  44. USEPA. Baseline Human Health Risk Assessment; USEPA: Washington, DC, USA, 2001.
  45. Beijing Municipal Bureau of Quality and Technical Supervision. Beijing, Environmental Site Assessment Guideline; Beijing Municipal Bureau of Quality and Technical Supervision: Beijing, China, 2009; Volume DB11/T 656—2009, p. 55. [Google Scholar]
  46. Li, Z.; Ma, Z.; van der Kuijp, T.J.; Yuan, Z.; Huang, L. A review of soil heavy metal pollution from mines in China: Pollution and health risk assessment. Sci. Total Environ. 2014, 468–469, 843–853. [Google Scholar] [CrossRef]
  47. Chen, H.; Teng, Y.; Lu, S.; Wang, Y.; Wang, J. Contamination features and health risk of soil heavy metals in China. Sci. Total Environ. 2015, 512–513, 143–153. [Google Scholar] [CrossRef]
  48. Liu, M.; Han, Z.; Yang, Y. Accumulation, temporal variation, source apportionment and risk assessment of heavy metals in agricultural soils from the middle reaches of Fenhe River basin, North China. RSC Adv. 2019, 9, 21893–21902. [Google Scholar] [CrossRef] [Green Version]
  49. Keshavarzi, B.; Tazarvi, Z.; Rajabzadeh, M.A.; Najmeddin, A. Chemical speciation, human health risk assessment and pollution level of selected heavy metals in urban street dust of Shiraz, Iran. Atmos. Environ. 2015, 119, 1–10. [Google Scholar] [CrossRef]
  50. Yuan, G.-L.; Sun, T.-H.; Han, P.; Li, J.; Lang, X.-X. Source identification and ecological risk assessment of heavy metals in topsoil using environmental geochemical mapping: Typical urban renewal area in Beijing, China. J. Geochem. Explor. 2014, 136, 40–47. [Google Scholar] [CrossRef]
  51. Li, Y.; Ma, J.; Liu, D.; Sun, Y.; Chen, Y. Assessment of Heavy Metal Pollution and Potential Ecological Risks of Urban Soils in Kaifeng City, China. Environ. Sci. 2015, 36, 1037–1044. (In Chinese) [Google Scholar]
  52. Wang, J.; Zhang, H.; Zeng, X.; Bai, L. Distribution and Pollution Assessment on Heavy Metals in Urban Soils of Guiyang. Soils 2010, 42, 928–934. (In Chinese) [Google Scholar]
  53. Cui, X.; Luan, W.; Guo, H.; Li, S.; Song, Z.; Gu, H. Assessment of the Heavy Metal Pollution and the Potential Ecological Hazard in Urban Soil of Shijiazhuang City. Geoscience 2011, 25, 169–175. (In Chinese) [Google Scholar]
  54. Wang, J.; Li, Z.; Yang, Z.; Cheng, Y. Specificity of Heavy Metal Soils in Core Zone of Chongqing. J. Chongqing Norm. Univ. Nat. Sci. 2012, 29, 31–35. (In Chinese) [Google Scholar]
  55. Lu, S.G.; Bai, S.Q.; Xue, Q.F. Magnetic properties as indicators of heavy metals pollution in urban topsoils: A case study from the city of Luoyang, China. Geophys. J. Int. 2007, 171, 568–580. [Google Scholar] [CrossRef] [Green Version]
  56. Wang, H. Present Situation and Evaluation of Heavy—metal Pollution in the surface Layer Soil of Jilin City. Master’s Thesis, Jilin University, Jilin, China, 2009. (In Chinese). [Google Scholar]
  57. Cui, X.; Luan, W.; Niu, Y.; Li, S.; Song, Z. An assessment of the heavy metal pollution and potential ecological hazards in urban soil of Tangshan City. Geol. China 2011, 38, 1379–1386. (In Chinese) [Google Scholar]
  58. Lu, Y.; Jia, C.; Zhang, G.; Zhao, Y.; Wilson, M.A. Spatial distribution and source of potential toxic elements (PTEs) in urban soils of Guangzhou, China. Environ. Earth Sci. 2016, 75, 329. [Google Scholar] [CrossRef]
  59. Yang, Z.; Lu, W.; Long, Y.; Bao, X.; Yang, Q. Assessment of heavy metals contamination in urban topsoil from Changchun City, China. J. Geochem. Explor. 2011, 108, 27–38. [Google Scholar] [CrossRef]
  60. Guo, W.; Sun, W.; Zhao, R.; Zhao, W.; Fu, R.; Zhang, J. Characteristic and Evaluation of Soil Pollution by Heavy Metal in Different Functional Zones of Hohhot. Environ. Sci. 2013, 34, 1561–1567. (In Chinese) [Google Scholar] [CrossRef]
  61. Zhang, S.; Wang, L.; Zhang, W.; Wang, L.; Shi, X.; Lu, X.; Li, X. Pollution Assessment and Source Apportionment of Trace Metals in Urban Topsoil of Xi’an City in Northwest China. Arch. Environ. Contam. Toxicol. 2019, 77, 575–586. [Google Scholar] [CrossRef] [PubMed]
  62. Liang, L.; Yu, S.; Zhang, C.; Qian, L.; Qi, P. Spatial distribution and ecological risk assessment of heavy metals in Yongkang City. J. Zhejiang A F Univ. 2017, 34, 972–982. (In Chinese) [Google Scholar] [CrossRef]
  63. Shi, G.; Chen, Z.; Xu, S.; Zhang, J.; Wang, L.; Bi, C.; Teng, J. Potentially toxic metal contamination of urban soils and roadside dust in Shanghai, China. Environ. Pollut. 2008, 156, 251–260. [Google Scholar] [CrossRef] [PubMed]
  64. Gu, D.; Li, L.; Xing, W.; Zhao, C. Distribution of Heavy Metals in Urban Soils of Zhengzhou City and Soil Quality Assessment. Chin. J. Soil Sci. 2009, 40, 921–925. (In Chinese) [Google Scholar] [CrossRef]
  65. Zhang, C.; Yang, Y.; Li, W.; Zhang, C.; Zhang, R.; Mei, Y.; Liao, X.; Liu, Y. Spatial distribution and ecological risk assessment of trace metals in urban soils in Wuhan, central China. Environ. Monit. Assess. 2015, 187, 556. [Google Scholar] [CrossRef]
  66. Shi, Z.; Ni, S.; Zhang, C.; Zeng, Y.; Wu, T. Evaluation of the current quality about heavy metals in urban soils of Chengdu, China. J. Chengdu Univ. Technol. 2005, 32, 391–395. (In Chinese) [Google Scholar]
  67. Zhang, L.; Zhang, H.; Huang, X.; Li, Y.; Sun, P.; Yao, W. Assessment of Soil Heavy Metal Pollution in Different Function Areas in Baotou. Res. Soil Water Conserv. 2016, 23, 353–356. (In Chinese) [Google Scholar] [CrossRef]
  68. Zhang, J.; Ma, C.; Kuang, H.; Zhou, A. Assessment of heavy metals pollution in soil of Qingdao based on matter−element extension model. China Environ. Sci. 2017, 37, 661–668. (In Chinese) [Google Scholar]
  69. Li, Y.; Wang, J.; Ju, T.; Wang, L.; Lin, N.; Zhang, S.; Zha, X. Heavy metal pollution characteristics and human health risk assessment in soils from different functional areas of Baiyin, Gansu, China. Chin. J. Ecol. 2017, 36, 1408–1418. (In Chinese) [Google Scholar]
  70. Liu, Y.; Yue, L.; Li, J. Evaluation of heavy metal contamination and its potential ecological risk to the soil in Taiyuan, China. Acta Sci. Circumstantiae 2011, 31, 1285–1293. (In Chinese) [Google Scholar] [CrossRef]
  71. Xi, C.Z.; Dai, T.G.; Huang, D.Y. Investigation and Assessment on Pollution Caused by Soils Heavy Metals in Changsha City, Hunan Province. Earth Environ. 2008, 36, 136–141. (In Chinese) [Google Scholar]
  72. Li, X.; Wu, T.; Bao, H.; Liu, X.; Xu, C.; Zhao, Y.; Liu, D.; Yu, H. Potential toxic trace element (PTE) contamination in Baoji urban soil (NW China): Spatial distribution, mobility behavior, and health risk. Environ. Sci. Pollut. Res. Int. 2017, 24, 19749–19766. [Google Scholar] [CrossRef] [PubMed]
  73. Xia, D.; Wang, B.; Xu, S.; Zhang, Y. Magnetic records of heavy metals pollution in urban topsoils of Urumuqi City. J. Lanzhou Univ. Nat. Sci. 2013, 49, 173–181. (In Chinese) [Google Scholar] [CrossRef]
  74. Mao, Y.; Shen, H.; Dai, Q.; Yuan, J. Survey of Heavy Metal Pollution and Source Identificayion of the Urban Soil in Xuzhou City. Shandong Chem. Ind. 2019, 48, 240–242. (In Chinese) [Google Scholar] [CrossRef]
  75. Lu, Y.; Gong, Z.T.; Zhang, G.L.; Burghardt, W. Concentrations and chemical speciations of Cu, Zn, Pb and Cr of urban soils in Nanjing, China. Geoderma 2003, 115, 101–111. [Google Scholar] [CrossRef]
  76. Li, J.; Pu, L.; Liao, Q.; Zhu, M. The Sources and Gradient Effect of Soil Heavy Metal Concentrations in Wuxi City. Sci. Geogr. Sin. 2014, 34, 496–504. (In Chinese) [Google Scholar]
  77. Xi, C.; Dai, T.; Huang, D. Distribution and pollution assessments of heavy metals in soils in Zhuzhou, Hunan. Geol. China 2008, 35, 524–530. (In Chinese) [Google Scholar]
  78. Li, J.; Zhang, S.; Zhou, X.; Xin, R.; Wang, W. Study on Pollution and Potential Ecological Risk Assessment of Heavy Metals in Soil in Daqing City. Chin. Agric. Sci. Bull. 2008, 24, 428–432. (In Chinese) [Google Scholar]
  79. Wang, G.; Liu, H.Q.; Gong, Y.; Wei, Y.; Miao, A.J.; Yang, L.Y.; Zhong, H. Risk Assessment of Metals in Urban Soils from a Typical Industrial City, Suzhou, Eastern China. Int. J. Environ. Res. Public Health 2017, 14, 1025. [Google Scholar] [CrossRef] [Green Version]
  80. Li, Z.; Zhu, J.; Wang, L. Heavy Metal Contents and Their Spatial Distribution in Urban Soil of Hefei City. Urban. Environ. Urban. Ecol. 2009, 22, 24–27. (In Chinese) [Google Scholar]
  81. XI, C.; Dai, T.; Zhang, H.; Liu, W. Investigation and Assessment on Pollution of Soil Heavy Metals in Xiangtan City. Bull. Soil Water Conserv. 2008, 28, 133–137. (In Chinese) [Google Scholar] [CrossRef]
  82. Qiao, S.; Li, W.; Han, Y.; Tang, J. Characteristics and controlling factors of heavy metals in urbna soils in Zhangzhou city, Fujian province. Geochimica 2005, 34, 635–642. (In Chinese) [Google Scholar] [CrossRef]
  83. Miao, R.; Yan, Y.; Bai, Y.; Deng, A. Assessment of Heavy Metals Contamination of Soil in Kunming City. Earth Environ. 2015, 43, 536–539. [Google Scholar]
  84. Wang, B.; Xia, D.; Yu, Y.; Jia, J.; Xu, S. Magnetic records of heavy metal pollution in urban topsoil in Lanzhou, China. Chin. Sci. Bull. 2012, 58, 384–395. (In Chinese) [Google Scholar] [CrossRef] [Green Version]
  85. Zhang, M.; Li, X.P.; Yang, R.; Wang, J.W.; Ai, Y.W.; Gao, Y.; Zhang, Y.C.; Zhang, X.; Yan, X.Y.; Liu, B.; et al. Multipotential Toxic Metals Accumulated in Urban Soil and Street Dust from Xining City, NW China: Spatial Occurrences, Sources, and Health Risks. Arch. Environ. Contam. Toxicol. 2019, 76, 308–330. [Google Scholar] [CrossRef]
  86. Wang, G. Study on the Influence of Road Traffic in and around Lhasa on Roadside Soil Environment. Master’s Thesis, Beijing Jiaotong University, Beijing, China, 2015. (In Chinese). [Google Scholar]
  87. He, Y. Pollution characteristics and ecological risk assessment of heavy metals in Haikou urban. Chin. J. Ecol. 2014, 33, 421–428. (In Chinese) [Google Scholar] [CrossRef]
  88. Liu, R.; Huang, Y.; Wang, L.; Li, X.; Ren, H. Characteristics and evaluation of heavy metal pollution in soil and near−surface atmospheric dust of typical mining city in southwest China—A case study for Panzhihua city. J. Meneral. Petrol. 2019, 39, 111–119. (In Chinese) [Google Scholar]
  89. Qiao, X.; Lu, H.; Wang, J.; Bai, L.; Liu, S.; Jing, Y. Pollution evaluation of urban soil heavy metal and distribution in different functional zones of Qiqihar city. J. North. Agric. 2018, 46. (In Chinese) [Google Scholar] [CrossRef]
  90. Huang, H.; Nan, Z.; Hu, X.; Liu, X. Spatial Distributions of Heavy Metals and Assessment of Potential Ecological Risk in Jin chang Urban Area. Environ. Monit. Manag. Technol. 2009, 21, 30–34. (In Chinese) [Google Scholar]
  91. Zhang, H.; Zheng, Z.; Ma, X.; Yang, H.; Zhang, G.; Lu, Z.; Le, R. Sources and Pollution Characteristics of Heavy Metals in Surface Soils of Harbin City. Res. Environ. Sci. 2017, 30, 1597–1606. [Google Scholar]
  92. Zhang, M.; Lu, X.; Shi, D.; Pan, H. Toxic metal enrichment characteristics and sources of arid urban surface soil in Yinchuan City, China. J. Arid Land 2018, 10, 653–662. [Google Scholar] [CrossRef] [Green Version]
  93. Wang, H.; Fang, F.; Xie, H.; Wang, X.; Huang, C. Pollution Evaluation and Source Analysis of Heavy Metal in Urban Soil of Wuhu City. Urban. Environ. Urban. Ecol. 2010, 23, 36–40. (In Chinese) [Google Scholar]
  94. Li, Y.; Xiao, C.; Wang, S.; Liu, K. Spatial variation and evaluation of heavy metals pollution in Jiaozuo city. Bull. Soil Water Conserv. 2014, 34, 271–276. (In Chinese) [Google Scholar] [CrossRef]
  95. Hu, Y.; Wang, D.; Wei, L.; Song, B. Heavy metal contamination of urban topsoils in a typical region of Loess Plateau, China. J. Soil Sediments 2014, 14, 928–935. [Google Scholar] [CrossRef]
  96. Chen, H. The distributional characteristics of Cu and else 13 kinds of elements in city soil of Fuzhou. Geol. Fujian 2008, 27, 211–218. (In Chinese) [Google Scholar]
  97. Shi, H.; Yang, P.; Zhou, J.; Cao, Y.; Du, X. Distribution characteristics and assessment of soil heavy metal pollutions in different functional areas of Linfen. J. Arid Land Resour. Environ. 2018, 32, 135–140. (In Chinese) [Google Scholar]
  98. Huang, K.; Liu, F.; Zhang, J.; Chen, H.; Li, Y. Speciation and ecological risk assessment of heavy metal in soils from different functional zones of Baise city. Guangdong Agric. Sci. 2013. (In Chinese) [Google Scholar] [CrossRef]
  99. Wu, S.; Peng, S.; Zhang, X.; Wu, D.; Luo, W.; Zhang, T.; Zhou, S.; Yang, G.; Wan, H.; Wu, L. Levels and health risk assessments of heavy metals in urban soils in Dongguan, China. J. Geochem. Explor. 2015, 148, 71–78. [Google Scholar] [CrossRef]
  100. Wu, S.; Zhou, S.; Li, X.; Johnson, W.C.; Zhang, H.; Shi, J. Heavy−metal accumulation trends in Yixing, China: An area of rapid economic development. Environ. Earth Sci. 2009, 61, 79–86. [Google Scholar] [CrossRef]
  101. Nurrmangul, T.; Guligena, A.; Ma, C. Distribution characteristics of soil heavy metal content in Kashi City and its source explanation. J. Arid Land Resour. Environ. 2016, 36, 179–183. (In Chinese) [Google Scholar]
  102. Ayjamal, K.; HALIK, Ü. Assessment of heavy metal concentration characteristics and pollution risk in Aksu City. J. For. Environ. 2018, 38, 91–97. (In Chinese) [Google Scholar]
  103. Guo, G.; Song, B. Preliminary Health Risk Assessment of the Exposure of Children to Heavy Metals—A Case Study of Yibin of Sichuan Province. Resour. Environ. Yangtze Basin 2010, 19, 946–952. (In Chinese) [Google Scholar]
  104. Pan, D.; Zhang, Y.; Li, C.; Sun, H. Contents and Evaluation of Heavy Metals in Soil of Nanchong City. J. China West. Norm. Univ. Nat. Sci. 2006, 27, 221–224. (In Chinese) [Google Scholar] [CrossRef]
  105. Gao, L. Pollution of Heavy Metals in the Soil of Different Function Areas in Shangluo. J. Shangluo Univ. 2015, 29, 63–66. (In Chinese) [Google Scholar] [CrossRef]
  106. Li, X.; Nan, X.; Hou, K.; Chen, C. Mobility of Heavy Metals and the Leaching Characteristics with Ascorbic Acid from Urban Soil in Tongchuan City. Arid Zone Res. 2012, 29, 876–882. (In Chinese) [Google Scholar] [CrossRef]
  107. Wang, Y.; Wang, Z.; Wu, R.; Zhou, H. Characteristic and Evaluation of Soil Pollution by Heavy Metal of Luliang. Shandong Chem. Ind. 2015, 44, 172–174. [Google Scholar] [CrossRef]
  108. Qin, P.; Wang, M.; Gao, Z.; Zou, J.; Wang, X.; Feng, J.; Pang, X. Pollution Characteristics and Ecological Risk Assessment of Soil Heavy Metals in Tengzhou. Chin. J. Soil Sci. 2018, 49, 720–726. (In Chinese) [Google Scholar] [CrossRef]
  109. Yang, Q.; Chen, M.; Hu, L.; Tao, M. Morphological distribution characteristics and pollution evaluation of heavy metals in the soils of Ganzhou city. Nonferrous Met. Sci. Eng. 2017, 8, 118–124. [Google Scholar] [CrossRef]
  110. Liu, W.; Ma, W. Present Situation of Soil Heavy Metals in Langfang City. North. Environ. 2011, 23, 125–126. (In Chinese) [Google Scholar]
  111. Chai, L.; Cui, X. Pollution status and potential risk assessment of heavy metal contaminants in urban soil of Baoding, Hebei. J. Saf. Environ. 2019, 19, 607–614. (In Chinese) [Google Scholar]
  112. Li, X.; Feng, L. Geostatistical analyses and fractionation of heavy metals in urban soil from industrial district in Weinan, NW China. Environ. Earth Sci. 2012, 67, 2129–2140. [Google Scholar] [CrossRef]
  113. Liu, H. Research on Accumulational Character of Heavy Metal in Urban Soils of Changji Prefecture. Environ. Prot. Xinjiang 2007, 29, 6–9. (In Chinese) [Google Scholar]
  114. Liu, B. Present Situation and Evaluation of Heavy Metal Pollution in the Soils of Nanning City. Master’s Thesis, Guangxi University, Guangxi, China, 2004. (In Chinese). [Google Scholar]
  115. Qiao, M.; Cai, C.; Huang, Y.; Liu, Y.; Lin, A.; Zheng, Y. Characterization of soil heavy metal contamination and potential health risk in metropolitan region of northern China. Environ. Monit. Assess. 2011, 172, 353–365. [Google Scholar] [CrossRef] [PubMed]
  116. Yang, Q.; Li, Z.; Lu, X.; Duan, Q.; Huang, L.; Bi, J. A review of soil heavy metal pollution from industrial and agricultural regions in China: Pollution and risk assessment. Sci. Total Environ. 2018, 642, 690–700. [Google Scholar] [CrossRef]
  117. Zhang, X.; Yang, L.; Li, Y.; Li, H.; Wang, W.; Ye, B. Impacts of lead/zinc mining and smelting on the environment and human health in China. Environ. Monit. Assess. 2012, 184, 2261–2273. [Google Scholar] [CrossRef]
  118. Han, D.; Xia, H.; Kai, Z.; Yan, L. Investigationon blood lead and intelligence levels of children in electronic waste recycling area. J. Shantou Univ. Med. Coll. 2007, 20, 170–175. (In Chinese) [Google Scholar]
Figure 1. The distribution of city sites reviewed in this study around China.
Ijerph 17 03099 g001
Figure 2. The spatial distribution of heavy metal contents in urban soils around China. (a): The spatial distribution of As contents in urban soils around China. (b): The spatial distribution of Cd contents in urban soils around China. (c): The spatial distribution of Cr contents in urban soils around China. (d): The spatial distribution of Hg contents in urban soils around China. (e): The spatial distribution of Pb contents in urban soils around China. (f): The spatial distribution of Cu contents in urban soils around China. (g): The spatial distribution of Zn contents in urban soils around China. (h): The spatial distribution of Ni contents in urban soils around China.
Ijerph 17 03099 g002aIjerph 17 03099 g002b
Figure 3. Box-plots of the geoaccumulation index (Igeo), pollution index (PI), integrated pollution index (IPI), ecological risk ( E r i ) and potential ecological risk index (PRI) of heavy metals in urban soil around China. The top and bottom edges of the boxes represent the 75th and 25th percentiles, respectively; the upper and lower limits of the whiskers represent the maxima and minima, excluding the outliers; the black horizontal lines inside each box represent the median values; the red dots represent mild outliers; and the black stars represent extreme outliers. (a): Box-plots of Igeo of heavy metals in urban soil around China. (b): Box-plots of PI and IPI of heavy metals in urban soil around China. (c): Box-plots of E r i of heavy metals in urban soil around China. (d): Box-plots of E r i and PRI of heavy metals in urban soil around China.
Ijerph 17 03099 g003
Figure 4. The proportion of the geoaccumulation index (Igeo) and ecological risk ( E r i ) of heavy metals in urban soils around China. (a): The proportion of Igeo heavy metals in urban soils around China. (b): The proportion of E r i heavy metals in urban soils around China.
Ijerph 17 03099 g004
Figure 5. The distribution of integrated pollution index (IPI) and potential ecological risk index (PRI) of heavy metals in urban soils around China. (a): The distribution of IPI of heavy metals in urban soils around China. (b): The distribution of PRI of heavy metals in urban soils around China.
Ijerph 17 03099 g005
Figure 6. The distribution of the carcinogenic risks (CR) of As, Cr and Ni for children in urban soils around China. (a): The distribution of CR of As for children in urban soils around China. (b): The distribution of CR of Cr for children in urban soils around China. (c): The distribution of CR of Ni for children in urban soils around China.
Ijerph 17 03099 g006
Table 1. Parameters for the exposure risk calculations for heavy metals.
ParameterImplicationChildrenAdultUnit
Cconcentration of the contaminant mg kg−1
IngRaingestion rate of soil200100mg d−1
InhRbinhalation rate of soil520m3 d−1
CFaconversion factor1 × 10−61 × 10−6kg mg−1
EFbexposure frequency350350d a−1
EDaexposure duration624y
BWbaverage body weight1555.9kg
ATaaverage timefor non-carcinogens365 × ED365 × EDd
for carcinogens365 × 70365 × 70d
SAbexposure skin surface area16004350cm2
SLbskin adherence factor11mg cm−2
ABSbdermal absorption factor 0.0010.001unitless
PEFbparticle emission factor1.32 × 1091.32 × 109m3 kg−1
a USEPA 2001, b Environmental site assessment guideline in China.
Table 2. The reference doses for noncarcinogenic metals (mg kg−1 d−1) and slope factors for carcinogenic metals (kg d mg−1) [15,48].
MetalsRfDingRfDinhRfDdermSFingSFinhSFderm
As3.00 × 10−43.10 × 10−41.20 × 10−41.501.513.66
Cd1.00 × 10−31.00 × 10−31.00 × 10−5
Cr3.00 × 10−32.86 × 10−56.00 × 10−50.504.202.00
Hg3.00 × 10−48.57 × 10−52.10 × 10−5
Pb3.50 × 10−33.52 × 10−35.30 × 10−4
Cu4.00 × 10−24.02 × 10−21.20 × 10−2
Zn3.00 × 10−13.00 × 10−16.00 × 10−2
Ni2.00 × 10−22.06 × 10−25.40 × 10−41.700.904.25
Table 3. The concentrations of heavy metals in urban soils around China (mg/kg).
CitynAsCdCrHgPbCuZnNiReference
Beijing5508.550.1760.300.3233.7031.3083.8023.30[50]
Kaifeng996.311.0553.1136.7136.40164.0323.87[51]
Guiyang6220.530.3235.710.1922.1764.87217.9048.65[52]
Shijiazhuang2209.420.2871.850.1131.0027.39104.4828.20[53]
Chongqing488.020.9826.580.3132.6124.6396.7725.64[54]
Luoyang2151.7171.4265.9285.40215.75[55]
Jilin13611.320.2080.400.1934.7024.70109.20[56]
Tangshan636.790.1046.200.0725.0820.9763.3817.33[57]
Guangzhou42617.400.320.6187.6035.80107.0018.70[58]
Changchun35212.500.1366.000.1235.4029.4090.00[59]
Huhhot626.4054.7511.6330.0789.9316.47[60]
Xi’an6212.2069.8036.9032.40101.3030.70[61]
Yongkang1816.00121.0040.0024.0095.0023.00[62]
Shanghai2730.52107.9070.6959.25301.4031.14[63]
Zhengzhou9039.6359.1191.67[64]
Wuhan4673.2241.8528.1618.8288.07[65]
Chengdu3511.000.3660.000.3176.9042.00224.00[66]
Shenyang9322.691.1067.900.39116.7692.45234.80[24]
HongKong1520.6223.1094.6023.30125.0012.40[29]
Baotou880.2935.6039.8227.7679.45[67]
Qingdao837.710.1155.8327.1117.9549.66[68]
Baiyin1325.910.2952.620.2764.5957.33197.0617.30[69]
Taiyuan8010.960.2173.690.1226.2928.8786.0829.76[70]
Changsha11032.806.90121.000.4189.4051.40276.00[71]
Baoji508.7598.08409.20107.19374.47[72]
Urumqi8569.2428.7447.90263.24[73]
Xuzhou17217.100.40219.400.0535.5043.80163.8042.90[74]
Nanjing15084.70107.3066.10162.60[75]
Wuxi19579.770.170.3841.7634.7386.95[76]
Zhuzhou6020.680.6191.000.2186.0037.40141.00[77]
Daqing5.701.0098.1026.2039.9342.08[78]
Suzhou16715.510.3375.600.5240.26[79]
Hefei15110.800.200.1837.0038.60108.8027.30[80]
Xiangtan5418.720.4684.000.2465.0037.50127.00[81]
Zhangzhou1086.860.3529.700.4775.9032.60106.7012.80[82]
Kunming20413.231.32109.940.2460.28111.25150.6350.13[83]
Lanzhou11720.6393.9642.7252.41184.2238.22[84]
Xining1557.65182.5432.5719.7345.1325.21[85]
Lhasa9.660.2619.6916.2213.55102.8414.83[86]
Haikou703.820.2592.400.0729.1026.7084.1052.50[87]
Panzhihua179.670.30234.0430.0162.86158.22125.10[88]
Qiqihar557.8734.8513.3762.08[89]
Jinchang740.3032.20430.00116.00361.00[90]
Harbin3078.870.1761.280.0826.7422.3372.0325.73[91]
Yinchuan96109.1025.0016.8026.0025.30[92]
Wuhu1531.2078.3029.1035.0096.8026.30[93]
Jiaozuo440.33378.8620.2336.26[94]
Anshan1150.8669.9045.1052.30213.0033.50[19]
Tianjin7011.000.1851.000.4345.0033.00148.0039.00[28]
Huainan3612.540.1949.390.2124.2121.74[15]
Yan’an400.1066.2220.1823.6571.2037.56[95]
Fuzhou1798.280.3040.110.7789.8339.41158.6516.04[96]
Linfen21716.5941.1233.9116.60101.3236.11[97]
Baise368.680.1667.1920.7429.0486.0124.04[98]
Dongguan17013.330.2574.900.15160.2766.64150.8044.45[99]
Yixing470.1165.2331.3923.5768.6226.40[100]
Xiamen1465.8241.7737.3523.26[14]
Kashi6.3429.3381.39103.54140.715.95[101]
Aksu5025.5675.9897.26120.338.41[102]
Yibin478.7065.2061.50135.40[103]
Nanchong0.8215.3285.9950.29106.83[104]
Shangluo150.550.58127.9959.31155.08[105]
Tongchuan2693.48357.4766.48116.17[106]
Lvliang2.7470.7018.7147.9518.95[107]
Tengzhou3357.830.1460.370.0525.1027.0266.0926.95[108]
Ganzhou501.74173.17216.9932.03146.61[109]
Langfang7.580.1663.300.0427.1020.1072.20[110]
Baoding489.750.1866.300.2138.9929.10122.3628.05[111]
Weinan388.4996.9946.7120.8871.5625.43[112]
Changji3552.187.5265.99221.48[113]
Nanning4623.200.7720.9465.5645.56105.4137.04[114]
Min 3.820.1015.320.047.5213.5526.008.41
Max 32.806.90378.860.77409.20430.00374.47361.00
Median 9.670.3266.300.2137.3534.87107.0026.40
Mean±SD 11.53±5.790.79±1.3277.86±57.670.27±0.1960.26±66.0247.72±52.55128.21±66.4937.99±53.61
CV(%) 50168756911111252144
BGV of China 11.20.097610.0652622.674.226.9[35]
Table 4. The mean values of the human health risks for children and adults posed by each element, according to exposure pathway.
AsCdCrHgPbCuZnNi
HQingchildren4.98 × 10−11.03 × 10−23.36 × 10−11.16 × 10−22.23 × 10−11.55 × 10−25.54 × 10−32.46 × 10⁻²
adults6.69 × 10−21.38 × 10−34.51 × 10−21.55 × 10−32.99 × 10−22.08 × 10−37.43 × 10−43.30 × 10⁻³
HQinhchildren9.01 × 10−61.92 × 10−76.59 × 10−47.56 × 10−74.15 × 10−62.87 × 10−71.03 × 10−74.47 × 10⁻⁷
adults9.67 × 10−62.07 × 10−77.08 × 10−48.12 × 10−74.45 × 10−63.09 × 10−71.11 × 10−74.79 × 10⁻⁷
HQdermchildren9.83 × 10−38.13 × 10−31.33 × 10−11.30 × 10−31.16 × 10−24.07 × 10−42.19 × 10−47.20 × 10⁻³
adults7.17 × 10−35.93 × 10−39.68 × 10−29.51 × 10−48.48 × 10−32.97 × 10−41.59 × 10−45.25 × 10⁻³
HIchildren5.08 × 10−11.84 × 10−24.70 × 10−11.29 × 10−22.35 × 10−11.59 × 10−25.76 × 10−33.18 × 10⁻²
adults7.40 × 10−27.31 × 10−31.43 × 10−12.50 × 10−33.84 × 10−22.37 × 10−39.03 × 10−48.56 × 10⁻³
CRingchildren1.90 × 10−5 4.27 × 10⁻⁵ 7.08 × 10⁻⁵
adults1.02 × 10−5 2.29 × 10⁻⁵ 3.80 × 10⁻⁵
CRinhchildren3.61 × 10−10 6.79 × 10⁻⁹ 7.10 × 10⁻¹⁰
adults1.55 × 10−9 2.91 × 10⁻⁸ 3.05 × 10⁻⁹
CRdermchildren3.70 × 10−7 1.37 × 10⁻⁶ 1.42 × 10⁻⁶
adults1.08 × 10−6 3.98 × 10⁻⁶ 4.13 × 10⁻⁶
CRchildren1.93 × 10−5 4.40 × 10⁻⁵ 7.22 × 10⁻⁵
adults1.13 × 10−5 2.69 × 10⁻⁵ 4.21 × 10⁻⁵

