Geo-Epidemiology of Malaria at the Health Area Level, Dire Health District, Mali, 2013–2017

 ,
,  ,
,
Abstract
:1. Introduction
2. Materials and Methods
2.1. Location of the Study
2.2. Data Collection and Sources
2.2.1. Confirmed Cases and Population
2.2.2. Meteorological and Environmental Data
2.3. Statistical Data Analysis
2.3.1. Temporal Analysis
2.3.2. Correction of Recording Bias
2.3.3. Spatial Analysis
2.3.4. Meteorological and Environmental Factors Associated with Hotspots
2.4. Software and Packages
3. Results
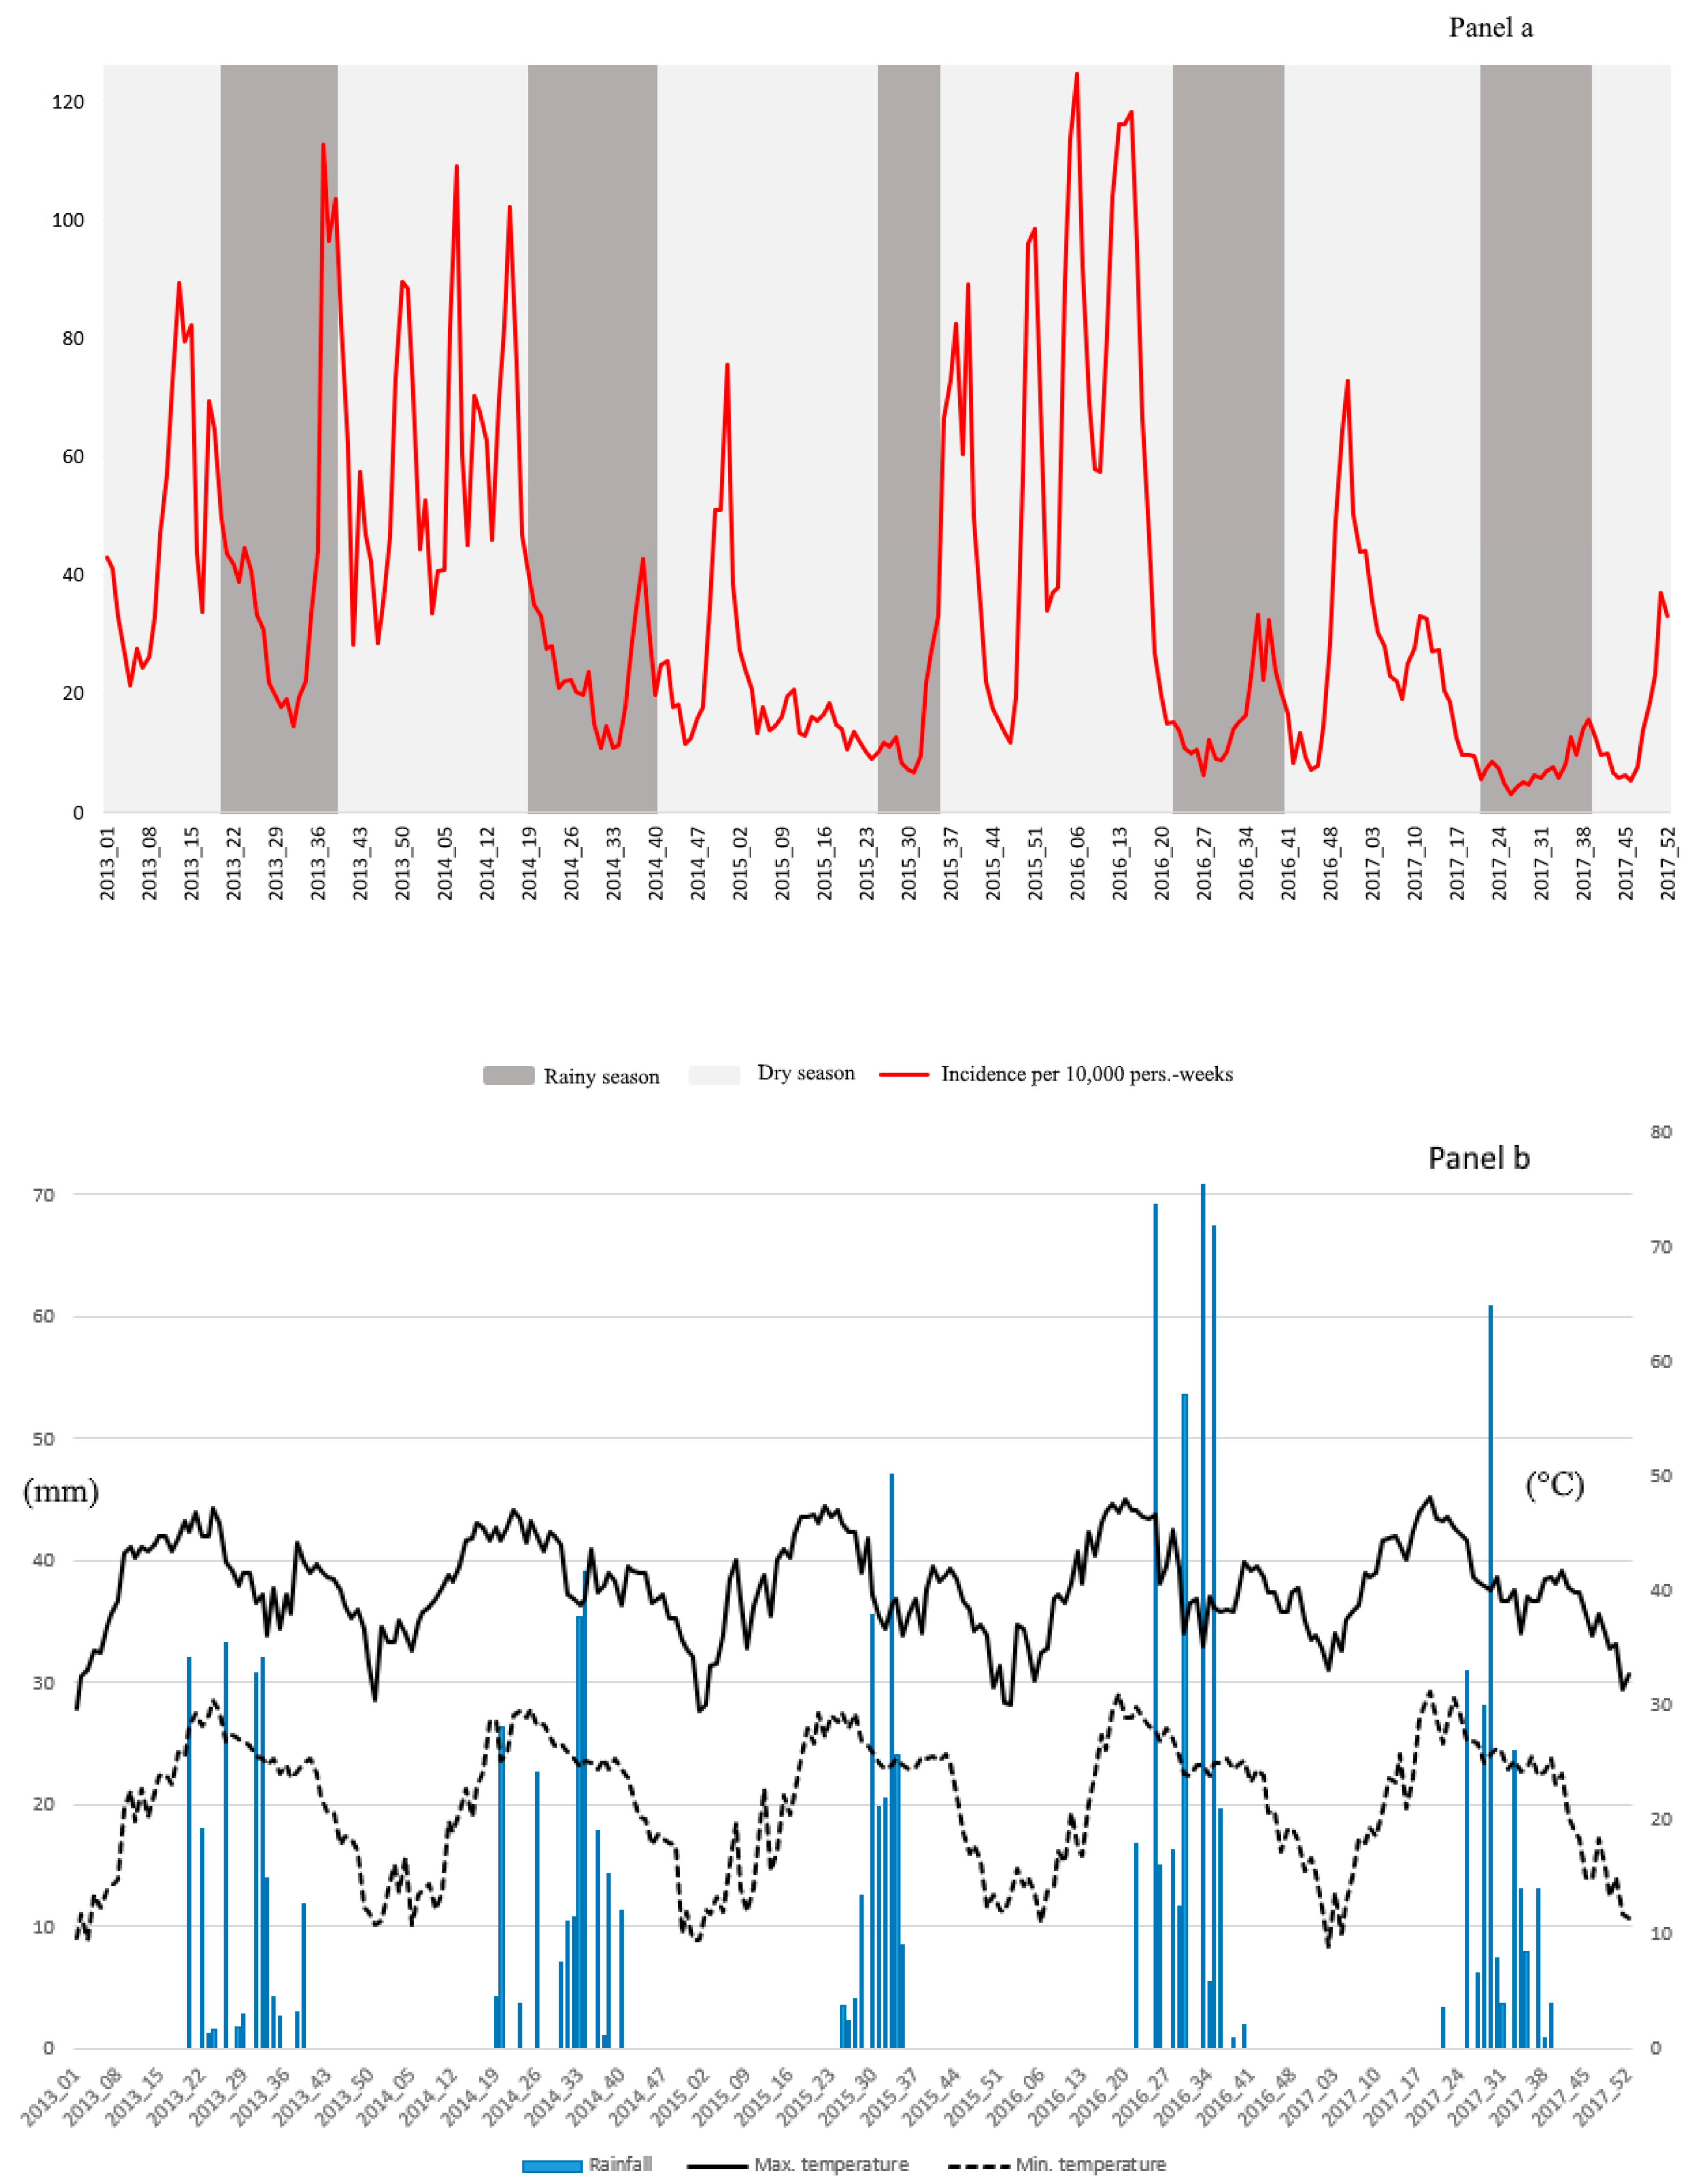
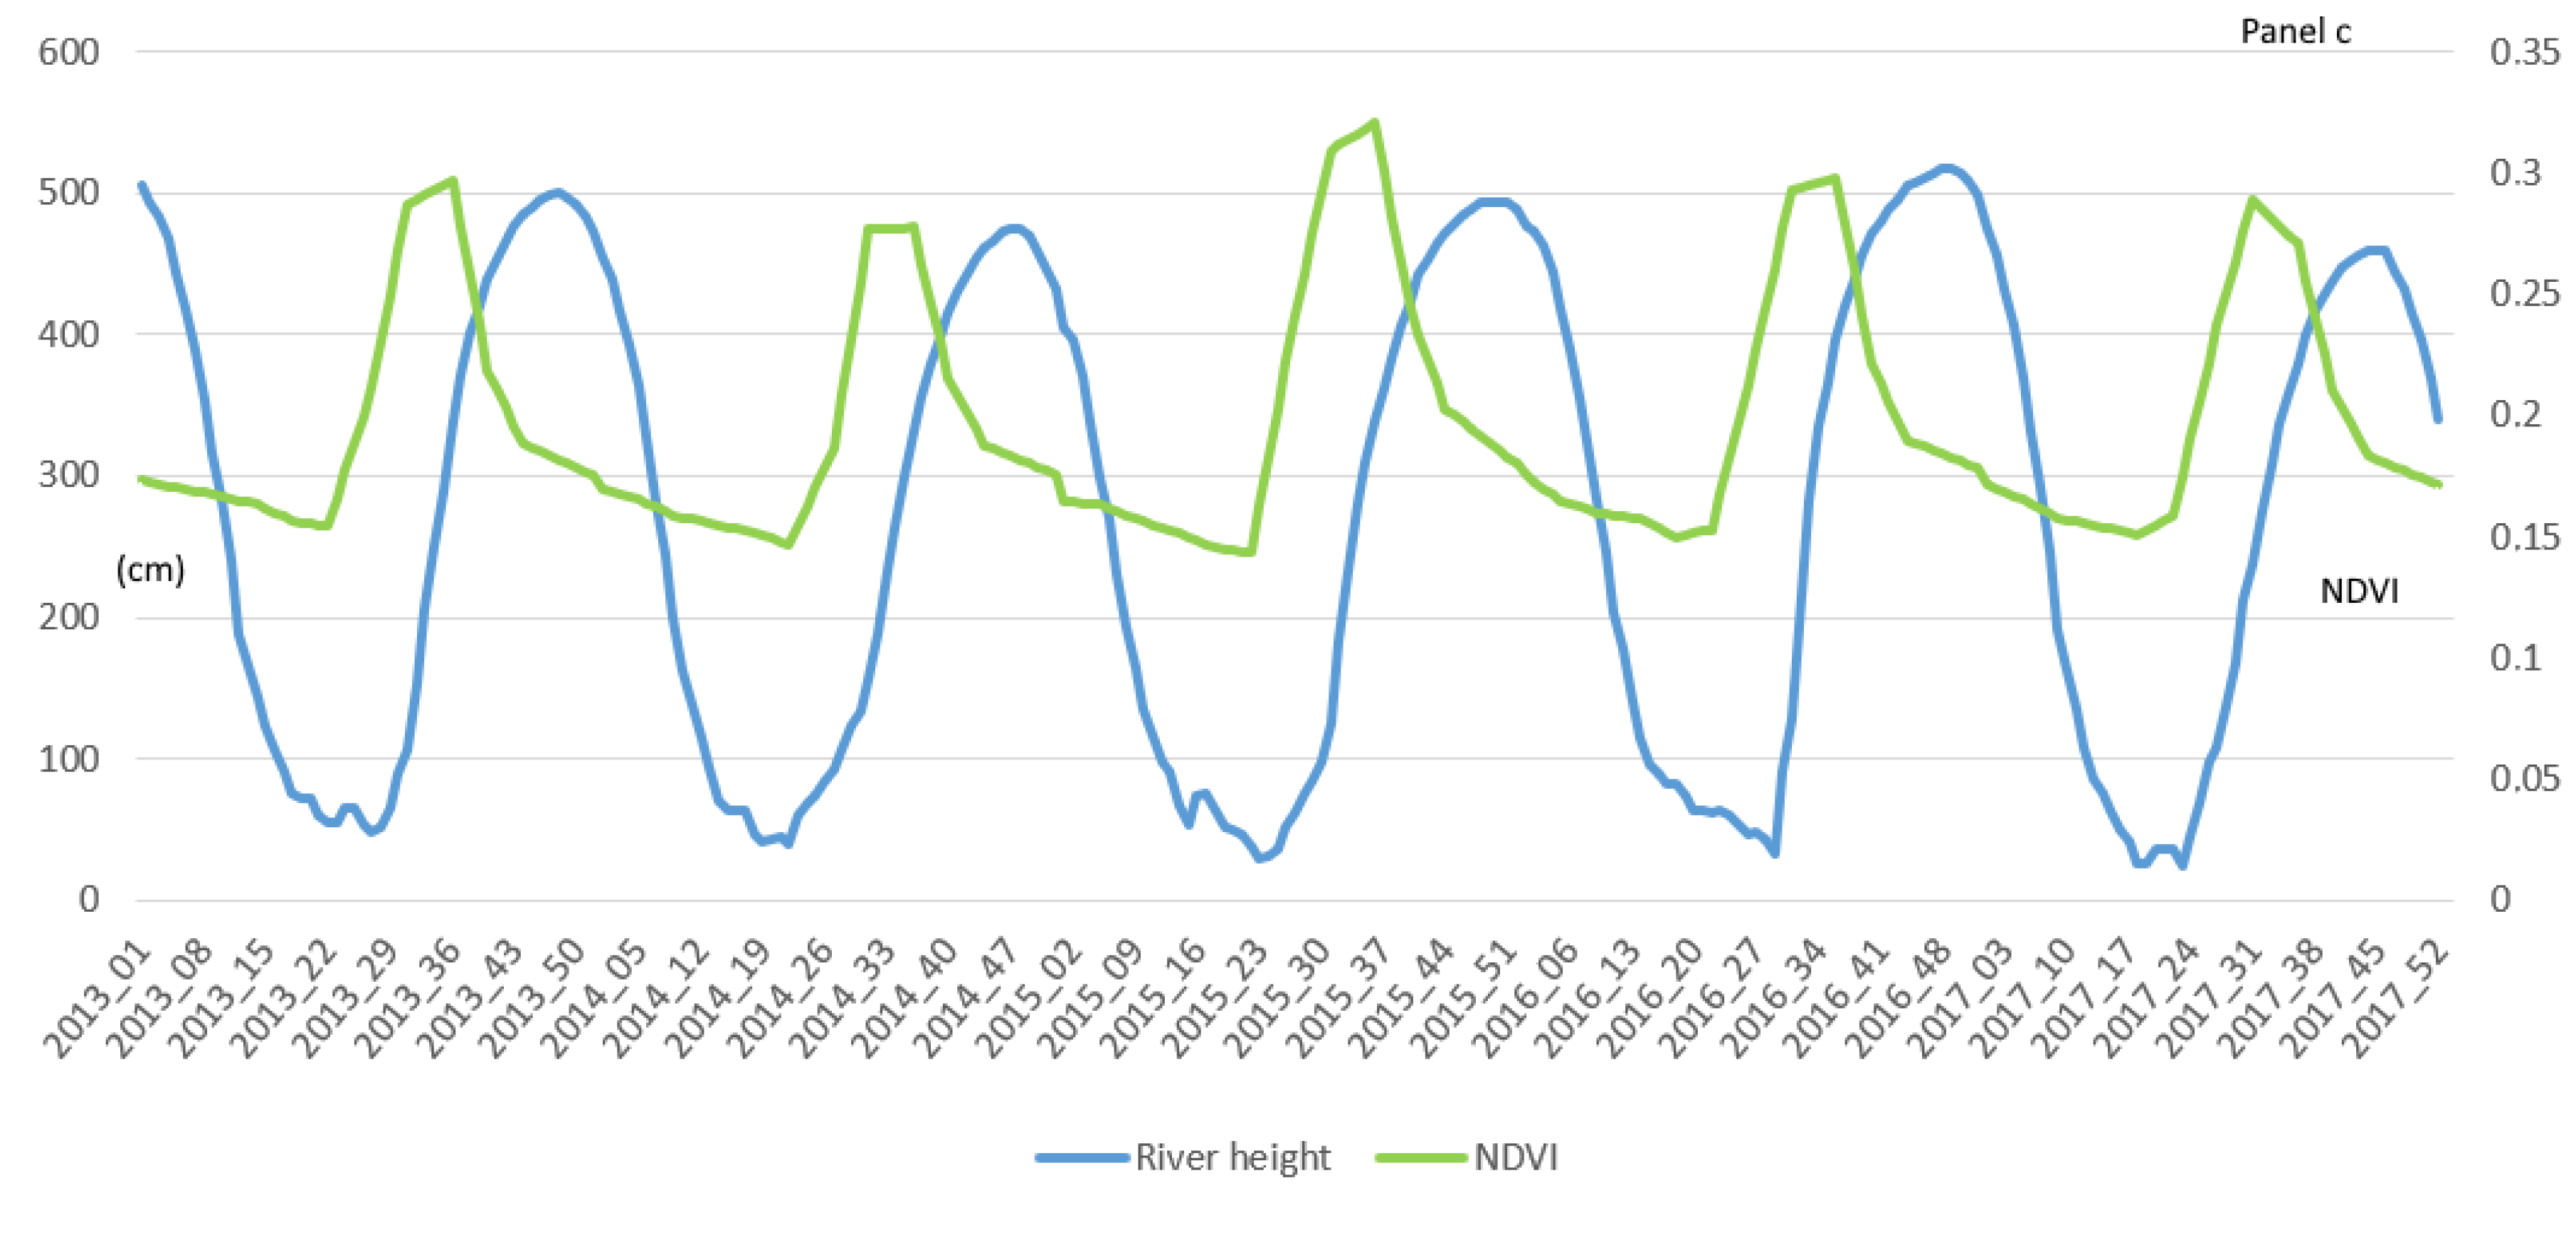
3.1. Temporal Analysis
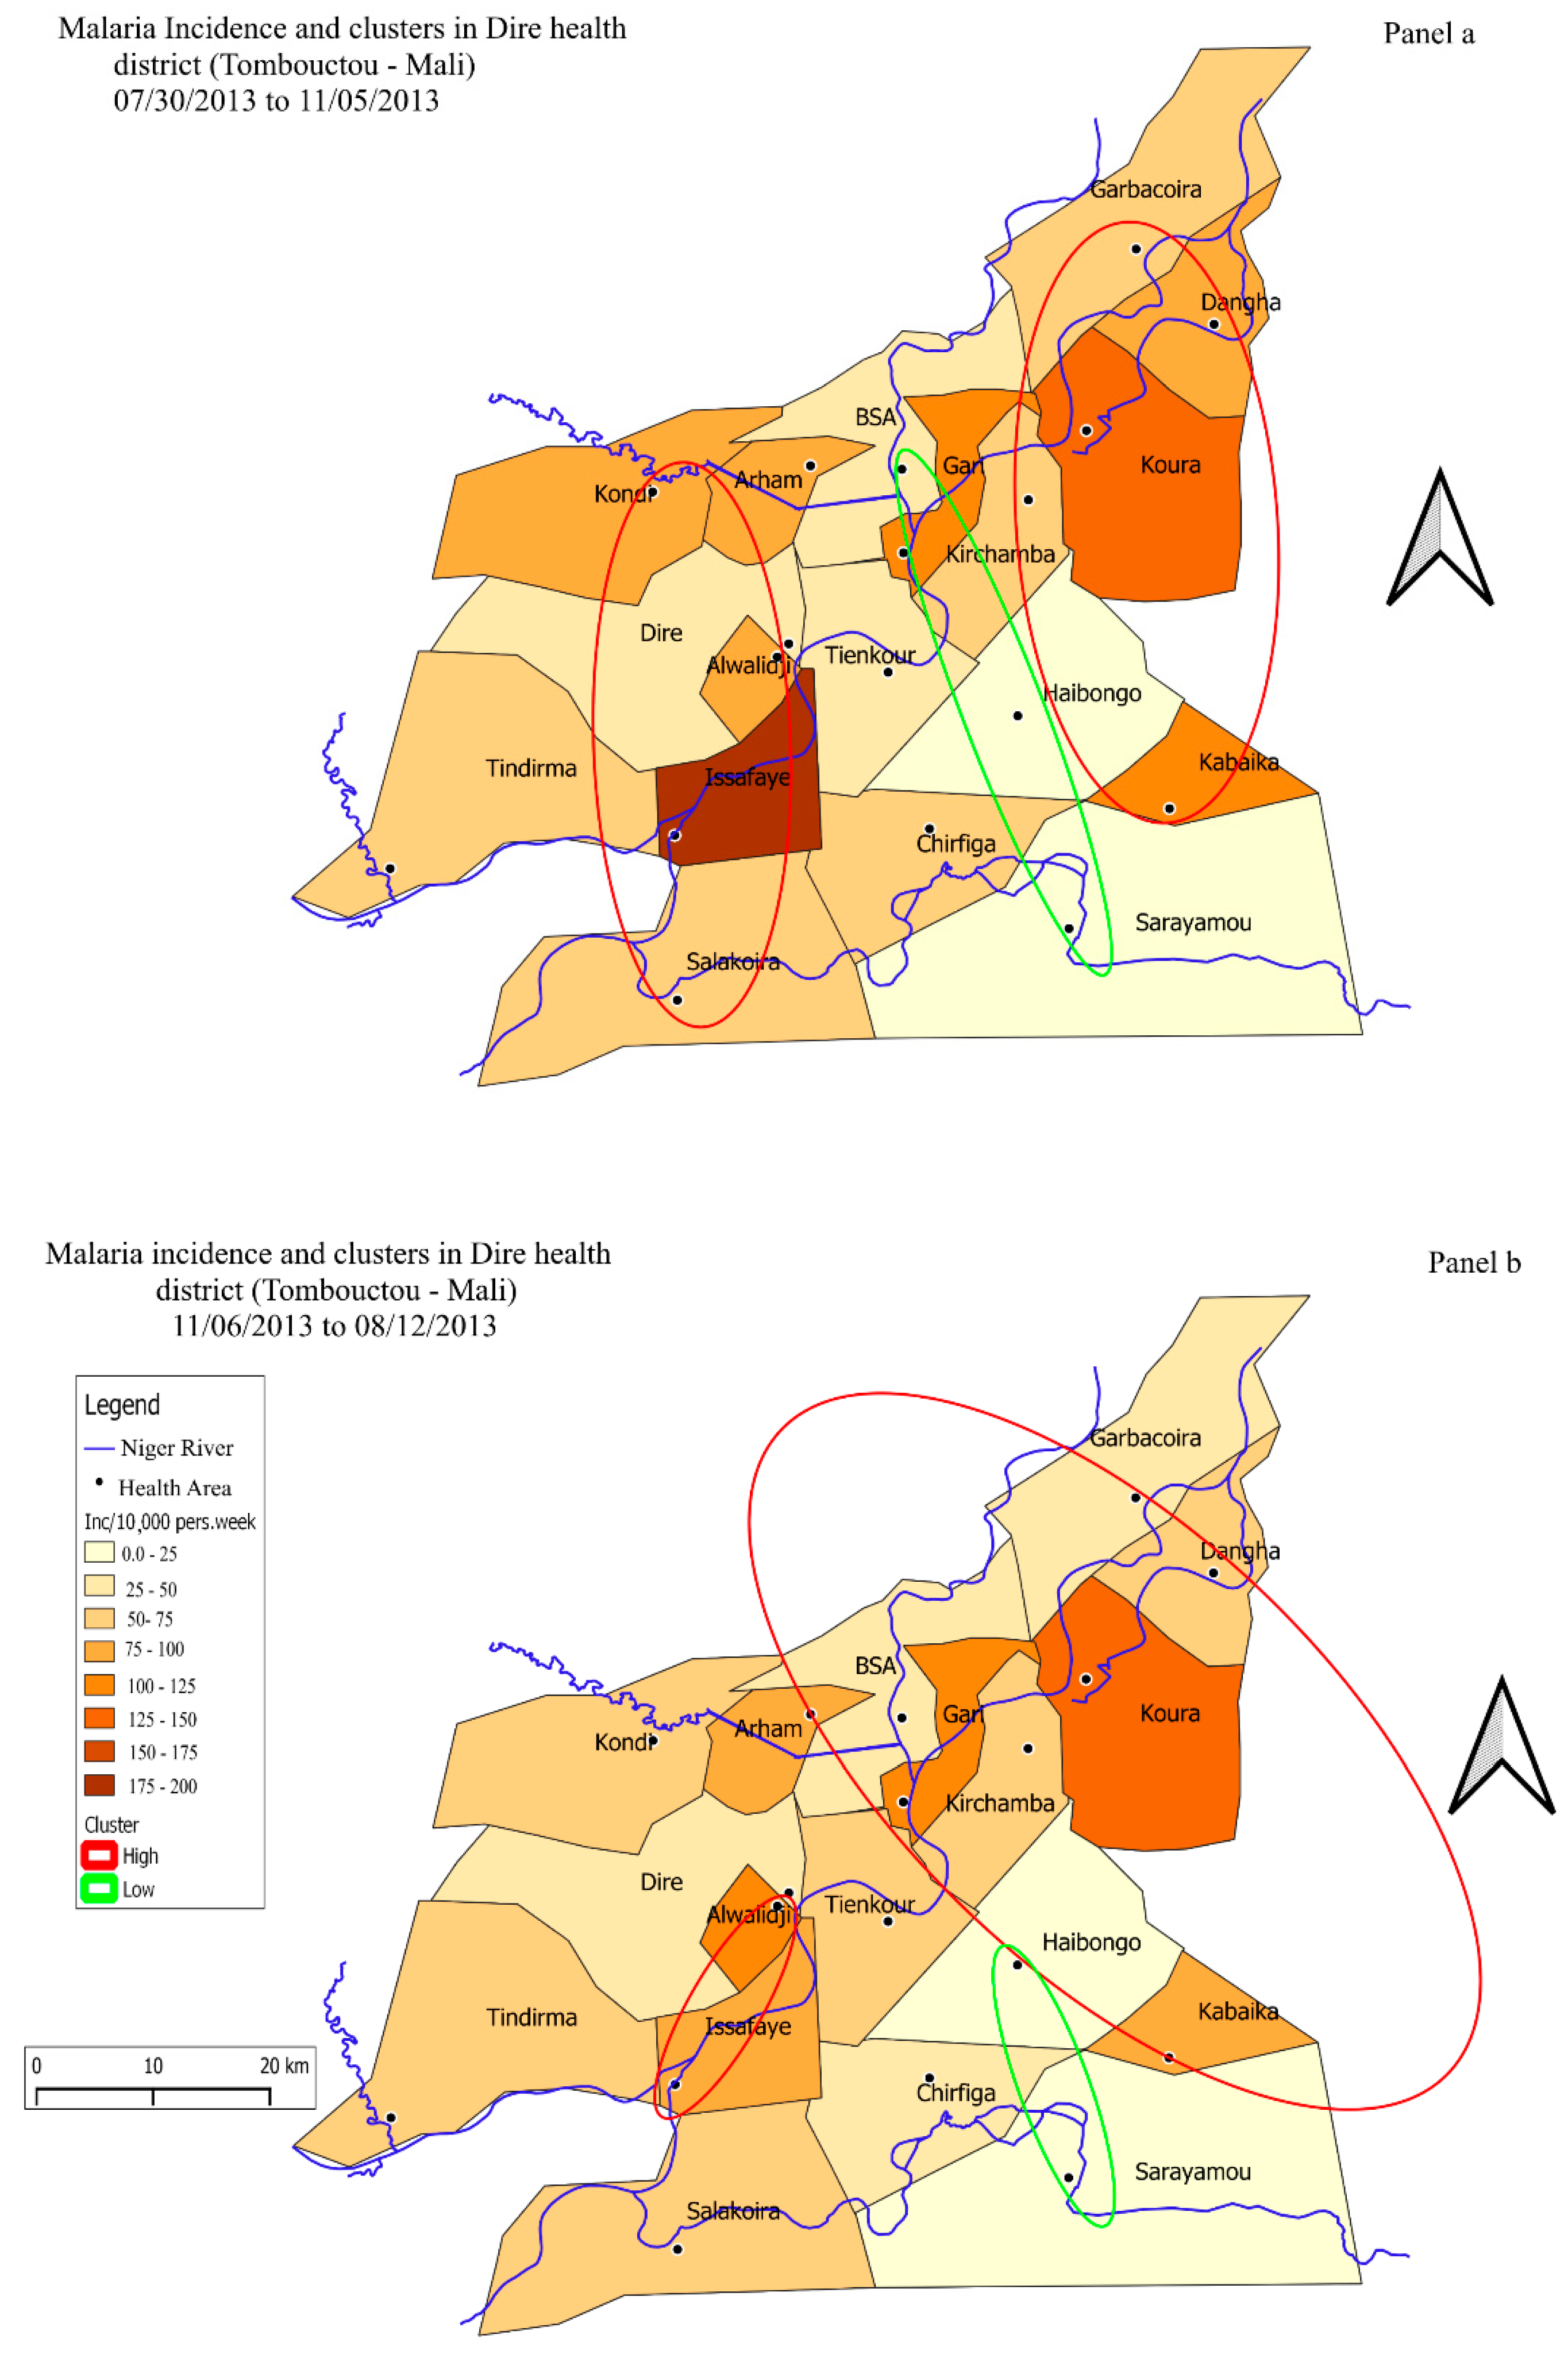
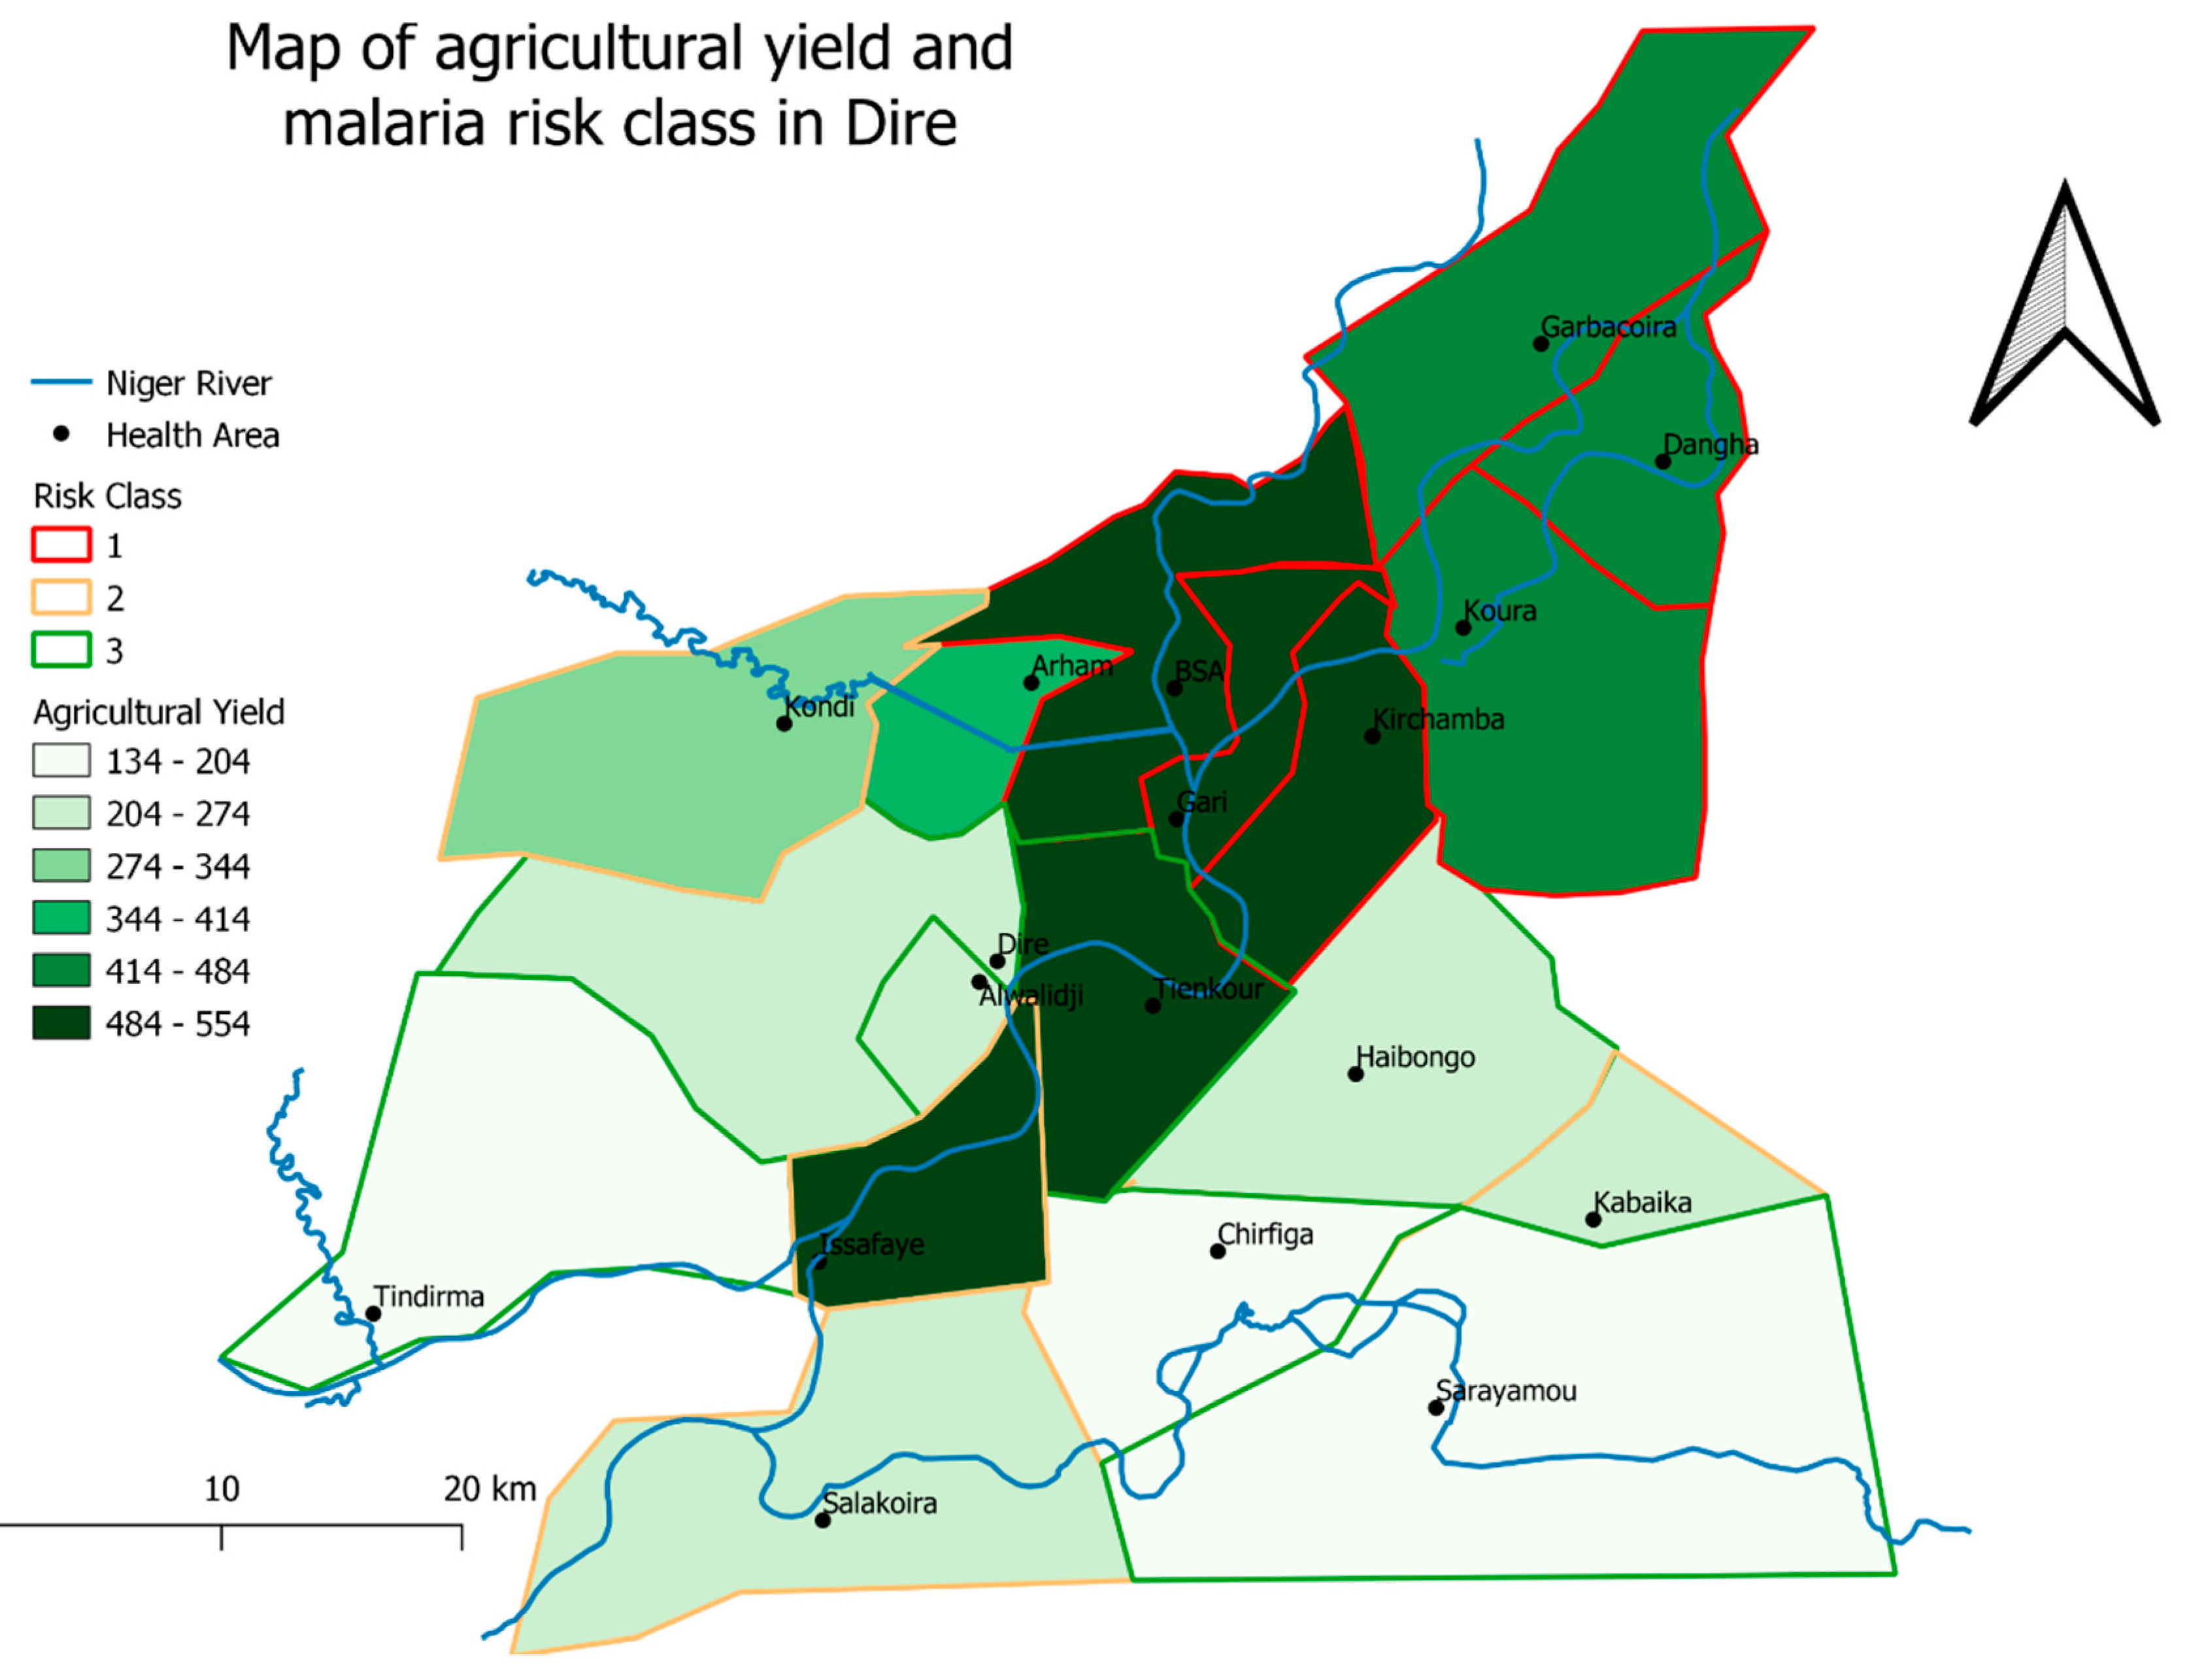
3.2. Spatial Analysis of Malaria Incidence by Satscan
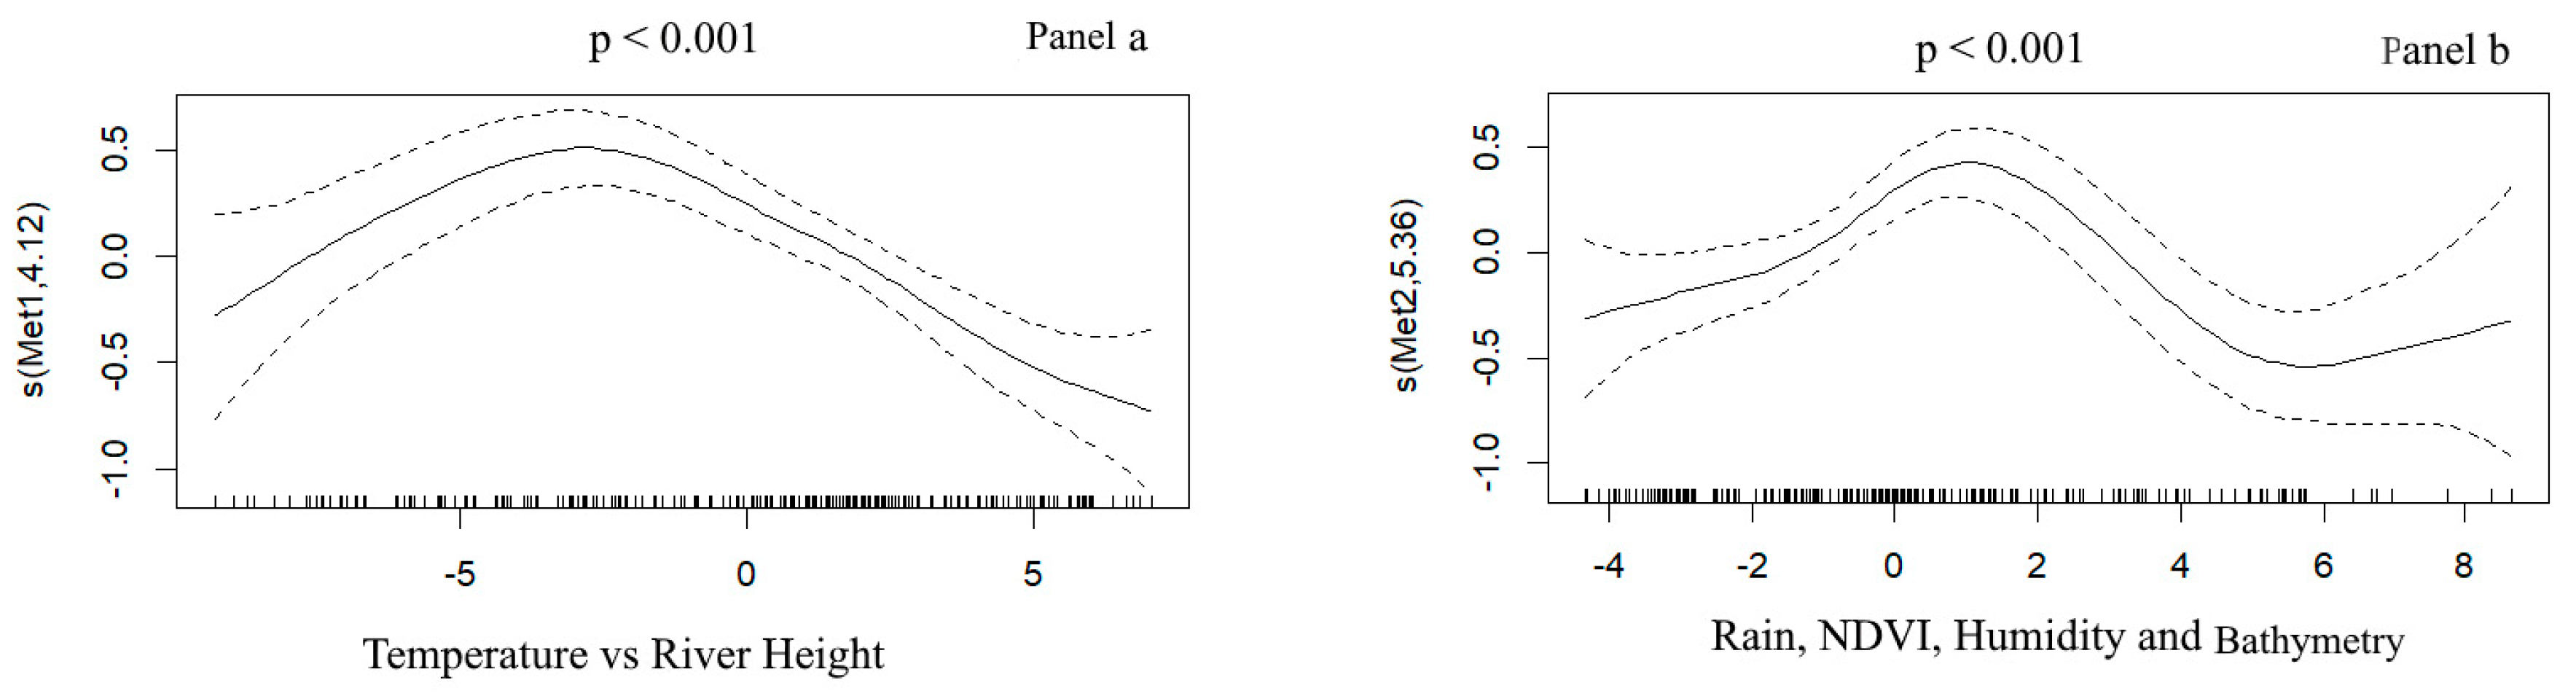
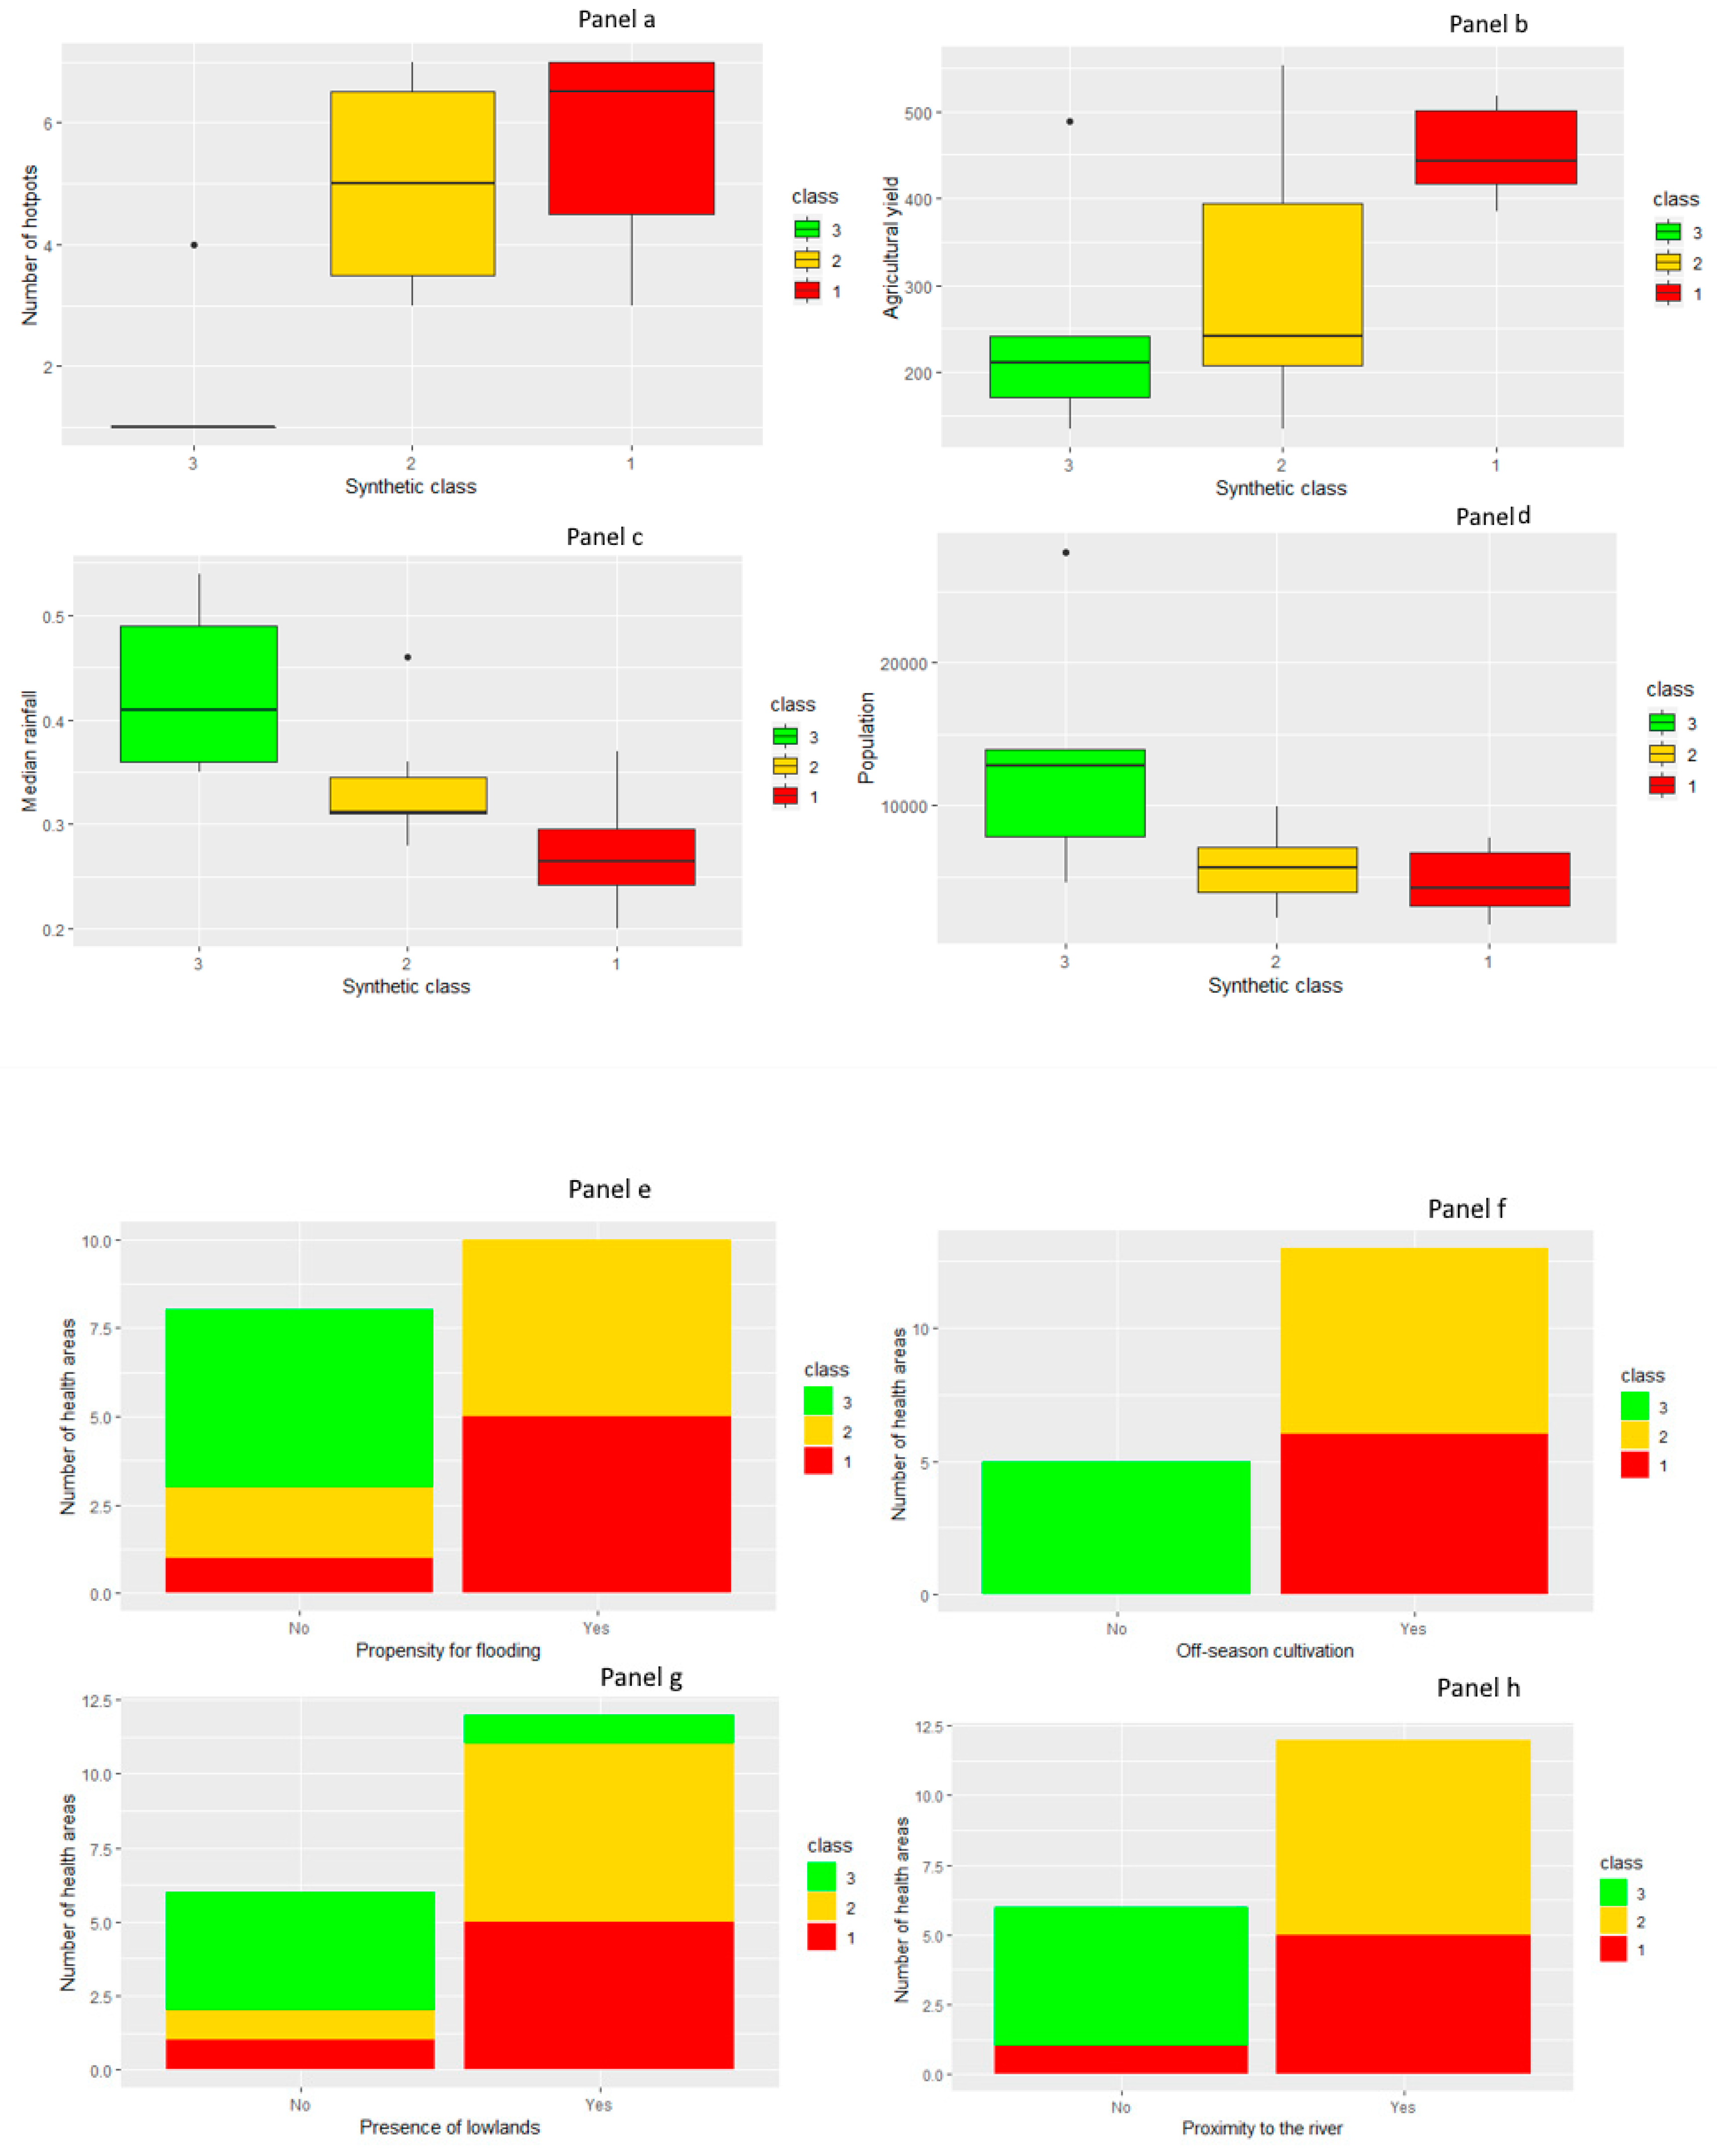
3.3. Relationship between Meteorological and Environmental Factors and Hotspots
4. Discussion
5. Conclusions
Supplementary Materials
Author Contributions
Funding
Acknowledgments
Conflicts of Interest
References
- World Health Organization: World Health Organization & United Nations Children’s Fund (UNICEF). Achieving the Malaria MDG Target: Reversing the Incidence of Malaria 2000–2015; World Health Organization: Geneva, Switzerland, 2015; p. 44. [Google Scholar]
- Bhatt, S.; Weiss, D.J.; Cameron, E.; Bisanzio, D.; Mappin, B.; Dalrymple, U.; Battle, K.; Moyes, C.L.; Henry, A.; Eckhoff, P.A.; et al. Gething PWThe effect of malaria control on Plasmodium falciparum in Africa between 2000 and 2015. PubMed NCBI 2015, 526, 207–211. [Google Scholar] [CrossRef] [Green Version]
- WHO: World Health Organization. World Malaria Report; World Health Organization: Geneva, Switzerland, 2018; p. 210. [Google Scholar]
- WHO. Global Technical Strategy for Malaria 2016–2030; World Health Organization: Geneva, Switzerland, 2015. [Google Scholar]
- Wotodjo, A.N.; Doucoure, S.; Gaudart, J.; Diagne, N.; Diene Sarr, F.; Faye, N.; Tall, A.; Raoult, D.; Sokhna, C. Malaria in Dielmo, a Senegal village: Is its elimination possible after seven years of implementation of long-lasting insecticide-treated nets? PLoS ONE 2017, 12, e0179528. [Google Scholar] [CrossRef] [PubMed] [Green Version]
- Zhu, G.-D.; Cao, J. Progress and challenges of global malaria elimination. Chin. J. Schistosomiasis Control 2019, 31, 19–22. [Google Scholar] [CrossRef]
- Diakalia, K.; Drissa, C.; Ogobara, D.; PNLP, MRTC and INFORM. An epidemiological profile of malaria in Mali. A report prepared for the Ministry of Health, Mali, the Roll Back Malaria Partnership and the Department for International Development, UK. February, 2015; Bamako, Mali 2015. p. 88. Available online: http://www.inform-malaria.org/wp-content/uploads/2015/03/Mali-Malaria-Epi-Profile-Report_030315.pdf (accessed on 23 February 2018).
- Tandina, F.; Doumbo, O.; Yaro, A.S.; Traoré, S.F.; Parola, P.; Robert, V. Mosquitoes (Diptera: Culicidae) and mosquito-borne diseases in Mali, West Africa. Parasit Vectors 2018, 11, 467. [Google Scholar] [CrossRef] [PubMed] [Green Version]
- Bernabeu, M.; Gomez-Perez, G.P.; Sissoko, S.; Niambélé, M.B.; Haibala, A.A.; Sanz, A.; Théra, M.A.; Fernandez-Becerra, C.; Traoré, K.; Alonso, P.L.; et al. Plasmodium vivax malaria in Mali: A study from three different regions. Malar. J. 2012, 11, 405. [Google Scholar] [CrossRef] [Green Version]
- Ouedraogo, B.; Inoue, Y.; Kambiré, A.; Sallah, K.; Dieng, S.; Tine, R.; Rouamba, T.; Herbreteau, V.; Sawadogo, Y.; Ouedraogo, L.S.L.W.; et al. Spatio-temporal dynamic of malaria in Ouagadougou, Burkina Faso, 2011–2015. Malar. J. 2018, 17. [Google Scholar] [CrossRef] [Green Version]
- Jaleta, K.T.; Hill, S.R.; Seyoum, E.; Balkew, M.; Gebre-Michael, T.; Ignell, R.; Tekie, H. Agro-ecosystems impact malaria prevalence: Large-scale irrigation drives vector population in western Ethiopia. Malar. J. 2013, 12, 350. [Google Scholar] [CrossRef] [Green Version]
- de Oliveira Padilha, M.A.; de Oliveira Melo, J.; Romano, G.; de Lima, M.V.M.; Alonso, W.J.; Sallum, M.A.M.; Laporta, G.Z. Comparison of malaria incidence rates and socioeconomic-environmental factors between the states of Acre and Rondônia: A spatio-temporal modelling study. Malar. J. 2019, 18, 306. [Google Scholar] [CrossRef] [Green Version]
- Gaudart, J.; Touré, O.; Dessay, N.; lassane Dicko, A.; Ranque, S.; Forest, L.; Demongeot, J.; Doumbo, O.K. Modelling malaria incidence with environmental dependency in a locality of Sudanese savannah area, Mali. Malar. J. 2009, 8, 61. [Google Scholar] [CrossRef]
- Gaudart, J.; Poudiougou, B.; Dicko, A.; Ranque, S.; Toure, O.; Sagara, I.; Diallo, M.; Diawara, S.; Ouattara, A.; Diakite, M.; et al. Space-time clustering of childhood malaria at the household level: A dynamic cohort in a Mali village. Bmc Public Health 2006, 6, 286. [Google Scholar] [CrossRef] [Green Version]
- Coulibaly, D.; Travassos, M.A.; Tolo, Y.; Laurens, M.B.; Kone, A.K.; Traore, K.; Sissoko, M.; Niangaly, A.; Diarra, I.; Daou, M.; et al. Spatio-Temporal Dynamics of Asymptomatic Malaria: Bridging the Gap Between Annual Malaria Resurgences in a Sahelian Environment. Am. J. Trop. Med. Hyg. 2017, 97, 1761–1769. [Google Scholar] [CrossRef] [PubMed] [Green Version]
- Keïta, M.; Baber, I.; Sogoba, N.; Maïga, H.M.; Diallo, M.B.; Doumbia, S.; Traoré, S.F. Transmission vectorielle du paludisme dans un village du bord du fleuve Niger et son hameau de pêche (Kéniéroba et Fourda, Mali). Bull. Soc. Pathol. Exot. 2014, 107, 356–368. [Google Scholar] [CrossRef] [PubMed]
- Chung, B. Impact of Irrigation Extension on Malaria Transmission in Simret, Tigray, Ethiopia. Korean J. Parasitol. 2016, 54, 399–405. [Google Scholar] [CrossRef] [PubMed]
- Catry, T.; Pottier, A.; Marti, R.; Li, Z.; Roux, E.; Herbreteau, V.; Mangeas, M.; Demagistri, L.; Gurgel, H.; Dessay, N. Apports de la combinaison d’images satellites optique et RADAR dans l’étude des maladies à transmission vectorielle: Cas du paludisme à la frontière Guyane française—Brésil. Confins 2018, 37. [Google Scholar] [CrossRef]
- Saugeon, C.; Baldet, T.; Akogbeto, M.; Henry, M.C. Will climate and demography have a major impact on malaria in sub-Saharan Africa in the next 20 years. Med Trop (Mars) 2009, 69, 203–207. [Google Scholar]
- Seck, M.C.; Thwing, J.; Badiane, A.S.; Rogier, E.; Fall, F.B.; Ndiaye, P.I.; Diongue, K.; Mbow, M.; Ndiaye, M.; Diallo, M.A.; et al. Analysis of anti-Plasmodium IgG profiles among Fulani nomadic pastoralists in northern Senegal to assess malaria exposure. Malar. J. 2020, 19, 15. [Google Scholar] [CrossRef]
- Cercle de Diré Activity Report of Dire health district. Monograph of the Cercle de Dire: Updated to the 2018 Management Board. March-2018.; Union Européenne: Brussels, Belgium, 2017. [Google Scholar]
- Doumbo, O.; Koita, O.; Traore, S.F.; Sangare, O.; Coulibaly, A.; Robert, V.; Soula, G.; Quilici, M.; Toure, Y.T. Les aspects parasitologiques de l’épidémiologie du paludisme dans le Sahara malien. Médecine D’afrique Noire 1991, 5, 103–109. Available online: http://www.santetropicale.com/Resume/23803.pdf (accessed on 23 February 2018).
- Dombo, O.; Sankare, O.; Toure, Y. Malaria in the Sahel: The example of Mali. Mal. Trop. Transm. Ed John Libbey Eurotext 1989, 3, 11–32. [Google Scholar]
- Huffman, G.J.; Stocker, E.F.; Bolvin, D.T.; Nelkin, E.J.; Tan, J. NASA 2019. GPM IMERG Early Precipitation L3 1 Day 0.1 Degree × 0.1 Degree V06, Savtchenko, A., Ed.; Goddard Earth Sciences Data and Information Services Center (GES DISC): Greenbelt, MD, USA, 2019. [Google Scholar] [CrossRef]
- Landier, J.; Rebaudet, S.; Piarroux, R.; Gaudart, J. Spatiotemporal analysis of malaria for new sustainable control strategies. Bmc Med. 2018, 16, 226. [Google Scholar] [CrossRef] [Green Version]
- Jean-Herman Guay Statistiques en Sciences Humaines et sociales Avec R; Presses de l’Université Laval: Québec, Canada, 2014; ISBN 978-2-8041-8934-1.
- Scott, D.W. The New S Language. Technometrics 1990, 32, 103–104. [Google Scholar] [CrossRef]
- François, H.; Lê, S. Pagès Anal. De Données Avec R; Presses Universitaires de Rennes: Rennes, France, 2009; ISBN 978-2-7535-4869-5. [Google Scholar]
- Wood, S.N. Generalized Additive Models: An Introduction with R; CRC Press: Boca Raton, FL, USA, 2006; p. 392. [Google Scholar]
- Abiodun, G.J.; Makinde, O.S.; Adeola, A.M.; Njabo, K.Y.; Witbooi, P.J.; Djidjou-Demasse, R.; Botai, J.O. A Dynamical and Zero-Inflated Negative Binomial Regression Modelling of Malaria Incidence in Limpopo Province, South Africa. Int. J. Environ. Res. Public Health 2019. [Google Scholar] [CrossRef] [Green Version]
- Sallah, K.; Giorgi, R.; Bengtsson, L.; Lu, X.; Wetter, E.; Adrien, P.; Rebaudet, S.; Piarroux, R.; Gaudart, J. Mathematical models for predicting human mobility in the context of infectious disease spread: Introducing the impedance model. Int. J. Health. Geogr. 2017, 16, 42. [Google Scholar] [CrossRef] [PubMed] [Green Version]
- Pascal, A.; Thierry, A. Thierry, A. Surveillance Epidémiologique: Principes, Méthodes et Applications en Santé Publique; Lavoisier Médecine Sciences: Paris, France, 2011; ISBN 978-2-257-20426-4. [Google Scholar]
- Kulldorff, M.; Heffernan, R.; Hartman, J.; Assunção, R.M.; Mostashari, F. A space-time permutation scan statistic for the early detection of disease outbreaks. PLoS Méd. 2005, 2, 216–224. [Google Scholar]
- Oliveira, F.L.P.; Cançado, A.L.F.; de Souza, G.; Moreira, G.J.P.; Kulldorff, M. Border analysis for spatial clusters. Int. J. Health. Geogr. 2018, 17, 5. [Google Scholar] [CrossRef] [PubMed] [Green Version]
- Geofabrik. Download Server. Available online: http://download.geofabrik.de/africa/mali.html (accessed on 23 May 2019).
- Lê, S.; Josse, J.; Husson, F. FactoMineR: An R Package for Multivariate Analysis. J. Stat. Softw. 2008, 25, 1–18. [Google Scholar] [CrossRef] [Green Version]
- Wood, S.N.; Pya, N.; Säfken, B. Smoothing Parameter and Model Selection for General Smooth Models. J. Am. Stat. Assoc. 2016, 111, 1548–1563. [Google Scholar] [CrossRef]
- QGIS Development Team QGIS Geographic Information System. Open Source Geospatial Foundation Project. Available online: http://qgis.osgeo.org (accessed on 10 February 2019).
- Imoro, R.J. North-South Migration and Problems of Migrant Traders in Agbogbloshie. Afr. Hum. Mobil. Rev. 2018, 3, 1073. [Google Scholar]
- Abiodun, G.J.; Njabo, K.Y.; Witbooi, P.J.; Adeola, A.M.; Fuller, T.L.; Okosun, K.O.; Makinde, O.S.; Botai, J.O. Exploring the Influence of Daily Climate Variables on Malaria Transmission and Abundance of Anopheles arabiensis over Nkomazi Local Municipality, Mpumalanga Province, South Africa. J. Environ. Public Health 2018, 2018, 3143950. [Google Scholar] [CrossRef] [PubMed]
- Ihantamalala, F.A.; Rakotoarimanana, F.M.J.; Ramiadantsoa, T.; Rakotondramanga, J.M.; Pennober, G.; Rakotomanana, F.; Cauchemez, S.; Metcalf, C.J.E.; Herbreteau, V.; Wesolowski, A. Spatial and temporal dynamics of malaria in Madagascar. Malar. J. 2018, 17, 58. [Google Scholar] [CrossRef] [PubMed]
- Park, J.-W.; Cheong, H.-K.; Honda, Y.; Ha, M.; Kim, H.; Kolam, J.; Inape, K.; Mueller, I. Time Trend of Malaria in Relation to Climate Variability in Papua New Guinea. Environ. Health Toxicol. 2016, 31, e2016003. [Google Scholar] [CrossRef] [PubMed] [Green Version]
- Reid, H.L.; Haque, U.; Roy, S.; Islam, N.; Clements, A.C. Characterizing the spatial and temporal variation of malaria incidence in Bangladesh, 2007. Malar. J. 2012, 11, 170. [Google Scholar] [CrossRef] [Green Version]
- Coulibaly, D.; Rebaudet, S.; Travassos, M.; Tolo, Y.; Laurens, M.; Kone, A.K.; Traore, K.; Guindo, A.; Diarra, I.; Niangaly, A.; et al. Spatio-temporal analysis of malaria within a transmission season in Bandiagara, Mali. Malar. J. 2013, 12, 82. [Google Scholar] [CrossRef] [PubMed] [Green Version]
- Sissoko, M.S.; Sissoko, K.; Kamate, B.; Samake, Y.; Goita, S.; Dabo, A.; Yena, M.; Dessay, N.; Piarroux, R.; Doumbo, O.K.; et al. Temporal dynamic of malaria in a suburban area along the Niger River. Malar. J. 2017, 16. [Google Scholar] [CrossRef] [PubMed] [Green Version]
- Gal, L.; Grippa, M.; Hiernaux, P.; Pons, L.; Kergoat, L. The paradoxical evolution of runoff in the pastoral Sahel: Analysis of the hydrological changes over the Agoufou watershed (Mali) using the KINEROS-2 model. Hydrol. Earth Syst. Sc. 2017, 21, 4591–4613. [Google Scholar] [CrossRef] [Green Version]
- WHO. Malaria Control: The Power of Integrated Action. Available online: https://www.who.int/heli/risks/vectors/malariacontrol/en/index7.html (accessed on 25 December 2019).
- Huestis, D.L.; Dao, A.; Diallo, M.; Sanogo, Z.L.; Samake, D.; Yaro, A.S.; Ousman, Y.; Linton, Y.-M.; Krishna, A.; Veru, L.; et al. Windborne long-distance migration of malaria mosquitoes in the Sahel. Nature 2019, 574, 404–408. [Google Scholar] [CrossRef]
- Damien, K.A.K.; Pacôme, A.Y.G.; Ahon, K.; André, T.O.; Célestin, H.A. Contribution des données géospatiales a l’étude du risque de paludisme en milieu péri-urbain: Cas de la localité d’Anonkoua kouté (Abidjan, Côte d’Ivoire). Int. J. Eng. Sci. Invent. 2018, 7, 81–88. [Google Scholar]
- Jarju, L.B.; Fillinger, U.; Green, C.; Louca, V.; Majambere, S.; Lindsay, S.W. Agriculture and the promotion of insect pests: Rice cultivation in river floodplains and malaria vectors in The Gambia. Malar. J. 2009, 8, 170. [Google Scholar] [CrossRef] [Green Version]
- Wondwosen, B.; Birgersson, G.; Seyoum, E.; Tekie, H.; Torto, B.; Fillinger, U.; Hill, S.R.; Ignell, R. Rice volatiles lure gravid malaria mosquitoes, Anopheles arabiensis. Sci. Rep. 2016, 6, 1–8. [Google Scholar] [CrossRef] [Green Version]
- Diuk-Wasser, M.A.; Touré, M.B.; Dolo, G.; Bagayoko, M.; Sogoba, N.; Sissoko, I.; Traoré, S.F.; Taylor, C.E. Effect of rice cultivation patterns on malaria vector abundance in rice-growing villages in Mali. Am. J. Trop. Med. Hyg. 2007, 76, 869–874. [Google Scholar] [CrossRef] [Green Version]
- Keiser, J.; Utzinger, J.; Singer, B.H. The potential of intermittent irrigation for increasing rice yields, lowering water consumption, reducing methane emissions, and controlling malaria in African rice fields. J. Am. Mosq. Control Assoc. 2002, 18, 329–340. [Google Scholar]
- Mazigo, H.D.; Massawe, I.S.; Rumisha, S.F.; Kweka, E.J.; Mboera, L.E.G. Rice farmers’ perceptions and acceptability in the use of a combination of biolarvicide (Bacillus thuringiensis var. israeliensis) and fertilizers application for malaria control and increase rice productivity in a rural district of central Tanzania. Malar. J. 2019, 18, 71. [Google Scholar] [CrossRef]
- Rumisha, S.F.; Shayo, E.H.; Mboera, L.E.G. Spatio-temporal prevalence of malaria and anaemia in relation to agro-ecosystems in Mvomero district, Tanzania. Malar. J. 2019, 18, 228. [Google Scholar] [CrossRef] [PubMed]
- Zinszer, K.; Charland, K.; Kigozi, R.; Dorsey, G.; Kamya, M.R.; Buckeridge, D.L. Determining health-care facility catchment areas in Uganda using data on malaria-related visits. Bull. World Health Organ. 2014, 92, 178–186. [Google Scholar] [CrossRef] [PubMed]


| Date | Number of Weeks | Inc./10,000 Pers.-Weeks | Cumulative Rainfall (mm) | Median Tmax (SD) | Median Tmin (SD) | Median NDVI (SD) | Median Night Relative Humidity (SD) | Median River Height (SD) |
|---|---|---|---|---|---|---|---|---|
| 30/July/2013 | 20 | 43.20 | 201.4 | 38.96 | 23.84 | 0.24 | 53.87 | 207.25 |
| 05/Nov/2013 | 2.56 | 2.12 | 0.05 | 12.34 | 165.61 | |||
| 06/Nov/2013 | 31 | 45.92 | 0 | 36.88 | 16.79 | 0.17 | 26.76 | 266.50 |
| 12/Aug/2014 | 3.93 | 5.26 | 0.02 | 9.20 | 189.29 | |||
| 13/Aug/2014 | 22 | 17.97 | 218.4 | 39.08 | 23.74 | 0.22 | 51.42 | 232.50 |
| 18/Nov/2014 | 2.28 | 2.44 | 0.05 | 9.67 | 147.17 | |||
| 19/Nov/2014 | 36 | 14.38 | 0 | 38.28 | 17.46 | 0.16 | 25.29 | 117.00 |
| 28/July/2015 | 4.71 | 6.23 | 0.02 | 7.10 | 172.65 | |||
| 29/July/2015 | 11 | 49.95 | 189.6 | 36.36 | 23.38 | 0.29 | 62.12 | 262.5 |
| 17/Nov/2015 | 2.20 | 0.64 | 0.04 | 11.13 | 118.24 | |||
| 18/Nov/2015 | 38 | 49.95 | 0 | 38.15 | 17.19 | 0.17 | 32.66 | 359.75 |
| 19/July/2016 | 4.98 | 6.00 | 0.04 | 12.91 | 180.44 | |||
| 20/July/2016 | 19 | 16.69 | 372.2 | 37.30 | 23.22 | 0.26 | 58.28 | 351.50 |
| 01/Nov/2016 | 2.24 | 1.46 | 0.05 | 9.98 | 185.10 | |||
| 02/Nov/2016 | 32 | 19.88 | 0 | 38.83 | 18.12 | 0.17 | 26.35 | 198.50 |
| 04/July/2017 | 4.07 | 5.89 | 0.02 | 6.66 | 202.66 | |||
| 05/July/2017 | 19 | 9.65 | 217.5 | 37.81 | 23.52 | 0.25 | 55.95 | 322.00 |
| 07/Nov/2017 | 1.50 | 1.95 | 0.04 | 9.79 | 138.29 |
| Variables | Estimate | Std. Error | IRR | p-Value |
|---|---|---|---|---|
| class 3 (ref) | −0.4298 | 0.1082 | ||
| class 1 | 0.7950 | 0.1884 | 2.21 | 0.001 |
| class 2 | 0.5780 | 0.1264 | 1.78 | 0.001 |
© 2020 by the authors. Licensee MDPI, Basel, Switzerland. This article is an open access article distributed under the terms and conditions of the Creative Commons Attribution (CC BY) license (http://creativecommons.org/licenses/by/4.0/).
Share and Cite
Cissoko, M.; Sagara, I.; Sankaré, M.H.; Dieng, S.; Guindo, A.; Doumbia, Z.; Allasseini, B.; Traore, D.; Fomba, S.; Bendiane, M.K.; et al. Geo-Epidemiology of Malaria at the Health Area Level, Dire Health District, Mali, 2013–2017. Int. J. Environ. Res. Public Health 2020, 17, 3982. https://0-doi-org.brum.beds.ac.uk/10.3390/ijerph17113982
Cissoko M, Sagara I, Sankaré MH, Dieng S, Guindo A, Doumbia Z, Allasseini B, Traore D, Fomba S, Bendiane MK, et al. Geo-Epidemiology of Malaria at the Health Area Level, Dire Health District, Mali, 2013–2017. International Journal of Environmental Research and Public Health. 2020; 17(11):3982. https://0-doi-org.brum.beds.ac.uk/10.3390/ijerph17113982
Chicago/Turabian StyleCissoko, Mady, Issaka Sagara, Moussa H. Sankaré, Sokhna Dieng, Abdoulaye Guindo, Zoumana Doumbia, Balam Allasseini, Diahara Traore, Seydou Fomba, Marc Karim Bendiane, and et al. 2020. "Geo-Epidemiology of Malaria at the Health Area Level, Dire Health District, Mali, 2013–2017" International Journal of Environmental Research and Public Health 17, no. 11: 3982. https://0-doi-org.brum.beds.ac.uk/10.3390/ijerph17113982