Predicting Crash Injury Severity with Machine Learning Algorithm Synergized with Clustering Technique: A Promising Protocol


Abstract
:1. Introduction
1.1. Background
1.2. Application of Statistical Models in Crash Severity Prediction
1.3. Application of Machine Learning Models in Crash Severity Prediction
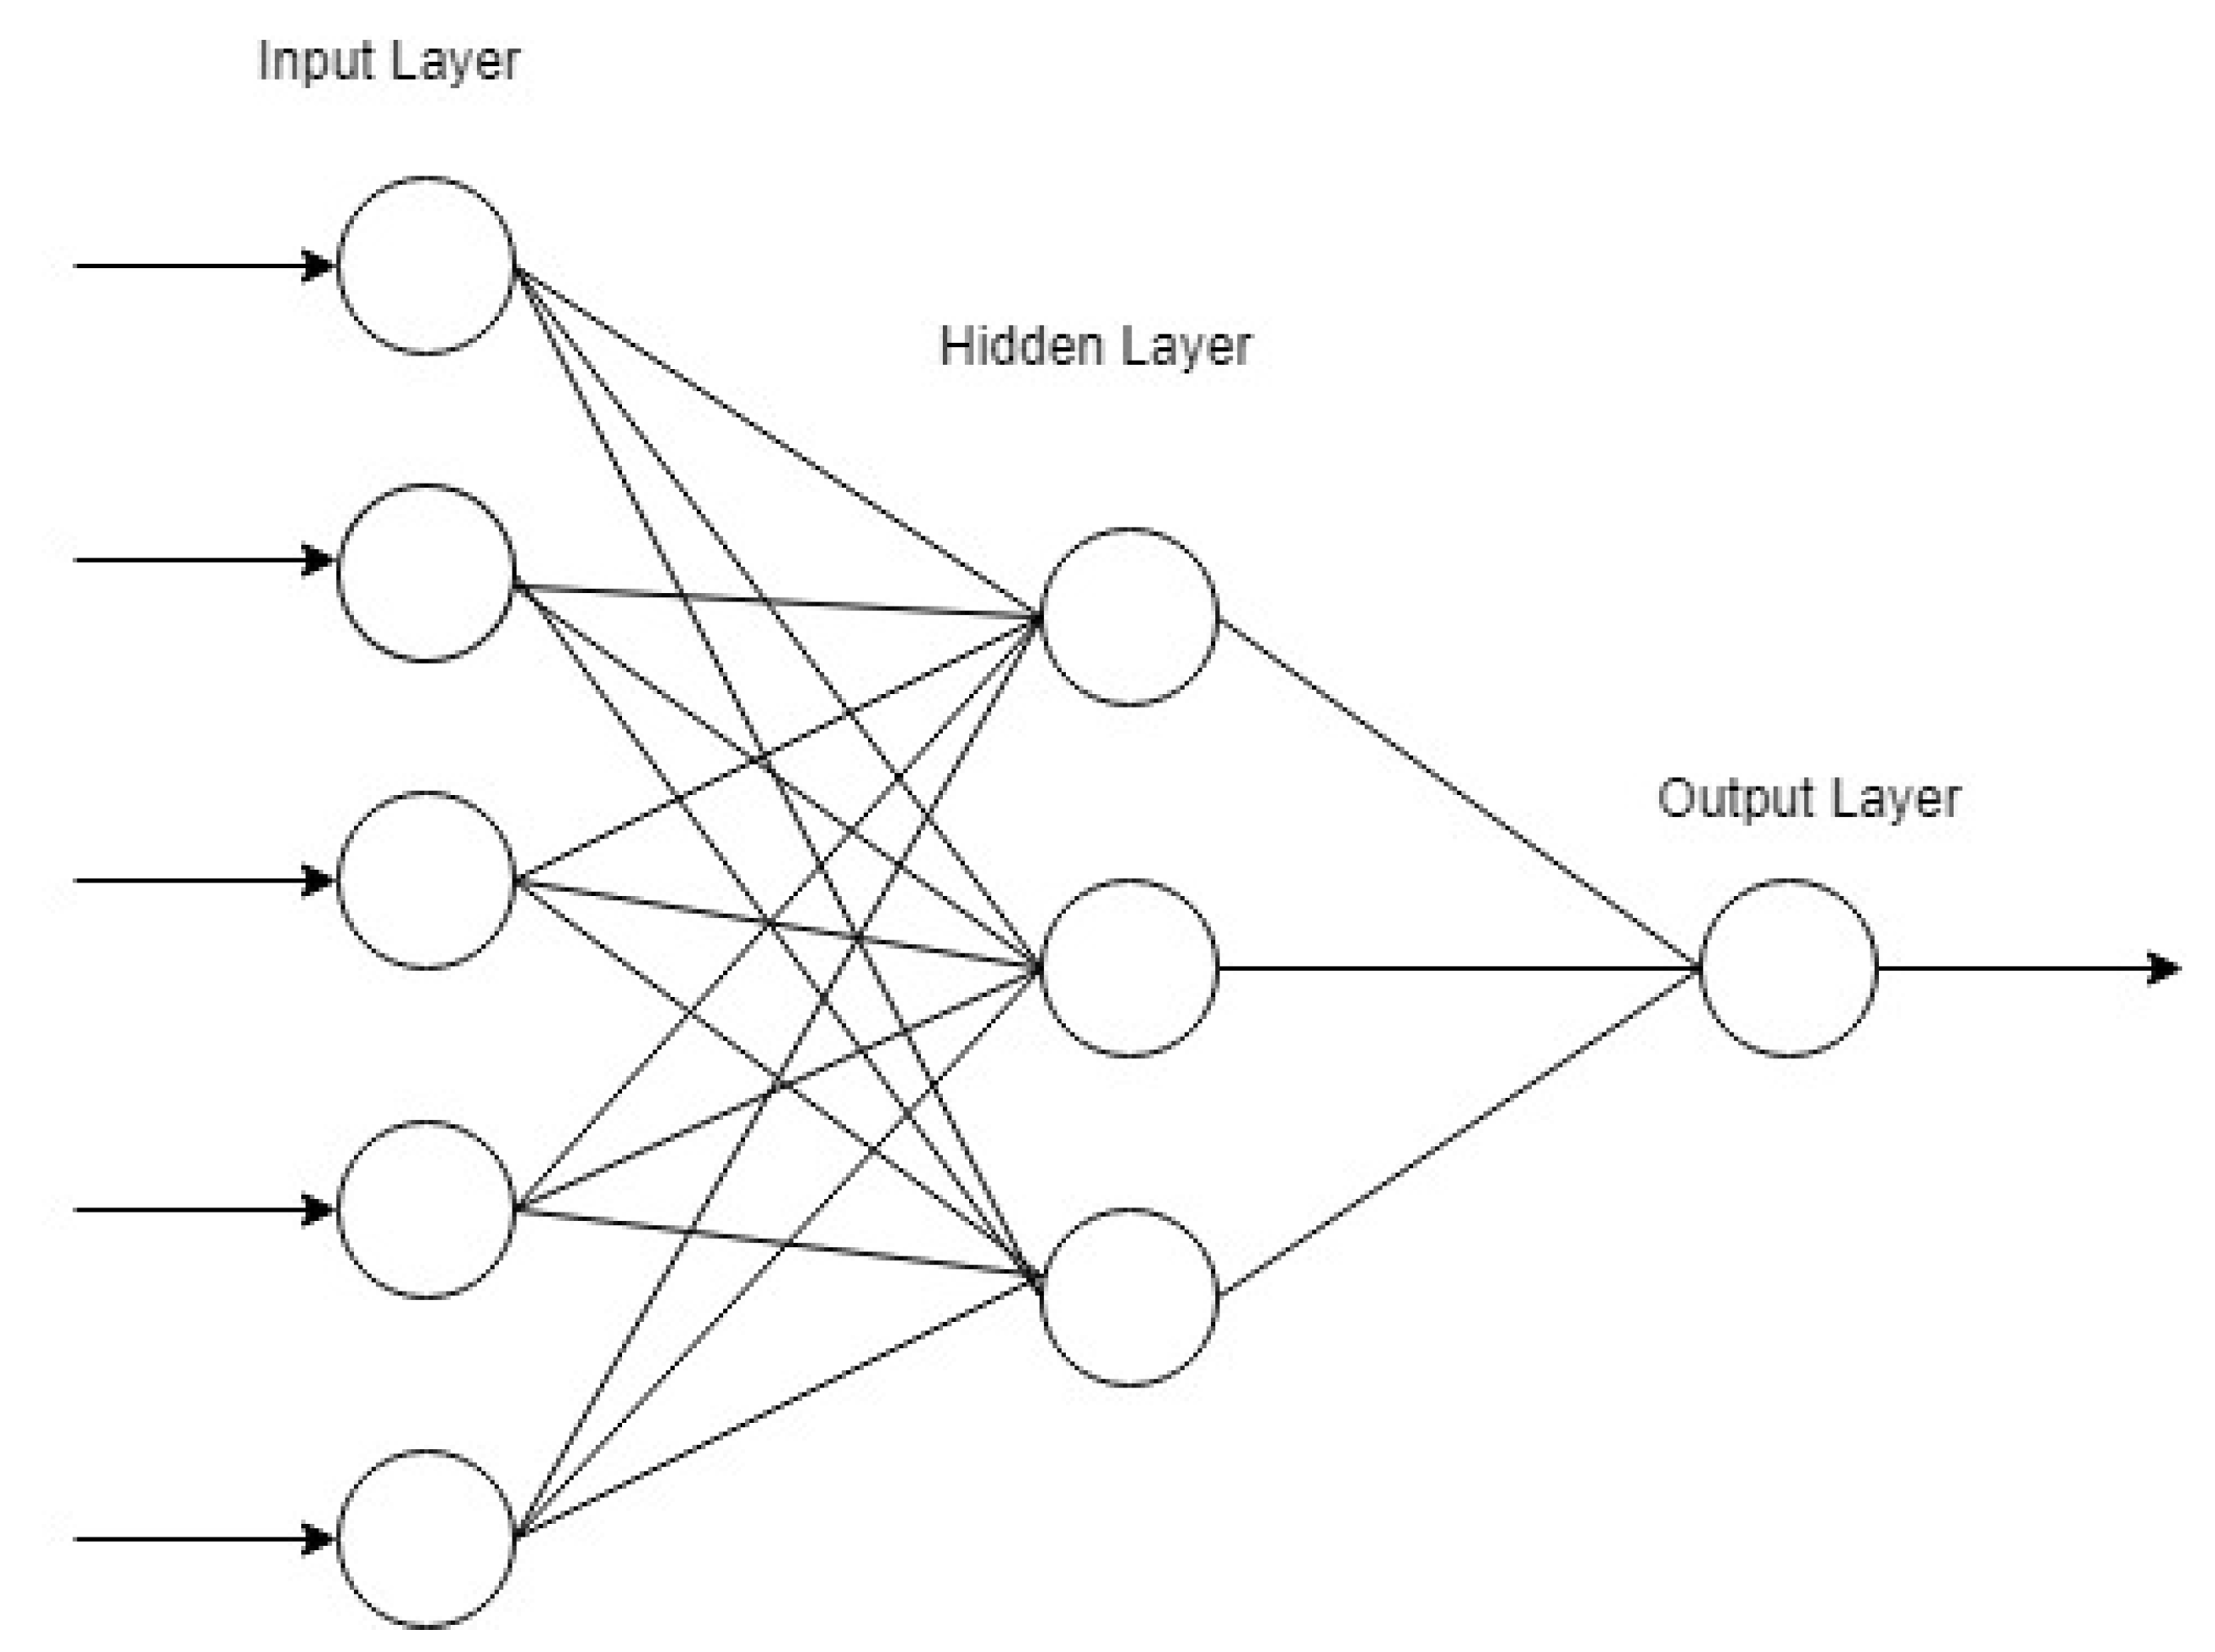
1.4. Artificial Neural Networks
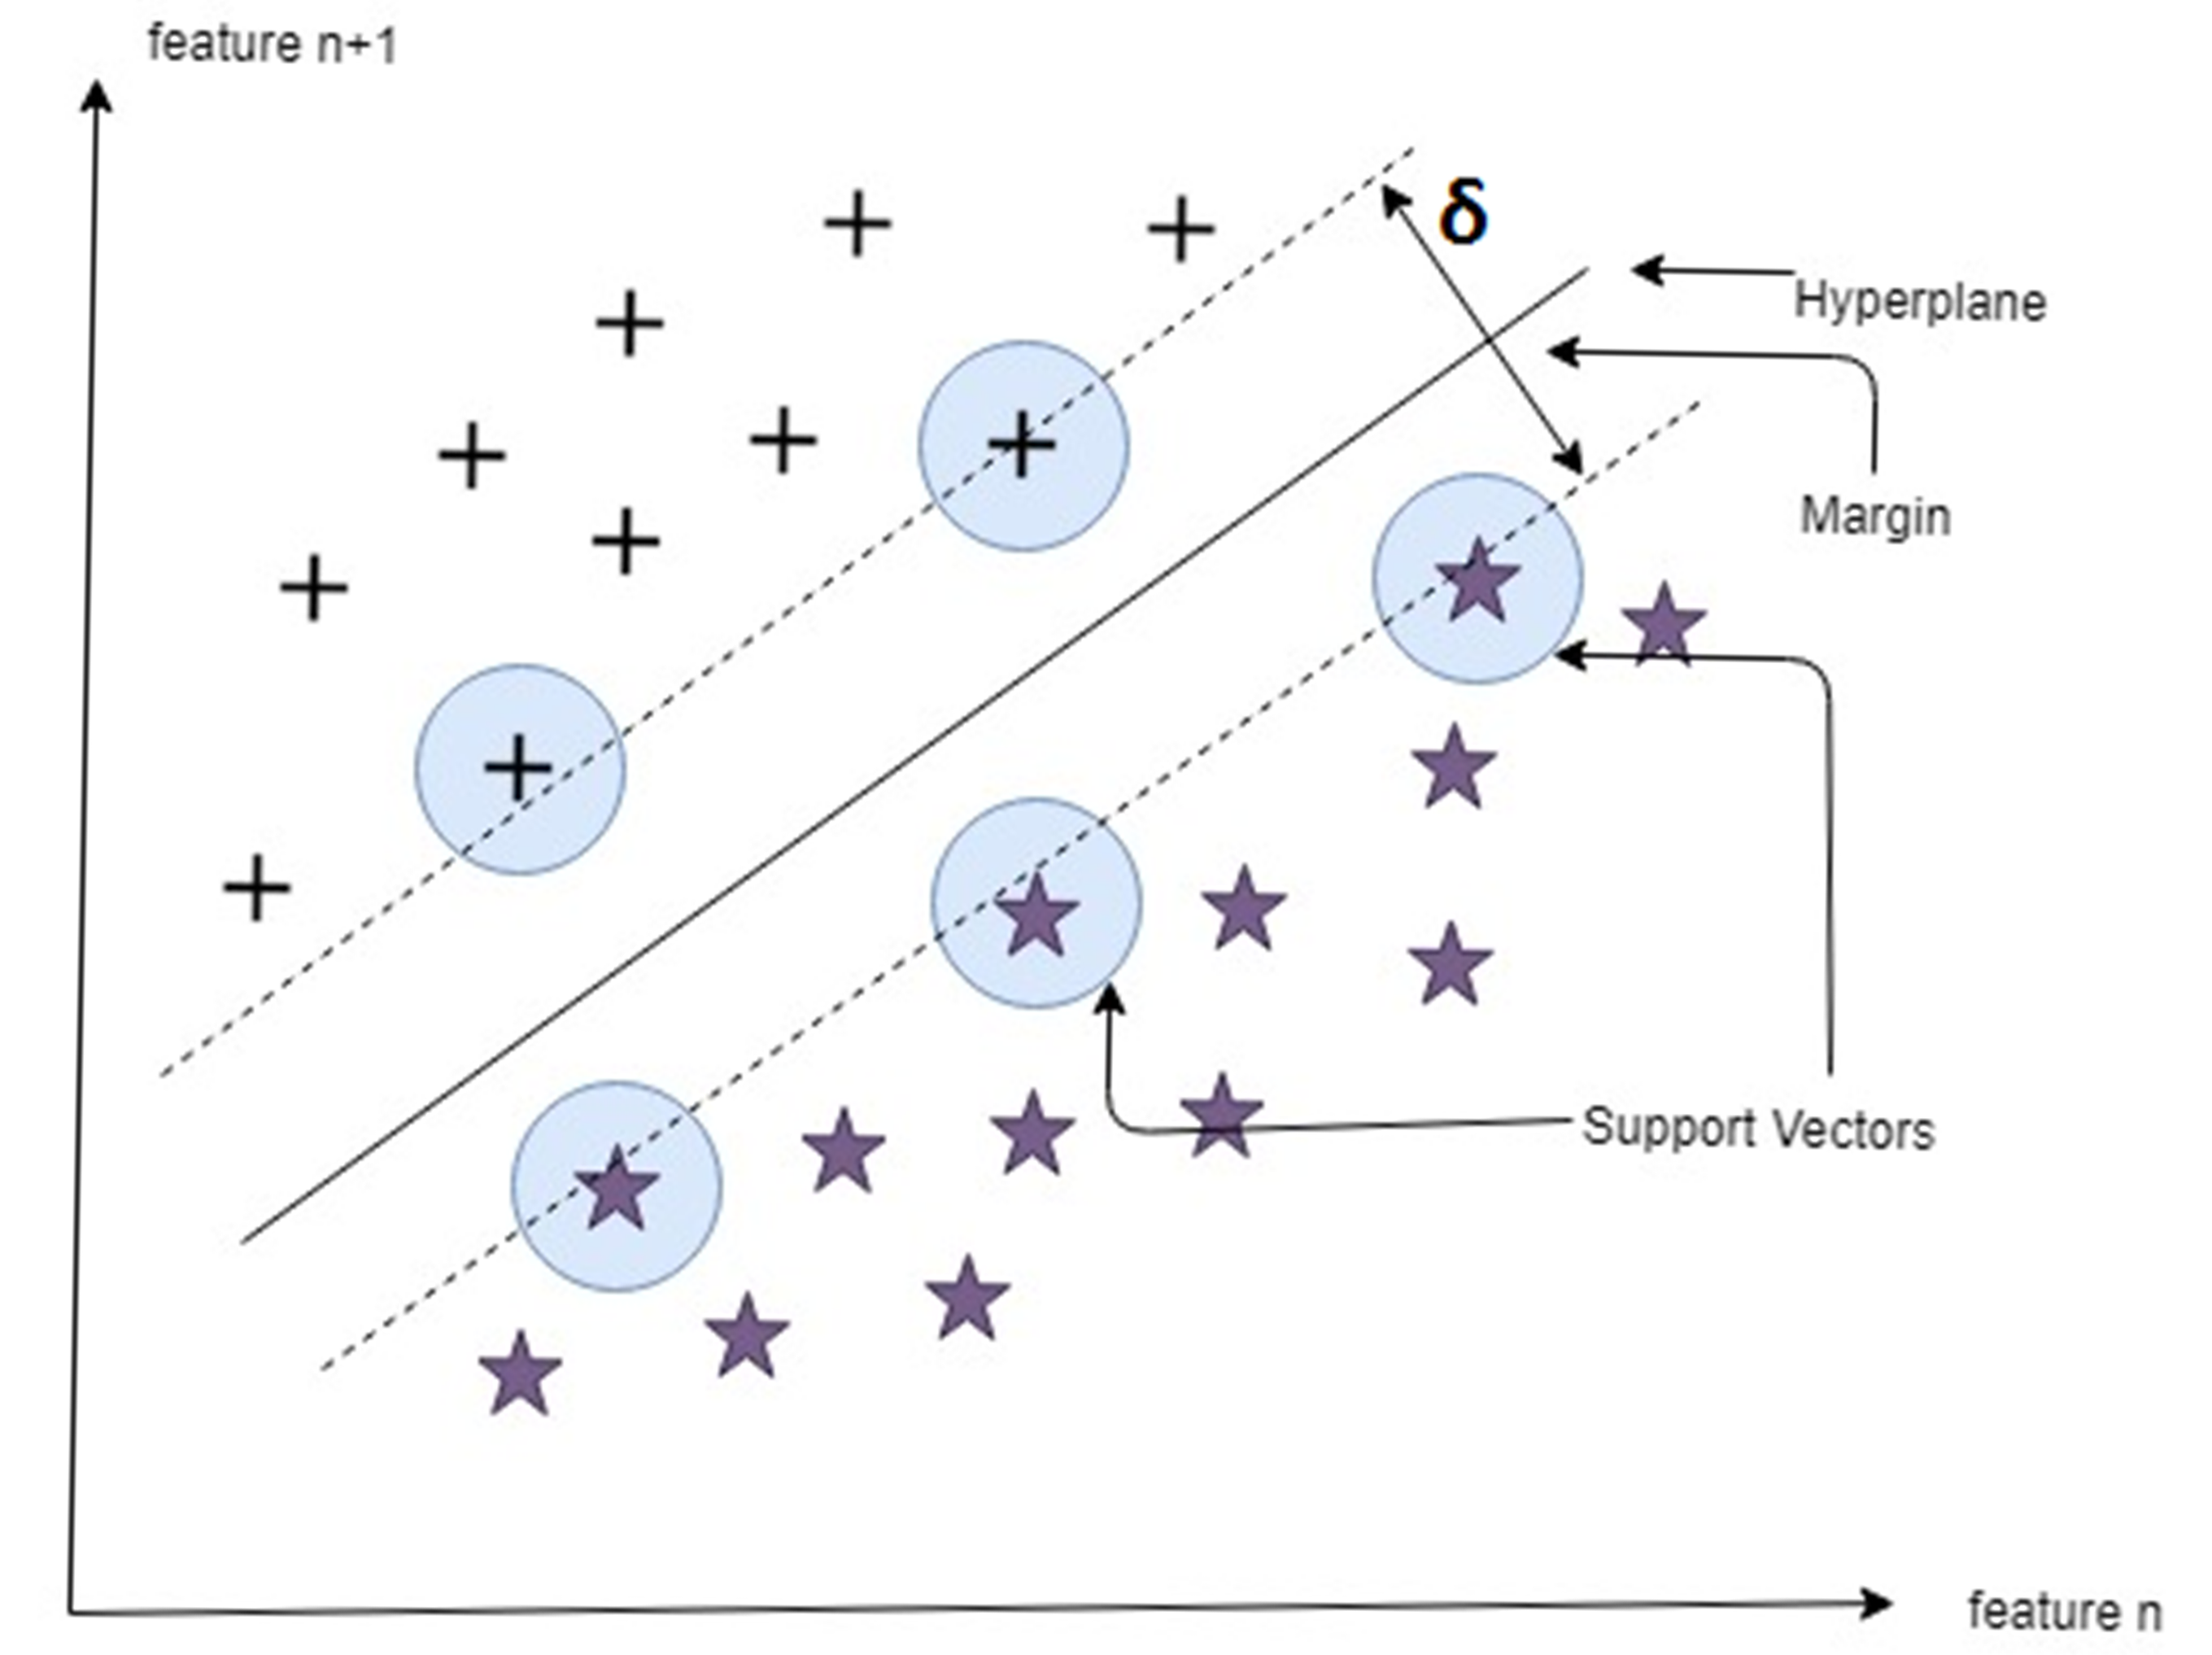
1.5. Support Vector Machine
1.6. Fuzzy C-Means Clustering
1.7. Study Objectives
1.8. Outline
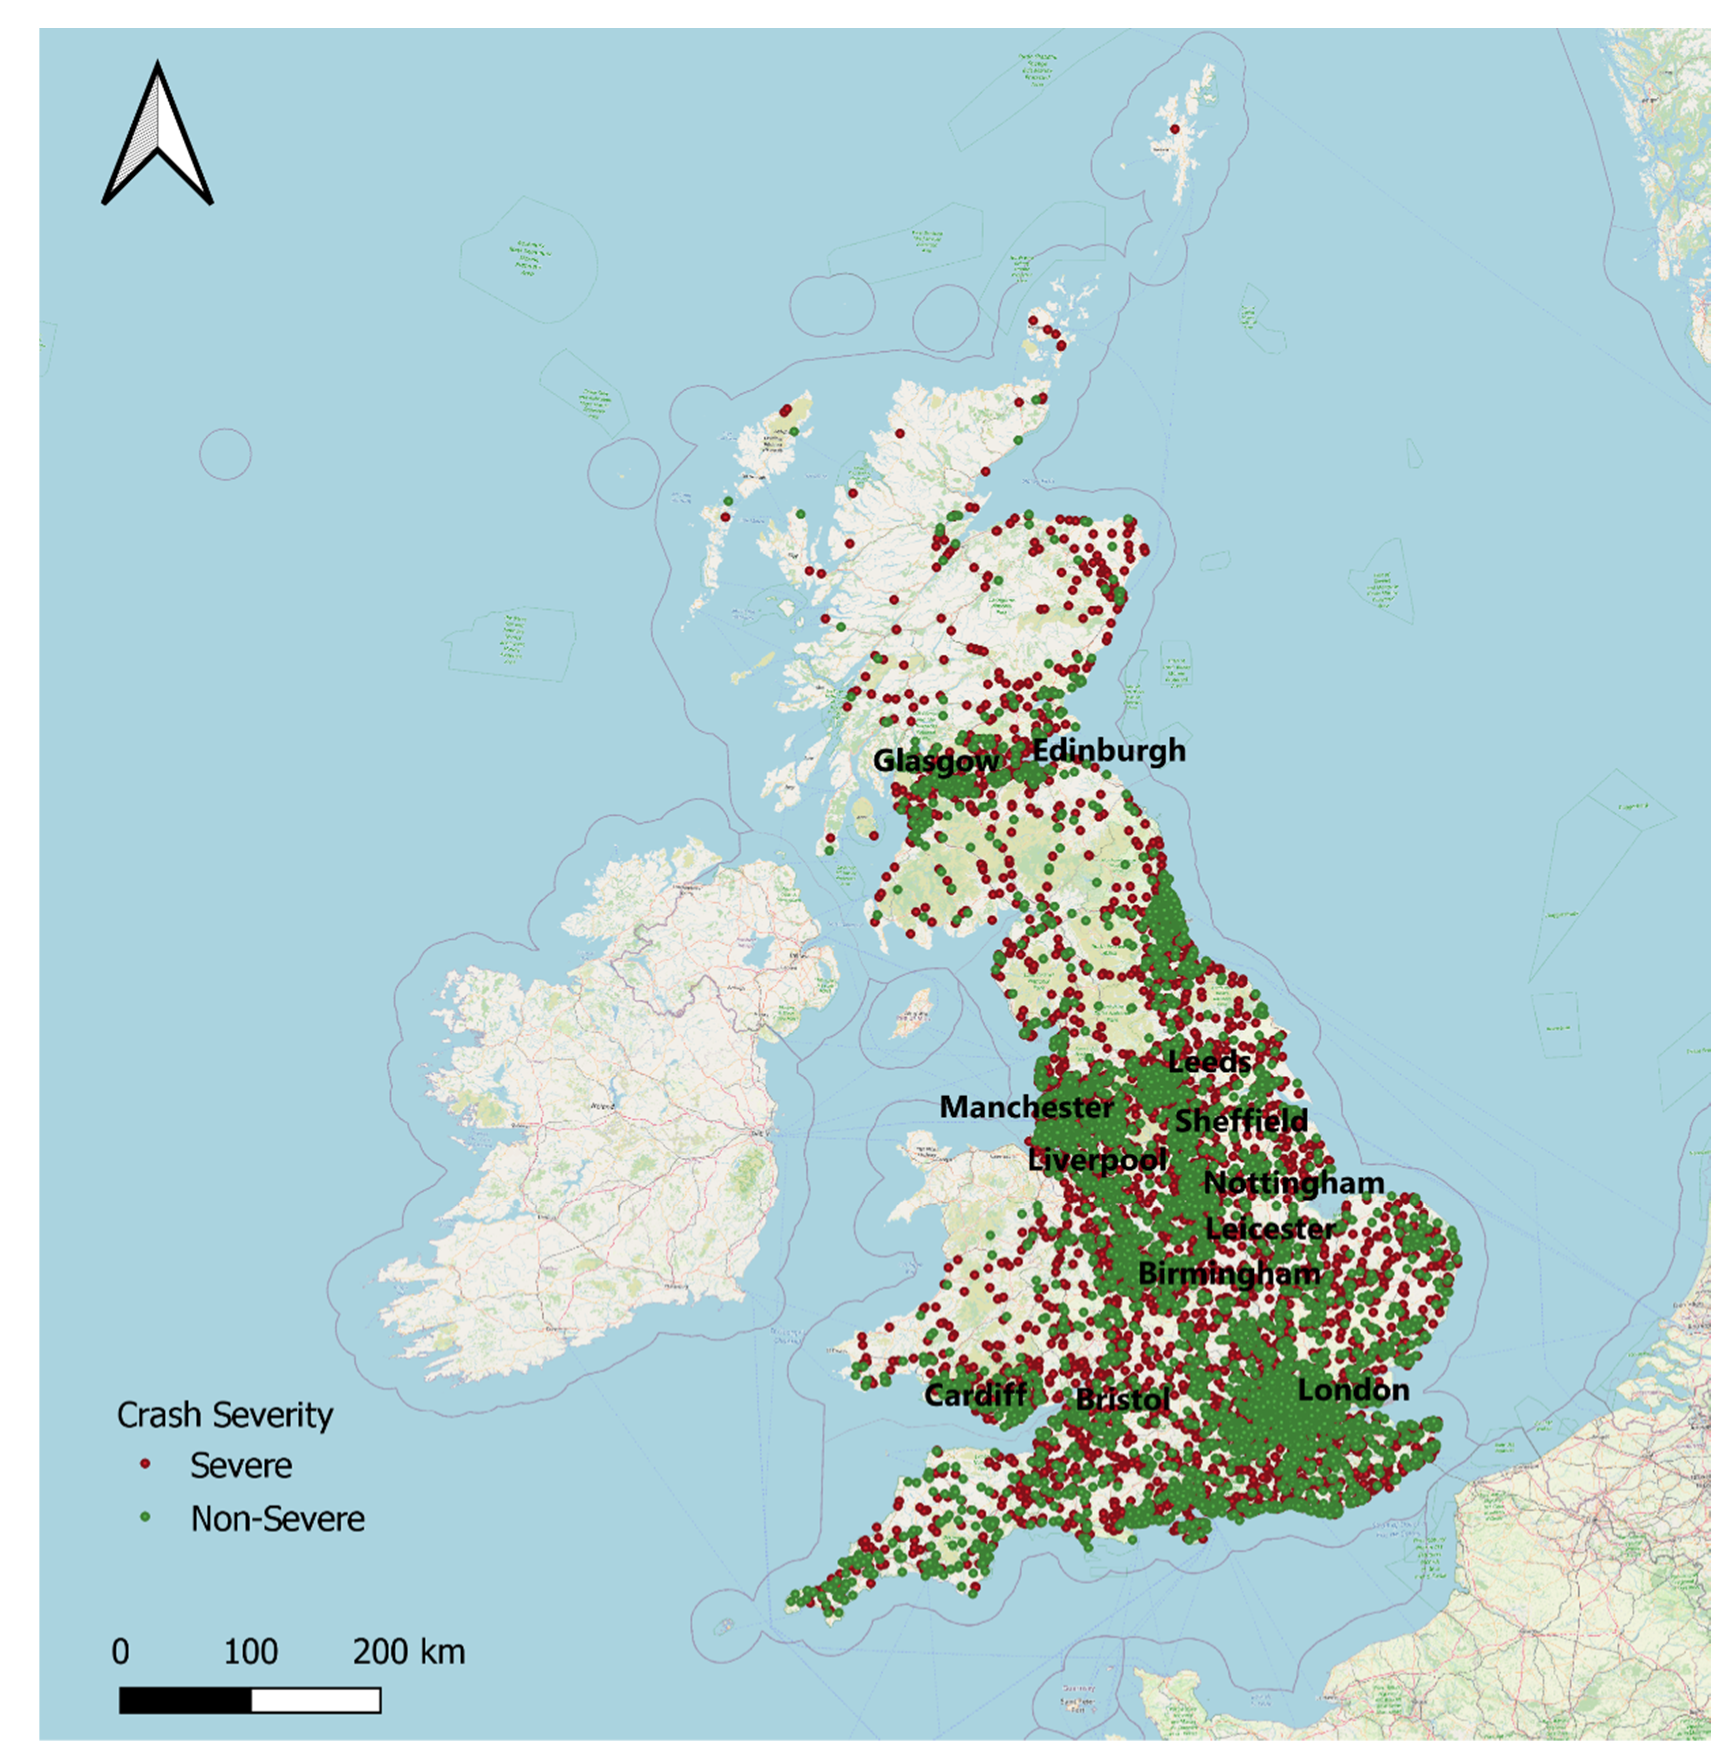
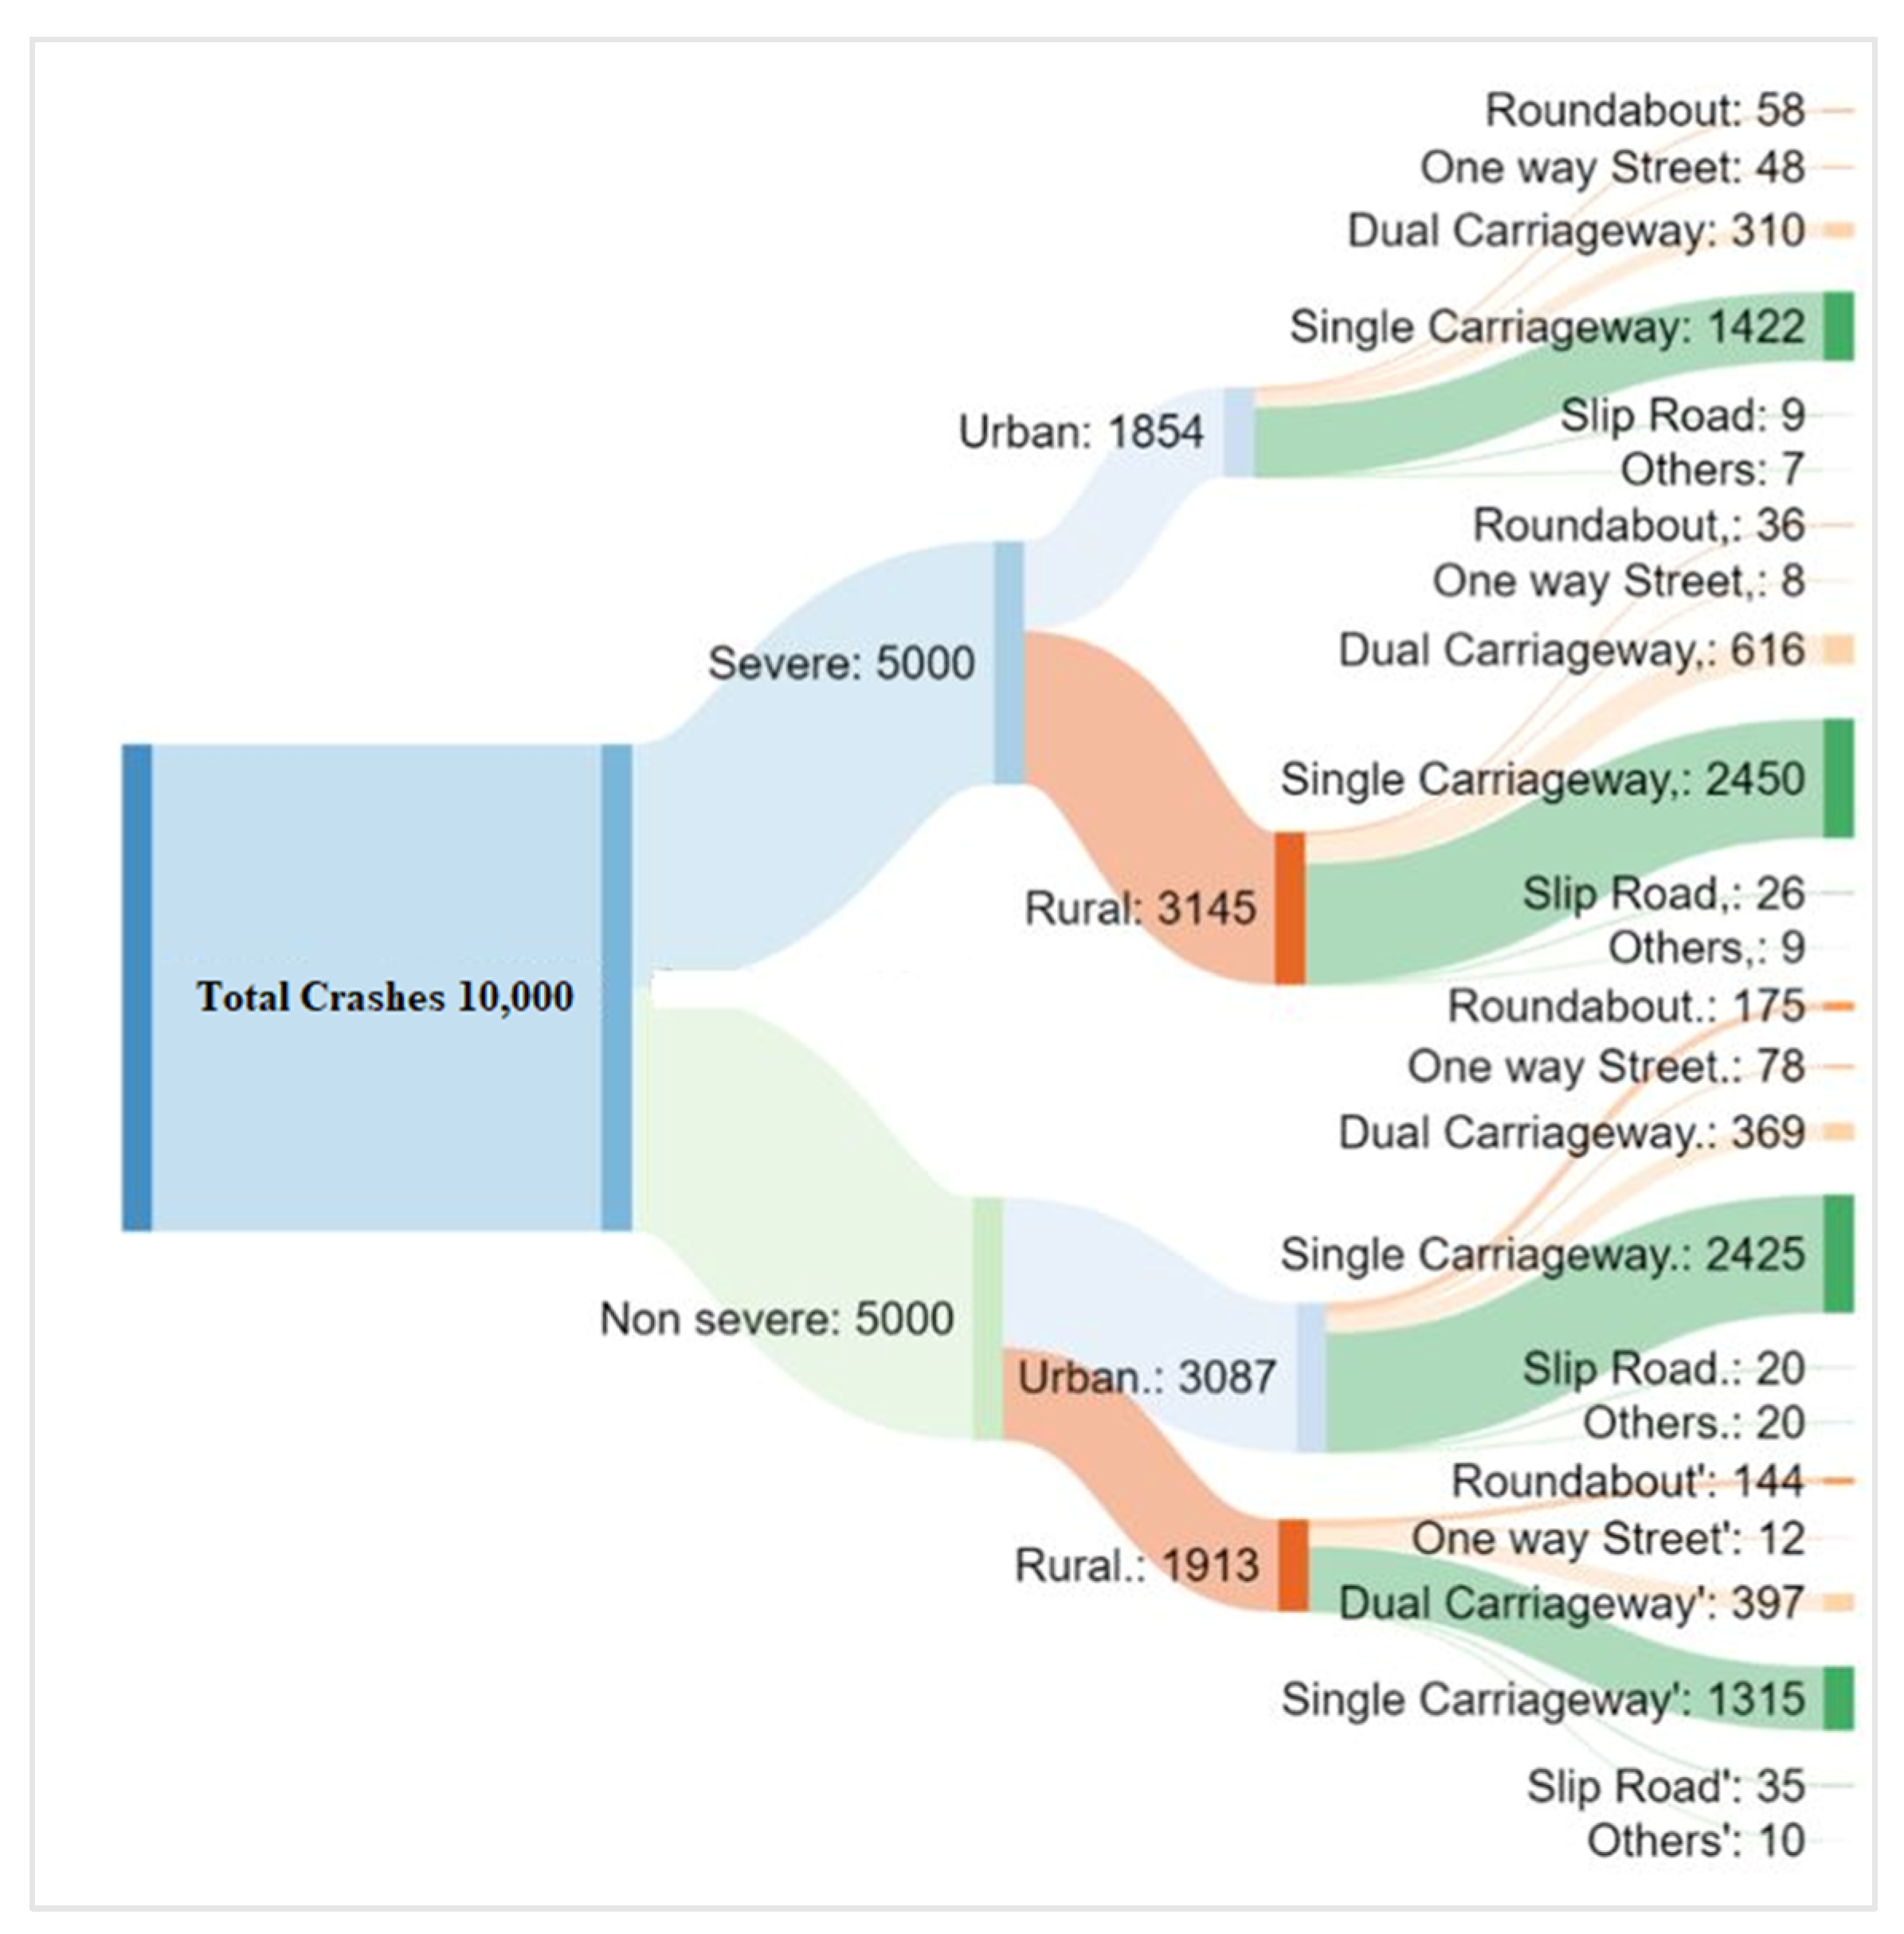
2. Data Set Description
- The injury that causes a person to be detained in hospital as an in-patient for an extended period and which may have required surgery.
- An injury that will have lasting or even permanent implications for the injured person and that will have an impact upon their ability to work or which involve a change to their level of independence.
- An injury that causes death 30 or more days after the accident.
3. Model Development
3.1. Feedforward Neural Networks
3.2. Support Vector Machine
3.3. FCM-Based FNN and SVM
4. Results and Discussion
5. Conclusions
Limitations and Future Study
Author Contributions
Funding
Acknowledgments
Conflicts of Interest
References
- Duncan, C.S.; Khattak, A.J.; Council, F.M. Applying the ordered probit model to injury severity in truck-passenger car rear-end collisions. Transp. Res. Rec. J. Transp. Res. Board 1998, 1635, 63–71. [Google Scholar] [CrossRef]
- Kockelman, K.; Kweon, Y.-J. Driver injury severity: An application of ordered probit models. Accid. Anal. Prev. 2002, 34, 313–321. [Google Scholar] [CrossRef] [Green Version]
- Siddiqui, N.A.; Chu, X.; Guttenplan, M. Crossing locations, light conditions, and pedestrian injury severity. Transp. Res. Rec. 2006, 1982, 141–149. [Google Scholar] [CrossRef]
- Yau, K.W.K.; Lo, H.; Fung, S.H. Multiple-vehicle traffic accidents in Hong Kong. Accid. Anal. Prev. 2006, 38, 1157–1161. [Google Scholar] [CrossRef]
- Zajac, S.S.; Ivan, J. Factors influencing injury severity of motor vehicle-crossing pedestrian crashes in rural Connecticut. Accid. Anal. Prev. 2003, 35, 369–379. [Google Scholar] [CrossRef]
- O’Donnell, C.; Connor, D. Predicting the severity of motor vehicle accident injuries using models of ordered multiple choice. Accid. Anal. Prev. 1996, 28, 739–753. [Google Scholar] [CrossRef]
- Khorashadi, A.; Niemeier, D.; Shankar, V.; Mannering, F.L. Differences in rural and urban driver-injury severities in accidents involving large-trucks: An exploratory analysis. Accid. Anal. Prev. 2005, 37, 910–921. [Google Scholar] [CrossRef] [PubMed]
- Savolainen, P.; Mannering, F.L. Probabilistic models of motorcyclists’ injury severities in single- and multi-vehicle crashes. Accid. Anal. Prev. 2007, 39, 955–963. [Google Scholar] [CrossRef] [PubMed]
- Al-Ghamdi, A.S. Using logistic regression to estimate the influence of accident factors on accident severity. Accid. Anal. Prev. 2002, 34, 729–741. [Google Scholar] [CrossRef]
- Delen, D.; Sharda, R.; Bessonov, M. Identifying significant predictors of injury severity in traffic accidents using a series of artificial neural networks. Accid. Anal. Prev. 2006, 38, 434–444. [Google Scholar] [CrossRef]
- Mussone, L.; Ferrari, A.; Oneta, M. An analysis of urban collisions using an artificial intelligence model. Accid. Anal. Prev. 1999, 31, 705–718. [Google Scholar] [CrossRef]
- Li, Z.-B.; Liu, Z.H.; Wang, W.; Xu, C. Using support vector machine models for crash injury severity analysis. Accid. Anal. Prev. 2012, 45, 478–486. [Google Scholar] [CrossRef] [PubMed]
- De Oña, J.; Mujalli, R.O.; Calvo-Poyo, F. Analysis of traffic accident injury severity on Spanish rural highways using Bayesian networks. Accid. Anal. Prev. 2011, 43, 402–411. [Google Scholar] [CrossRef] [PubMed]
- Simoncic, M. A Bayesian network model of two-car accidents. J. Transp. Statistics 2004, 7, 13–25. [Google Scholar]
- Karlaftis, M.G.; Golias, I. Effects of road geometry and traffic volumes on rural roadway accident rates. Accid. Anal. Prev. 2002, 34, 357–365. [Google Scholar] [CrossRef]
- Sohn, S.Y.; Shin, H. Pattern recognition for road traffic accident severity in Korea. Ergonomics 2001, 44, 107–117. [Google Scholar] [CrossRef]
- Abdelwahab, H.T.; Abdel-Aty, M.A. Development of artificial neural network models to predict driver injury severity in traffic accidents at signalized intersections. Transp. Res. Rec. J. Transp. Res. Board 2001, 1746, 6–13. [Google Scholar] [CrossRef]
- Kashani, A.T.; Shariat-Mohaymany, A. Analysis of the traffic injury severity on two-lane, two-way rural roads based on classification tree models. Saf. Sci. 2011, 49, 1314–1320. [Google Scholar] [CrossRef]
- Mujalli, R.O.; de Oña, J. Injury severity models for motor vehicle accidents: A review. Proc. Inst. Civ. Eng. Transp. 2013, 166, 255–270. [Google Scholar] [CrossRef]
- Fan, W.D.; Gong, L.; Washing, E.M.; Yu, M.; Haile, E. Identifying and quantifying factors affecting vehicle crash severity at highway-rail grade crossings: Models and their comparison. In Proceedings of the Transportation Research Board 95th Annual Meeting, Washington, DC, USA, 10–14 January 2016. [Google Scholar]
- Shibata, A.; Fukuda, K. Risk factors of fatality in motor vehicle traffic accidents. Accid. Anal. Prev. 1994, 26, 391–397. [Google Scholar] [CrossRef]
- Malyshkina, N.V.; Mannering, F.L. Empirical assessment of the impact of highway design exceptions on the frequency and severity of vehicle accidents. Accid. Anal. Prev. 2010, 42, 131–139. [Google Scholar] [CrossRef] [Green Version]
- Shankar, V.; Mannering, F.L.; Barfield, W. Statistical analysis of accident severity on rural freeways. Accid. Anal. Prev. 1996, 28, 391–401. [Google Scholar] [CrossRef]
- Huang, H.; Chin, H.C.; Haque, M. Severity of driver injury and vehicle damage in traffic crashes at intersections: A Bayesian hierarchical analysis. Accid. Anal. Prev. 2008, 40, 45–54. [Google Scholar] [CrossRef] [PubMed]
- Khattak, A.J.; Kantor, P.; Council, F.M. Role of adverse weather in key crash types on limited-access: Roadways implications for advanced weather systems. Transp. Res. Rec. J. Transp. Res. Board 1998, 1621, 10–19. [Google Scholar] [CrossRef]
- Abdel-Aty, M. Analysis of driver injury severity levels at multiple locations using ordered probit models. J. Saf. Res. 2003, 34, 597–603. [Google Scholar] [CrossRef]
- Zhu, X.; Srinivasan, S. Modeling occupant-level injury severity: An application to large-truck crashes. Accid. Anal. Prev. 2011, 43, 1427–1437. [Google Scholar] [CrossRef]
- Yasmin, S.; Eluru, N. Evaluating alternate discrete outcome frameworks for modeling crash injury severity. Accid. Anal. Prev. 2013, 59, 506–521. [Google Scholar] [CrossRef]
- Lee, J.; Mannering, F.L. Impact of roadside features on the frequency and severity of run-off-roadway accidents: An empirical analysis. Accid. Anal. Prev. 2002, 34, 149–161. [Google Scholar] [CrossRef]
- Christoforou, Z.; Cohen, S.; Karlaftis, M.G. Vehicle occupant injury severity on highways: An empirical investigation. Accid. Anal. Prev. 2010, 42, 1606–1620. [Google Scholar] [CrossRef]
- Eluru, N.; Bhat, C.R. A joint econometric analysis of seat belt use and crash-related injury severity. Accid. Anal. Prev. 2007, 39, 1037–1049. [Google Scholar] [CrossRef] [Green Version]
- Garrido, R.; Bastos, A.; de Almeida, A.M.; Elvas, J.P. Prediction of road accident severity using the ordered probit model. Transp. Res. Procedia 2014, 3, 214–223. [Google Scholar] [CrossRef] [Green Version]
- Chen, S.; Zhang, S.; Xing, Y.; Lu, J. Identifying the factors contributing to the severity of truck-involved crashes in Shanghai river-crossing tunnel. Int. J. Environ. Res. Public Heal. 2020, 17, 3155. [Google Scholar] [CrossRef] [PubMed]
- Hu, S.-R.; Li, C.-S.; Lee, C.-K. Investigation of key factors for accident severity at railroad grade crossings by using a logit model. Saf. Sci. 2010, 48, 186–194. [Google Scholar] [CrossRef] [PubMed] [Green Version]
- Zong, F.; Xu, H.; Zhang, H. Prediction for traffic accident severity: Comparing the bayesian network and regression models. Math. Probl. Eng. 2013, 2013, 1–9. [Google Scholar] [CrossRef]
- Ratanavaraha, V.; Suangka, S. Impacts of accident severity factors and loss values of crashes on expressways in Thailand. IATSS Res. 2014, 37, 130–136. [Google Scholar] [CrossRef] [Green Version]
- Wang, Y.; Zhang, W. Analysis of roadway and environmental factors affecting traffic crash severities. Transp. Res. Procedia 2017, 25, 2119–2125. [Google Scholar] [CrossRef]
- Sameen, M.; Pradhan, B. Severity prediction of traffic accidents with recurrent neural networks. Appl. Sci. 2017, 7, 476. [Google Scholar] [CrossRef] [Green Version]
- Abdel-Aty, M.; Abdelwahab, H.T. Predicting injury severity levels in traffic crashes: A modeling comparison. J. Transp. Eng. 2004, 130, 204–210. [Google Scholar] [CrossRef]
- Alkheder, S.; Taamneh, M.; Taamneh, S. Severity prediction of traffic accident using an artificial neural network. J. Forecast. 2016, 36, 100–108. [Google Scholar] [CrossRef]
- Delen, D.; Tomak, L.; Topuz, K.; Eryarsoy, E. Investigating injury severity risk factors in automobile crashes with predictive analytics and sensitivity analysis methods. J. Transp. Heal. 2017, 4, 118–131. [Google Scholar] [CrossRef]
- Hashmienejad, S.H.-A.; Hasheminejad, S.M.H. Traffic accident severity prediction using a novel multi-objective genetic algorithm. Int. J. Crashworthiness 2017, 22, 1–16. [Google Scholar] [CrossRef]
- Zhang, J.; Li, Z.; Pu, Z.; Xu, C. Comparing prediction performance for crash injury severity among various machine learning and statistical methods. IEEE Access 2018, 6, 60079–60087. [Google Scholar] [CrossRef]
- Kunt, M.M.; Aghayan, I.; Noii, N. Prediction for traffic accident severity: Comparing the artificial neural network, genetic algorithm, combined genetic algorithm and pattern search methods. Transport 2012, 26, 353–366. [Google Scholar] [CrossRef] [Green Version]
- Li, Y.; Ma, D.; Zhu, M.; Zeng, Z.; Wang, Y. Identification of significant factors in fatal-injury highway crashes using genetic algorithm and neural network. Accid. Anal. Prev. 2018, 111, 354–363. [Google Scholar] [CrossRef] [PubMed]
- Zheng, M.; Li, T.; Zhu, R.; Chen, J.; Ma, Z.; Tang, M.; Cui, Z.; Wang, Z. Traffic accident’s severity prediction: A deep-learning approach-based CNN network. IEEE Access 2019, 7, 39897–39910. [Google Scholar] [CrossRef]
- Hippert, H.S.; Pedeira, C.E.; Souza, R.C. Neural networks for short-term load forecasting: A review and evaluation. IEEE Trans. Power Syst. 2001, 16, 44–55. [Google Scholar] [CrossRef]
- Cristianini, N.; Shawe-Taylor, J. An Introduction to Support Vector Machines and Other Kernel-Based Learning Methods; Cambridge University Press: Cambridge, UK, 2000. [Google Scholar]
- Mountrakis, G.; Im, J.; Ogole, C. Support vector machines in remote sensing: A review. ISPRS J. Photogramm. Remote. Sens. 2011, 66, 247–259. [Google Scholar] [CrossRef]
- N, S.R.; Deka, P.C. Support vector machine applications in the field of hydrology: A review. Appl. Soft Comput. 2014, 19, 372–386. [Google Scholar] [CrossRef]
- Dunn, J.C. A Fuzzy relative of the ISODATA process and its use in detecting compact well-separated clusters. J. Cybern. 1973, 3, 32–57. [Google Scholar] [CrossRef]
- Bezdek, J.C. Pattern Recognition with Fuzzy Objective Function Algorithms; Springer Science & Business Media: New York, NY, USA, 2013. [Google Scholar]
- Bezdek, J.C.; Ehrlich, R.; Full, W. FCM: The fuzzy c-means clustering algorithm. Comput. Geosci. 1984, 10, 191–203. [Google Scholar] [CrossRef]
- Tsao, E.C.-K.; Bezdek, J.C.; Pal, N.R. Fuzzy Kohonen clustering networks. Pattern Recognit. 1994, 27, 757–764. [Google Scholar] [CrossRef]
- Zhang, D.; Chen, S. Fuzzy clustering using kernel method. In Proceedings of the The International Conference on Control and Automation (ICCA 2002), Jeonbuk, Korea, 16–19 October 2002; Institute of Electrical and Electronics Engineers (IEEE): Nanjing, China, 2002. [Google Scholar]
- Witten, I.H.; Frank, E.; Hall, M.A.; Pal, C.J. Data Mining: Practical Machine Learning Tools and Techniques; Morgan Kaufmann: Burlington, MA, USA, 2016. [Google Scholar]
- Kecman, V.; Huang, T.-M.; Vogt, M. Iterative single data algorithm for training kernel machines from huge data sets: Theory and performance. In Support Vector Machines: Theory and Applications; Springer Science and Business Media LLC: New York, NY, USA, 2005; pp. 255–274. [Google Scholar]
- Huang, H.; Xu, H.-H.; Wang, X.; Silamu, W. Maximum F1-score discriminative training criterion for automatic mispronunciation detection. IEEE/ACM Trans. Audio Speech Lang. Process. 2015, 23, 787–797. [Google Scholar] [CrossRef]


| Input Variables | Data Type | No. of Categories |
|---|---|---|
| Vehicle attributes | ||
| Number of vehicles involved | Numeric | - |
| Vehicle type | Nominal | 12 |
| Road condition attributes | ||
| Road type | Nominal | 5 |
| Junction type | Nominal | 9 |
| Junction control | Nominal | 5 |
| Light | Nominal | 5 |
| Weather | Nominal | 9 |
| Road surface condition | Nominal | 7 |
| Area type | Nominal | 2 |
| Speed limit | Numeric | - |
| Road class | Nominal | 6 |
| Crash attributes | ||
| Number of causalities | Numeric | - |
| Day of the week | Numeric | 7 |
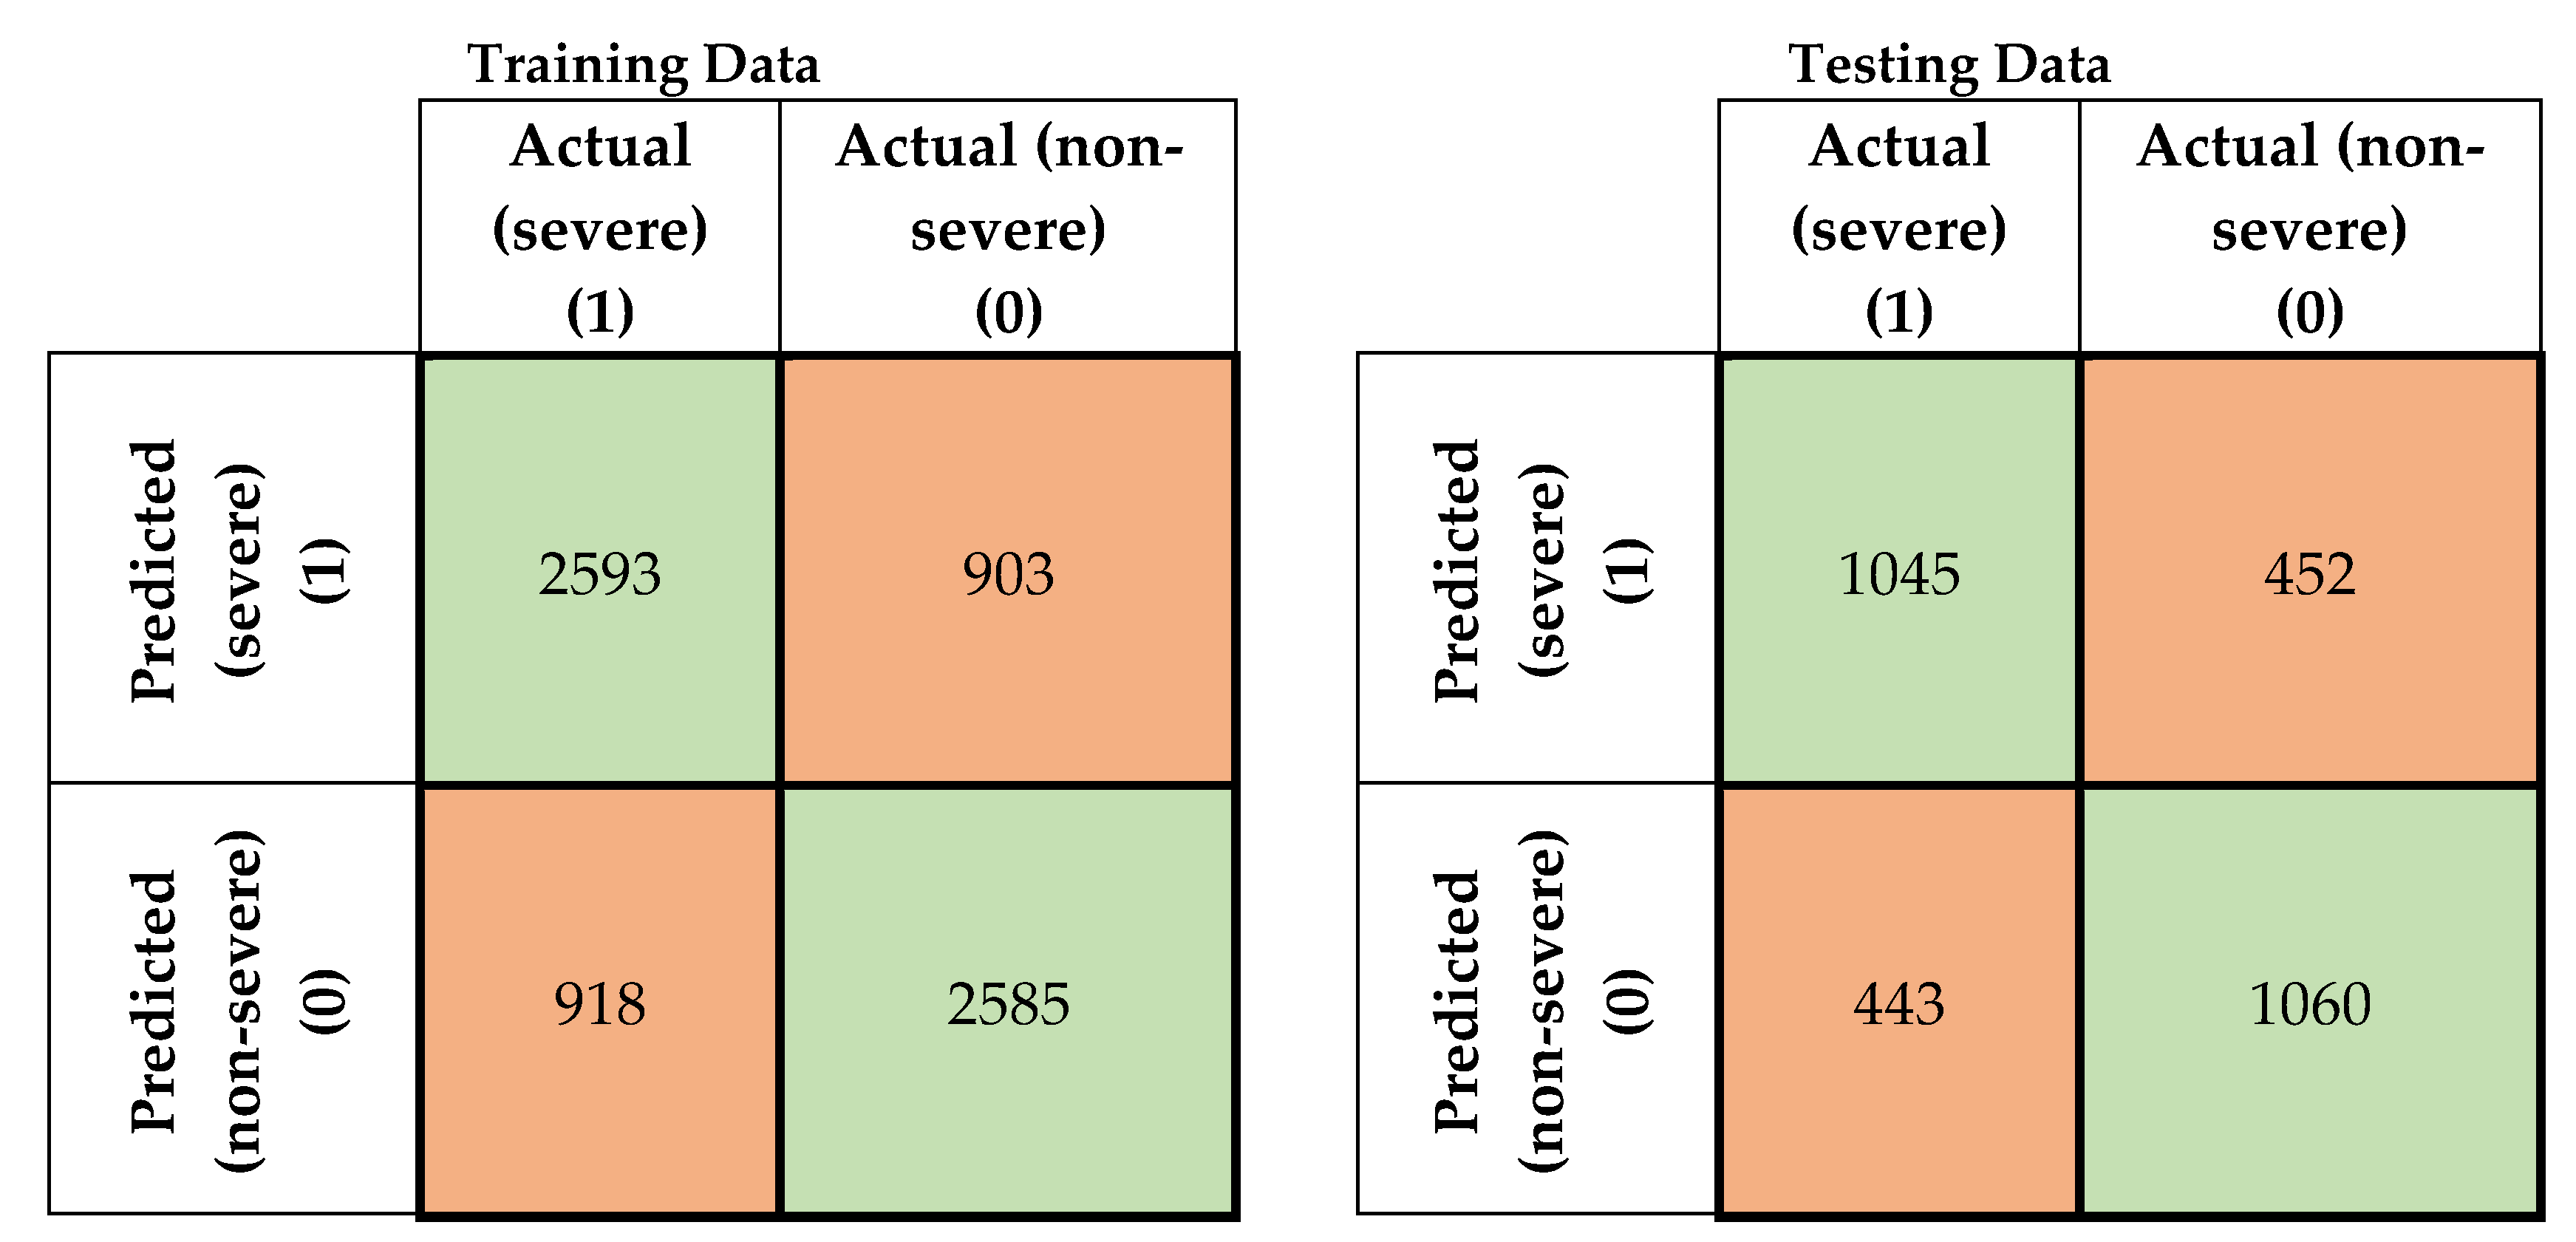
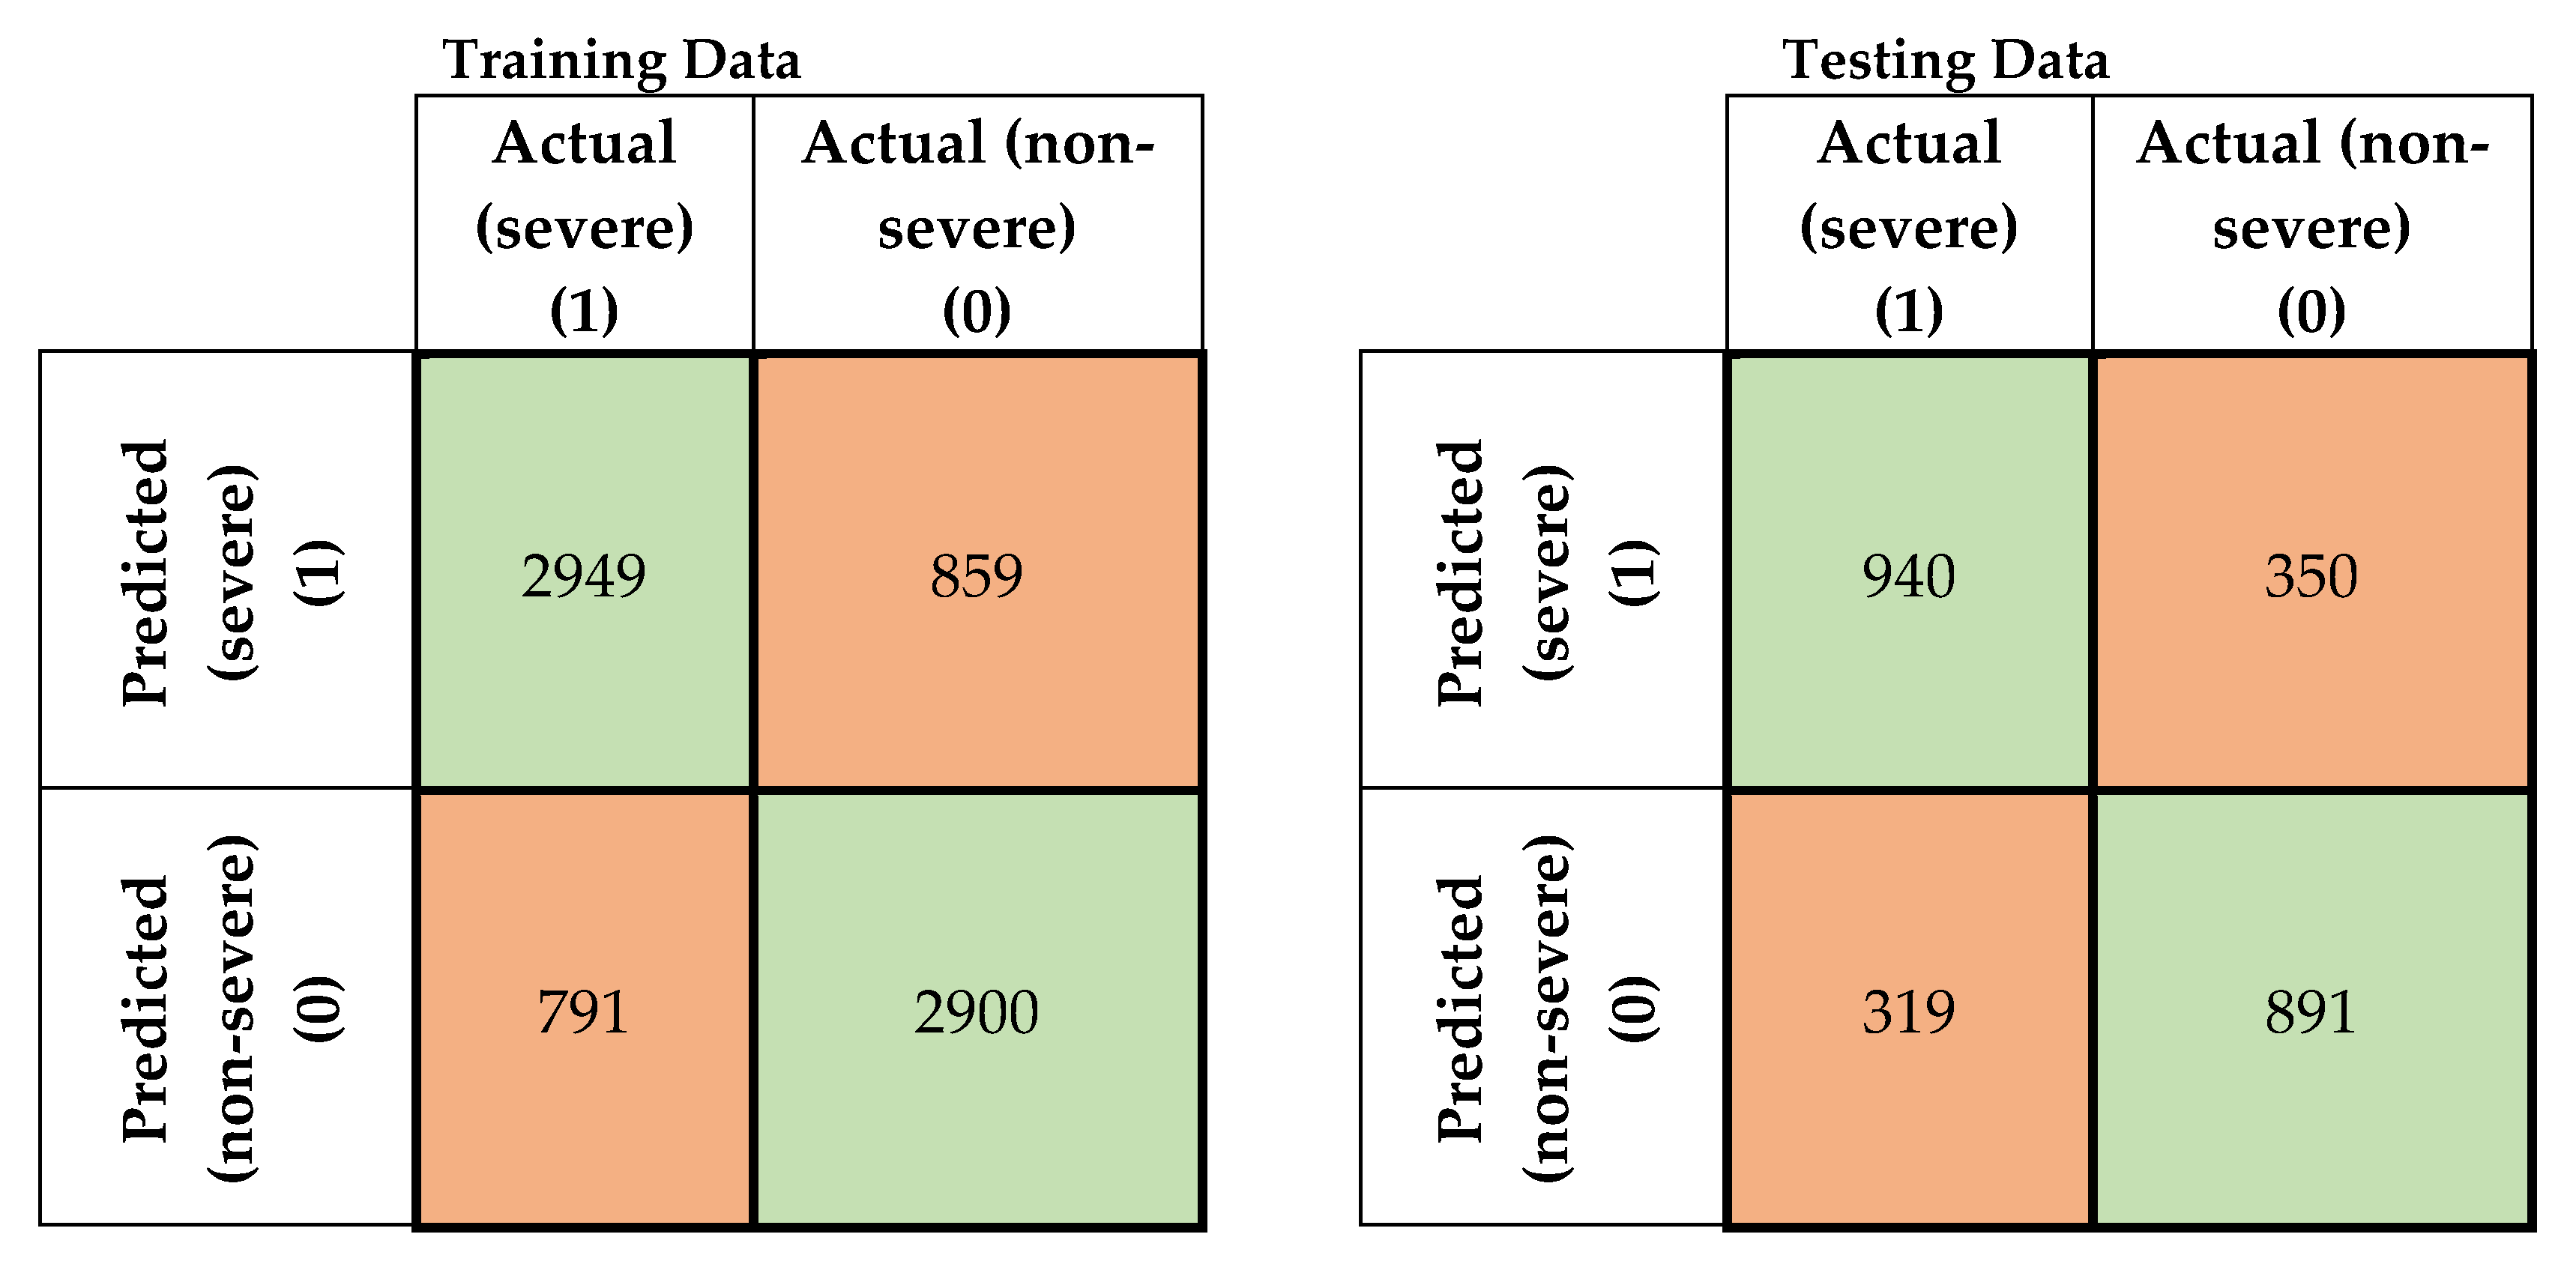
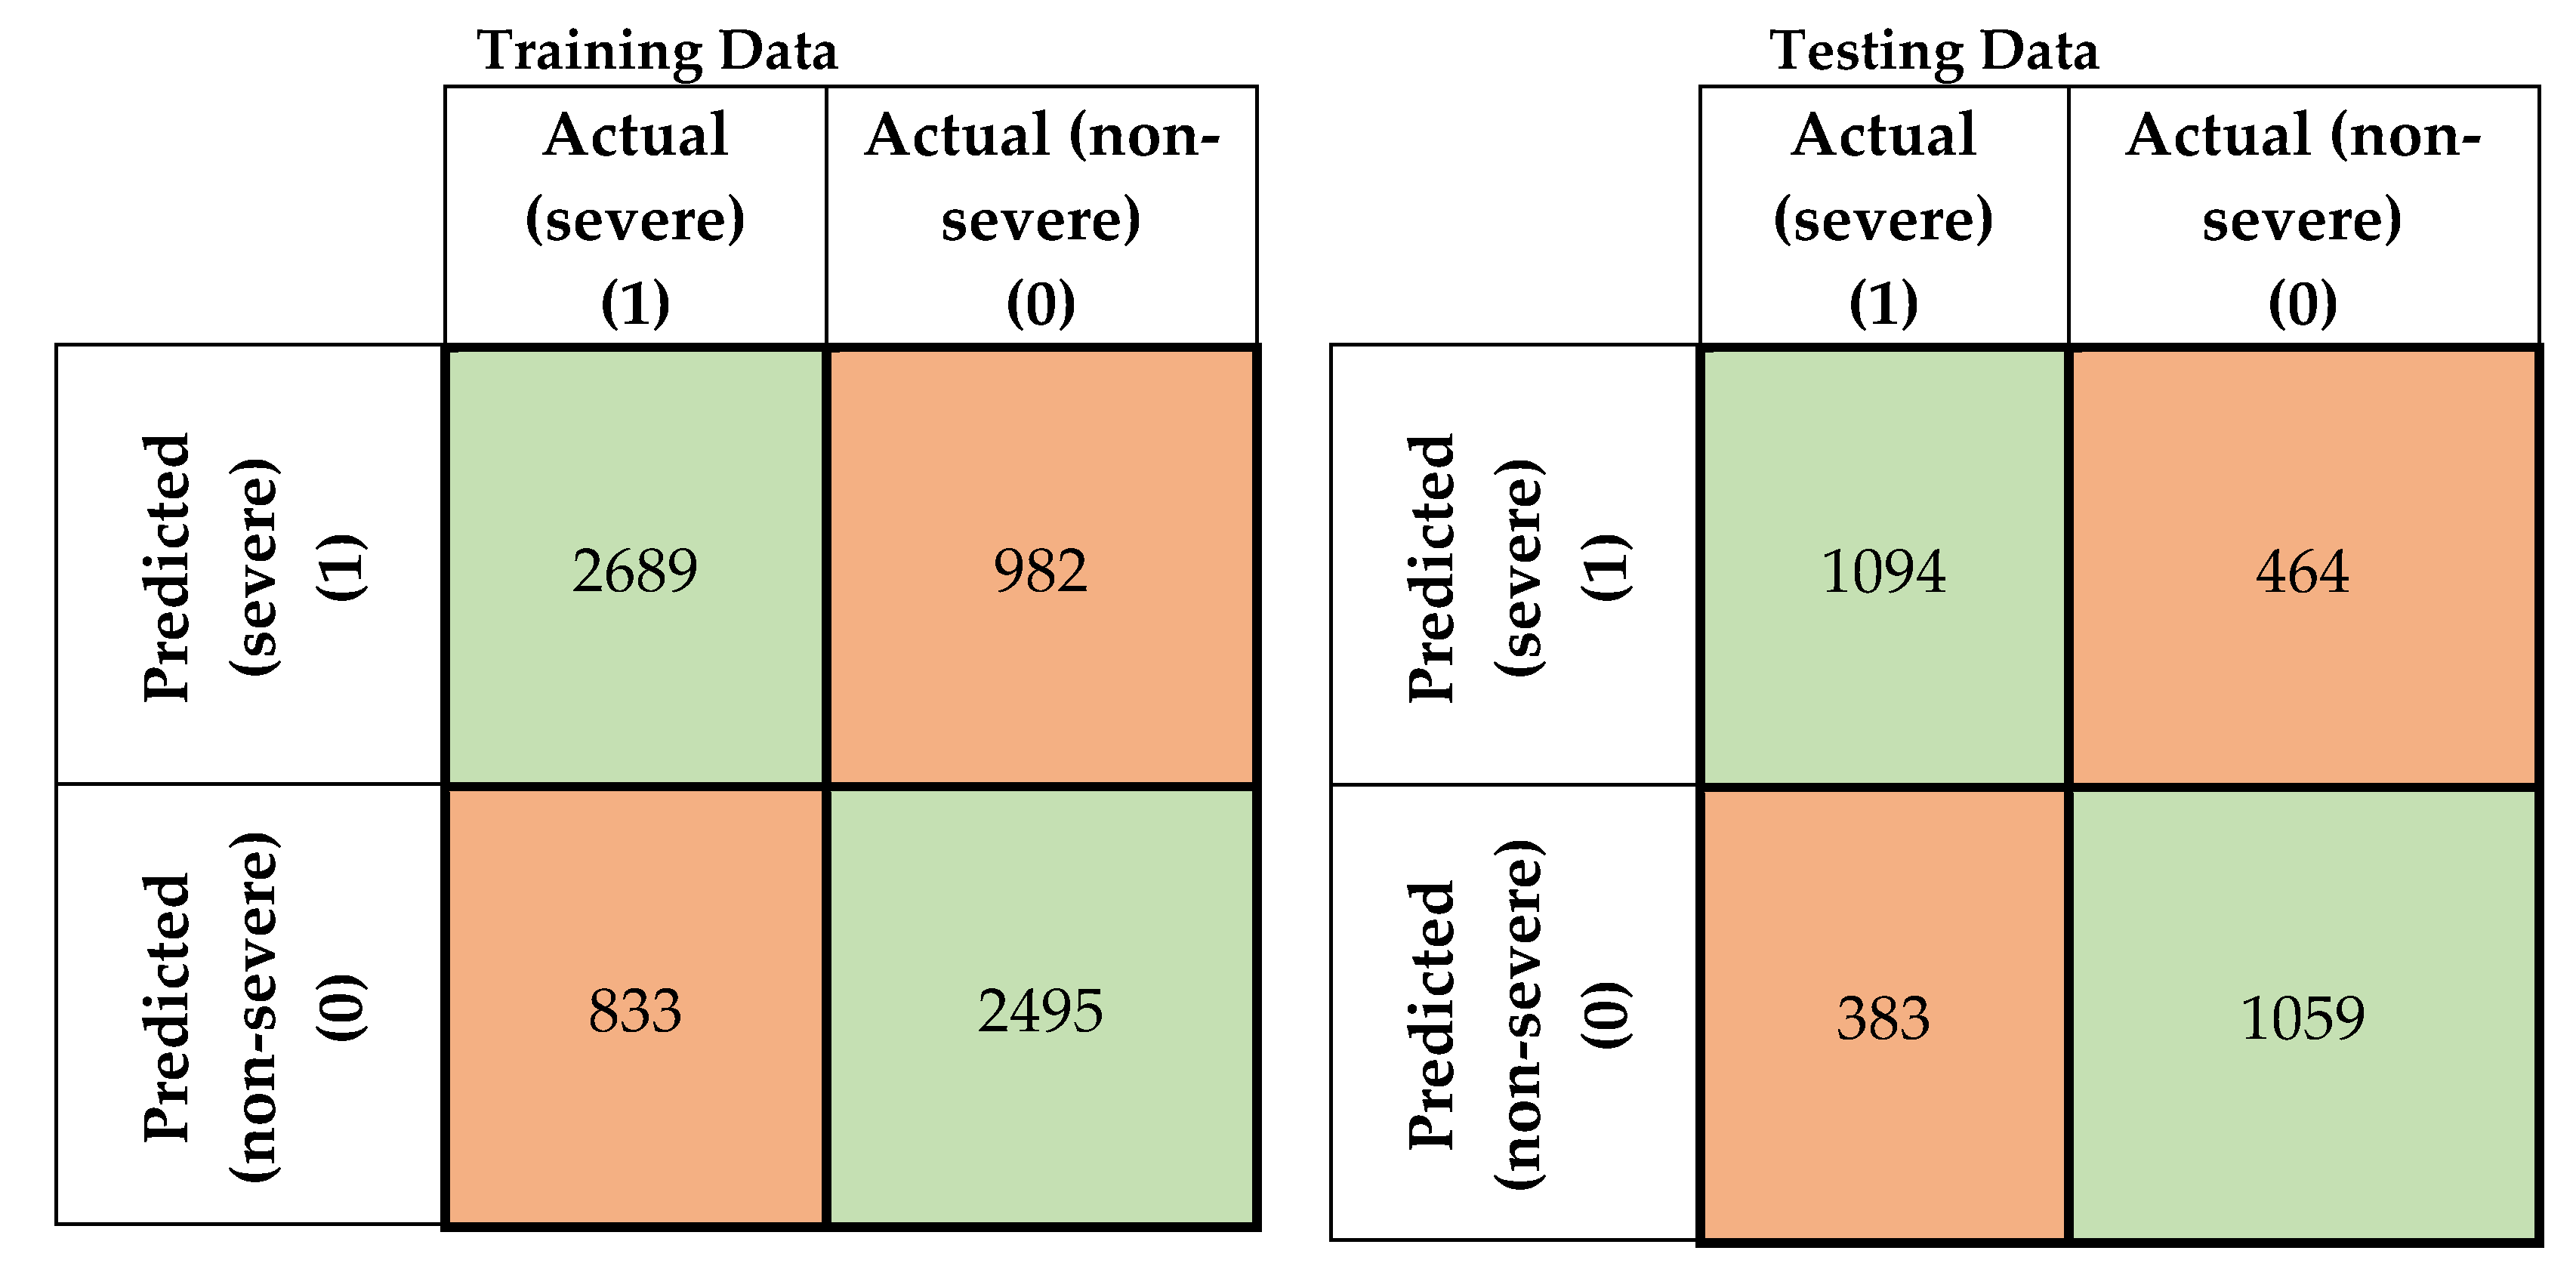
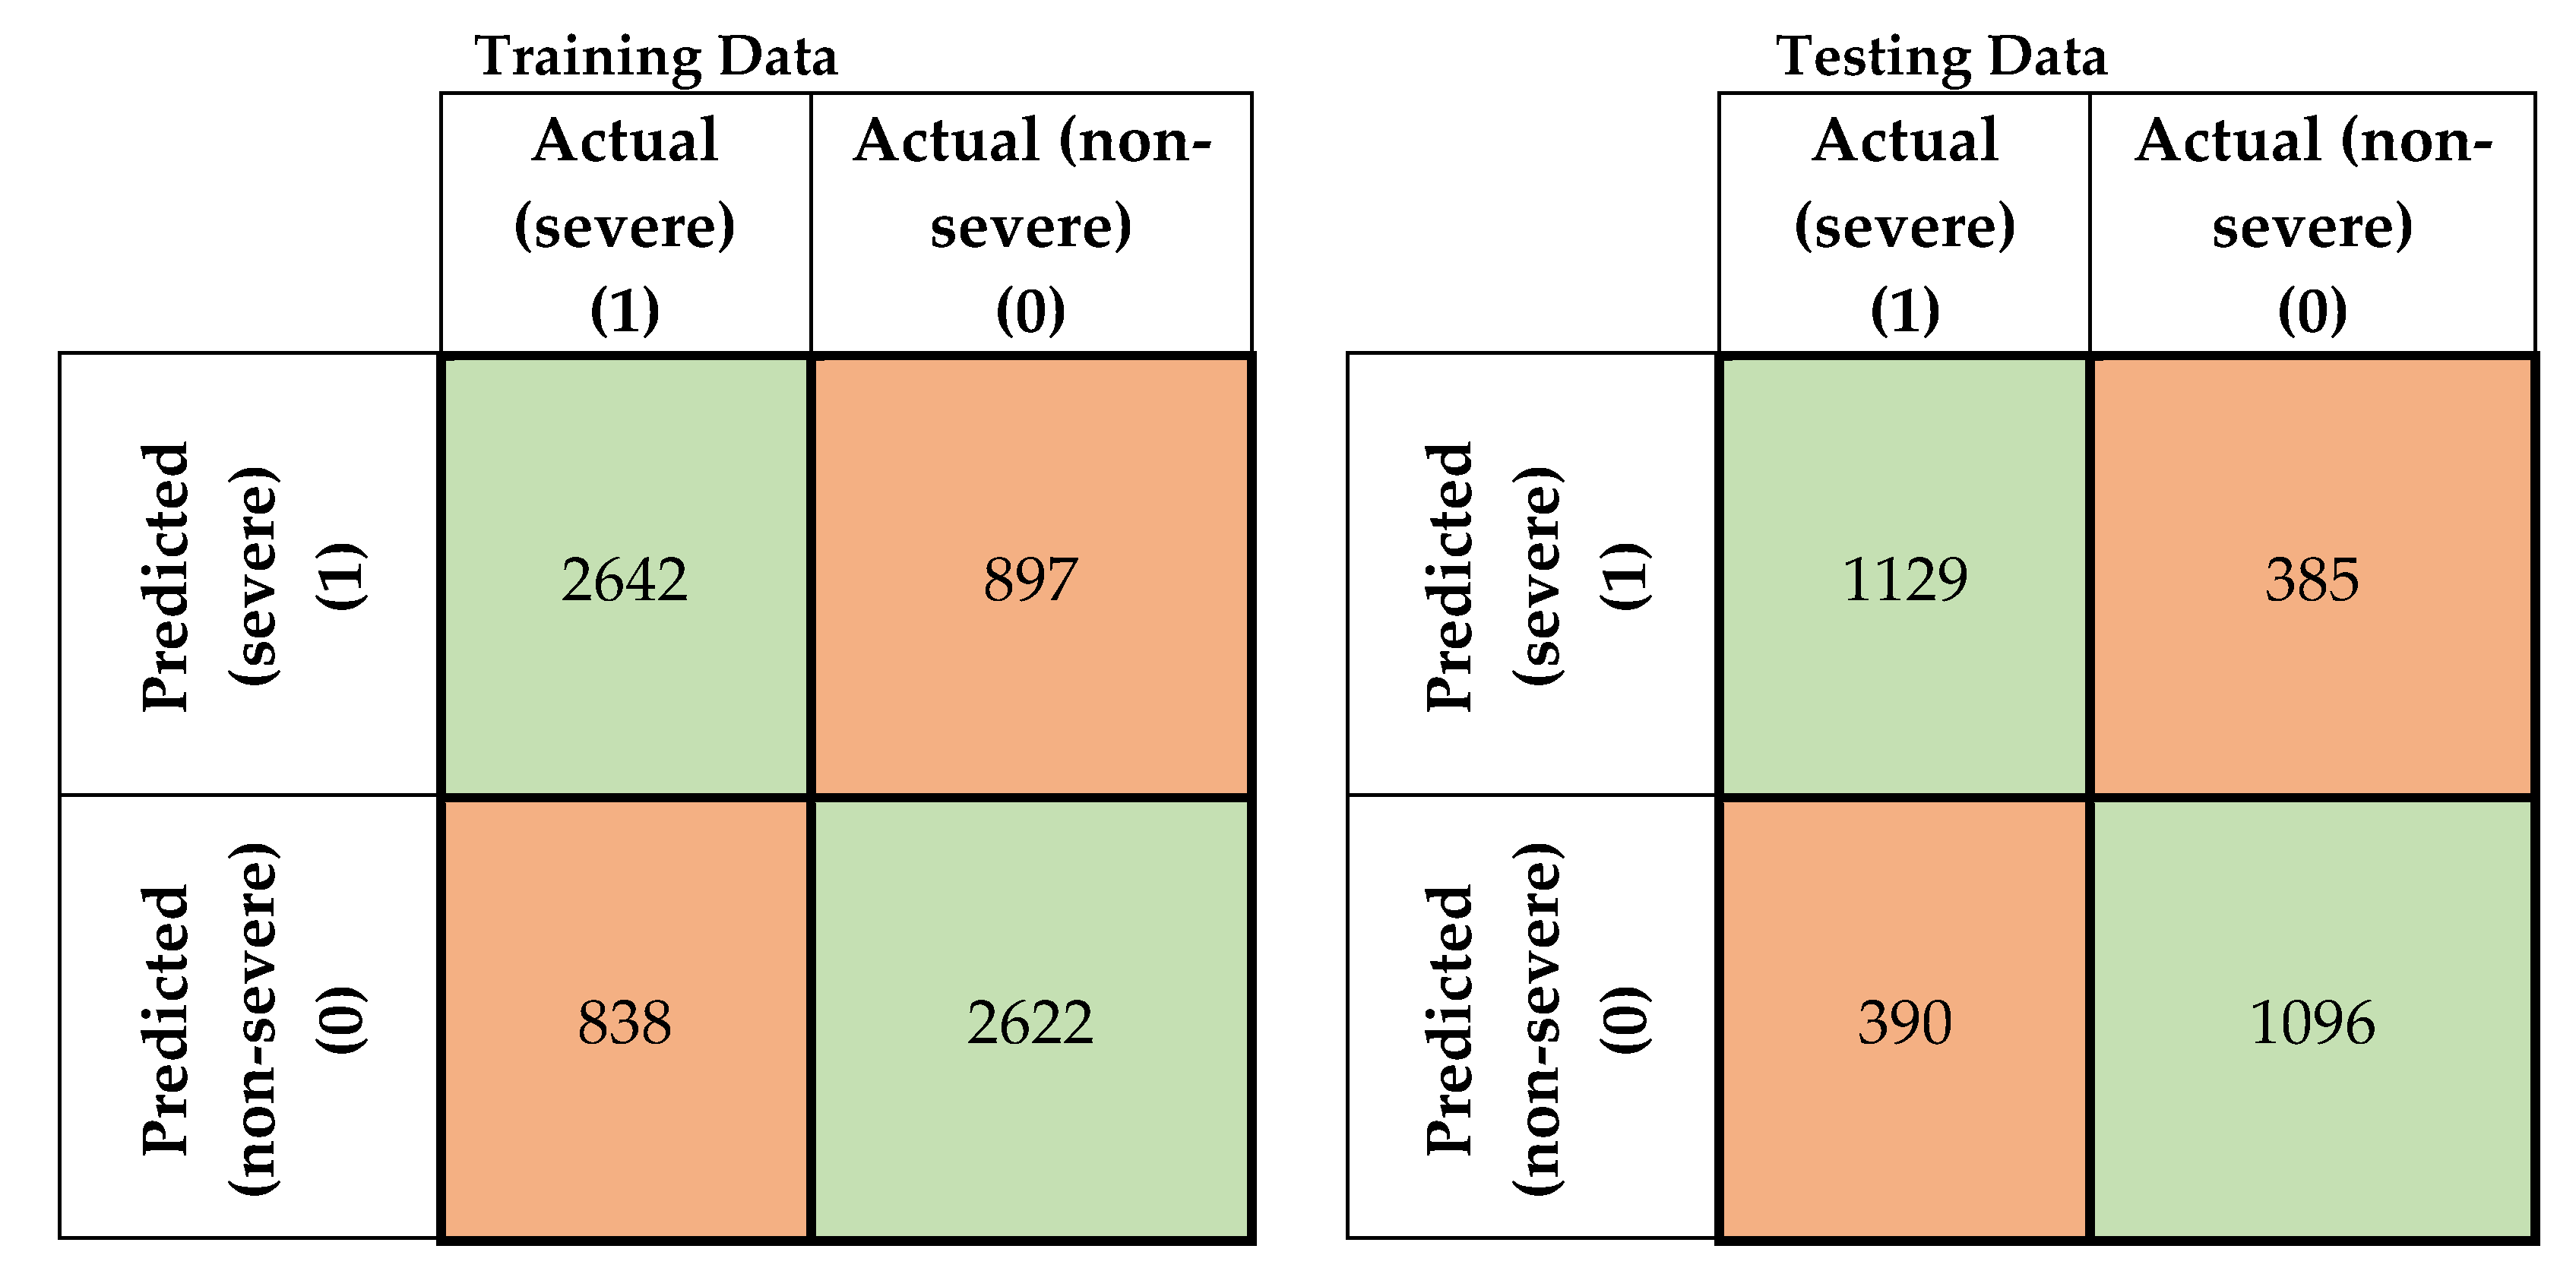
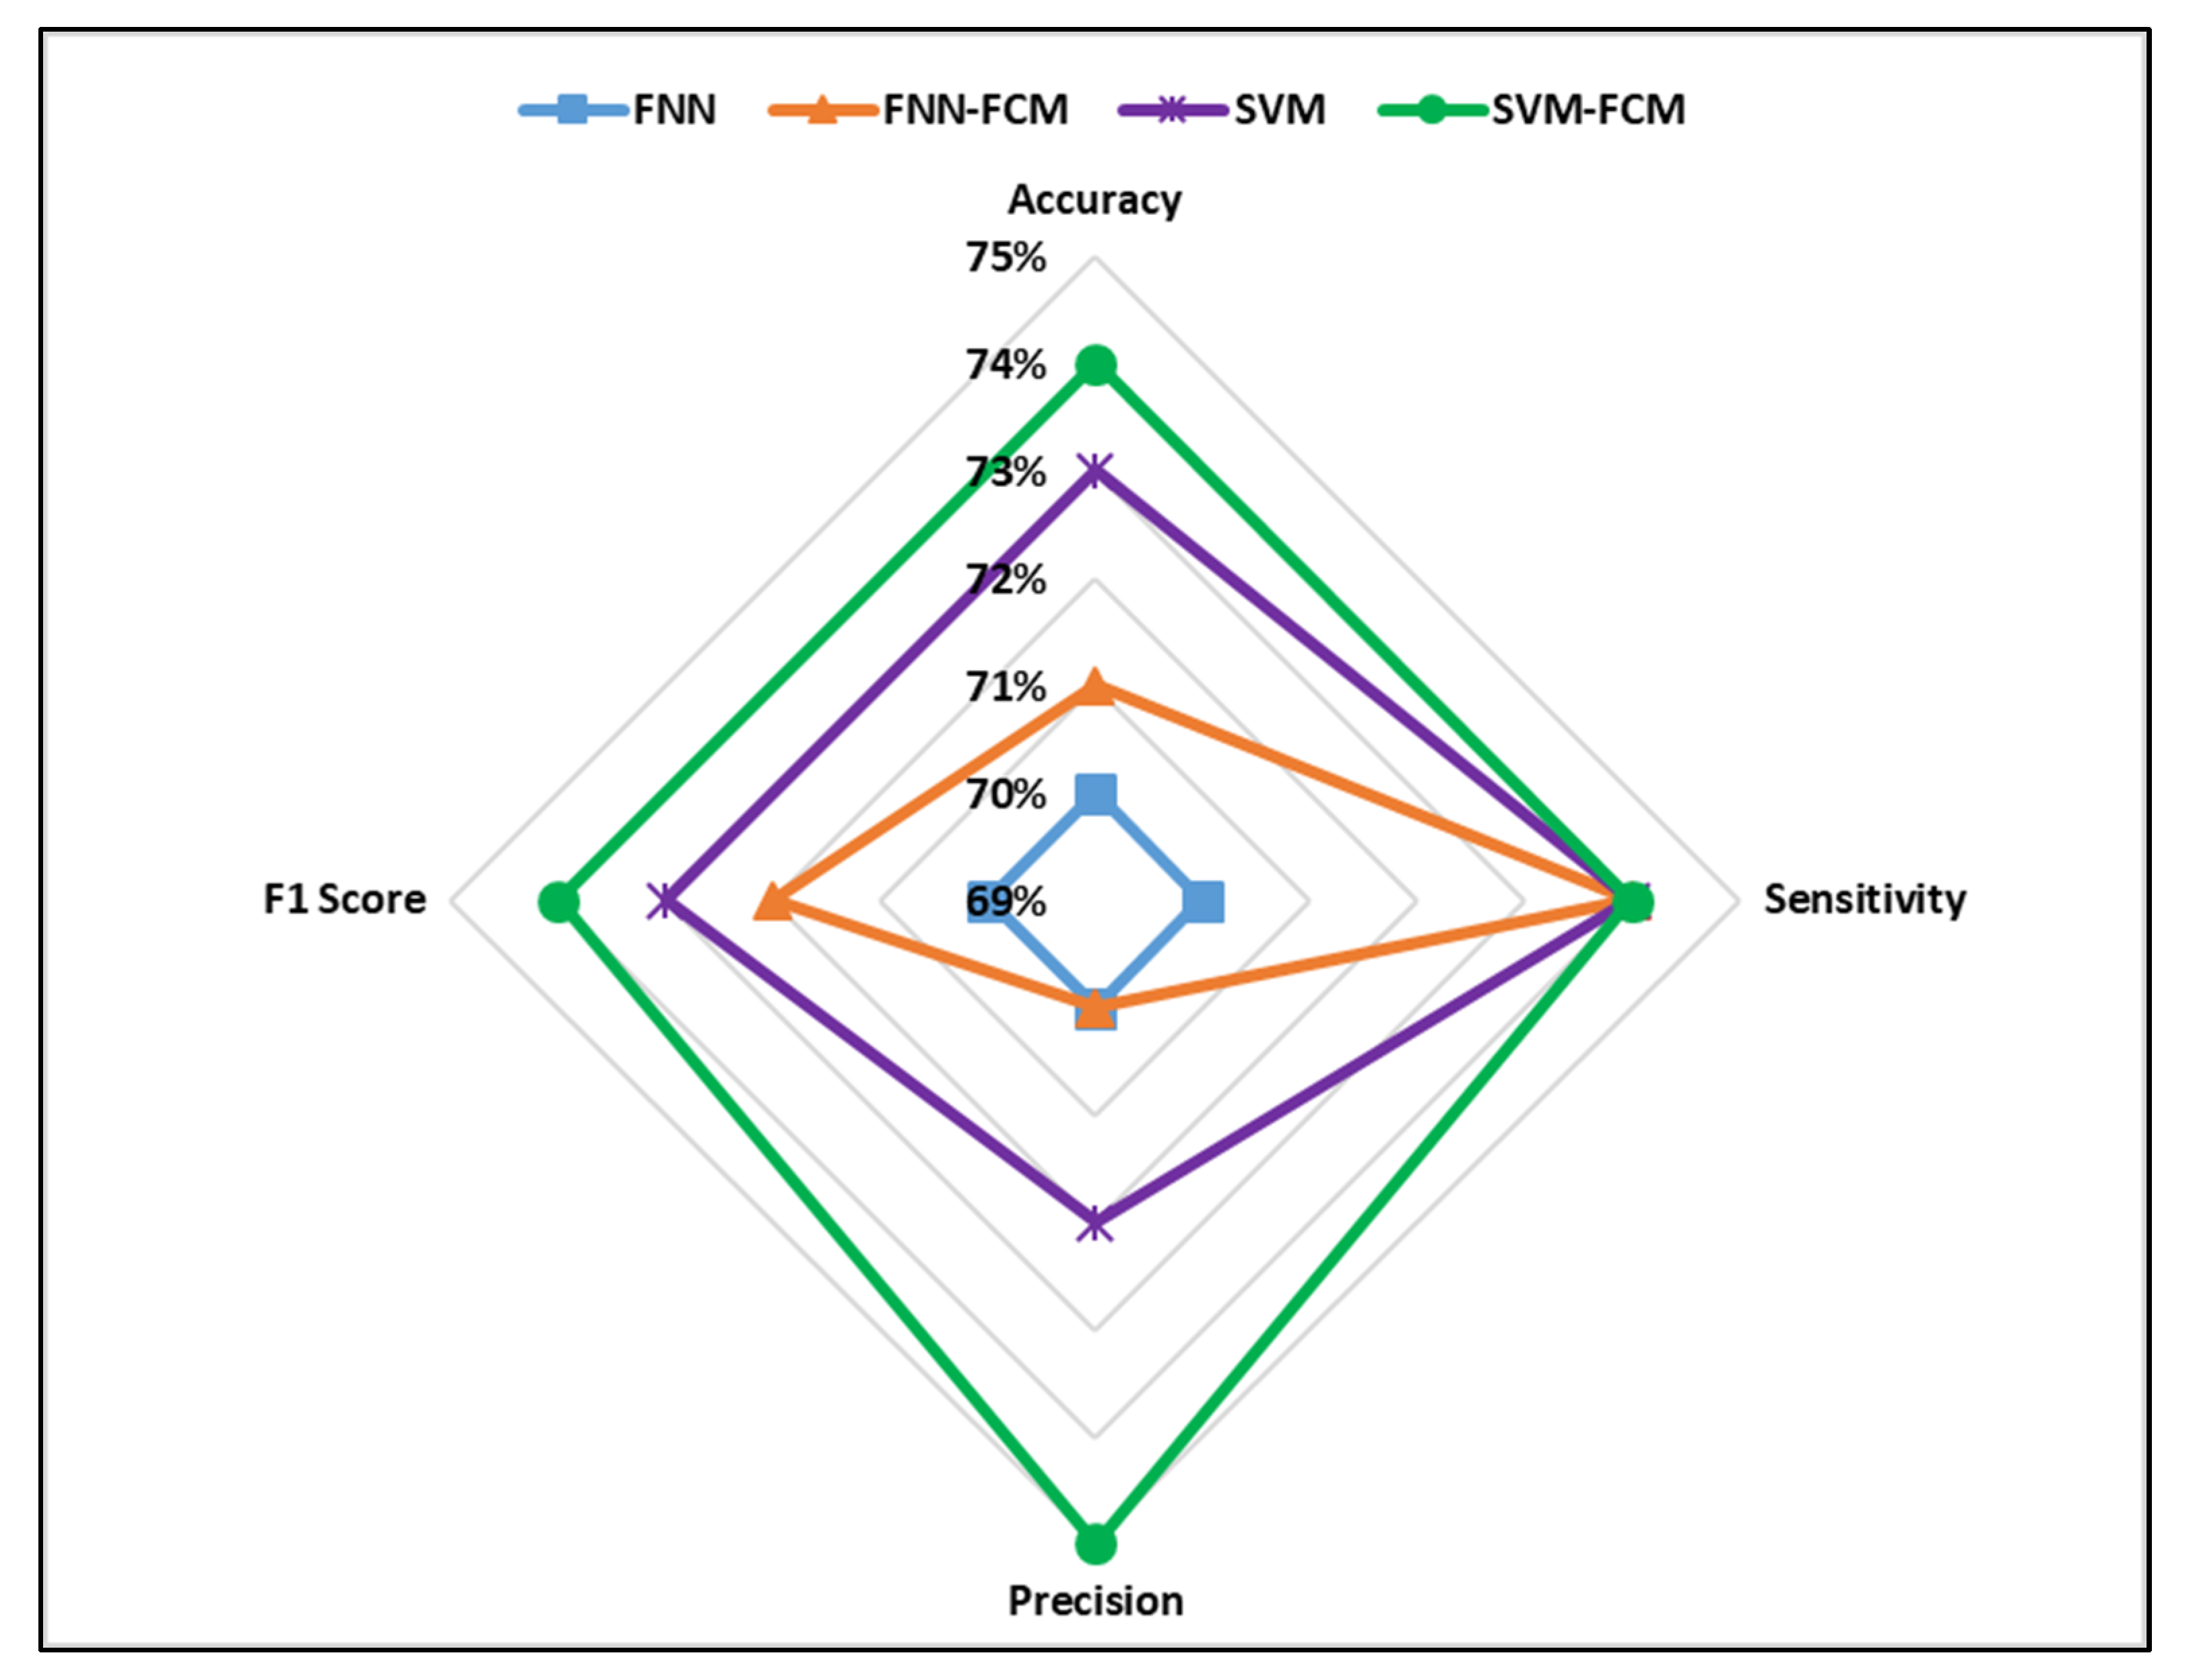
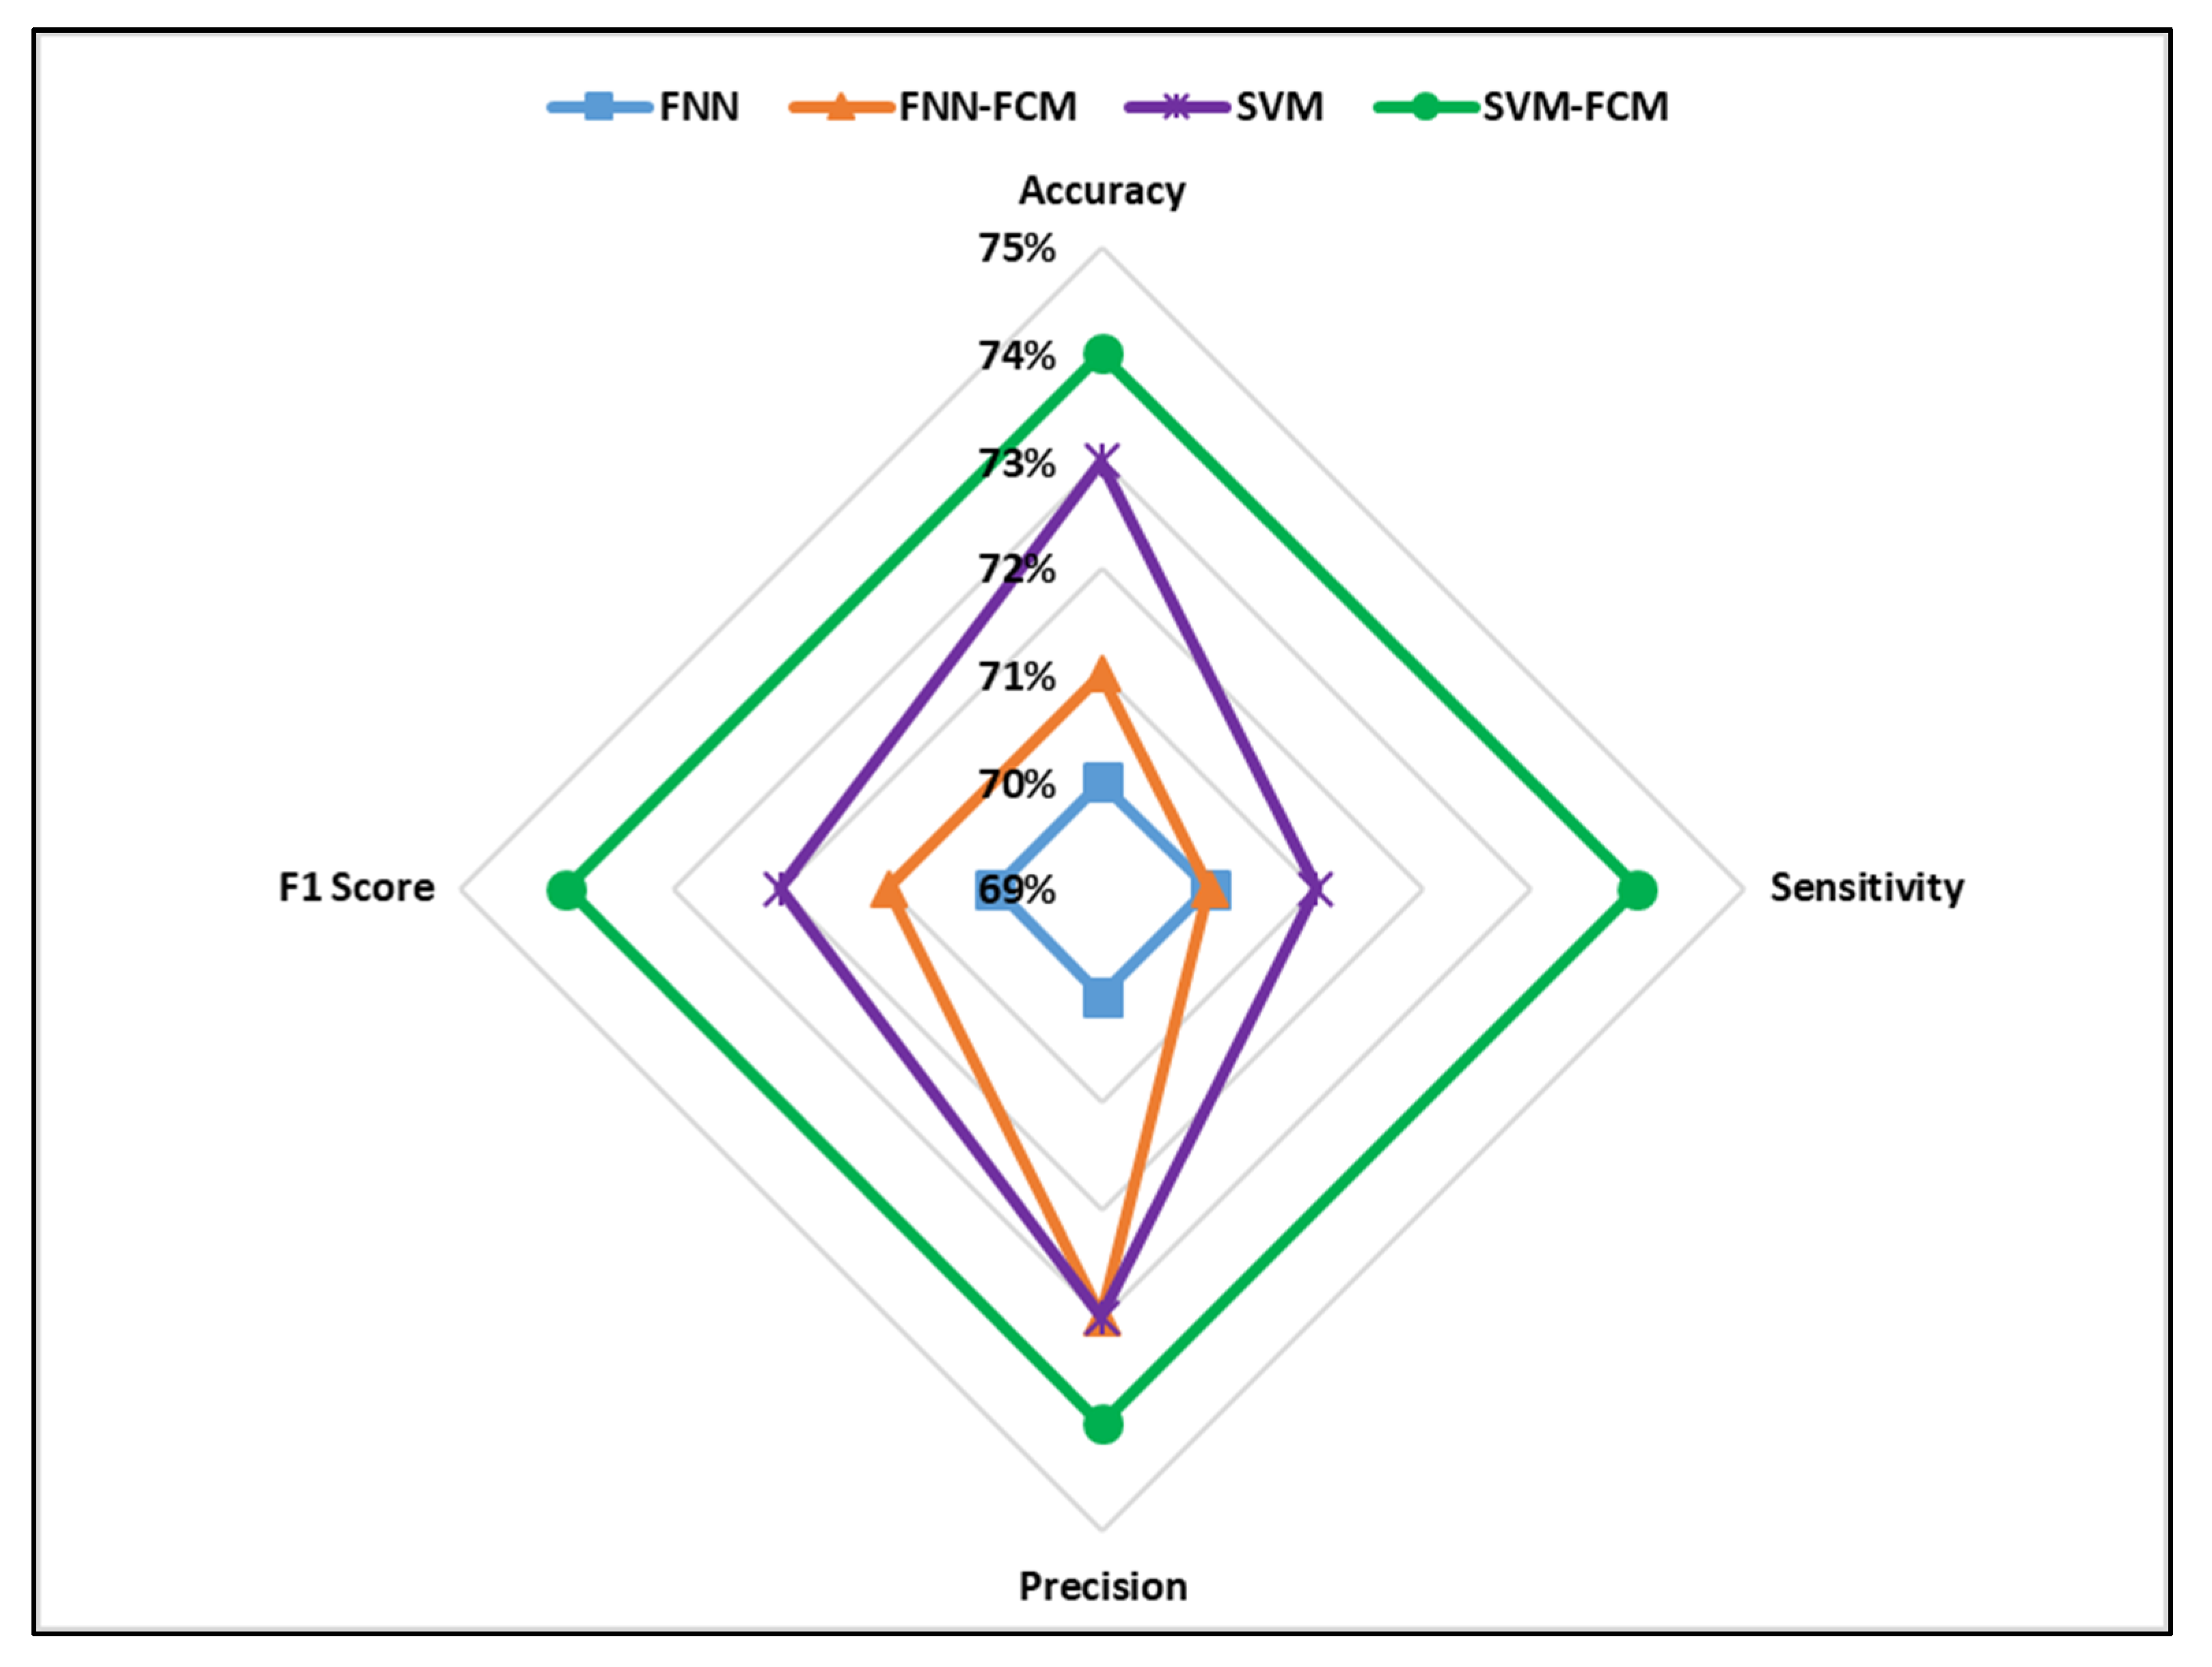
| No. of Clusters | FNN-FCM1 Testing Accuracy (%) | SVM-FCM2 Testing Accuracy (%) |
|---|---|---|
| 1 | 70.0 | 73.0 |
| 2 | 71.8 | 72.2 |
| 3 | 71.0 | 73.0 |
| 4 | 70.2 | 74.2 |
| 5 | 67.9 | 72.1 |
© 2020 by the authors. Licensee MDPI, Basel, Switzerland. This article is an open access article distributed under the terms and conditions of the Creative Commons Attribution (CC BY) license (http://creativecommons.org/licenses/by/4.0/).
Share and Cite
Assi, K.; Rahman, S.M.; Mansoor, U.; Ratrout, N. Predicting Crash Injury Severity with Machine Learning Algorithm Synergized with Clustering Technique: A Promising Protocol. Int. J. Environ. Res. Public Health 2020, 17, 5497. https://0-doi-org.brum.beds.ac.uk/10.3390/ijerph17155497
Assi K, Rahman SM, Mansoor U, Ratrout N. Predicting Crash Injury Severity with Machine Learning Algorithm Synergized with Clustering Technique: A Promising Protocol. International Journal of Environmental Research and Public Health. 2020; 17(15):5497. https://0-doi-org.brum.beds.ac.uk/10.3390/ijerph17155497
Chicago/Turabian StyleAssi, Khaled, Syed Masiur Rahman, Umer Mansoor, and Nedal Ratrout. 2020. "Predicting Crash Injury Severity with Machine Learning Algorithm Synergized with Clustering Technique: A Promising Protocol" International Journal of Environmental Research and Public Health 17, no. 15: 5497. https://0-doi-org.brum.beds.ac.uk/10.3390/ijerph17155497