Estimation of the Inhaled Dose of Airborne Pollutants during Commuting: Case Study and Application for the General Population

 ,
,  ,
,  , , , , and
Abstract
:
1. Introduction
2. Materials and Methods
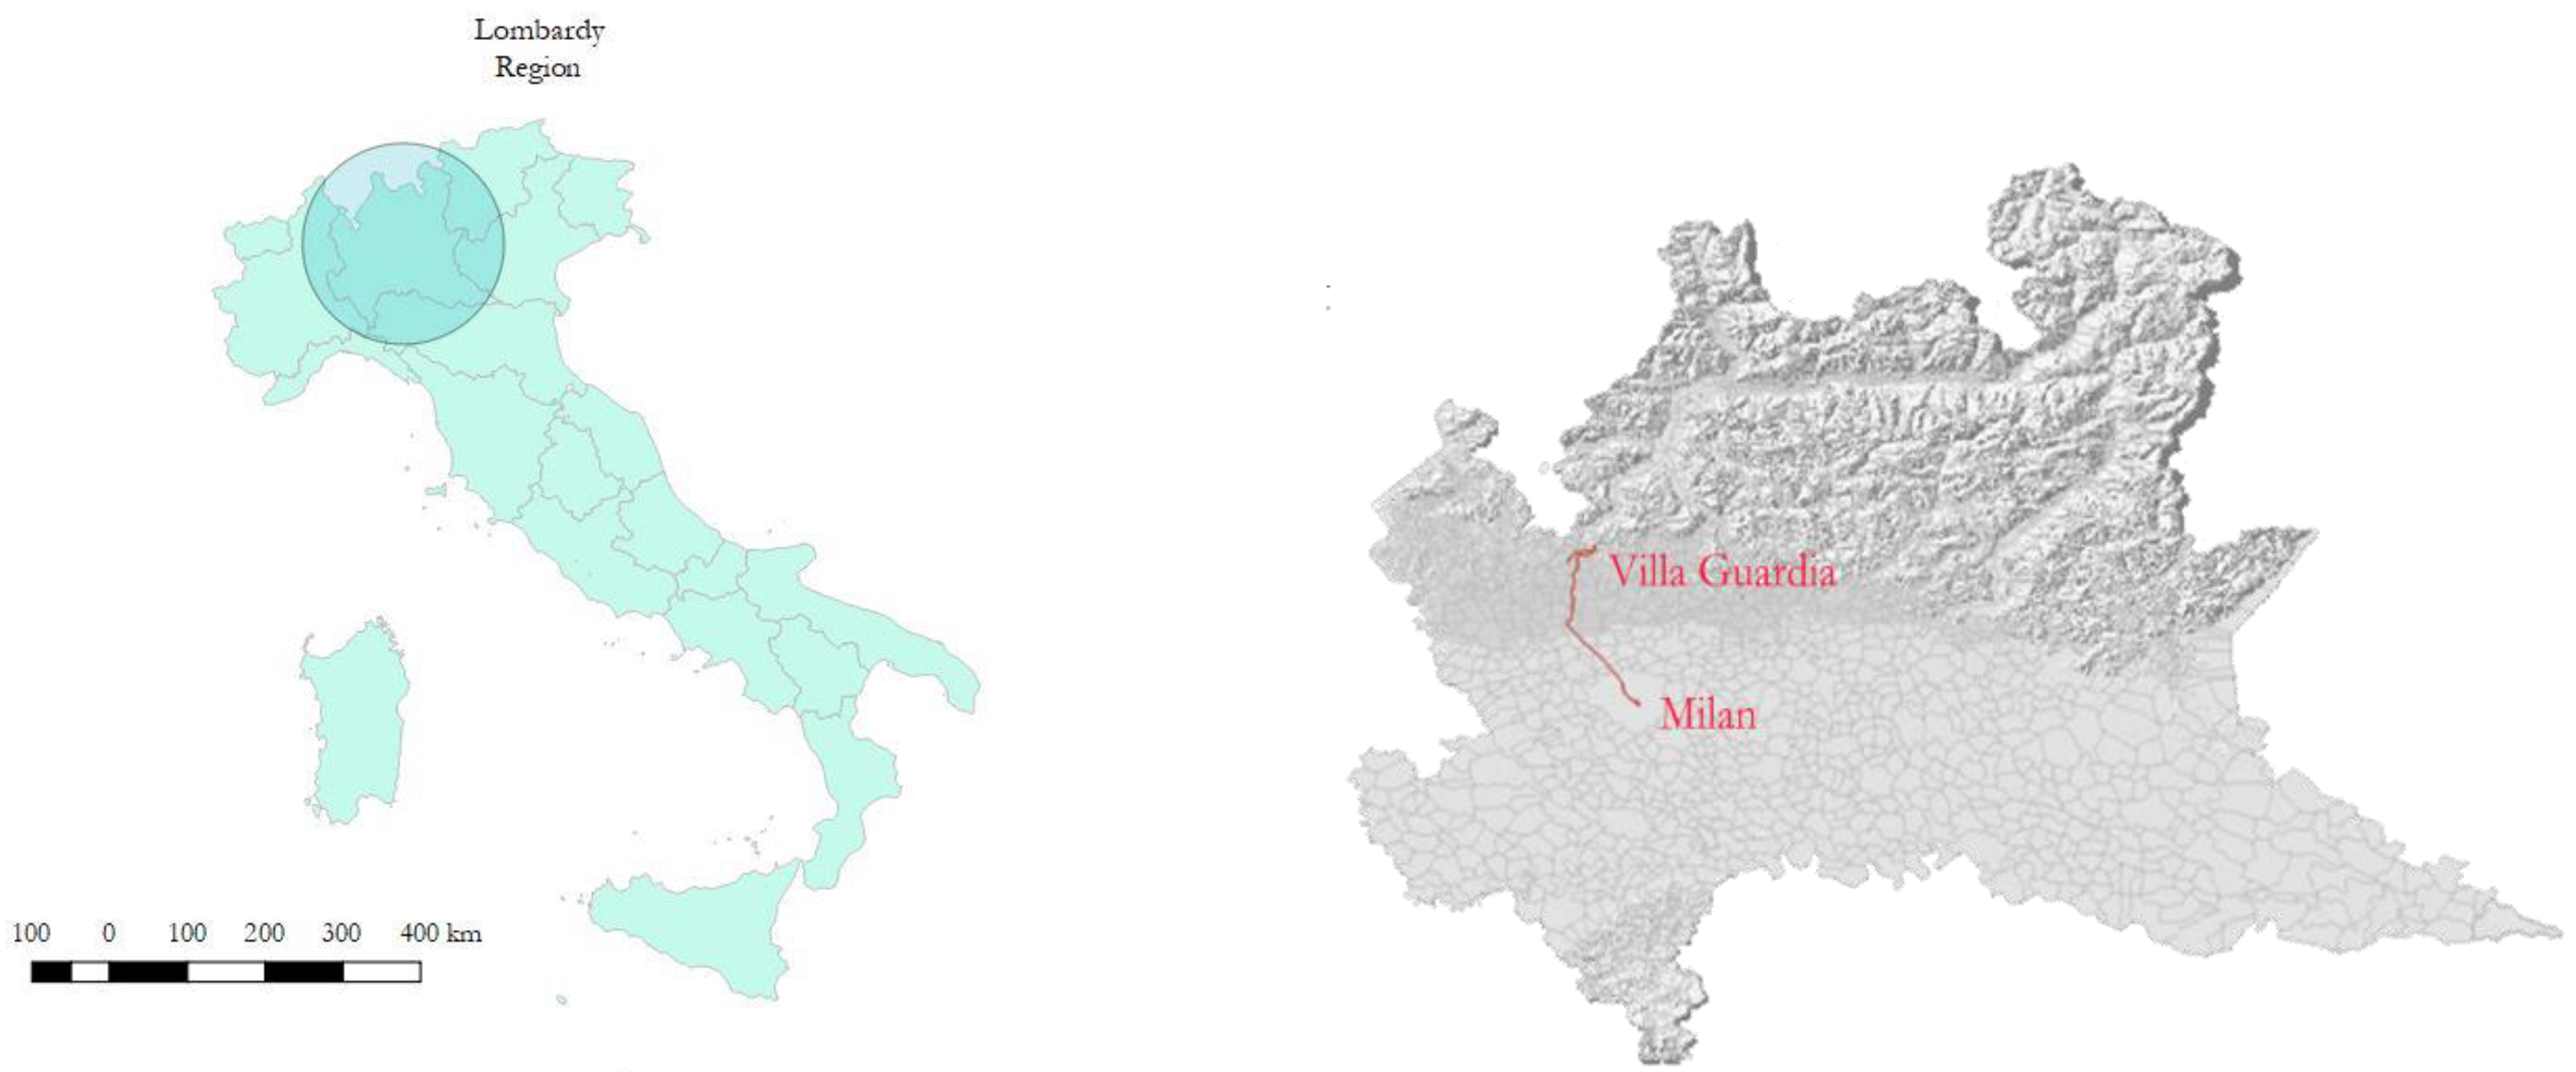
2.1. Study Design and Instrumentation
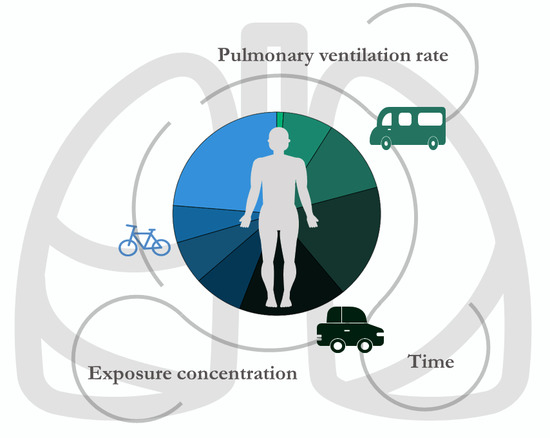
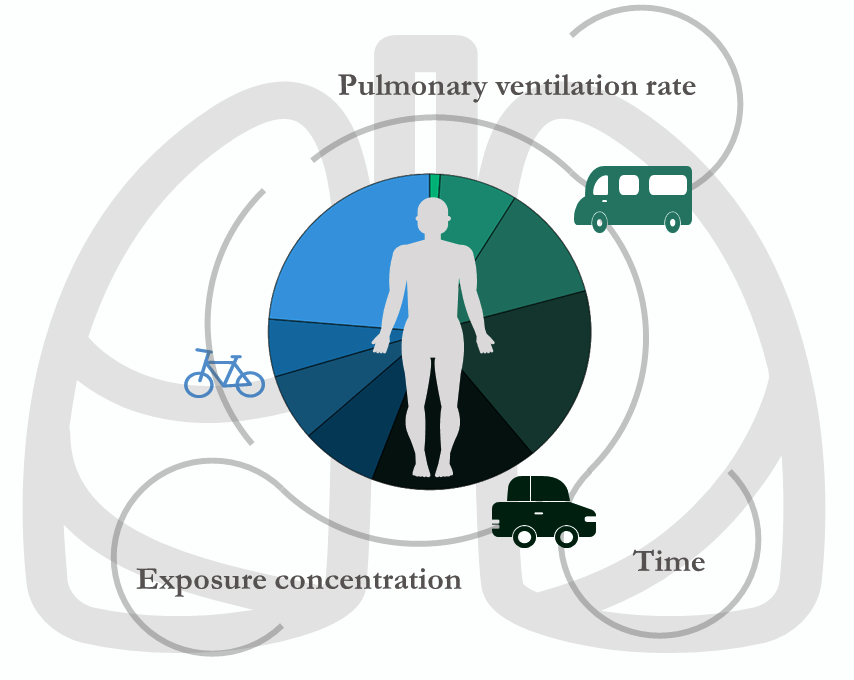
2.2. Estimation of the Inhaled Dose
3. Results and Discussions
3.1. Case Study
3.2. General Population
3.3. Limits of the Study and Future Developments
4. Conclusions
Supplementary Materials
Author Contributions
Funding
Conflicts of Interest
References
- Karanasiou, A.; Viana, M.; Querol, X.; Moreno, T.; de Leeuw, F. Assessment of personal exposure to particulate air pollution during commuting in European cities—Recommendations and policy implications. Sci. Total Environ. 2014, 490, 785–797. [Google Scholar] [CrossRef] [PubMed]
- Vouitsis, I.; Taimisto, P.; Kelessis, A.; Samaras, Z. Microenvironment particle measurements in Thessaloniki, Greece. Urban Clim. 2014, 10, 608–620. [Google Scholar] [CrossRef]
- Apparicio, P.; Gelb, J.; Carrier, M.; Mathieu, M.È.; Kingham, S. Exposure to noise and air pollution by mode of transportation during rush hours in Montreal. J. Transp. Geogr. 2018, 70, 182–192. [Google Scholar] [CrossRef]
- Correia, C.; Martins, V.; Cunha-Lopes, I.; Faria, T.; Diapouli, E.; Eleftheriadis, K.; Almeida, S.M. Particle exposure and inhaled dose while commuting in Lisbon. Environ. Pollut. 2020, 257, 113547. [Google Scholar] [CrossRef] [PubMed]
- Li, B.; Lei, X.N.; Xiu, G.L.; Gao, C.Y.; Gao, S.; Qian, N.S. Personal exposure to black carbon during commuting in peak and off-peak hours in Shanghai. Sci. Total Environ. 2015, 524–525, 237–245. [Google Scholar] [CrossRef] [PubMed]
- Kaur, S.; Nieuwenhuijsen, M.J.; Colvile, R.N. Fine particulate matter and carbon monoxide exposure concentrations in urban street transport microenvironments. Atmos. Environ. 2007, 41, 4781–4810. [Google Scholar] [CrossRef]
- Cepeda, M.; Schoufour, J.; Freak-Poli, R.; Koolhaas, C.M.; Dhana, K.; Bramer, W.M.; Franco, O.H. Levels of ambient air pollution according to mode of transport: A systematic review. Lancet Public Heal. 2017, 2, e23–e34. [Google Scholar] [CrossRef] [Green Version]
- Rodes, C.E.; Chillrud, S.N.; Haskell, W.L.; Intille, S.S.; Albinali, F.; Rosenberger, M.E. Predicting adult pulmonary ventilation volume and wearing complianceby on-board accelerometry during personal level exposure assessments. Atmos. Environ. 2012, 57, 126–137. [Google Scholar] [CrossRef] [Green Version]
- Yeh, H.C.; Schum, G.M. Models of human lung airways and their application to inhaled particle deposition. Bull. Math. Biol. 1980, 42, 461–480. [Google Scholar] [CrossRef]
- Borghi, F.; Spinazzè, A.; Fanti, G.; Campagnolo, D.; Rovelli, S.; Keller, M.; Cattaneo, A.; Cavallo, D.M. Commuters’ Personal Exposure Assessment and Evaluation of Inhaled Dose to Different Atmospheric Pollutants. Int. J. Environ. Res. Public Health 2020, 17, 3357. [Google Scholar] [CrossRef]
- Campagnolo, D.; Cattaneo, A.; Corbella, L.; Borghi, F.; Del Buono, L.; Rovelli, S.; Spinazzé, A.; Cavallo, D.M. In-vehicle airborne fine and ultra-fine particulate matter exposure: The impact of leading vehicle emissions. Environ. Int. 2019, 123, 407–416. [Google Scholar] [CrossRef] [PubMed]
- European Committee for Standardization. EN 14907 Ambient Air Quality—Standard Gravimetric Measurement Method for the Determination of the PM2.5 Mass Fraction of Suspended Particulate Matter; European Committee for Standardization: Brussels, Belgium, 2005. [Google Scholar]
- European Committee for Standardization. 12341, U.E. Ambient Air. Standard Gravimetric Measurement Method for the Determination of the PM10 or PM2.5 Mass Concentration of Suspended Particulate Matter; European Committee for Standardization: Brussels, Belgium, 2014. [Google Scholar]
- Rovelli, S.; Cattaneo, A.; Borghi, F.; Spinazzè, A.; Campagnolo, D.; Limbeck, A.; Cavallo, D.M. Mass concentration and size-distribution of atmospheric particulate matter in an urban environment. Aerosol Air Qual. Res. 2017, 17, 1142–1155. [Google Scholar] [CrossRef]
- Spinazzè, A.; Fanti, G.; Borghi, F.; Del Buono, L.; Campagnolo, D.; Rovelli, S.; Cattaneo, A.; Cavallo, D.M. Field comparison of instruments for exposure assessment of airborne ultrafine particles and particulate matter. Atmos. Environ. 2017, 154, 274–284. [Google Scholar] [CrossRef]
- Borghi, F.; Spinazzè, A.; Campagnolo, D.; Rovelli, S.; Cattaneo, A.; Cavallo, D.M. Precision and accuracy of a direct-reading miniaturized monitor in PM2.5 exposure assessment. Sensors 2018, 18, 3089. [Google Scholar] [CrossRef] [Green Version]
- Spinazzè, A.; Cattaneo, A.; Scocca, D.R.; Bonzini, M.; Cavallo, D.M. Multi-metric measurement of personal exposure to ultrafine particles in selected urban microenvironments. Atmos. Environ. 2015, 110, 8–17. [Google Scholar] [CrossRef]
- Manojkumar, N.; Srimuruganandam, B.; Shiva Nagendra, S.M. Application of multiple-path particle dosimetry model for quantifying age specified deposition of particulate matter in human airway. Ecotoxicol. Environ. Saf. 2019, 168, 241–248. [Google Scholar] [CrossRef]
- Tan, S.H.; Roth, M.; Velasco, E. Particle exposure and inhaled dose during commuting in Singapore. Atmos. Environ. 2017, 170, 245–258. [Google Scholar] [CrossRef]
- Italian Census. Available online: https://dati.comune.milano.it/dataset/ds393-popolazione-pendolari-movimenti-interni-mezzo-tempo-orario-uscita-genere-2011c/resource/8ba5352e-f317-4d93-be98-f79205b5a9eb (accessed on 26 May 2020).
- Olfert, I.M.; Balouch, J.; Kleinsasser, A.; Knapp, A.; Wagner, H.; Wagner, P.D.; Hopkins, S.R. Does gender affect human pulmonary gas exchange during exercise? J. Physiol. 2004, 557, 529–541. [Google Scholar] [CrossRef] [Green Version]
- Kumar, P. Quantification of Sources of Variability of Air Pollutant Exposure Concentrations among Selected Transportation Microenvironments. Transp. Res. Rec. 2020. [Google Scholar] [CrossRef]
- Dirks, K.N.; Talbot, N.; Salmond, J.A.; Costello, S.B. In-cabin vehicle carbon monoxide concentrations under different ventilation settings. Atmosphere 2018, 9, 338. [Google Scholar] [CrossRef] [Green Version]
- Borghi, F.; Cattaneo, A.; Spinazzè, A.; Manno, A.; Rovelli, S.; Campagnolo, D.; Vicenzi, M.; Mariani, J.; Bollati, V.; Cavallo, D.M. Evaluation of the inhaled dose across different microenvironments. In Proceedings of the IOP Conference Series: Earth and Environmental Science, Milan, Italy, 4–5 September 2019; Volume 296. [Google Scholar]
- Ramos, M.J.; Vasconcelos, A.; Faria, M. Comparison of particulate matter inhalation for users of different transport modes in Lisbon. Transp. Res. Procedia 2015, 10, 433–442. [Google Scholar] [CrossRef] [Green Version]
- Field Discovering Statistics Using IBM SPSS Statistics—Andy Field—Google Libri. Available online: https://books.google.it/books?hl=it&lr=&id=c0Wk9IuBmAoC&oi=fnd&pg=PP2&ots=LbIoJFYv0J&sig=kAbORegN5_Um17iM67fYDs05mkg&redir_esc=y#v=onepage&q&f=false (accessed on 12 August 2020).
- Comune, V.A.S.; Pianificazione, M.S.; Mobilit, P.; Comune, V.A.S.; Settore, M.; Ambientali, P.; Consulente, E.; Mobilit, A. Piano Urbano Della Mobilità. 2015. Available online: https://www.comune.milano.it/documents/20126/697531/Documento_indirizzo_metodologico.pdf/2a560128-6c21-c2e3-bf09-f29edcc63ed8?t=1547477585816 (accessed on 26 May 2020).


| ME | Hour (From–To; min) | Time of Stay (min) | Route Length (km) |
|---|---|---|---|
| Car | 7:50–8:10 | 20 | 10 |
| Walking (LT) | 8:25–8:35 | 10 | 0.7 |
| Train | 8:45–9:35 | 50 | 45 |
| Walking (LT) | 9:35–9:55 | 20 | 1.5 |
| Walking (HT) | 9:55–10:05 | 10 | 0.5 |
| Underground | 10:05–10:15 | 10 | 2.5 |
| Walking (HT) | 10:20–10:30 | 10 | 0.6 |
| Cycling | 10:30–10:50 | 20 | 3 |
| Indoor | 10:50–12:00 | 70 | n.a |
| Walking (HT) * | 12:00–12:10 | 10 | 0.6 |
| Underground * | 12:10–12:20 | 10 | 2.5 |
| Walking (HT) * | 12:20–12:30 | 10 | 0.5 |
| Walking (LT) * | 12:30–12:50 | 20 | 1.5 |
| Train * | 13:20–14:10 | 50 | 45 |
| Walking (LT) * | 14:10–14:20 | 10 | 0.7 |
| Car * | 14:20–14:40 | 20 | 10 |
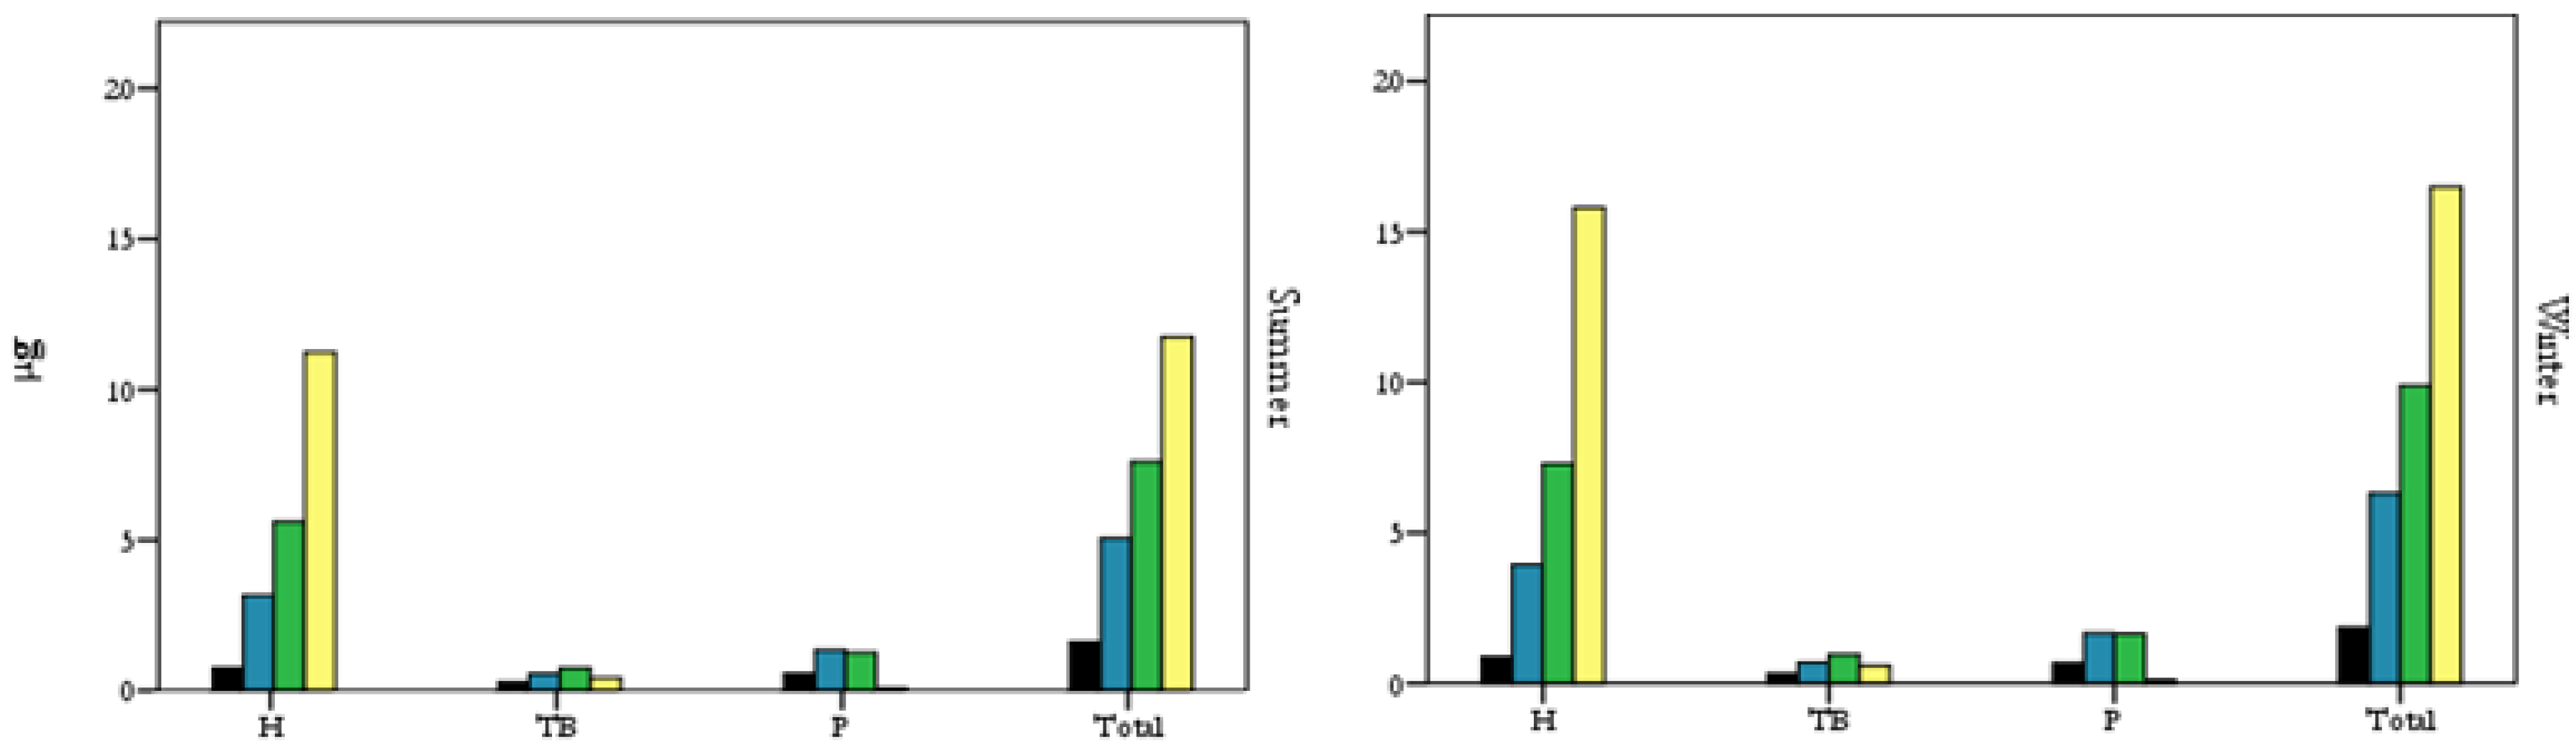
| Season | Pollutant | H | TB | P | Total |
|---|---|---|---|---|---|
| Summer | PM1 | 0.76 | 0.29 | 0.57 | 1.62 |
| PM2.5 | 3.17 | 0.56 | 1.35 | 5.07 | |
| PM4 | 5.60 | 0.74 | 1.26 | 7.60 | |
| PM10 | 11.24 | 0.41 | 0.08 | 11.73 | |
| Winter | PM1 | 0.87 | 0.33 | 0.66 | 1.87 |
| PM2.5 | 3.94 | 0.69 | 1.68 | 6.31 | |
| PM4 | 7.29 | 0.96 | 1.64 | 9.89 | |
| PM10 | 15.80 | 0.58 | 0.12 | 16.50 |
| ME | Winter | Summer | |||||||
|---|---|---|---|---|---|---|---|---|---|
| Head | TB | P | Total | Head | TB | P | Total | ||
| PM1 | Walking (LT) | 0.284 | 0.108 | 0.215 | 0.607 | 0.356 | 0.136 | 0.270 | 0.762 |
| Walking (HT) | 1.381 | 0.528 | 1.046 | 2.955 | 1.574 | 0.602 | 1.192 | 3.368 | |
| Bike | 0.666 | 0.255 | 0.505 | 1.426 | 0.465 | 0.178 | 0.352 | 0.994 | |
| Car | 0.231 | 0.088 | 0.175 | 0.495 | 0.136 | 0.052 | 0.103 | 0.291 | |
| Underground | 2.155 | 0.824 | 1.632 | 4.611 | 0.636 | 0.243 | 0.481 | 1.360 | |
| Train | 0.615 | 0.235 | 0.466 | 1.316 | 0.537 | 0.205 | 0.407 | 1.148 | |
| Indoor | 0.918 | 0.351 | 0.695 | 1.964 | 0.852 | 0.326 | 0.646 | 1.824 | |
| Other | 2.479 | 0.948 | 1.878 | 5.305 | 1.979 | 0.757 | 1.499 | 4.235 | |
| PM2.5 | Walking (LT) | 1.233 | 0.217 | 0.524 | 1.975 | 1.400 | 0.246 | 0.595 | 2.241 |
| Walking (HT) | 6.039 | 1.061 | 2.568 | 9.668 | 6.256 | 1.099 | 2.660 | 10.016 | |
| Bike | 2.961 | 0.520 | 1.259 | 4.741 | 1.929 | 0.339 | 0.820 | 3.088 | |
| Car | 0.923 | 0.162 | 0.393 | 1.478 | 0.553 | 0.097 | 0.235 | 0.885 | |
| Underground | 10.966 | 1.927 | 4.662 | 17.555 | 3.207 | 0.563 | 1.363 | 5.134 | |
| Train | 2.496 | 0.439 | 1.061 | 3.995 | 2.021 | 0.355 | 0.859 | 3.236 | |
| Indoor | 4.048 | 0.711 | 1.721 | 6.480 | 3.427 | 0.602 | 1.457 | 5.486 | |
| Other | 11.023 | 1.937 | 4.687 | 17.647 | 8.702 | 1.529 | 3.700 | 13.930 | |
| PM4 | Walking (LT) | 2.189 | 0.287 | 0.494 | 2.971 | 2.454 | 0.322 | 0.554 | 3.329 |
| Walking (HT) | 11.457 | 1.504 | 2.585 | 15.546 | 11.028 | 1.448 | 2.489 | 14.964 | |
| Bike | 5.814 | 0.763 | 1.312 | 7.889 | 3.509 | 0.461 | 0.792 | 4.761 | |
| Car | 1.510 | 0.198 | 0.341 | 2.049 | 0.930 | 0.122 | 0.210 | 1.261 | |
| Underground | 21.110 | 2.771 | 4.764 | 28.644 | 6.103 | 0.801 | 1.377 | 8.281 | |
| Train | 4.311 | 0.566 | 0.973 | 5.850 | 3.337 | 0.438 | 0.753 | 4.528 | |
| Indoor | 7.425 | 0.975 | 1.676 | 10.076 | 5.968 | 0.783 | 1.347 | 8.099 | |
| Other | 20.145 | 2.644 | 4.546 | 27.335 | 15.728 | 2.065 | 3.549 | 21.342 | |
| PM10 | Walking (LT) | 5.857 | 0.214 | 0.043 | 6.114 | 5.355 | 0.196 | 0.039 | 5.590 |
| Walking (HT) | 26.306 | 0.963 | 0.193 | 27.462 | 22.228 | 0.814 | 0.163 | 23.204 | |
| Bike | 13.825 | 0.506 | 0.101 | 14.432 | 7.196 | 0.263 | 0.053 | 7.513 | |
| Car | 2.524 | 0.092 | 0.018 | 2.635 | 1.609 | 0.059 | 0.012 | 1.679 | |
| Underground | 44.346 | 1.624 | 0.325 | 46.295 | 12.666 | 0.464 | 0.093 | 13.223 | |
| Train | 8.973 | 0.329 | 0.066 | 9.367 | 6.418 | 0.235 | 0.047 | 6.700 | |
| Indoor | 16.018 | 0.586 | 0.117 | 16.722 | 11.533 | 0.422 | 0.084 | 12.039 | |
| Other | 42.550 | 1.558 | 0.312 | 44.420 | 31.820 | 1.165 | 0.233 | 33.218 | |
| Summer | Winter | Summer | Winter | ||||||||||||
|---|---|---|---|---|---|---|---|---|---|---|---|---|---|---|---|
| PM1 | ME | Time (min) | Gender | Morning | Afternoon | Morning | Afternoon | PM2.5 | ME | Time (min) | Gender | Morning | Afternoon | Morning | Afternoon |
| Train | 15 | Female | 2843 | 5330 | 3782 | 7379 | Train | 15 | Female | 3549 | 6341 | 5078 | 9283 | ||
| 30 | 5685 | 10,660 | 7564 | 14,758 | 30 | 7098 | 12,681 | 10,155 | 18,565 | ||||||
| 60 | 11,370 | 21,320 | 15,129 | 29,515 | 60 | 14,197 | 25,362 | 20,311 | 37,131 | ||||||
| 90 | 17,055 | 31,980 | 22,693 | 44,273 | 90 | 21,295 | 38,044 | 30,466 | 55,696 | ||||||
| 15 | Male | 3503 | 6568 | 4661 | 9093 | 15 | Male | 4374 | 7813 | 6257 | 11,439 | ||||
| 30 | 7005 | 13,136 | 9321 | 18,185 | 30 | 8747 | 15,626 | 12,514 | 22,877 | ||||||
| 60 | 14,011 | 26,272 | 18,643 | 36,371 | 60 | 17,494 | 31,253 | 25,028 | 45,754 | ||||||
| 90 | 21,016 | 39,408 | 27,964 | 54,556 | 90 | 26,241 | 46,879 | 37,542 | 68,632 | ||||||
| Underground | 15 | Female | 5126 | 5830 | 4162 | 2832 | Underground | 15 | Female | 6224 | 7136 | 5257 | 13,360 | ||
| 30 | 10,251 | 11,660 | 8323 | 5663 | 30 | 12,447 | 14,273 | 10,515 | 26,720 | ||||||
| 60 | 20,503 | 23,320 | 16,646 | 11,327 | 60 | 24,895 | 28,546 | 21,030 | 53,441 | ||||||
| 90 | 30,754 | 34,979 | 24,969 | 16,990 | 90 | 37,342 | 42,819 | 31,545 | 80,161 | ||||||
| 15 | Male | 6316 | 7184 | 5128 | 3489 | 15 | Male | 7669 | 8794 | 6479 | 4542 | ||||
| 30 | 12,632 | 14,368 | 10,256 | 6979 | 30 | 15,338 | 17,588 | 12,957 | 9083 | ||||||
| 60 | 25,265 | 28,736 | 20,513 | 13,957 | 60 | 30,677 | 35,176 | 25,914 | 18,167 | ||||||
| 90 | 37,897 | 43,104 | 30,769 | 20,936 | 90 | 46,015 | 52,764 | 38,871 | 27,250 | ||||||
| Car | 15 | Female | 5507 | 3244 | 4446 | 3331 | Car | 15 | Female | 7172 | 3838 | 5149 | 11,009 | ||
| 30 | 11,015 | 6489 | 8892 | 6662 | 30 | 14,343 | 7675 | 10,297 | 22,019 | ||||||
| 60 | 22,030 | 12,977 | 17,784 | 13,324 | 60 | 28,687 | 15,351 | 20,594 | 44,037 | ||||||
| 90 | 33,044 | 19,466 | 26,677 | 19,986 | 90 | 43,030 | 23,026 | 30,892 | 66,056 | ||||||
| 15 | Male | 6787 | 3998 | 5479 | 4105 | 15 | Male | 8837 | 4729 | 6344 | 5957 | ||||
| 30 | 13,573 | 7996 | 10,957 | 8209 | 30 | 17,675 | 9458 | 12,689 | 11,914 | ||||||
| 60 | 27,146 | 15,991 | 21,915 | 16,419 | 60 | 35,350 | 18,916 | 25,378 | 23,827 | ||||||
| 90 | 40,719 | 23,987 | 32,872 | 24,628 | 90 | 53,024 | 28,374 | 38,067 | 35,741 | ||||||
| Bicycle | 15 | Female | 9962 | 3920 | 10,387 | 5714 | Bicycle | 15 | Female | 11,707 | 6197 | 13,561 | 17,905 | ||
| 30 | 19,924 | 7839 | 20,774 | 11,428 | 30 | 23,414 | 12,395 | 27,122 | 35,809 | ||||||
| 60 | 39,848 | 15,678 | 41,548 | 22,856 | 60 | 46,828 | 24,790 | 54,244 | 71,618 | ||||||
| 90 | 59,772 | 23,518 | 62,323 | 34,283 | 90 | 70,243 | 37,185 | 81,366 | 107,427 | ||||||
| 15 | Male | 11,495 | 4523 | 11,985 | 6593 | 15 | Male | 13,508 | 7151 | 15,647 | 9498 | ||||
| 30 | 22,989 | 9045 | 23,970 | 13,186 | 30 | 27,016 | 14,302 | 31,295 | 18,996 | ||||||
| 60 | 45,978 | 18,090 | 47,941 | 26,372 | 60 | 54,033 | 28,604 | 62,589 | 37,993 | ||||||
| 90 | 68,967 | 27,136 | 71,911 | 39,558 | 90 | 81,049 | 42,905 | 93,884 | 56,989 | ||||||
| Walking | 15 | Female | 7655 | 9264 | 9348 | 13,462 | Walking | 15 | Female | 9211 | 11,091 | 11,867 | 20,302 | ||
| 30 | 15,310 | 18,529 | 18,697 | 26,924 | 30 | 18,422 | 22,182 | 23,734 | 40,604 | ||||||
| 60 | 30,619 | 37,058 | 37,394 | 53,847 | 60 | 36,845 | 44,364 | 47,468 | 81,209 | ||||||
| 90 | 45,929 | 55,587 | 56,091 | 80,771 | 90 | 55,267 | 66,546 | 71,202 | 121,813 | ||||||
| 15 | Male | 8832 | 10,690 | 10,787 | 15,533 | 15 | Male | 10,628 | 12,797 | 13,693 | 21,170 | ||||
| 30 | 17,665 | 21,379 | 21,573 | 31,066 | 30 | 21,257 | 25,595 | 27,385 | 42,341 | ||||||
| 60 | 35,330 | 42,759 | 43,147 | 62,131 | 60 | 42,513 | 51,189 | 54,771 | 84,682 | ||||||
| 90 | 52,994 | 64,138 | 64,720 | 93,197 | 90 | 63,770 | 76,784 | 82,156 | 127,023 | ||||||
| Train | 15 | Female | 4351 | 7601 | 6368 | 11,193 | Train | 15 | Female | 6470 | 10,662 | 10,044 | 16,066 | ||
| 30 | 8701 | 15,201 | 12,737 | 22,387 | 30 | 12,941 | 21,325 | 20,088 | 32,132 | ||||||
| 60 | 17,403 | 30,403 | 25,474 | 44,774 | 60 | 25,881 | 42,649 | 40,177 | 64,265 | ||||||
| 90 | 26,104 | 45,604 | 38,211 | 67,161 | 90 | 38,822 | 63,974 | 60,265 | 96,397 | ||||||
| 15 | Male | 5361 | 9366 | 7848 | 13,793 | 15 | Male | 7973 | 13,139 | 12,377 | 19,798 | ||||
| 30 | 10,722 | 18,732 | 15,695 | 27,587 | 30 | 15,946 | 26,277 | 24,754 | 39,595 | ||||||
| 60 | 21,445 | 37,464 | 31,390 | 55,173 | 60 | 31,892 | 52,555 | 49,508 | 79,191 | ||||||
| 90 | 32,167 | 56,196 | 47,085 | 82,760 | 90 | 47,838 | 78,832 | 74,262 | 118,786 | ||||||
| Underground | 15 | Female | 7390 | 8727 | 6633 | 4788 | Underground | 15 | Female | 10,779 | 12,295 | 10,163 | 7427 | ||
| 30 | 14,780 | 17,454 | 13,265 | 9576 | 30 | 21,558 | 24,590 | 20,325 | 14,854 | ||||||
| 60 | 29,561 | 34,909 | 26,531 | 19,152 | 60 | 43,116 | 49,180 | 40,651 | 29,708 | ||||||
| 90 | 44,341 | 52,363 | 39,796 | 28,727 | 90 | 64,674 | 73,771 | 60,976 | 44,562 | ||||||
| 15 | Male | 9107 | 10,754 | 8173 | 5900 | 15 | Male | 13,282 | 15,151 | 12,523 | 9152 | ||||
| 30 | 18,213 | 21,508 | 16,346 | 11,800 | 30 | 26,565 | 30,301 | 25,046 | 18,304 | ||||||
| 60 | 36,426 | 43,017 | 32,693 | 23,600 | 60 | 53,130 | 60,603 | 50,092 | 36,608 | ||||||
| 90 | 54,640 | 64,525 | 49,039 | 35,399 | 90 | 79,695 | 90,904 | 75,138 | 54,911 | ||||||
| Car | 15 | Female | 8760 | 4562 | 5839 | 6100 | Car | 15 | Female | 13,319 | 6527 | 8063 | 10,907 | ||
| 30 | 17,519 | 9124 | 11,677 | 12,201 | 30 | 26,638 | 13,053 | 16,126 | 21,814 | ||||||
| 60 | 35,038 | 18,248 | 23,354 | 24,401 | 60 | 53,276 | 26,107 | 32,252 | 43,628 | ||||||
| 90 | 52,558 | 27,372 | 35,031 | 36,602 | 90 | 79,914 | 39,160 | 48,378 | 65,442 | ||||||
| 15 | Male | 10,794 | 5622 | 7195 | 7517 | 15 | Male | 16,412 | 8043 | 9936 | 13,440 | ||||
| 30 | 21,588 | 11,243 | 14,389 | 15,034 | 30 | 32,825 | 16,085 | 19,871 | 26,881 | ||||||
| 60 | 43,176 | 22,486 | 28,779 | 30,069 | 60 | 65,650 | 32,170 | 39,743 | 53,761 | ||||||
| 90 | 64,764 | 33,729 | 43,168 | 45,103 | 90 | 98,475 | 48,256 | 59,614 | 80,642 | ||||||
| Bicycle | 15 | Female | 14,062 | 7996 | 17,024 | 10,279 | Bicycle | 15 | Female | 20,648 | 12,282 | 26,190 | 16,137 | ||
| 30 | 28,123 | 15,992 | 34,048 | 20,558 | 30 | 41,296 | 24,564 | 52,379 | 32,274 | ||||||
| 60 | 56,247 | 31,983 | 68,096 | 41,116 | 60 | 82,591 | 49,128 | 104,759 | 64,548 | ||||||
| 90 | 84,370 | 47,975 | 102,145 | 61,674 | 90 | 123,887 | 73,692 | 157,138 | 96,822 | ||||||
| 15 | Male | 16,225 | 9226 | 19,643 | 11,860 | 15 | Male | 23,824 | 14,172 | 30,219 | 18,620 | ||||
| 30 | 32,450 | 18,452 | 39,286 | 23,721 | 30 | 47,649 | 28,343 | 60,438 | 37,239 | ||||||
| 60 | 64,900 | 36,904 | 78,573 | 47,441 | 60 | 95,298 | 56,686 | 120,876 | 74,479 | ||||||
| 90 | 97,350 | 55,356 | 117,859 | 71,162 | 90 | 142,947 | 85,029 | 181,314 | 111,718 | ||||||
| Walking | 15 | Female | 11,171 | 13,077 | 14,773 | 22,466 | Walking | 15 | Female | 16,402 | 17,652 | 23,075 | 32,460 | ||
| 30 | 22,341 | 26,155 | 29,545 | 44,933 | 30 | 32,803 | 35,304 | 46,150 | 64,920 | ||||||
| 60 | 44,682 | 52,310 | 59,091 | 89,866 | 60 | 65,607 | 70,607 | 92,301 | 129,840 | ||||||
| 90 | 67,023 | 78,465 | 88,636 | 134,799 | 90 | 98,410 | 105,911 | 138,451 | 194,760 | ||||||
| 15 | Male | 12,889 | 15,089 | 17,045 | 25,923 | 15 | Male | 18,925 | 20,368 | 26,625 | 37,454 | ||||
| 30 | 25,778 | 30,179 | 34,091 | 51,846 | 30 | 37,850 | 40,735 | 53,250 | 74,908 | ||||||
| 60 | 51,556 | 60,357 | 68,181 | 103,691 | 60 | 75,700 | 81,470 | 106,501 | 149,815 | ||||||
| 90 | 77,335 | 90,536 | 102,272 | 155,537 | 90 | 113,550 | 122,205 | 159,751 | 224,723 | ||||||
| Comparison between MEs | Train | Underground | Car | Cycling | Walking | |
|---|---|---|---|---|---|---|
| PM1 | Train | 0.747 | 0.555 | 0.058 | 0.001 | |
| Underground | 0.658 | 0.043 | <0.001 | |||
| Car | 0.018 | <0.001 | ||||
| Cycling | 0.136 | |||||
| Walking | ||||||
| PM2.5 | Train | 0.573 | 1.000 | 0.008 | 0.001 | |
| Underground | 0.582 | 0.023 | 0.003 | |||
| Car | 0.006 | 0.001 | ||||
| Cycling | 0.444 | |||||
| Walking | ||||||
| PM4 | Train | 0.872 | 0.502 | 0.014 | 0.001 | |
| Underground | 0.658 | 0.009 | <0.001 | |||
| Car | 0.003 | <0.001 | ||||
| Cycling | 0.271 | |||||
| Walking | ||||||
| PM10 | Train | 0.936 | 0.809 | 0.011 | 0.001 | |
| Underground | 0.799 | 0.007 | <0.001 | |||
| Car | 0.003 | <0.001 | ||||
| Cycling | 0.340 | |||||
| Walking | ||||||
© 2020 by the authors. Licensee MDPI, Basel, Switzerland. This article is an open access article distributed under the terms and conditions of the Creative Commons Attribution (CC BY) license (http://creativecommons.org/licenses/by/4.0/).
Share and Cite
Borghi, F.; Fanti, G.; Cattaneo, A.; Campagnolo, D.; Rovelli, S.; Keller, M.; Spinazzè, A.; Cavallo, D.M. Estimation of the Inhaled Dose of Airborne Pollutants during Commuting: Case Study and Application for the General Population. Int. J. Environ. Res. Public Health 2020, 17, 6066. https://0-doi-org.brum.beds.ac.uk/10.3390/ijerph17176066
Borghi F, Fanti G, Cattaneo A, Campagnolo D, Rovelli S, Keller M, Spinazzè A, Cavallo DM. Estimation of the Inhaled Dose of Airborne Pollutants during Commuting: Case Study and Application for the General Population. International Journal of Environmental Research and Public Health. 2020; 17(17):6066. https://0-doi-org.brum.beds.ac.uk/10.3390/ijerph17176066
Chicago/Turabian StyleBorghi, Francesca, Giacomo Fanti, Andrea Cattaneo, Davide Campagnolo, Sabrina Rovelli, Marta Keller, Andrea Spinazzè, and Domenico Maria Cavallo. 2020. "Estimation of the Inhaled Dose of Airborne Pollutants during Commuting: Case Study and Application for the General Population" International Journal of Environmental Research and Public Health 17, no. 17: 6066. https://0-doi-org.brum.beds.ac.uk/10.3390/ijerph17176066