Relationship between Firefighter Physical Fitness and Special Ability Performance: Predictive Research Based on Machine Learning Algorithms


Abstract
:1. Introduction
2. Materials and Methods
2.1. Participants
2.2. Test Protocol and Data Collection
2.2.1. Ability Test
2.2.2. Fitness Assessments
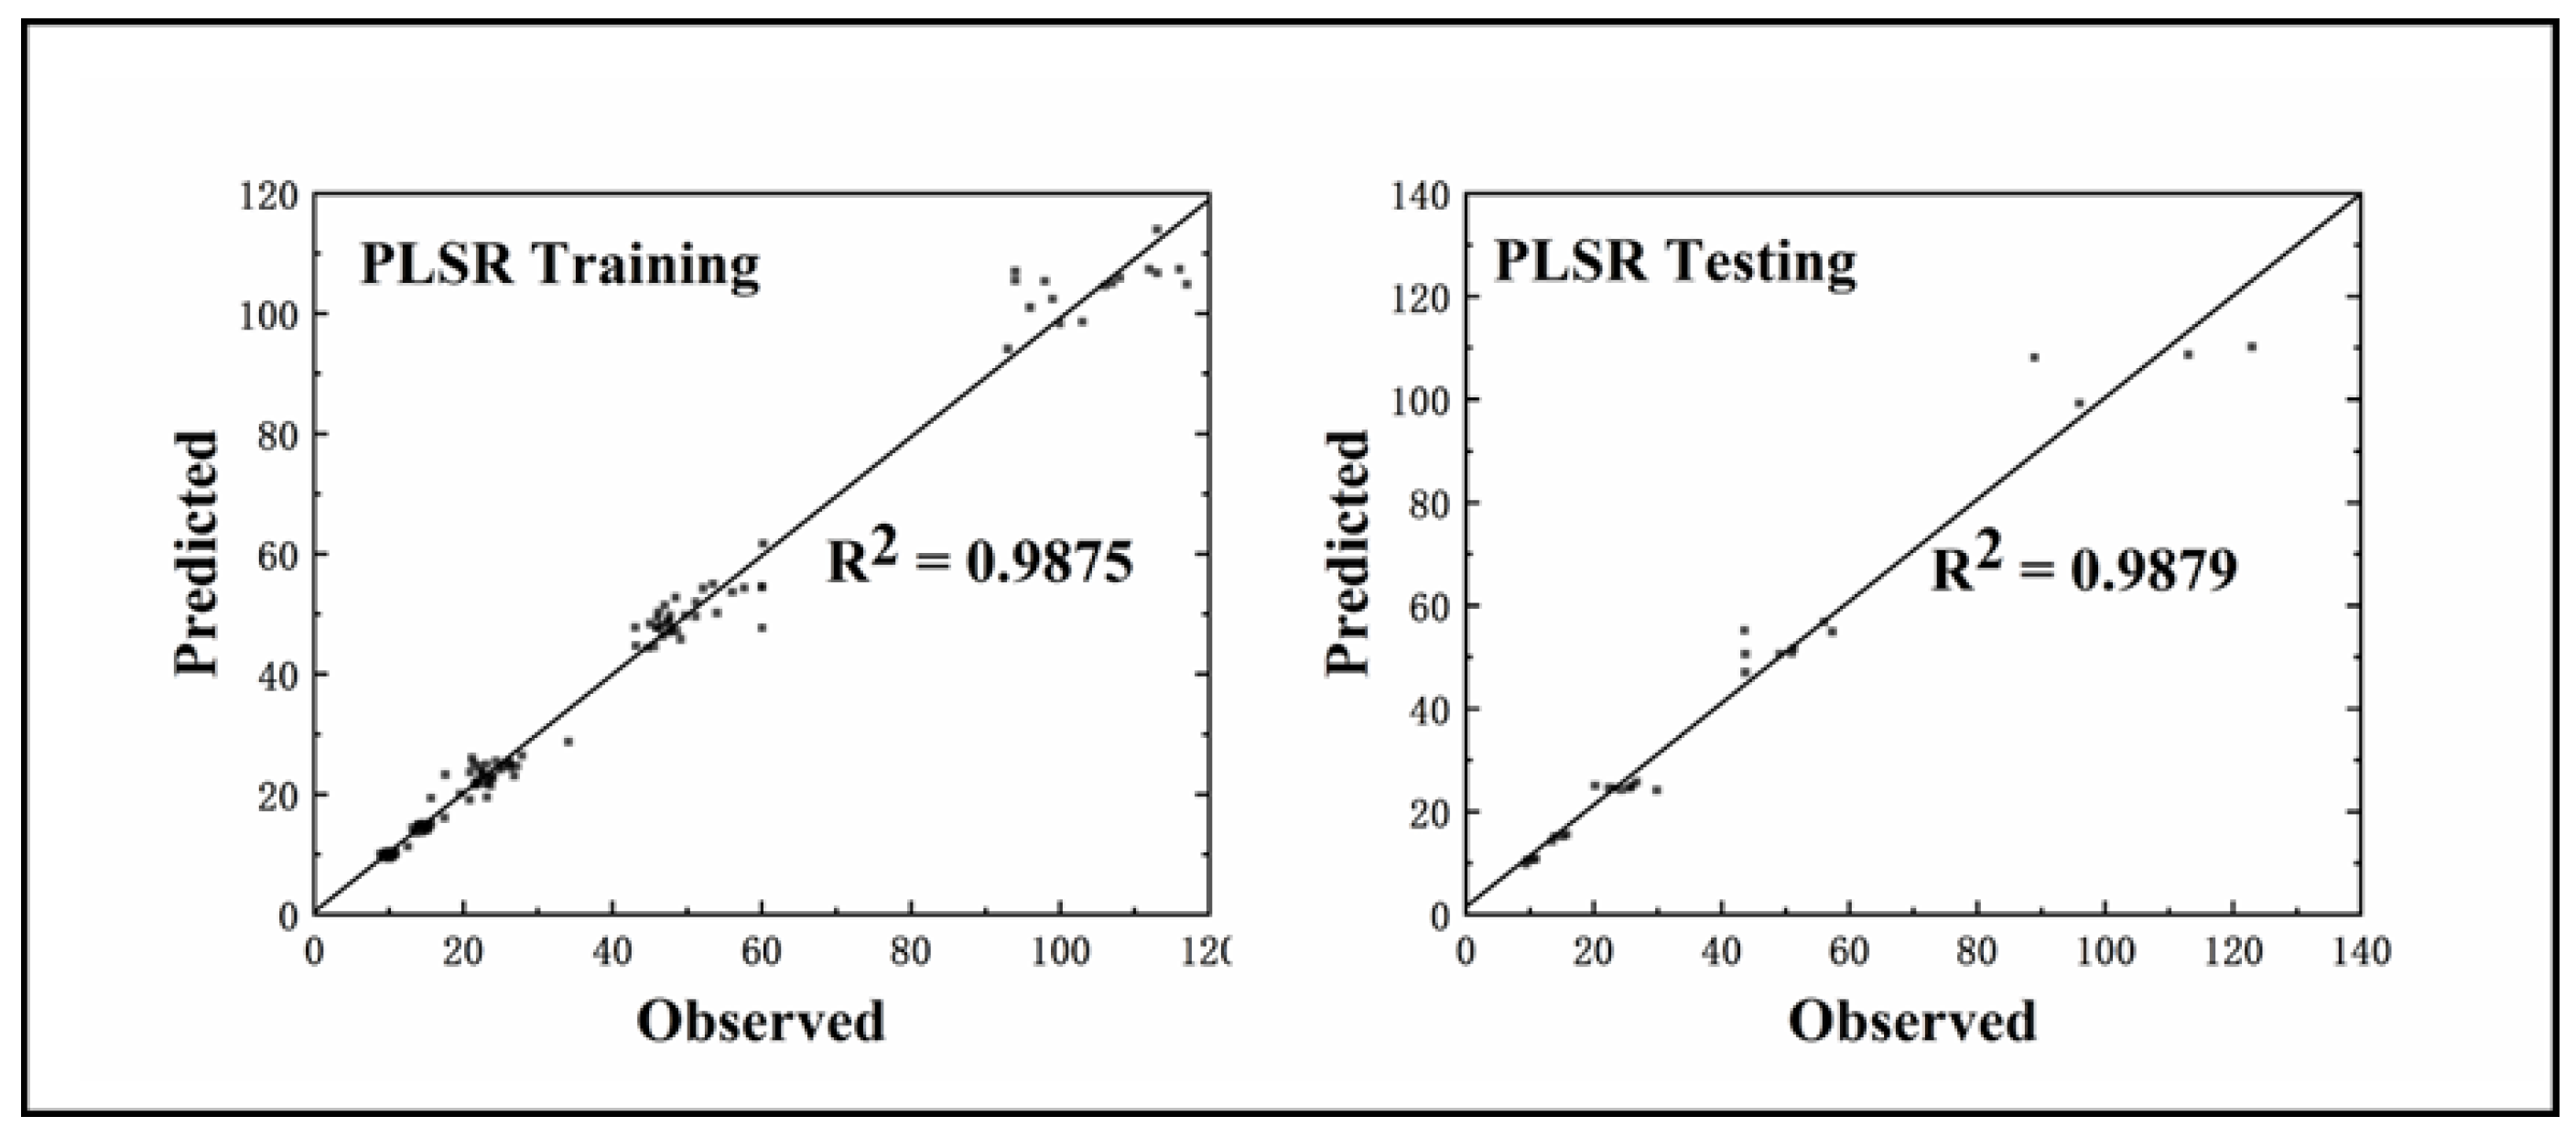
2.3. Partial Least-Squares Regression (PLSR) Prediction Model
3. Results
4. Discussion
5. Conclusions
Author Contributions
Funding
Conflicts of Interest
References
- Mamen, A.; Oseland, H.; Medbø, J.I. A comparison of two physical ability tests for firefighters. Ergonomics 2013, 56, 1558–1568. [Google Scholar] [CrossRef] [PubMed]
- Madrzykowski, D.; Kerber, S.; Kumar, S.; Panindre, P. Wind, fire and high-rises. Mech. Eng. 2010, 132, 22–27. [Google Scholar] [CrossRef]
- Mamen, A.; Heimburg, E.D.; Oseland, H.; Medbø, J.I. Examination of a new functional firefighter fitness test. Int. J. Occup. Saf. Ergon. 2019, 3, 28–40. [Google Scholar] [CrossRef] [PubMed]
- Smith, D.L. Firefighter fitness: Improving performance and preventing injuries and fatalities. Curr. Sports Med. Rep. 2011, 10, 167–172. [Google Scholar] [CrossRef] [Green Version]
- Antolini, M.R.; Weston, Z.J.; Tiidus, P.M. Physical fitness characteristics of a front-line firefighter population. Acta Kinesiol. Univ. Tartu. 2015, 21, 61–74. [Google Scholar] [CrossRef] [Green Version]
- Antolini, M.R. Physical Fitness Characteristics of An Active Firefighter Population Serving An Urban Area. Master’s Thesis, Wilfrid Laurier University, Waterloo, ON, Canada, 2014; pp. 35–46. [Google Scholar]
- Sell, K.M.; Livingston, B. Mid-season physical fitness profile of interagency hotshot firefighters. Int. J. Wildland. Fire. 2012, 21, 773–777. [Google Scholar] [CrossRef]
- Sevild, C.H.; Dyrstad, S.M.; Bru, L.E. Psychological distress and physical-activity levels among people consulting a healthy life centre for lifestyle change. Phys. Act. Health 2020, 4, 76–85. [Google Scholar] [CrossRef]
- Albert, C.M.; Mittleman, M.A.; Chae, C.U.; Lee, I.M.; Hennekens, C.H.; Manson, J.E. Triggering of sudden death from cardiac causes by vigorous exertion. N. Engl. J. Med. 2000, 343, 1355–1361. [Google Scholar] [CrossRef]
- Williams-Bell, F.M.; Villar, R.; Sharratt, M.T.; Hughson, R.L. Physiological demands of the firefighter candidate physical ability test. Med. Sci. Sports Exerc. 2009, 41, 653–662. [Google Scholar] [CrossRef]
- Elsner, K.L.; Kolkhorst, F.W. Metabolic demands of simulated firefighting tasks. Ergonomics 2008, 51, 1418–1425. [Google Scholar] [CrossRef]
- Zhou, H.; Ugbolue, U.C. Is there a relationship between strike pattern and injury during running: A review. Phys. Act. Health 2019, 3, 127–134. [Google Scholar] [CrossRef] [Green Version]
- Nogueira, E.C.; Porto, L.G.; Nogueira, R.M.; Martins, W.R.; Fonseca, R.M.; Lunardi, C.C.; Oliveira, R.J. Body composition is strongly associated with cardiorespiratory fitness in a large Brazilian military firefighter cohort: The Brazilian firefighters study. J. Strength Cond. Res. 2016, 30, 33–38. [Google Scholar] [CrossRef] [PubMed]
- Heimburg, E.; Ingulf Medbø, J.; Sandsund, M.; Reinertsen, R.E. Performance on a work-simulating firefighter test versus approved laboratory tests for firefighters and applicants. Int. J. Occup. Saf. Ergon. 2013, 19, 227–243. [Google Scholar] [CrossRef] [PubMed] [Green Version]
- Petersen, A.; Payne, W.; Phillips, M.; Netto, K.; Nichols, D.; Aisbett, B. Validity and relevance of the pack hike wildland firefighter work capacity test: A review. Ergonomics 2010, 53, 1276–1285. [Google Scholar] [CrossRef] [PubMed]
- Perroni, F.; Tessitore, A.; Cortis, C.; Lupo, C.; D’Artibale, E.; Cignitti, L.; Capranica, L. Energy cost and energy sources during a simulated firefighting activity. J. Strength Cond. Res. 2010, 24, 3457–3463. [Google Scholar] [CrossRef] [PubMed]
- Heimburg, E.D.; Rasmussen, A.K.R.; Medbø, J.I. Physiological responses of firefighters and performance predictors during a simulated rescue of hospital patients. Ergonomics 2006, 49, 111–126. [Google Scholar] [CrossRef]
- Sothmann, M.; Saupe, K.; Raven, P.; Pawelczyk, J.; Davis, P.; Dotson, C.; Landy, F.; Siliunas, M. Oxygen consumption during fire suppression: Error of heart rate estimation. Ergonomics 1991, 34, 1469–1474. [Google Scholar] [CrossRef]
- Misner, J.; Boileau, R.; Plowman, S. Development of placement tests for firefighting: A long-term analysis by race and sex. Appl. Ergon. 1989, 20, 218–224. [Google Scholar] [CrossRef]
- Zhou, B.F. Effect of body mass index on all-cause mortality and incidence of cardiovascular diseases--report for meta-analysis of prospective studies open optimal cut-off points of body mass index in Chinese adults. Biomed. Environ. Sci. 2002, 15, 245–252. [Google Scholar] [CrossRef]
- Kuehl, K.S.; Kisbu-Sakarya, Y.; Elliot, D.L.; Moe, E.L.; DeFrancesco, C.A.; MacKinnon, D.P.; Lockhart, G.; Goldberg, L.; Kuehl, H.E. Body mass index is a predictor of fire fighter injury and worker compensation claims. J. Occup. Environ. Med. 2012, 54, 579–582. [Google Scholar] [CrossRef] [Green Version]
- Baur, D.M.; Christophi, C.A.; Tsismenakis, A.J.; Cook, E.F.; Kales, S.N. Cardiorespiratory fitness predicts cardiovascular risk profiles in career firefighters. J. Occup. Environ. Med. 2011, 53, 1155–1160. [Google Scholar] [CrossRef] [PubMed]
- Kolsgaard, M.L.P.; Joner, G.; Brunborg, C.; Anderssen, S.A.; Tonstad, S.; Andersen, L.F. Reduction in BMI z-score and improvement in cardiometabolic risk factors in obese children and adolescents. The Oslo Adiposity Intervention Study-a hospital/public health nurse combined treatment. BMC Pediatrics 2011, 11, 1–8. [Google Scholar] [CrossRef] [PubMed] [Green Version]
- Myers, J.; Prakash, M.; Froelicher, V.; Do, D.; Partington, S.; Atwood, J.E. Exercise capacity and mortality among men referred for exercise testing. N. Engl. J. Med. 2002, 346, 793–801. [Google Scholar] [CrossRef] [PubMed]
- Nazari, G.; MacDermid, J.C.; Sinden, K.E.; Overend, T.J. Comparison of Canadian firefighters and healthy controls based on submaximal fitness testing and strength considering age and gender. Int. J. Occup. Saf. Ergon. 2019, 25, 1–7. [Google Scholar] [CrossRef]
- Boyce, R.W.; Ciulla, S.; Jones, G.R.; Boone, E.L.; Elliott, S.M.; Combs, C.S. Muscular strength and body composition comparison between the charlotte-mecklenburg fire and police departments. Int. J. Exerc. Sci. 2008, 1, 5. [Google Scholar] [CrossRef]
- Kleinberg, C.R.; Ryan, E.D.; Tweedell, A.J.; Barnette, T.J.; Wagoner, C.W. Influence of lower extremity muscle size and quality on stair-climb performance in career firefighters. J. Strength Cond. Res. 2016, 30, 1613–1618. [Google Scholar] [CrossRef]
- Giuliani, H.K.; Gerstner, G.R.; Mota, J.A.; Ryan, E.D. Influence of demographic characteristics and muscle strength on the occupational fatigue exhaustion recovery scale in career firefighters. Occup. Environ. Med. 2020, 62, 223–226. [Google Scholar] [CrossRef]
- Wold, S.; Ruhe, A.; Wold, H.; Dunn, I. The collinearity problem in linear regression. The partial least squares (PLS) approach to generalized inverses. SIAM J. Sci. Comput. 1984, 5, 735–743. [Google Scholar] [CrossRef] [Green Version]
- Mei, Q.; Gu, Y.; Xiang, L.; Baker, J.S.; Fernandez, J. Foot pronation contributes to altered lower extremity loading after long distance running. Front. Physiol. 2019, 10, 573. [Google Scholar] [CrossRef]
- Mei, Q.; Gu, Y.; Xiang, L.; Yu, P.; Gao, Z.; Shim, V.; Fernandez, J. Foot shape and plantar pressure relationships in shod and barefoot populations. Biomech. Model. Mechan. 2019, 1–14. [Google Scholar] [CrossRef]
- Mevik, B.H.; Cederkvist, H.R. Mean squared error of prediction (MSEP) estimates for principal component regression (PCR) and partial least squares regression (PLSR). J. Chemometr. 2004, 18, 422–429. [Google Scholar] [CrossRef]
- Telford, R.M.; Telford, R.D.; Cochrane, T.; Cunningham, R.B.; Olive, L.S.; Davey, R. The influence of sport club participation on physical activity, fitness and body fat during childhood and adolescence: The look longitudinal study. J. Sci. Med. Sport 2016, 19, 400–406. [Google Scholar] [CrossRef] [PubMed] [Green Version]
- Myint, P.K.; Kwok, C.S.; Luben, R.N.; Wareham, N.J.; Khaw, K.T. Body fat percentage, body mass index and waist-to-hip ratio as predictors of mortality and cardiovascular disease. Heart 2014, 100, 1613–1619. [Google Scholar] [CrossRef] [PubMed]
- López-Alvarenga, J.C.; Montesinos-Cabrera, R.A.; Velázquez-Alva, C.; González-Barranco, J. Short stature is related to high body fat composition despite body mass index in a Mexican population. Arch. Med. Res. 2003, 34, 137–140. [Google Scholar] [CrossRef]
- Michaelides, M.A.; Parpa, K.M.; Thompson, J.; Brown, B. Predicting performance on a firefghter’s ability test from fitness parameters. Res. Q. Exerc. Sport 2008, 79, 468–475. [Google Scholar] [CrossRef]
- Michaelides, M.A.; Parpa, K.M.; Henry, L.J.; Thompson, G.B.; Brown, B.S. Assessment of physical fitness aspects and their relationship to firefighters’ job abilities. J. Strength Cond. Res. 2011, 25, 956–965. [Google Scholar] [CrossRef]
- Rhea, M.R.; Alvar, B.A.; Gray, R. Physical fitness and job performance of firefighters. J. Strength Cond. Res. 2004, 18, 348–352. [Google Scholar] [CrossRef]
- Williford, H.N.; Duey, W.J.; Olson, M.S.; Howard, R.; Wang, N. Relationship between fire fighting suppression tasks and physical fitness. Ergonomics 1999, 42, 1179–1186. [Google Scholar] [CrossRef]
- Davis, P.O.; Dotson, C.O.; Santa Maria, D.L. Relationship between simulated fire fighting tasks and physical performance measures. Med. Sci. Sports Exerc. 1982, 14, 65–71. [Google Scholar] [CrossRef]
- Technical committee of Fire Service Occupational Safety and Health. NFPA 1582: Standard on Comprehensive Occupational Medical Program for Fire Departments; National Fire Protection Association: Quincy, MA, USA, 2017. [Google Scholar]
- Yang, J.; Teehan, D.; Farioli, A.; Baur, D.M.; Smith, D.; Kales, S.N. Sudden cardiac death among firefighters ≤45 years of age in the United States. Am. J. Cardiol. 2013, 112, 1962–1967. [Google Scholar] [CrossRef] [Green Version]
- Smith, D.L.; DeBlois, J.P.; Kales, S.N.; Horn, G.P. Cardiovascular strain of firefighting and the risk of sudden cardiac events. Exerc. Sport Sci. Rev. 2016, 44, 90–97. [Google Scholar] [CrossRef] [PubMed]
- Gledhill, N.; Jamnik, V. Characterization of the physical demands of firefighting. Can. J. Appl. Sport Sci. 1992, 17, 207. [Google Scholar] [CrossRef]
- Stone, B.L.; Alvar, B.A.; Orr, R.M.; Lockie, R.G.; Johnson, Q.R.; Goatcher, J.; Dawes, J.J. Impact of an 11-Week Strength and Conditioning Program on Firefighter Trainee Fitness. Sustainability 2020, 12, 6541. [Google Scholar] [CrossRef]


| X | X1 (kg) | X2 (mL/kg/min) | X3 (%) | X4 (W) | X5 (W) |
|---|---|---|---|---|---|
| Xave | 69 | 46.85 | 14.655 | 675.35 | 1705 |
| Xmax | 90 | 62 | 22.2 | 921 | 2564 |
| Xmin | 56 | 29 | 7.7 | 483 | 1408 |
| Xdif | 34 | 33 | 14.5 | 438 | 1156 |
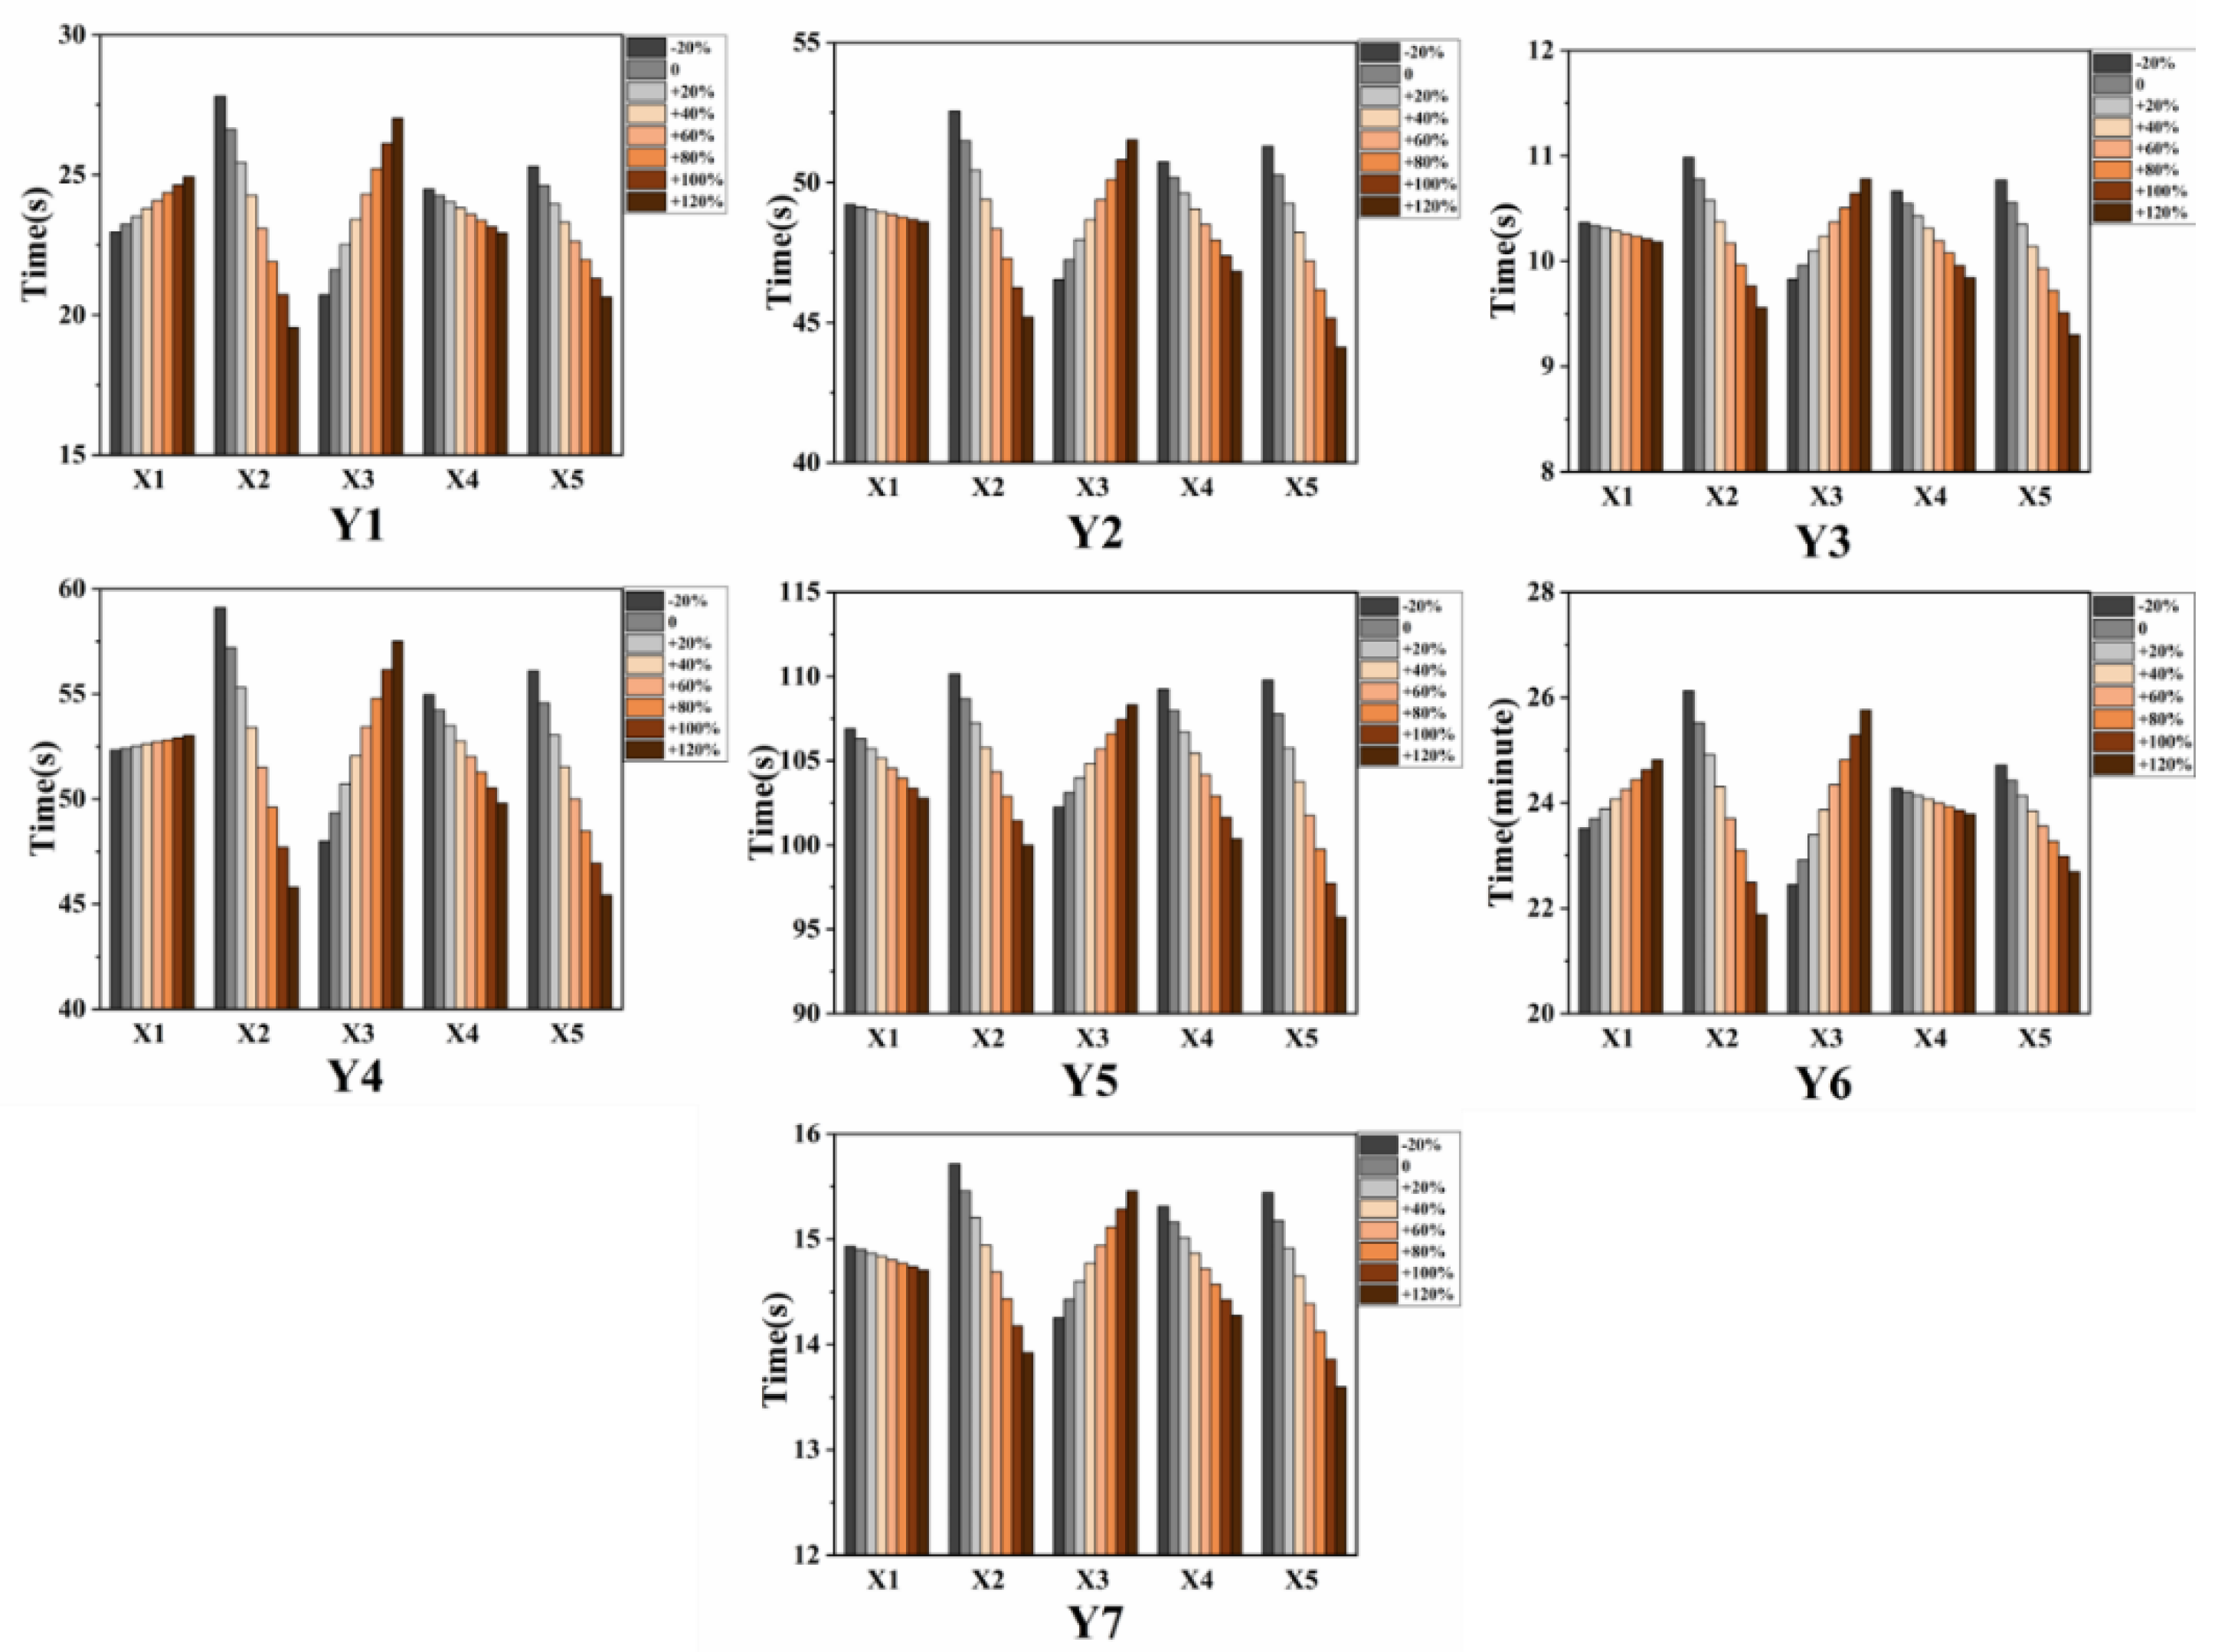
| X | X1 (kg) | X2 (mL/kg/min) | X3 (%) | X4 (W) | X5 (W) |
|---|---|---|---|---|---|
| Xmin − 20% Xdif | 49.2 | 22.4 | 4.8 | 395.4 | 1176.8 |
| Xmin | 56 | 29 | 7.7 | 483 | 1408 |
| Xmin + 20% Xdif | 62.8 | 35.6 | 10.6 | 570.6 | 1639.2 |
| Xmin + 40% Xdif | 69.6 | 42.2 | 13.5 | 658.2 | 1870.4 |
| Xmin + 60% Xdif | 76.4 | 48.8 | 16.4 | 745.8 | 2101.6 |
| Xmin + 80% Xdif | 83.2 | 55.4 | 19.3 | 833.4 | 2332.8 |
| Xmax | 90 | 62 | 22.2 | 921 | 2564 |
| Xmin + 120% Xdif | 96.8 | 68.6 | 25.1 | 1008.6 | 2795.2 |
Publisher’s Note: MDPI stays neutral with regard to jurisdictional claims in published maps and institutional affiliations. |
© 2020 by the authors. Licensee MDPI, Basel, Switzerland. This article is an open access article distributed under the terms and conditions of the Creative Commons Attribution (CC BY) license (http://creativecommons.org/licenses/by/4.0/).
Share and Cite
Xu, D.; Song, Y.; Meng, Y.; István, B.; Gu, Y. Relationship between Firefighter Physical Fitness and Special Ability Performance: Predictive Research Based on Machine Learning Algorithms. Int. J. Environ. Res. Public Health 2020, 17, 7689. https://0-doi-org.brum.beds.ac.uk/10.3390/ijerph17207689
Xu D, Song Y, Meng Y, István B, Gu Y. Relationship between Firefighter Physical Fitness and Special Ability Performance: Predictive Research Based on Machine Learning Algorithms. International Journal of Environmental Research and Public Health. 2020; 17(20):7689. https://0-doi-org.brum.beds.ac.uk/10.3390/ijerph17207689
Chicago/Turabian StyleXu, Datao, Yang Song, Yao Meng, Bíró István, and Yaodong Gu. 2020. "Relationship between Firefighter Physical Fitness and Special Ability Performance: Predictive Research Based on Machine Learning Algorithms" International Journal of Environmental Research and Public Health 17, no. 20: 7689. https://0-doi-org.brum.beds.ac.uk/10.3390/ijerph17207689