Application of Geostatistical Analysis and Random Forest for Source Analysis and Human Health Risk Assessment of Potentially Toxic Elements (PTEs) in Arable Land Soil

Abstract
: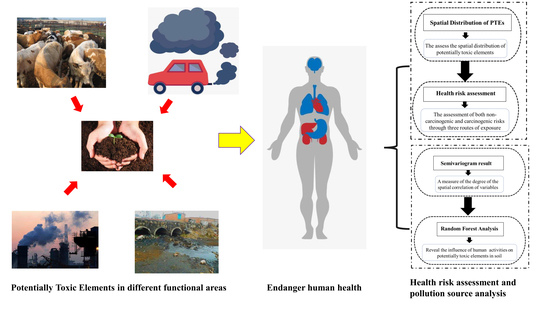
1. Introduction
2. Materials and Methods
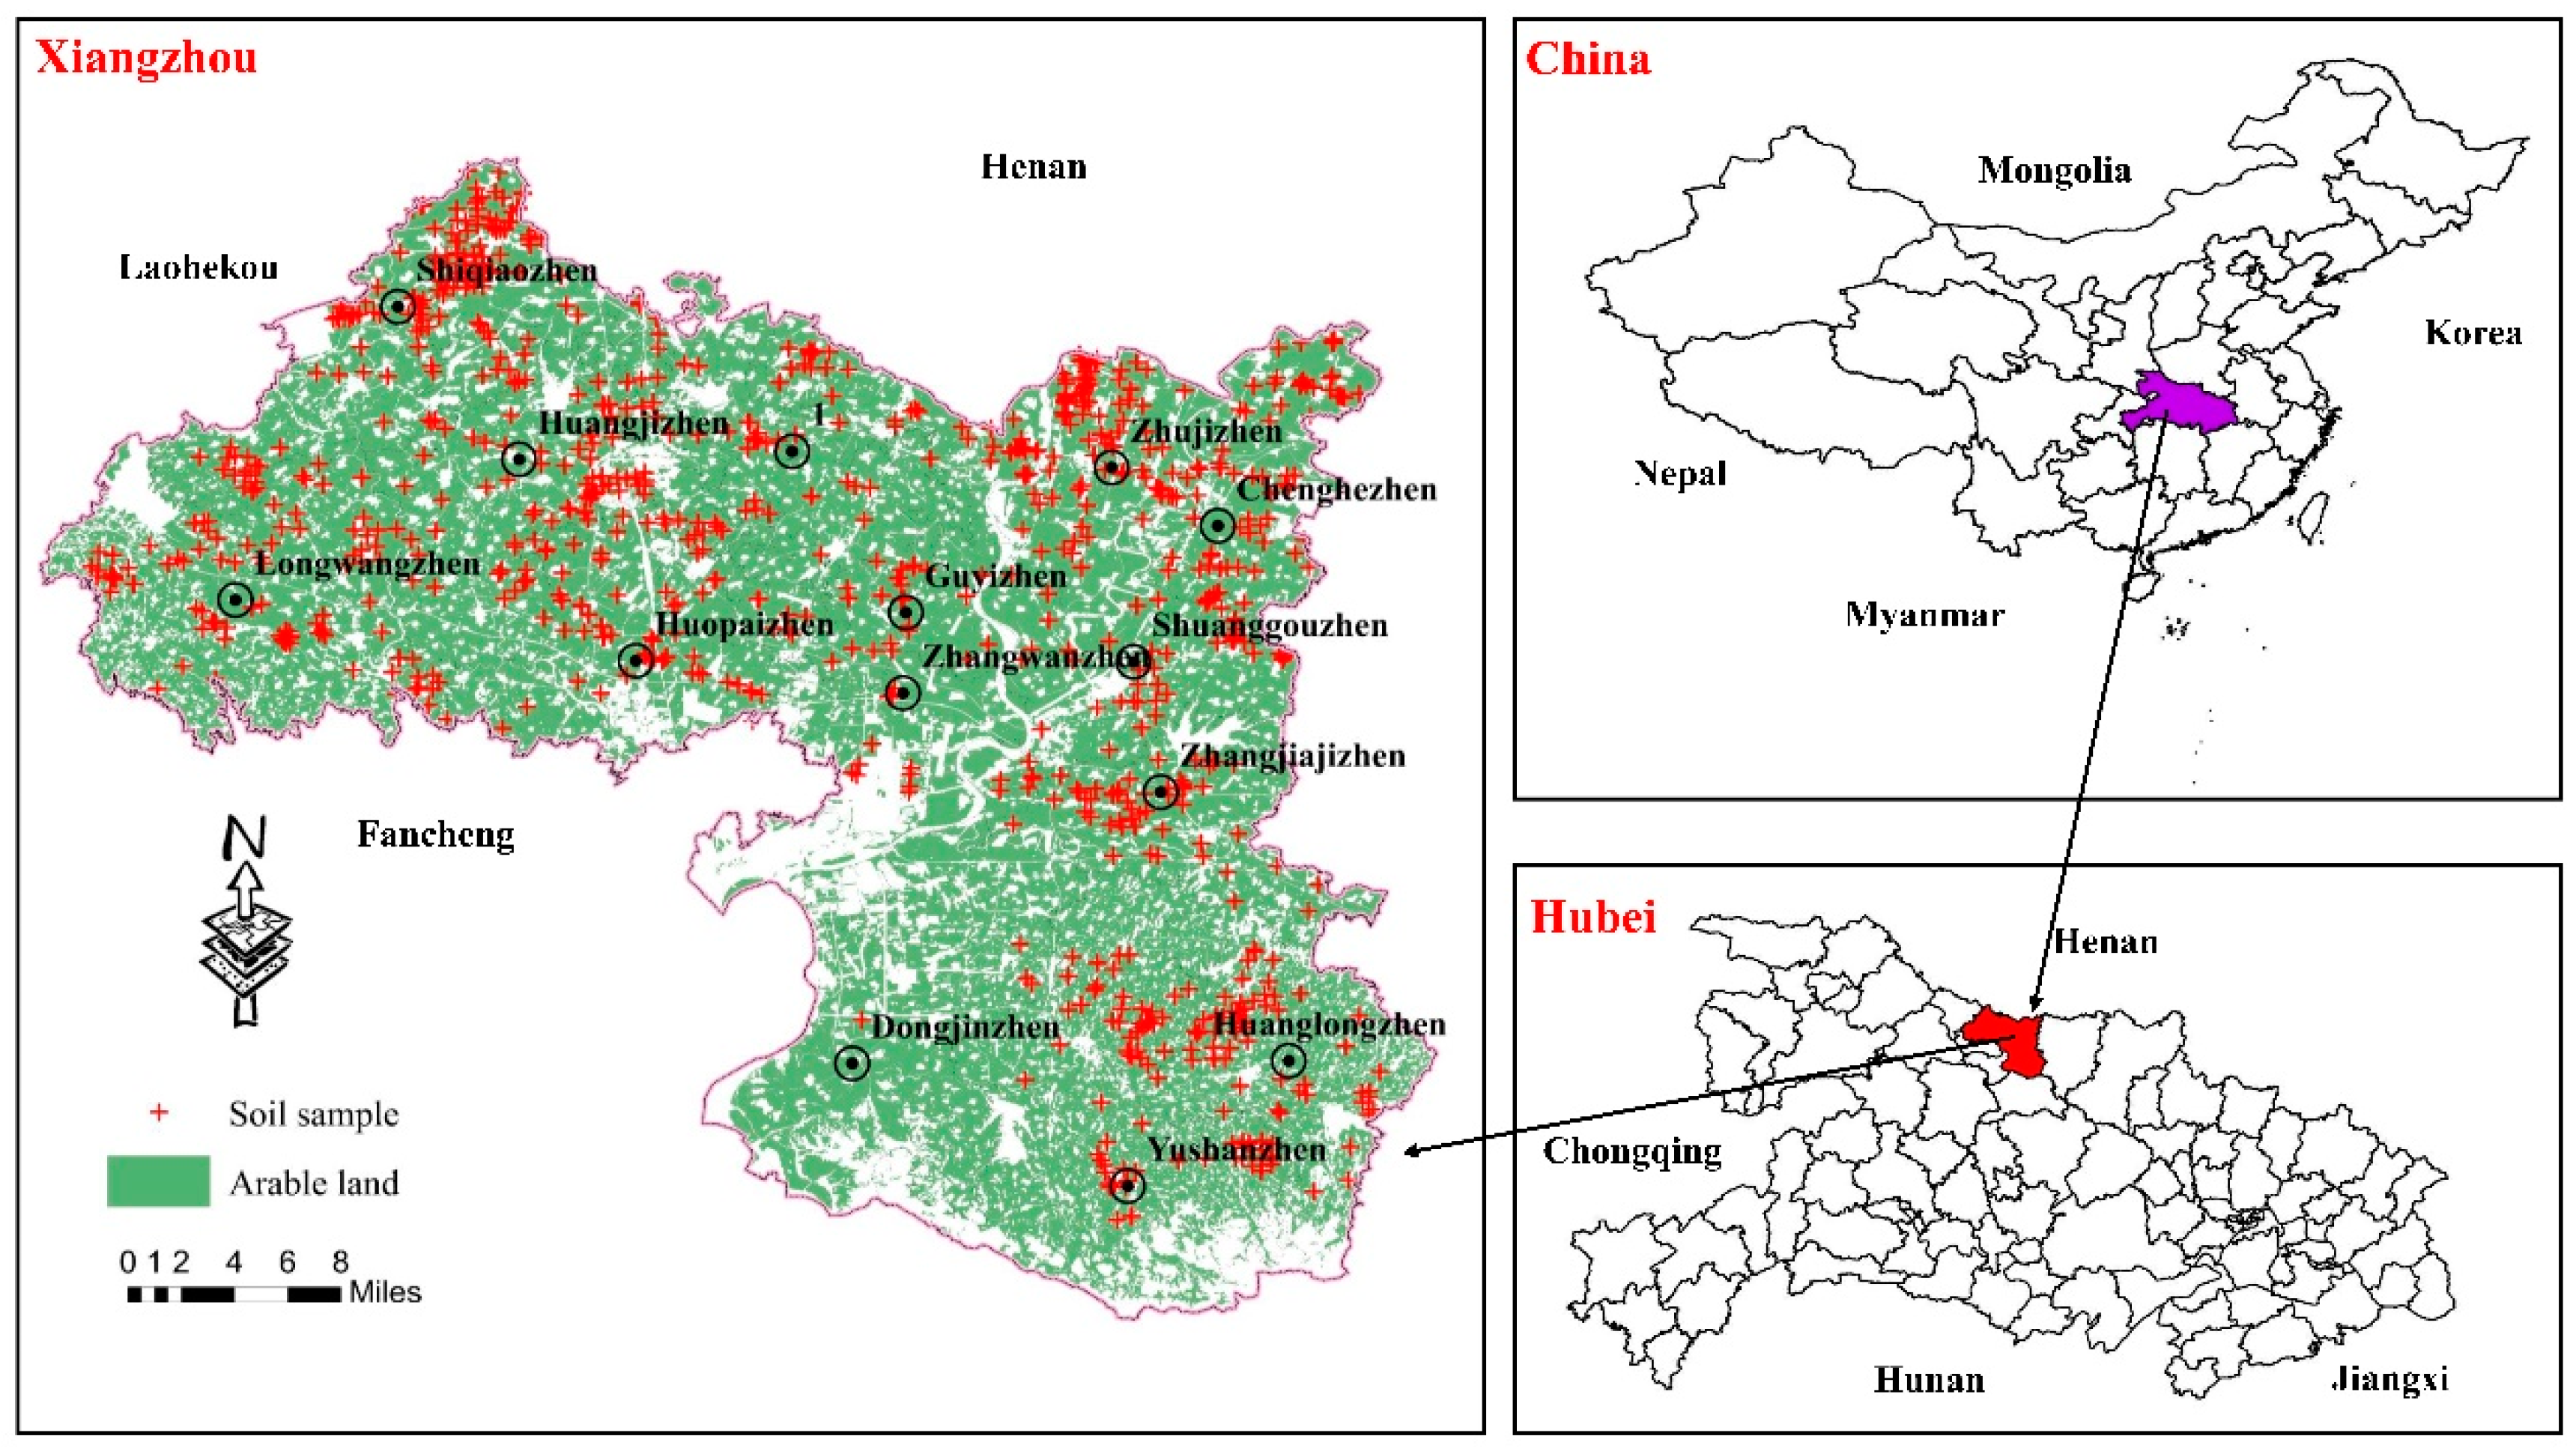
2.1. Study Location
2.2. Sampling and Pretreatment
2.3. Digestion of Soil Samples
2.4. Analytical Procedure
2.5. Health Risk Assessment Methods and Indicators
2.5.1. Dose–Response Assessment
2.5.2. Exposure Assessment
2.5.3. Risk Characterization
- 1.
- Non-carcinogenic risk
- 2.
- Carcinogenic risk
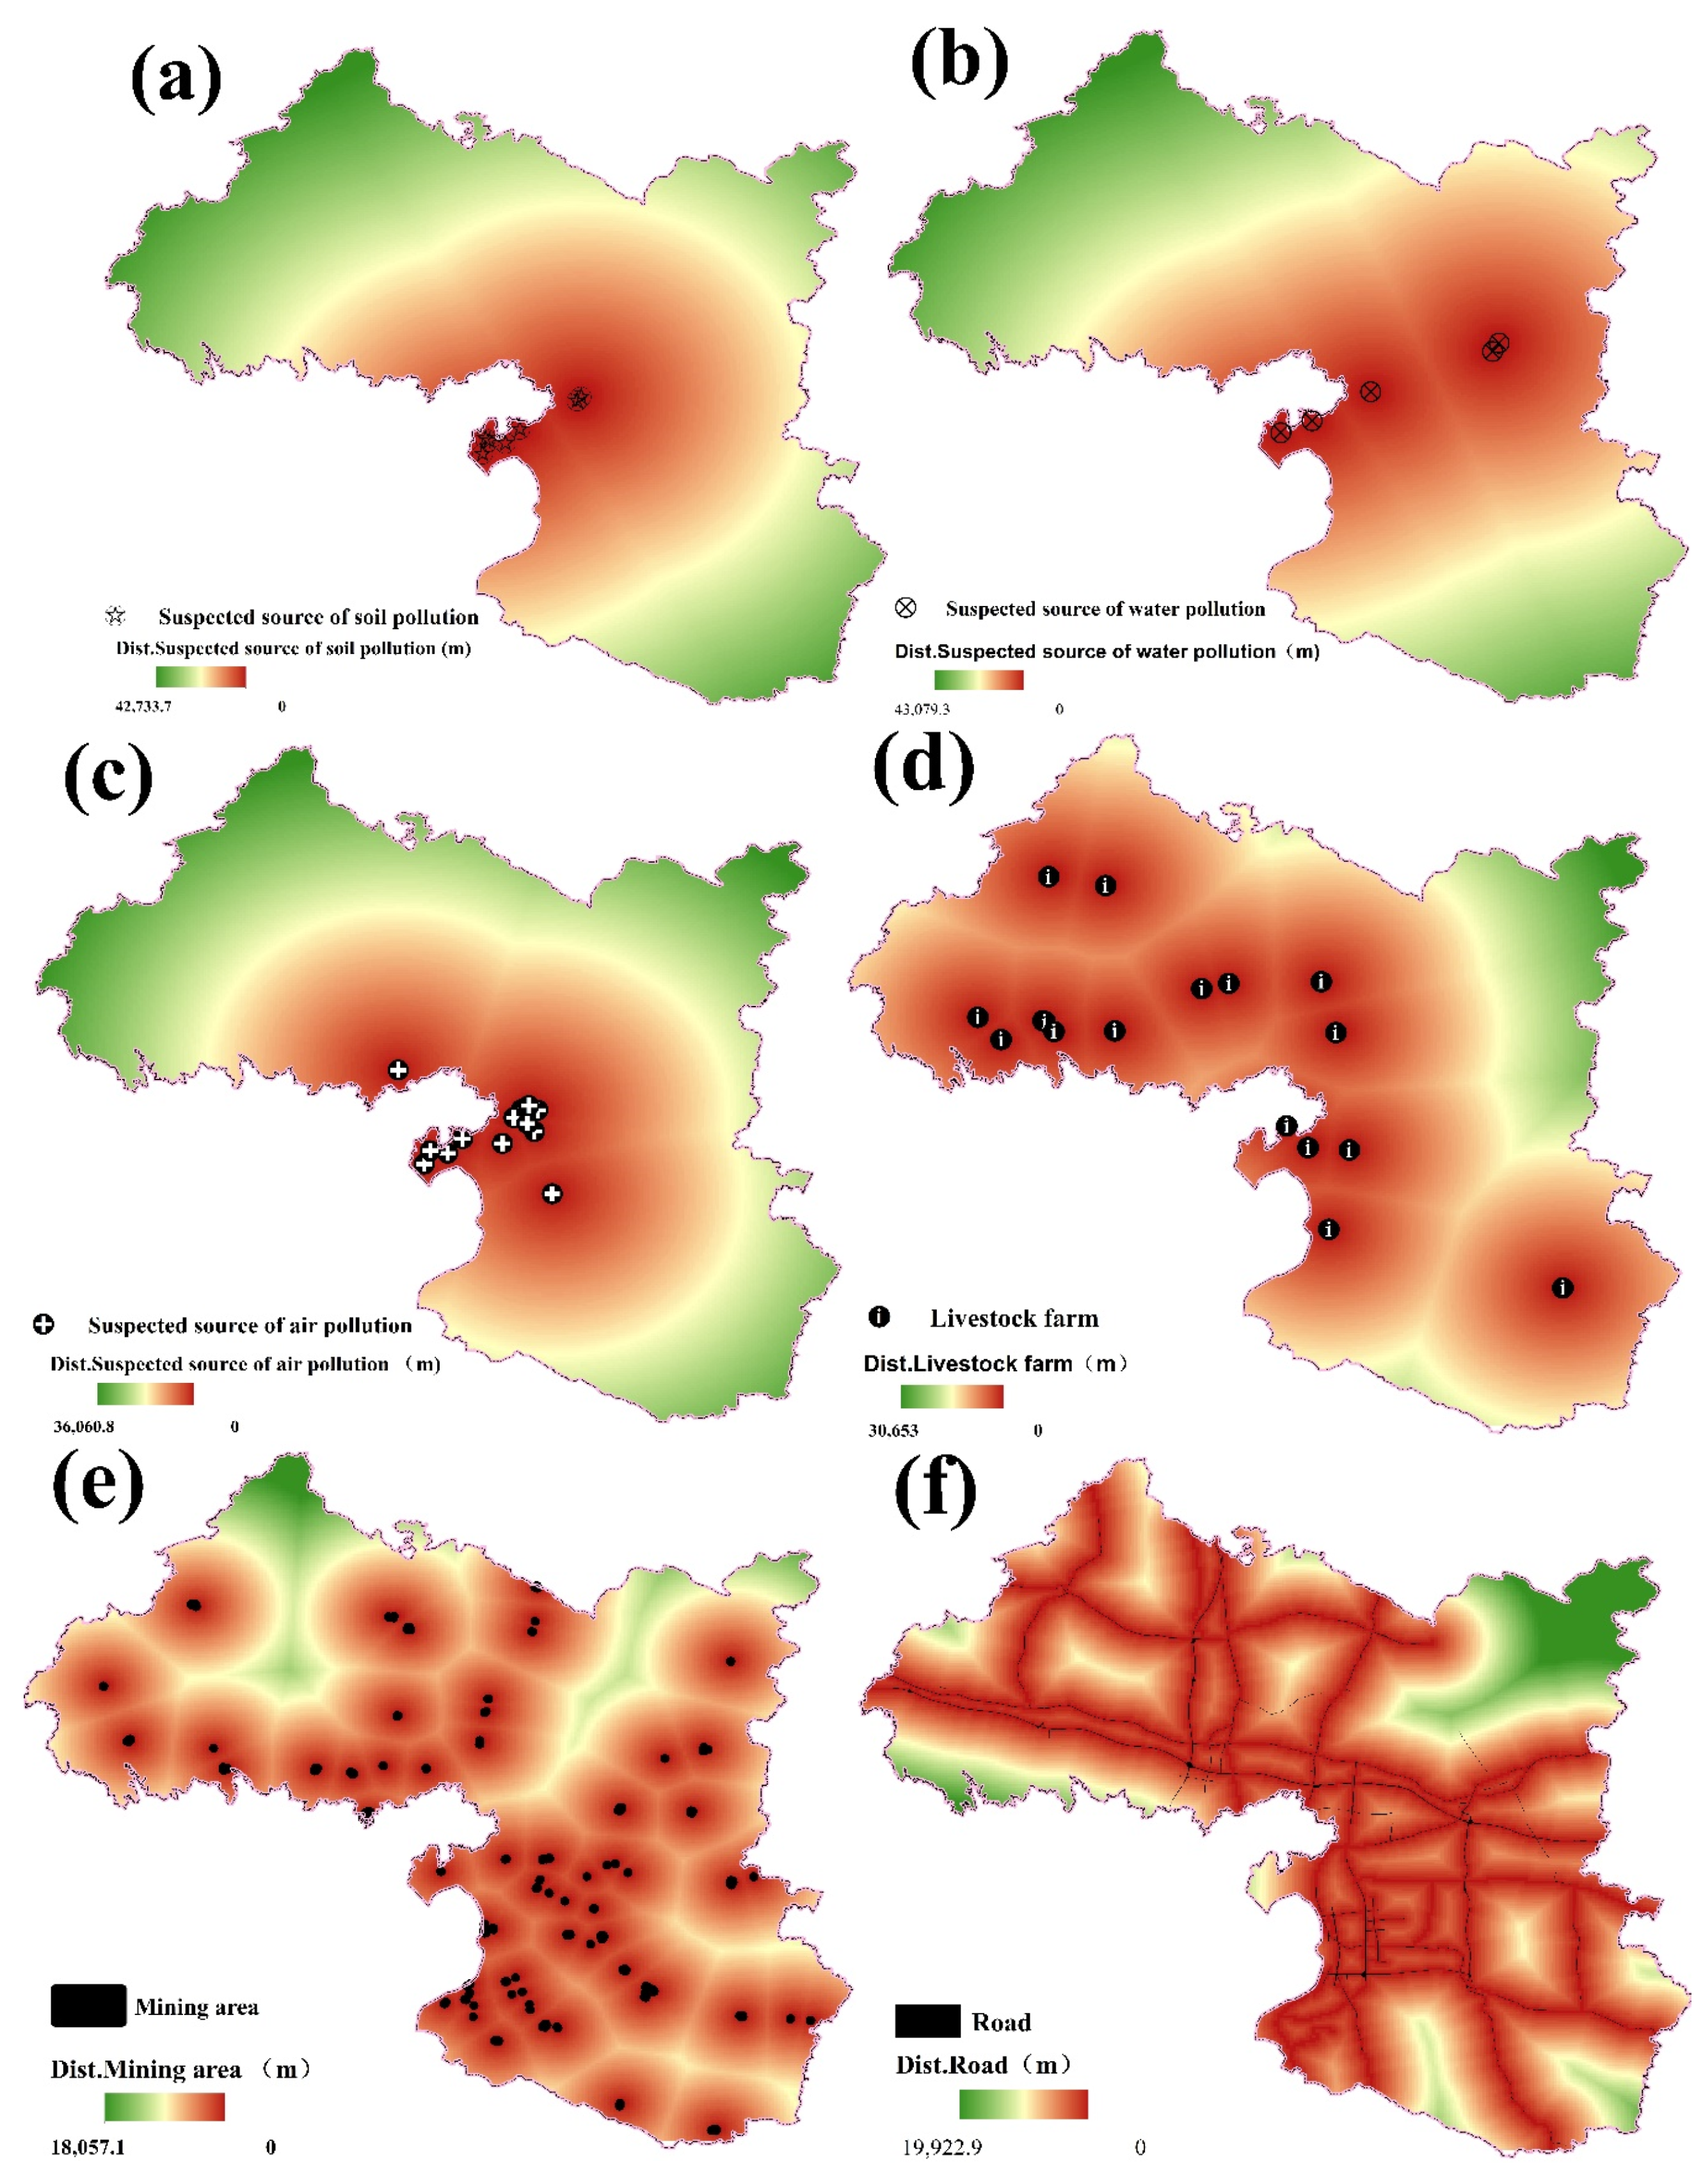
2.6. Pre-Determination of Suspected Pollution Sources
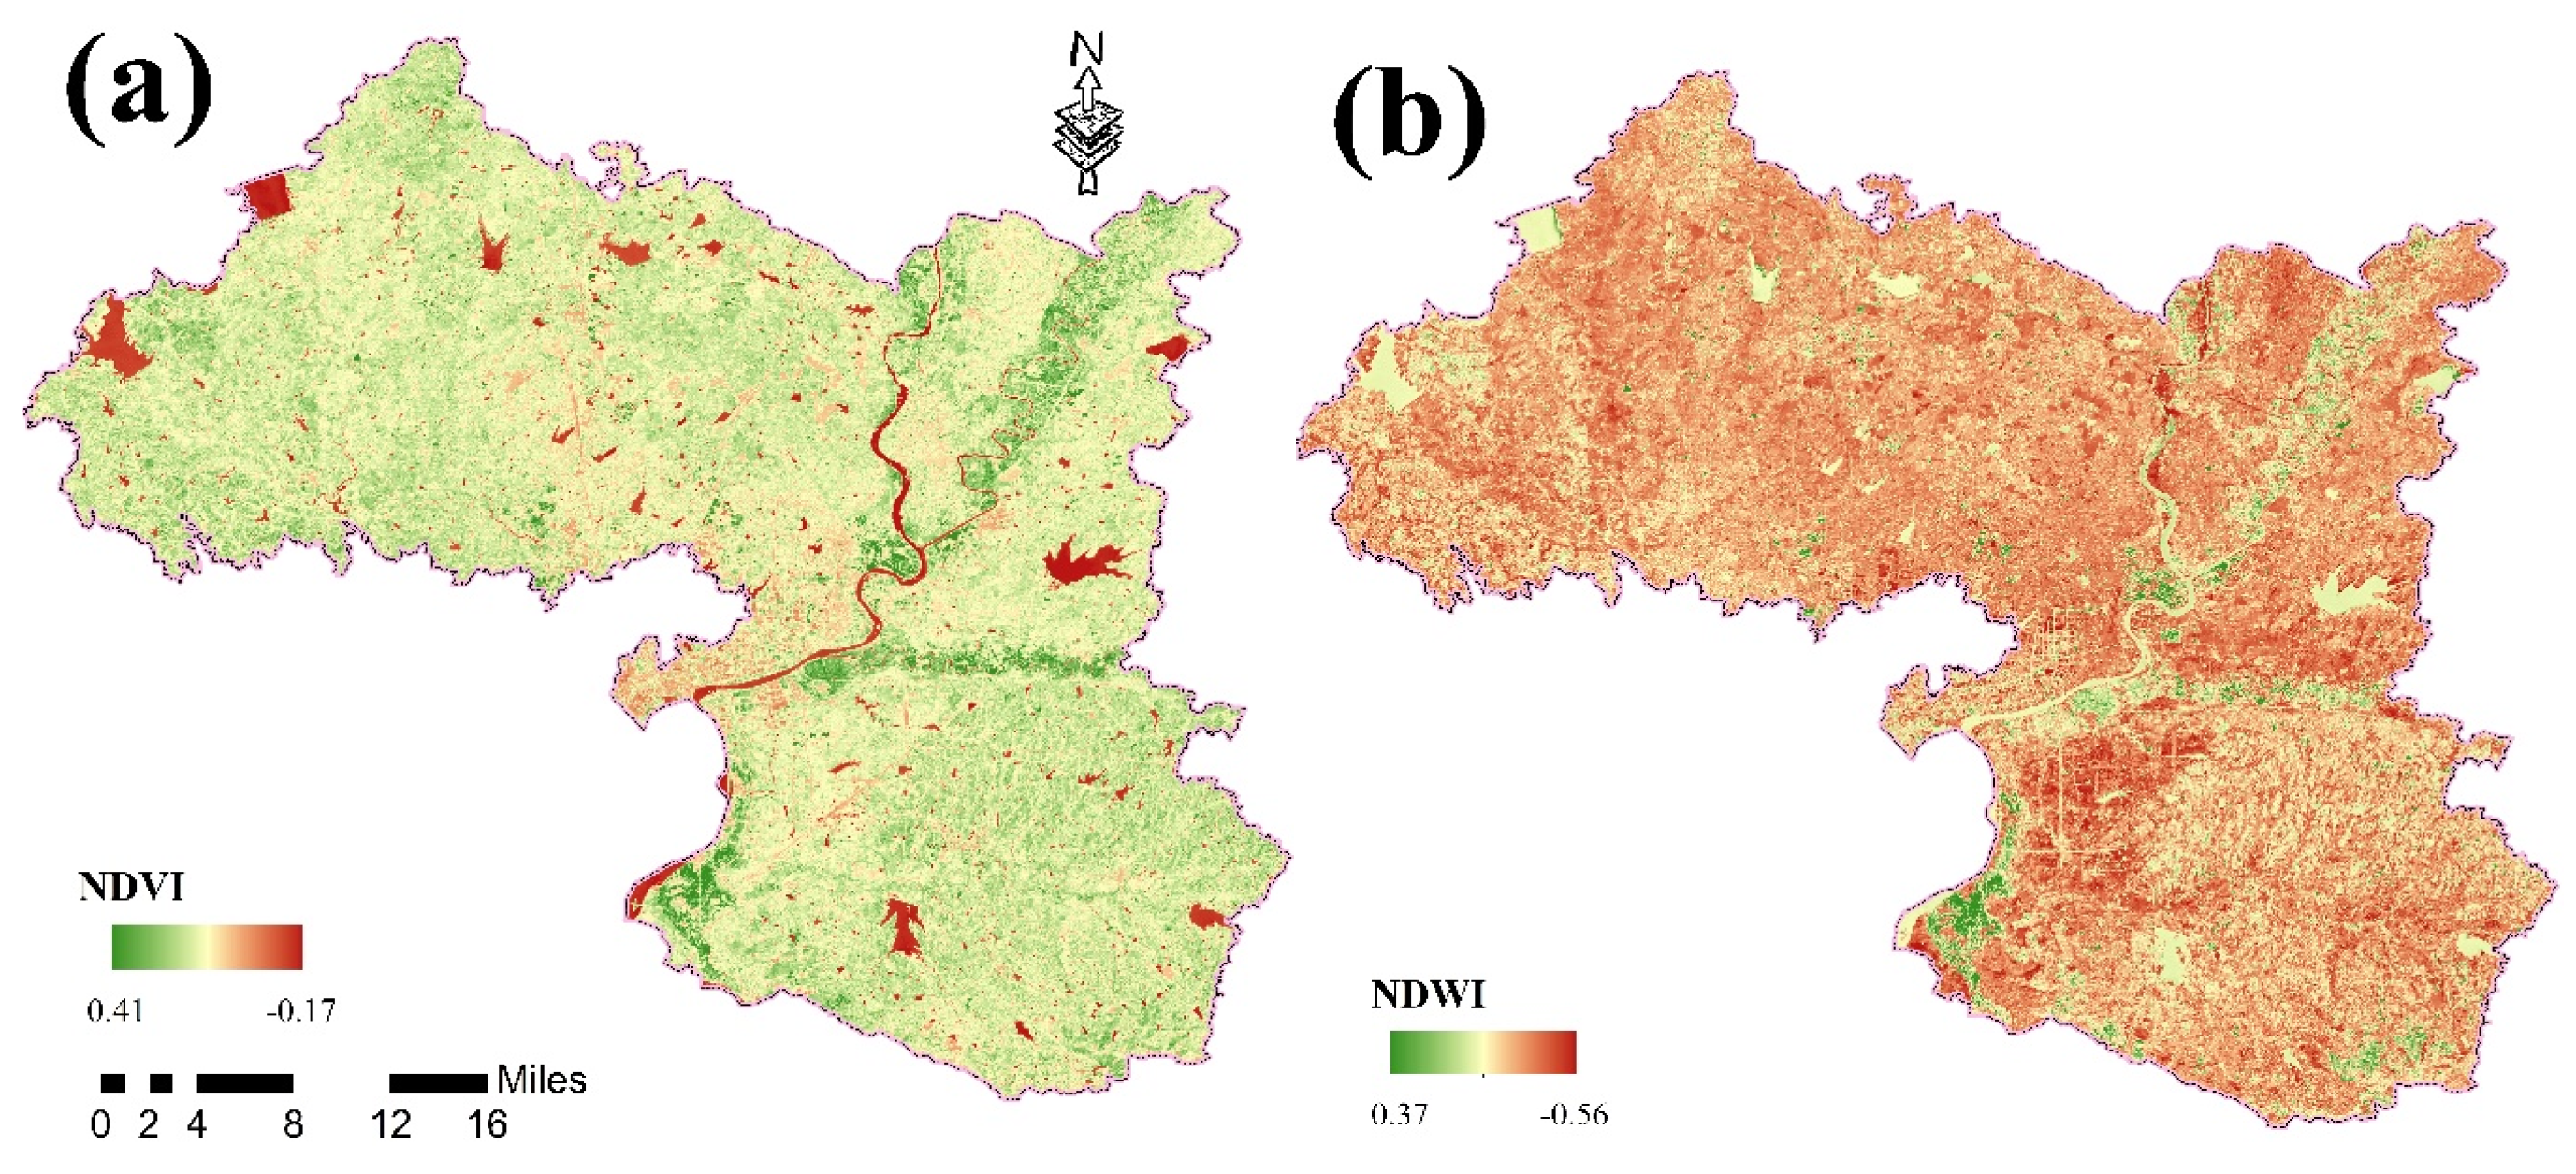
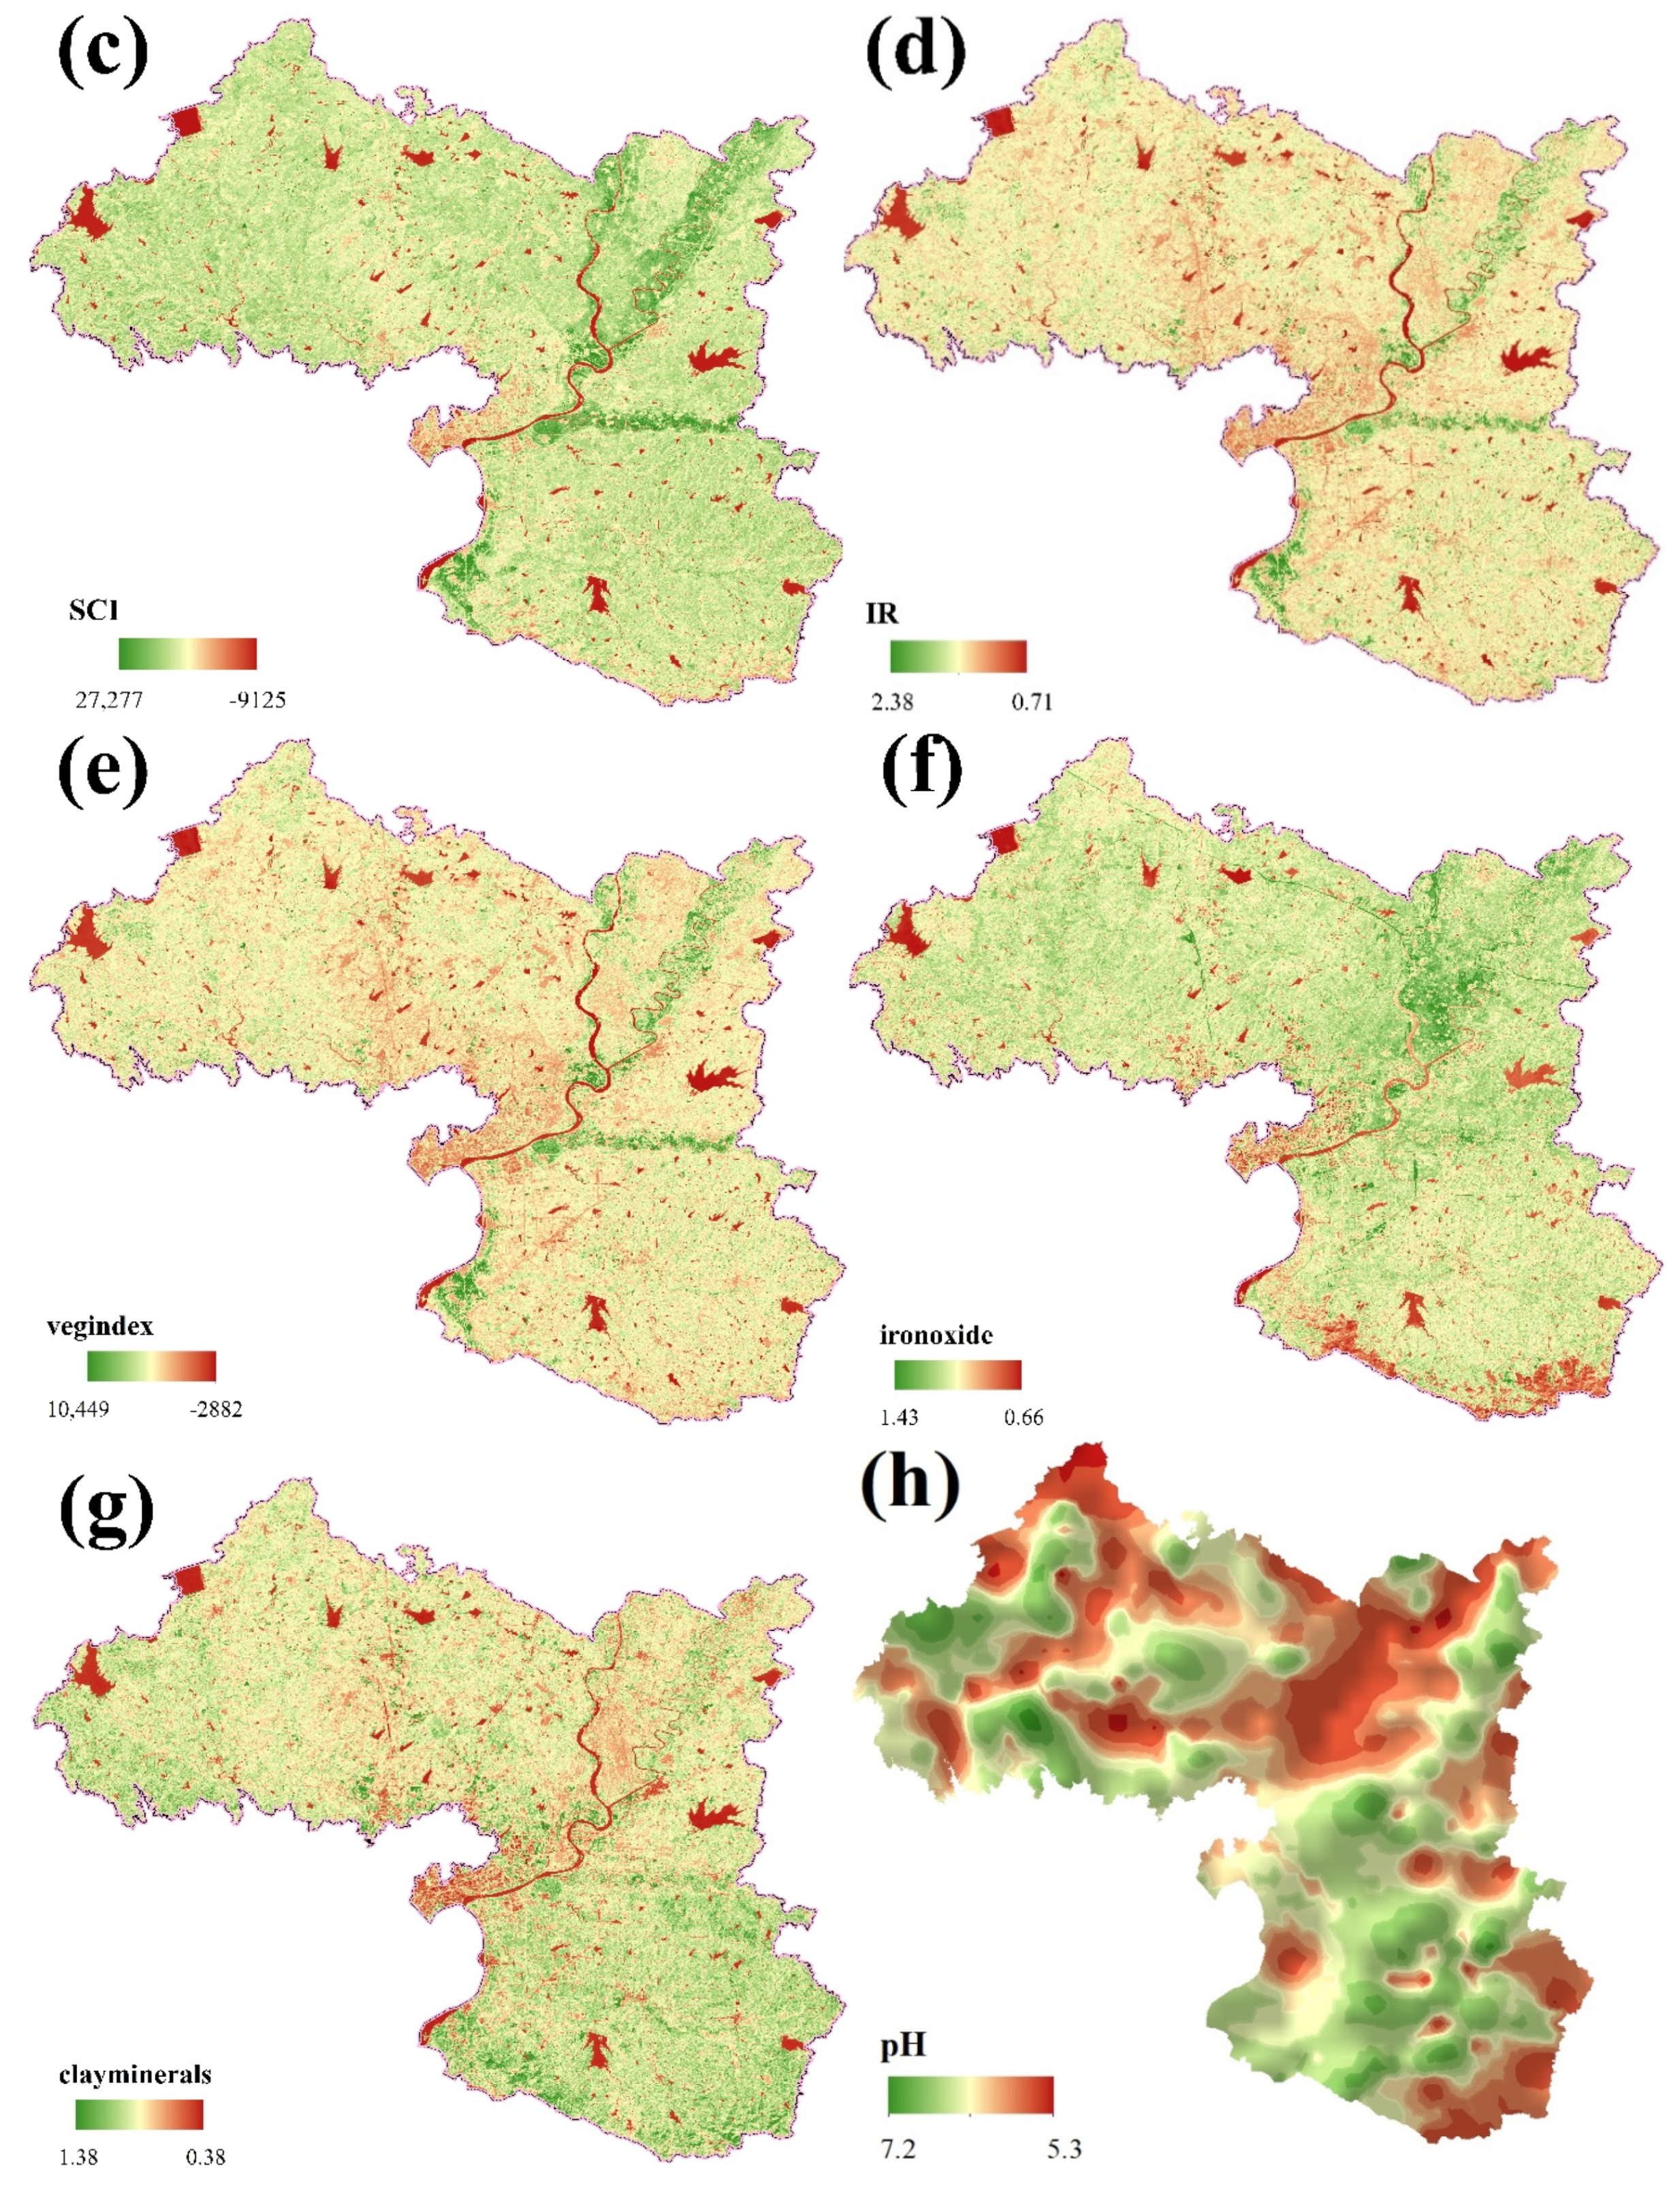
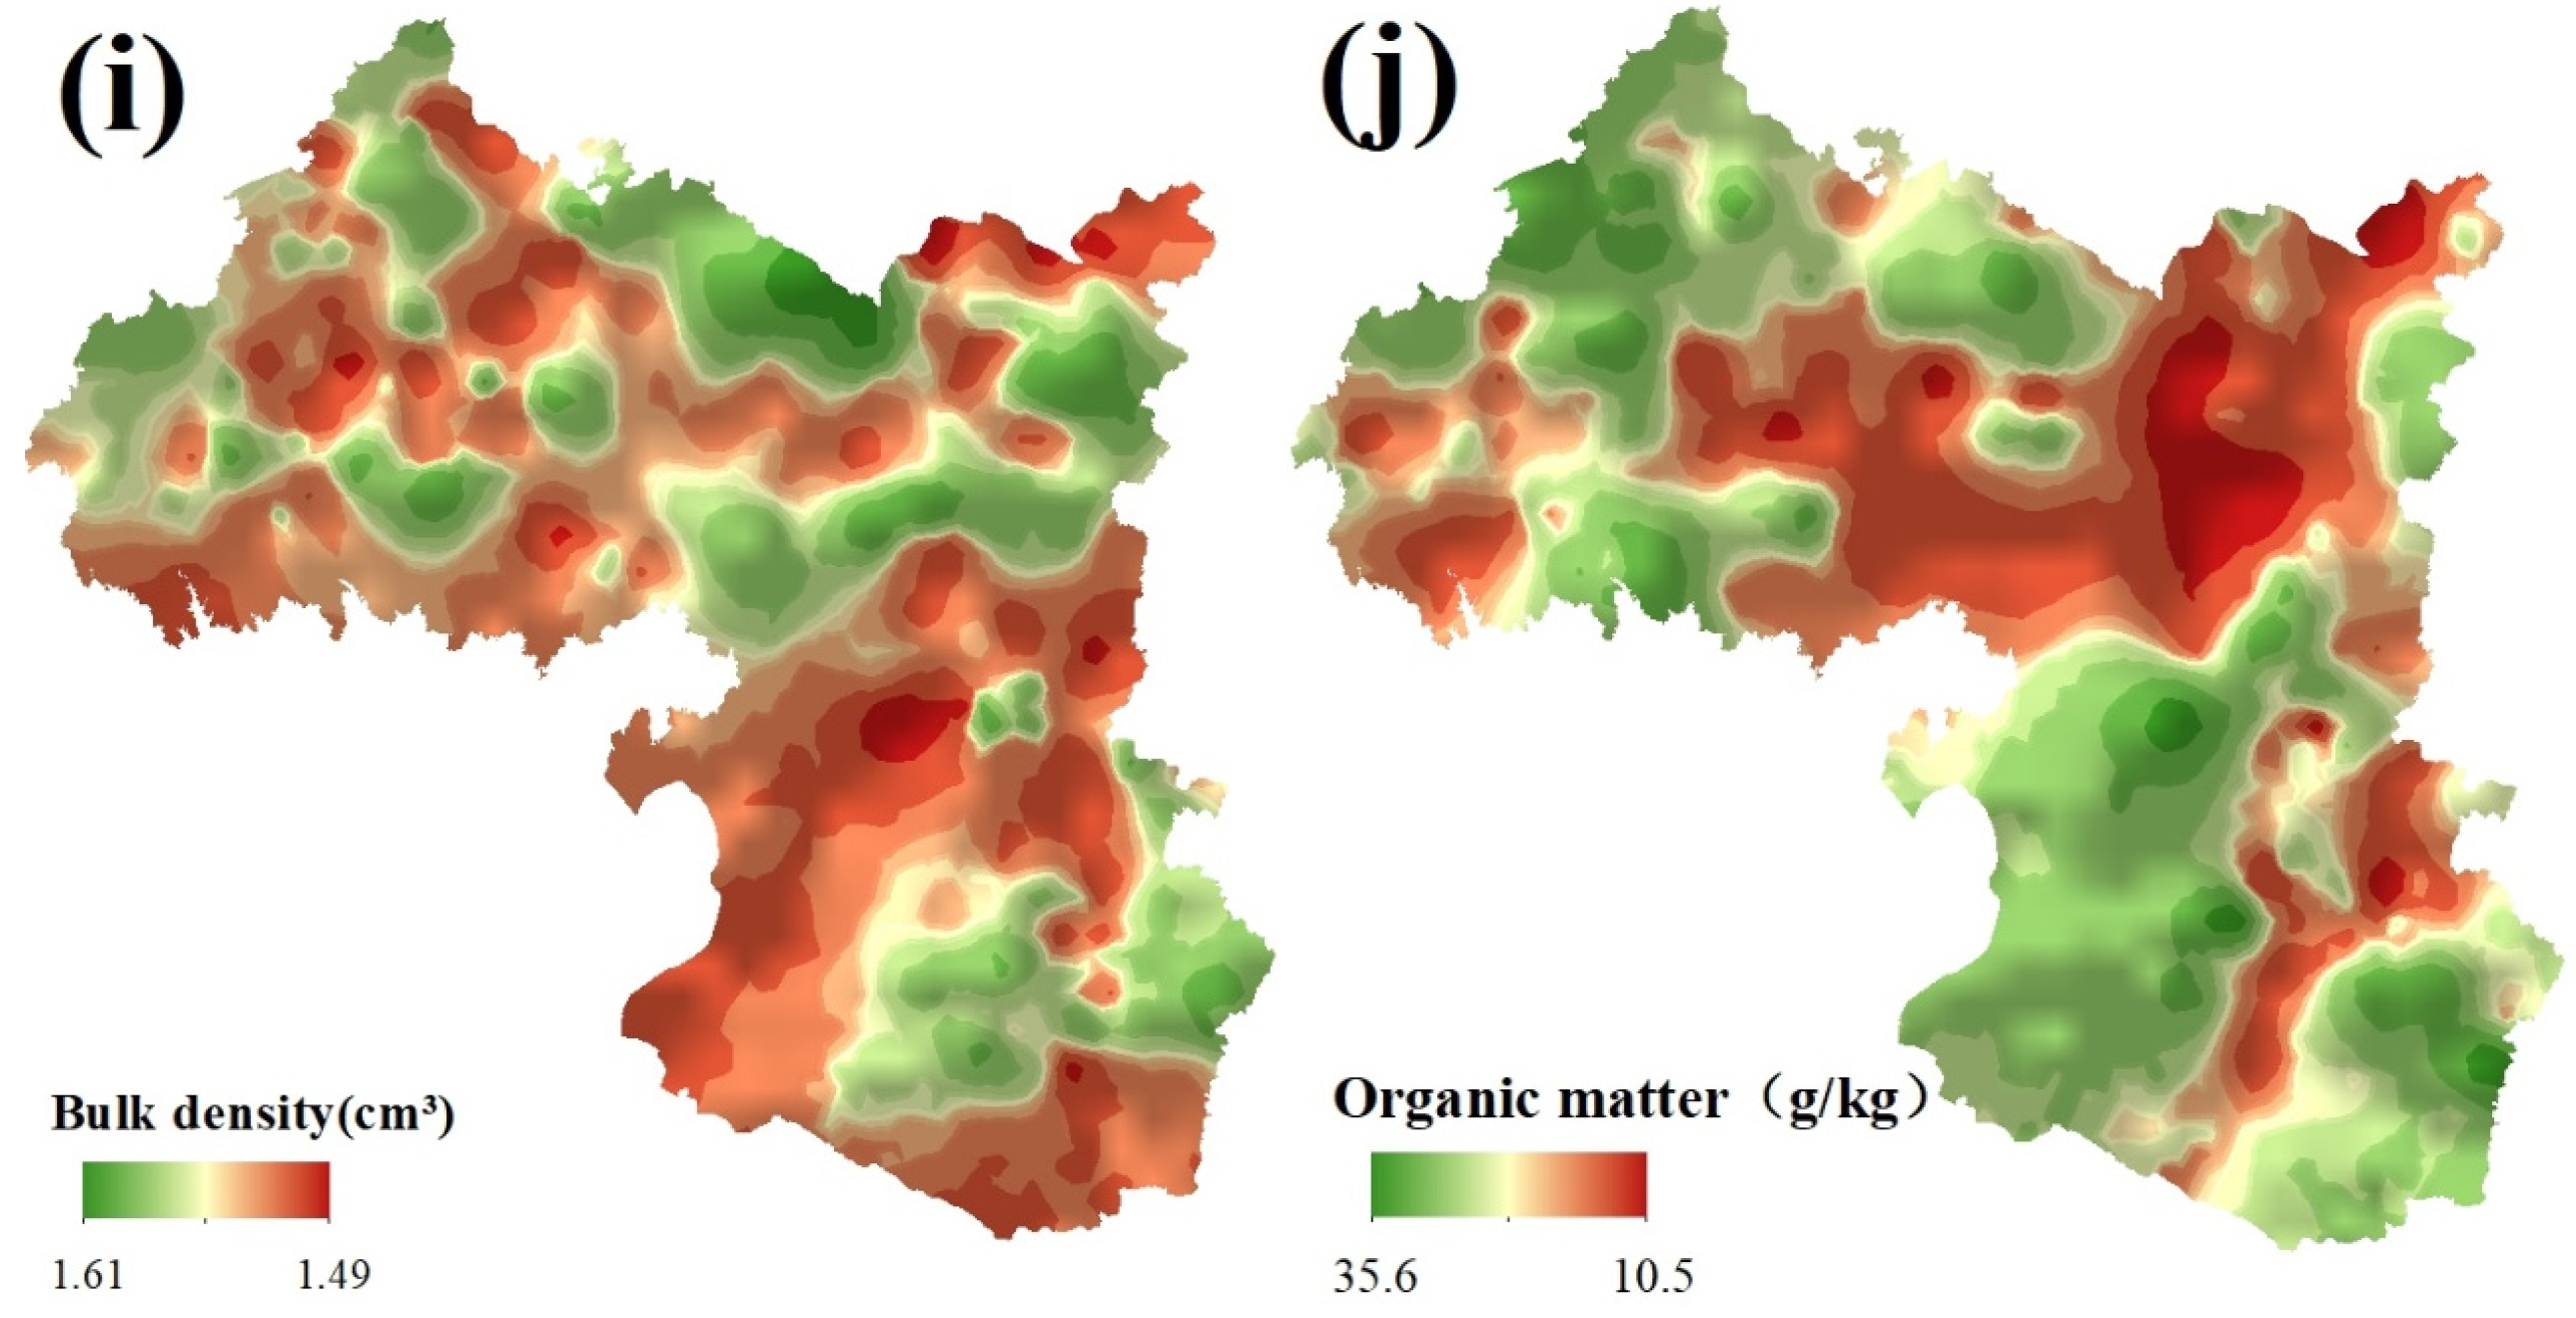
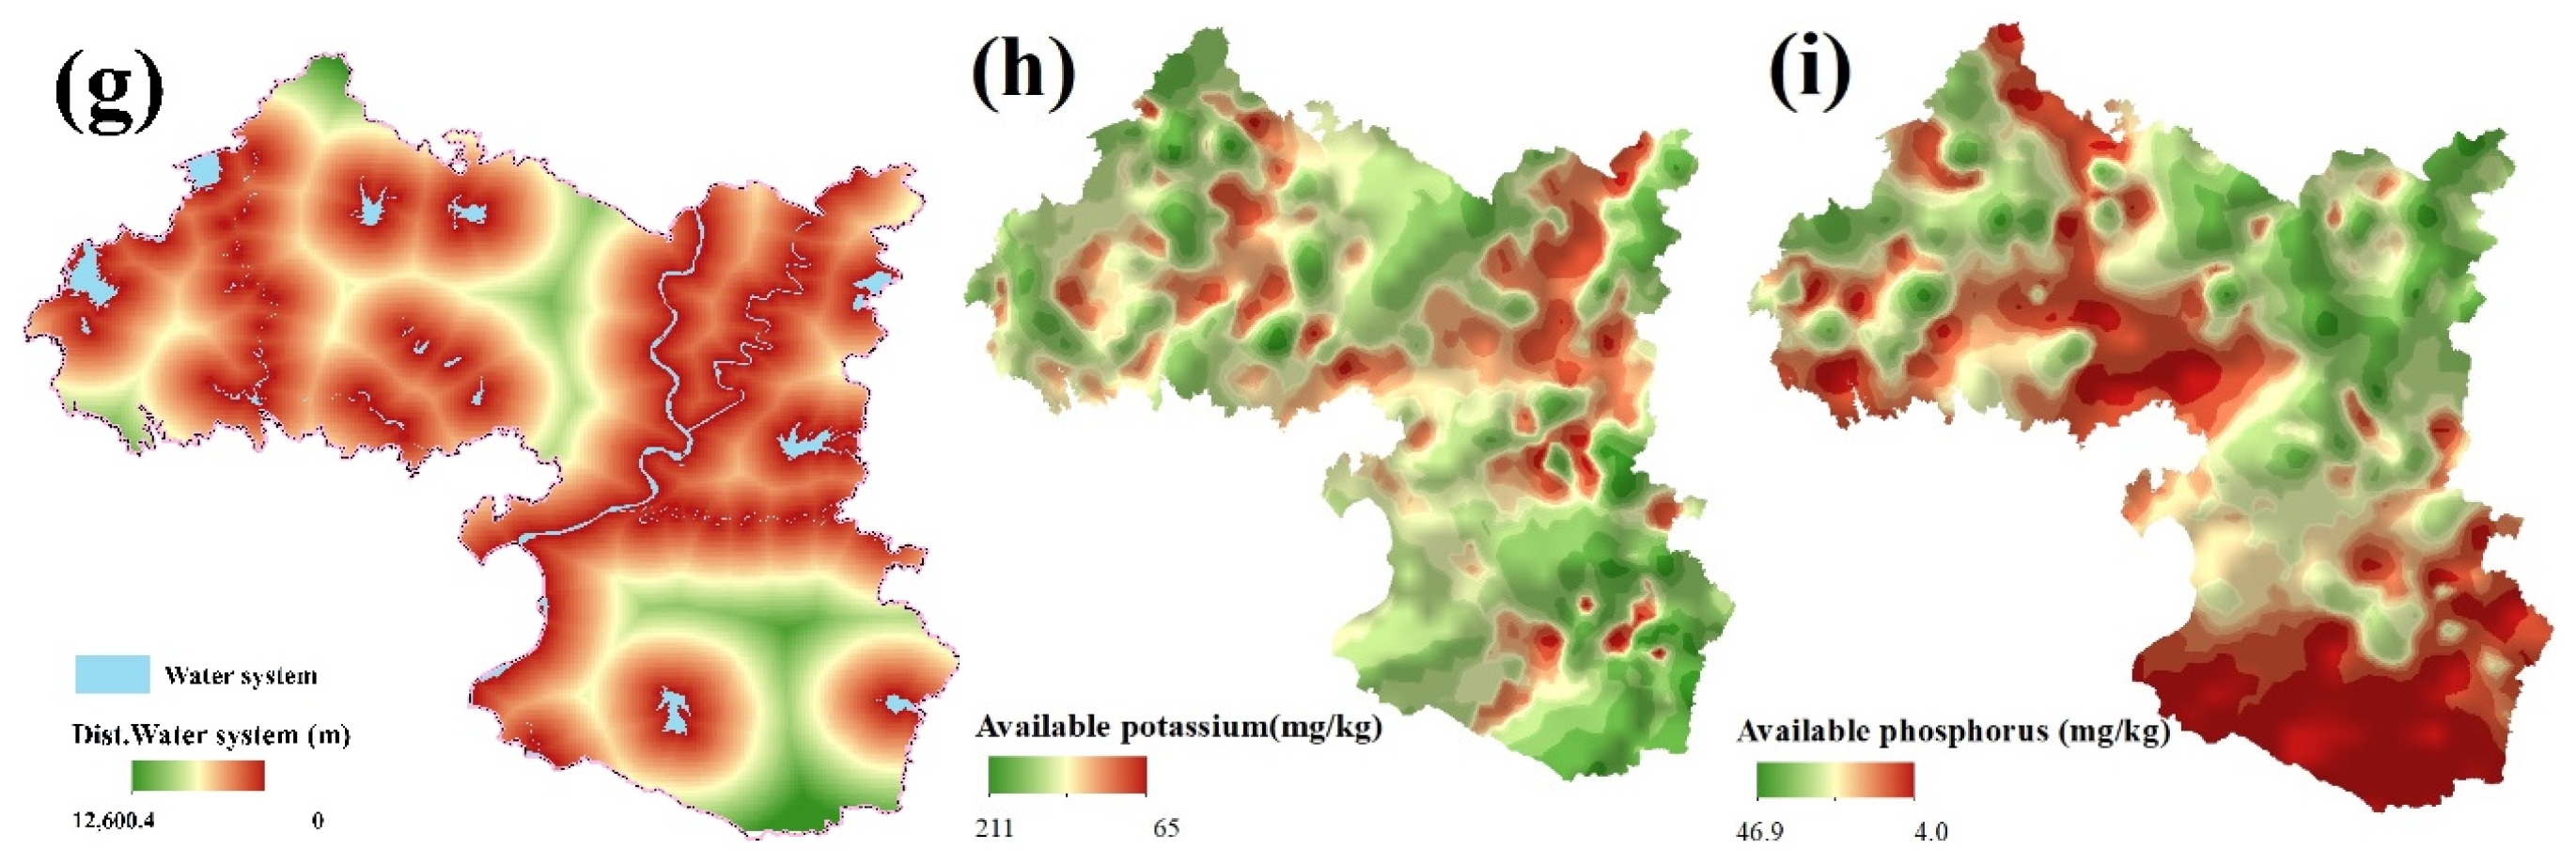
2.6.1. Natural Factors
2.6.2. Artificial Factors
3. Results
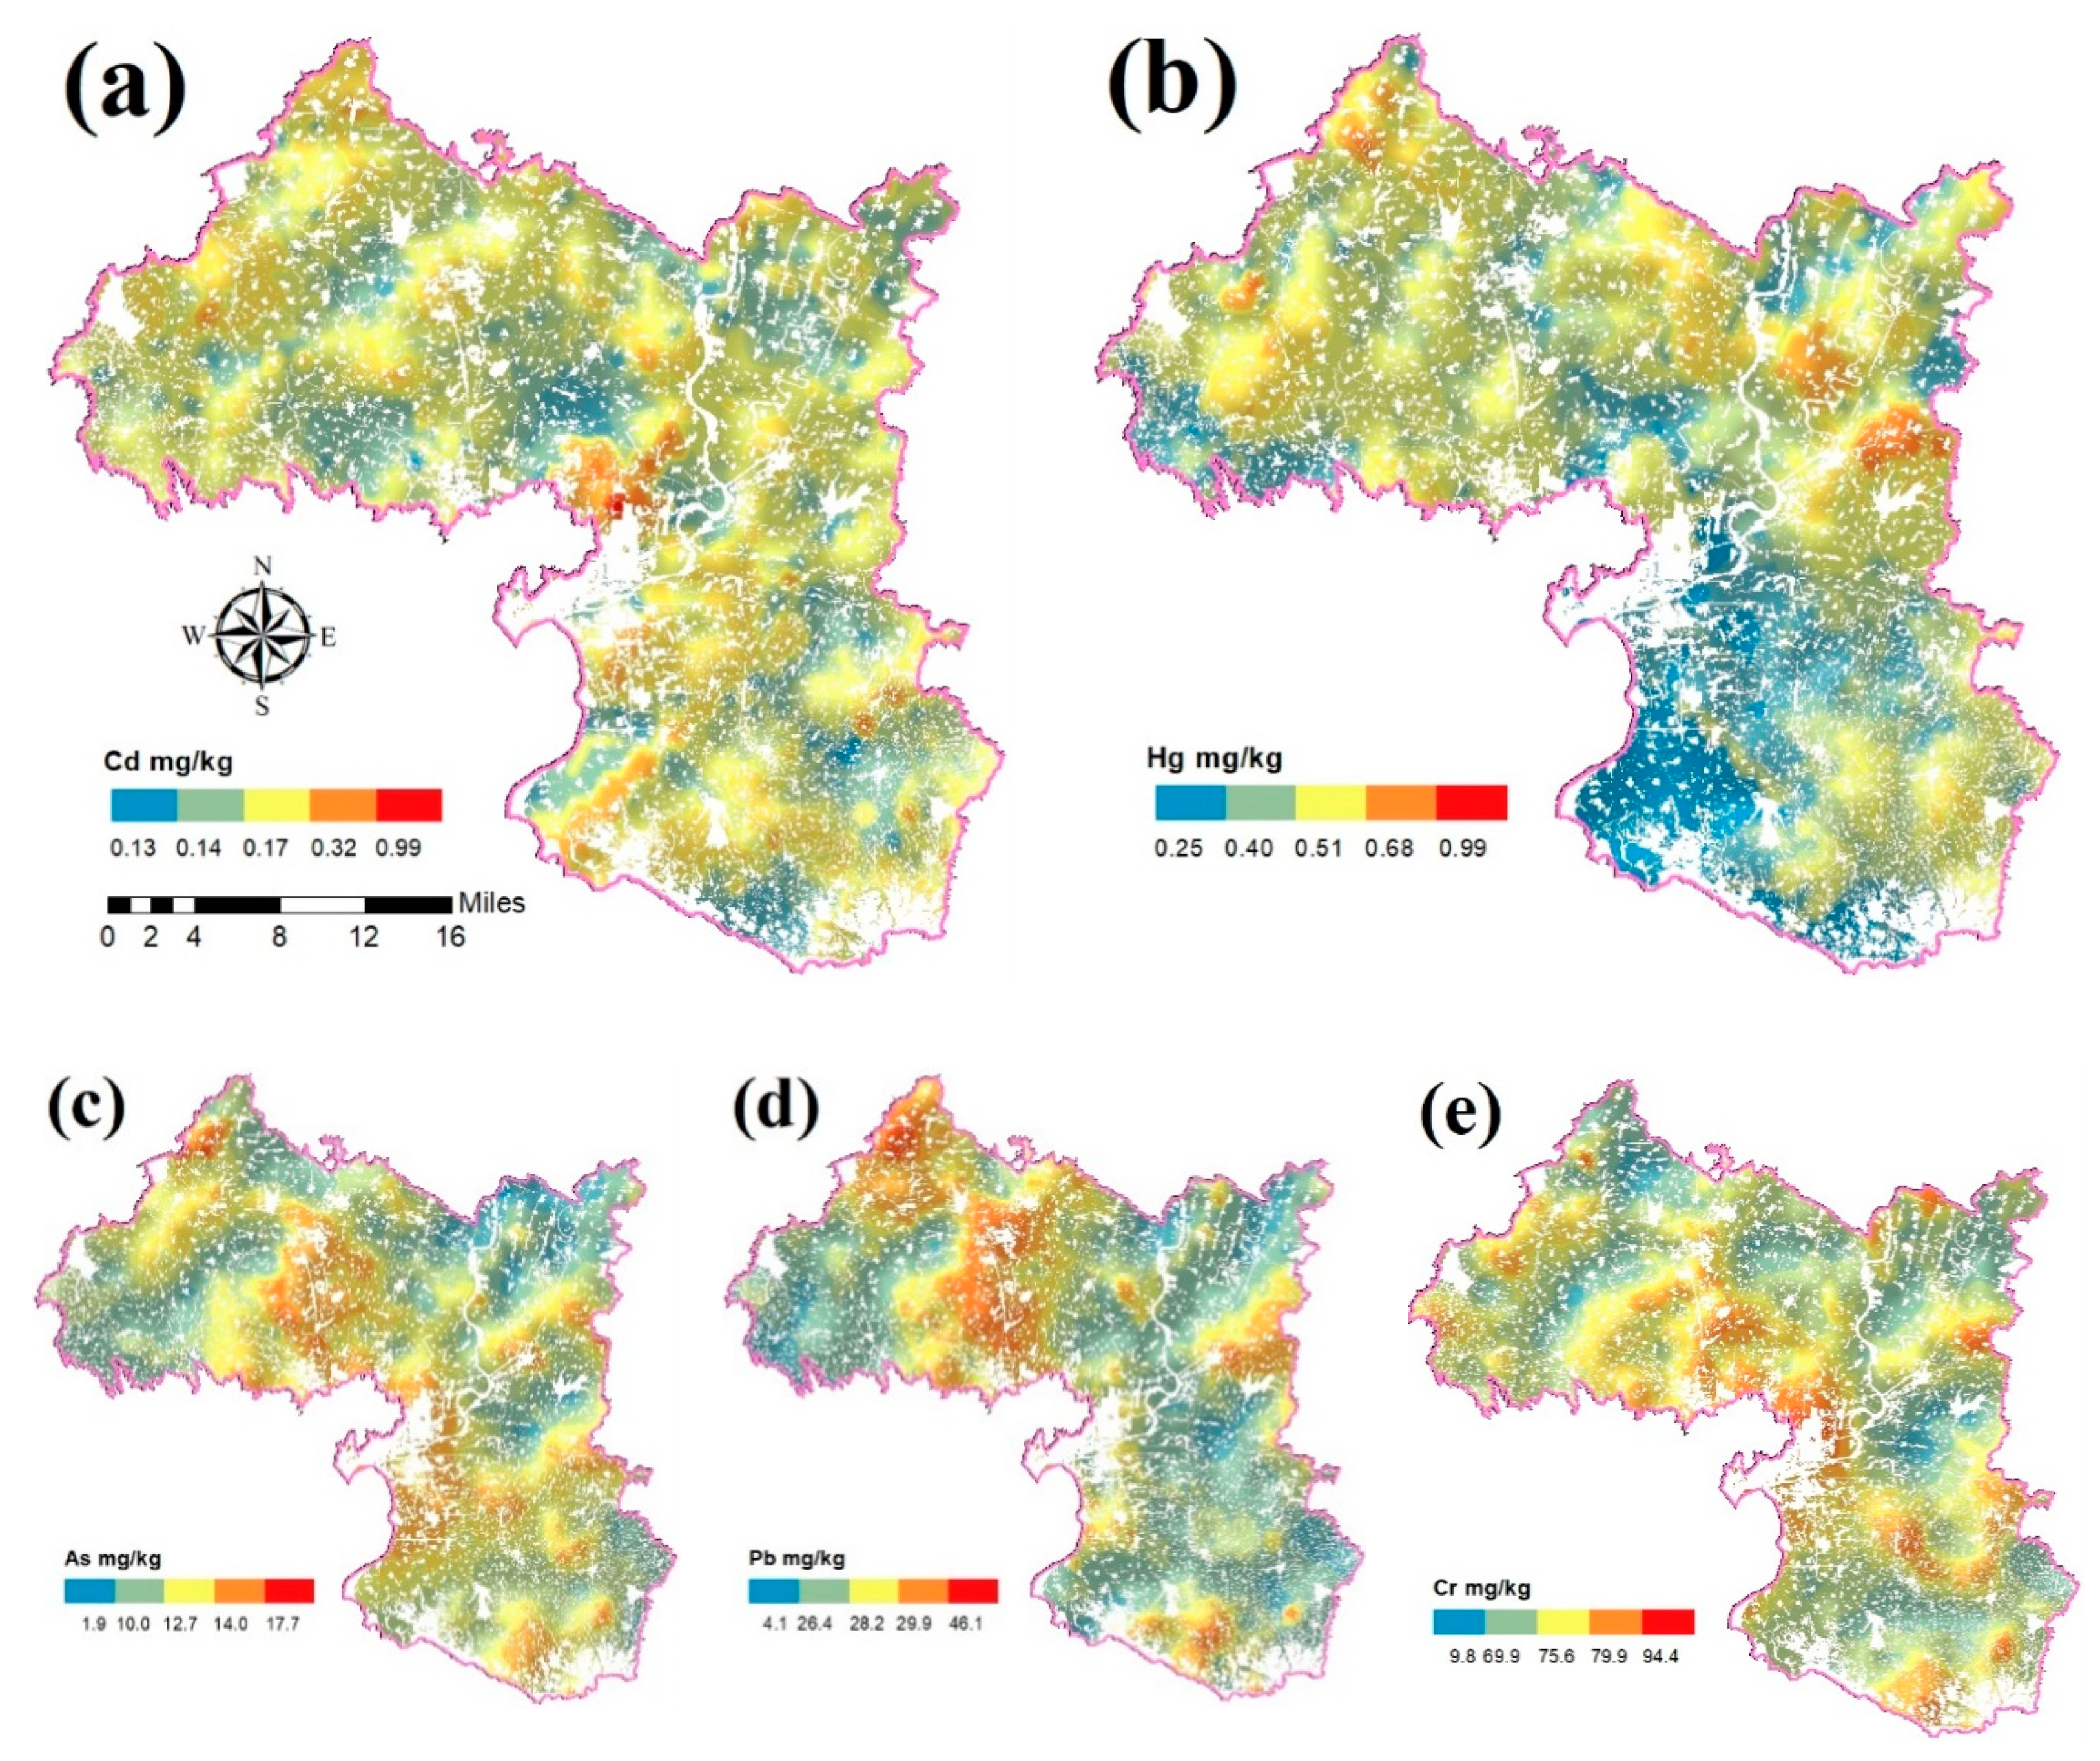
3.1. Spatial Distribution of PTEs in Soil
3.2. Descriptive Statistical Analysis of Soil PTEs
3.3. Health Risk Assessment Results
3.4. Semivariogram Result
3.5. Random Forest Simulation
4. Discussion
4.1. Spatial Distribution Characteristics of PTEs Pollution
4.2. Source Analysis of Pollution with PTEs
5. Conclusions
Author Contributions
Funding
Acknowledgments
Conflicts of Interest
References
- Leite, L.C.S.; Melo, E.S.P.; Arakaki, D.G.; dos Santos, E.F.; do Nascimento, V.A. Human Health Risk Assessment through Roasted Meats Consumption. Int. J. Environ. Res. Public Health 2020, 17, 6737. [Google Scholar] [CrossRef] [PubMed]
- Sun, T.; Huang, J.; Wu, Y.; Yuan, Y.; Xie, Y.; Fan, Z.; Zheng, Z. Risk Assessment and Source Apportionment of Soil Heavy Metals under Different Land Use in a Typical Estuary Alluvial Island. Int. J. Environ. Res. Public Health 2020, 17, 4841. [Google Scholar] [CrossRef] [PubMed]
- Luo, X.; Ren, B.; Hursthouse, A.S.; Thacker, J.R.M.; Wang, Z. Soil from an Abandoned Manganese Mining Area (Hunan, China): Significance of Health Risk from Potentially Toxic Element Pollution and Its Spatial Context. Int. J. Environ. Res. Public Health 2020, 17, 6554. [Google Scholar] [CrossRef] [PubMed]
- Oves, M.; Khan, M.S.; Zaidi, A.; Ahmad, E. Soil contamination, nutritive value, and human health risk assessment of heavy metals: An overview. Toxic. Heavy Met. Leg. Biorem. 2012, 1, 1–28. [Google Scholar]
- Deng, W.B.; Li, X.X.; An, Z.S.; Yang, L.; Hou, K.; Zhang, Y. Identification of sources of metal in the agricultural soils of the Guanzhong Plain, northwest China. Environ. Toxicol. Chem. 2017, 36, 1510–1516. [Google Scholar] [CrossRef] [PubMed]
- Yousefi, Y.; Karballaeezadeh, N.; Moazami, D.; Sanaei Zahed, A.; Mohammadzadeh, S.D.; Mosavi, A. Improving Aviation Safety through Modeling Accident Risk Assessment of Runway. Int. J. Environ. Res. Public Health 2020, 17, 6085. [Google Scholar] [CrossRef] [PubMed]
- Arao, T.; Ishikawa, S.; Murakami, M.; Abe, K.; Maejima, Y.; Makino, T. Heavy metal contamination of agricultural soil and countermeasures in Japan. Paddy Water Environ. 2010, 8, 247–257. [Google Scholar] [CrossRef]
- Loska, K.; Wiechula, D.; Korus, I. Metal contamination of farming soils affected by industry. Environ. Int. 2004, 30, 159–165. [Google Scholar] [CrossRef]
- Sutherland, R.A. Bed sediment-associated trace metals in an urban stream, Oahu. Hawaii Environ. Geol. 2000, 39, 611–627. [Google Scholar] [CrossRef]
- Breiman, L. Random forests. Mach. Learn. 2001, 45, 5–32. [Google Scholar] [CrossRef] [Green Version]
- Huang, H.; Zhou, Y.; Liu, Y.; Li, K.; Xiao, L.; Li, M.; Tian, Y.; Wu, F. Assessment of Anthropogenic Sources of Potentially Toxic Elements in Soil from Arable Land Using Multivariate Statistical Analysis and Random Forest Analysis. Sustainability 2020, 12, 8538. [Google Scholar] [CrossRef]
- Podgorski, J.; Wu, R.; Chakravorty, B.; Polya, D.A. Groundwater Arsenic Distribution in India by Machine Learning Geospatial Modeling. Int. J. Environ. Res. Public Health 2020, 17, 7119. [Google Scholar] [CrossRef] [PubMed]
- Walraven, N.; van Os, B.J.; Klaver, G.T.; Middelburg, J.J.; Davies, G.R. The lead (Pb) isotope signature, behaviour and fate of traffic-related lead pollution in roadside soils in The Netherlands. Sci. Total Environ. 2014, 472, 888. [Google Scholar] [CrossRef] [PubMed]
- Battsengel, E.; Murayama, T.; Fukushi, K.; Nishikizawa, S.; Chonokhuu, S.; Ochir, A.; Tsetsgee, S.; Davaasuren, D. Ecological and Human Health Risk Assessment of Heavy Metal Pollution in the Soil of the Ger District in Ulaanbaatar, Mongolia. Int. J. Environ. Res. Public Health 2020, 17, 4668. [Google Scholar] [CrossRef] [PubMed]
- Traczyk, P.; Gruszecka-Kosowska, A. The Condition of Air Pollution in Kraków, Poland, in 2005–2020, with Health Risk Assessment. Int. J. Environ. Res. Public Health 2020, 17, 6063. [Google Scholar] [CrossRef] [PubMed]
- Chen, T.-B.; Zheng, Y.-M.; Lei, M.; Huang, Z.-C.; Wu, H.-T.; Chen, H.I.; Fan, K.-K.; Yu, K.; Wu, X.; Tian, Q.-Z. Assessment of heavy metal pollution in surface soils of urban parks in Beijing, China. Chemosphere 2005, 60, 542–551. [Google Scholar] [CrossRef] [PubMed]
- Liu, W.; Ma, L.; Li, Y.; Abuduwaili, J.; Abdyzhapar uulu, S. Heavy Metals and Related Human Health Risk Assessment for River Waters in the Issyk−Kul Basin, Kyrgyzstan, Central Asia. Int. J. Environ. Res. Public Health 2020, 17, 3506. [Google Scholar] [CrossRef] [PubMed]
- Zhao, B.; O’Connor, D.; Zhang, J.; Peng, T.; Shen, Z.; Tsang, D.C.W.; Hou, D. Effect of pyrolysis temperature, heating rate, and residence time on rapeseed stem derived biochar. J. Clean. Prod. 2018, 174, 977–987. [Google Scholar] [CrossRef]
- Ek, K.; Mathern, A.; Rempling, R.; Brinkhoff, P.; Karlsson, M.; Norin, M. Life Cycle Sustainability Performance Assessment Method for Comparison of Civil Engineering Works Design Concepts: Case Study of a Bridge. Int. J. Environ. Res. Public Health 2020, 17, 7909. [Google Scholar] [CrossRef]
- Viegas, S.; Zare Jeddi, M.B.; Hopf, N.; Bessems, J.; Palmen, N.S.; Galea, K.; Jones, K.; Kujath, P.; Duca, R.-C.; Verhagen, H.; et al. Biomonitoring as an Underused Exposure Assessment Tool in Occupational Safety and Health Context—Challenges and Way Forward. Int. J. Environ. Res. Public Health 2020, 17, 5884. [Google Scholar] [CrossRef]
- Yang, Y.; Christakos, G.; Guo, M.; Xiao, L.; Huang, W. Space-time quantitative source apportionment of soil heavy metal concentration increments. Environ. Pollut. 2017, 223, 560–566. [Google Scholar] [CrossRef] [PubMed]
- Yang, Q.; Li, Z.; Lu, X.; Duan, Q.; Huang, L.; Bi, J. A review of soil heavy metal pollution from industrial and agricultural regions in China: Pollution and risk assessment. Sci. Total Environ. 2018, 642, 690–700. [Google Scholar] [CrossRef] [PubMed]
- Ke, X.; Gui, S.; Huang, H.; Zhang, H.; Wang, C.; Guo, W. Ecological risk assessment and source identification for heavy metals in surface sediment from the Liaohe River protected area, China. Chemosphere 2017, 175, 473–481. [Google Scholar] [CrossRef] [PubMed]
- Nanos, N.; Martín, J.A.R. Multiscale analysis of heavy metal contents in soils: Spatial variability in the Duero river basin (Spain). Geoderma 2012, 189, 554–562. [Google Scholar] [CrossRef]
- Guo, G.; Zhang, D.; Wang, Y. Probabilistic Human Health Risk Assessment of Heavy Metal Intake via Vegetable Consumption around Pb/Zn Smelters in Southwest China. Int. J. Environ. Res. Public Health 2019, 16, 3267. [Google Scholar] [CrossRef] [Green Version]
- Jin, Y.; O’Connor, D.; Ok, Y.S.; Tsang, D.C.; Liu, A.; Hou, D. Assessment of sources of heavy metals in soil and dust at children’s playgrounds in Beijing using GIS and multivariate statistical analysis. Environ. Int. 2019, 124, 320–328. [Google Scholar] [CrossRef]
- Wu, S.; Peng, S.; Zhang, X.; Wu, D.; Luo, W.; Zhang, T.; Zhou, S.; Yang, G.; Wan, H.; Wu, L. Levels and health risk assessments of heavy metals in urban soils in Dongguan, China. J. Geochem. Explor. 2015, 148, 71–78. [Google Scholar] [CrossRef]
- Zuzolo, D.; Cicchella, D.; Lima, A.; Guagliardi, I.; Cerino, P.; Pizzolante, A.; Thiombane, M.; de Vivo, B.; Albanese, S. Potentially toxic elements in soils of Campania region (Southern Italy): Combining raw and compositional data. J. Geochem. Explor. 2020, 213, 106524. [Google Scholar] [CrossRef]
- Bai, X.; Song, K.; Liu, J.; Mohamed, A.K.; Mou, C.; Liu, D. Health Risk Assessment of Groundwater Contaminated by Oil Pollutants Based on Numerical Modeling. Int. J. Environ. Res. Public Health 2019, 16, 3245. [Google Scholar] [CrossRef] [Green Version]
- Li, C.F.; Cao, J.F.; Lü, J.S.; Yao, L.; Wu, Q.Y. Ecological risk assessment of soil heavy metals for different types of land use and evaluation of human health. Environ. Sci. 2018, 39, 5628–5638. [Google Scholar]
- Thiombane, M.; Zuzolo, D.; Cicchella, D.; Albanese, S.; Lima, A.; Cavaliere, M.; de Vivo, B. Soil geochemical follow-up in the Cilento World Heritage Park (Campania, Italy) through exploratory compositional data analysis and C-A fractal model. J. Geochem. Explor. 2018, 189, 85–99. [Google Scholar] [CrossRef]
- Xiong, J.; Ye, C.; Zhou, T.; Cheng, W. Health Risk and Resilience Assessment with Respect to the Main Air Pollutants in Sichuan. Int. J. Environ. Res. Public Health 2019, 16, 2796. [Google Scholar] [CrossRef] [PubMed] [Green Version]
- Romic, M.; Romic, D. Heavy metals distribution in agricultural topsoils in urban area. Environ. Geol. 2003, 43, 795–805. [Google Scholar] [CrossRef]
- Burges, A.; Epelde, L.; Garbisu, C. Impact of repeated single-metal and multimetal pollution events on soil quality. Chemosphere 2015, 120, 8–15. [Google Scholar] [CrossRef]
- Li, Z.; Ma, Z.; van der Kuijp, T.J.; Yuan, Z.; Huang, L. A review of soil heavy metal pollution from mines in China: Pollution and health risk assessment. Sci. Total Environ. 2014, 468, 843–853. [Google Scholar] [CrossRef]
- Zinicovscaia, I.; Sturza, R.; Duliu, O.; Grozdov, D.; Gundorina, S.; Ghendov-Mosanu, A.; Duca, G. Major and Trace Elements in Moldavian Orchard Soil and Fruits: Assessment of Anthropogenic Contamination. Int. J. Environ. Res. Public Health 2020, 17, 7112. [Google Scholar] [CrossRef]
- Jiang, Y.; Chao, S.; Liu, J.; Yang, Y.; Chen, Y.; Zhang, A.; Cao, H. Source apportionment and health risk assessment of heavy metals in soil for a township in Jiangsu Province, China. Chemosphere 2017, 168, 1658–1668. [Google Scholar] [CrossRef]
- Chonokhuu, S.; Batbold, C.; Chuluunpurev, B.; Battsengel, E.; Dorjsuren, B.; Byambaa, B. Contamination and Health Risk Assessment of Heavy Metals in the Soil of Major Cities in Mongolia. Int. J. Environ. Res. Public Health 2019, 16, 2552. [Google Scholar] [CrossRef] [Green Version]
- Muyessar, T.; Jilili, A.; Jiang, F.Q. Distribution characteristics of soil heavy metal content in northern slope of Tianshan Mountains and its source explanation. Chin. J. Eco Agric. 2013, 21, 883–890, (In Chinese with English Abstract). [Google Scholar] [CrossRef]
- Oconnor, D.; Hou, D.; Ok, Y.S.; Song, Y.; Sarmah, A.K.; Li, X.; Tack, F.M.G. Sustainable in situ remediation of recalcitrant organic pollutants in groundwater with controlled release materials: A review. J. Control. Release 2018, 283, 200–213. [Google Scholar] [CrossRef]
- Peng, T.; Oconnor, D.; Zhao, B.; Jin, Y.; Zhang, Y.; Tian, L.; Zheng, N.; Li, X.; Hou, D. Spatial distribution of lead contamination in soil and equipment dust at children’s playgrounds in Beijing, China. Environ. Pollut. 2019, 245, 363–370. [Google Scholar] [CrossRef] [PubMed]
- Ma, Q.; Han, L.; Zhang, J.; Zhang, Y.; Lang, Q.; Li, F.; Han, A.; Bao, Y.; Li, K.; Alu, S. Environmental Risk Assessment of Metals in the Volcanic Soil of Changbai Mountain. Int. J. Environ. Res. Public Health 2019, 16, 2047. [Google Scholar] [CrossRef] [PubMed] [Green Version]
- Robertson, G.P. GS: Geostatistics for the Environmental Sciences, Version 10; Gamma Design Software: Plainwell, MI, USA, 2008. [Google Scholar]
- Young, F.J.; Hammer, R.D. Defining Geographic Soil Bodies by Landscape Position, Soil Taxonomy, and Cluster Analysis. Soil Sci. Soc. Am. J. 2000, 64, 989–998. [Google Scholar] [CrossRef] [Green Version]
- Zhang, P.; Hou, D.; Oconnor, D.; Li, X.; Pehkonen, S.; Varma, R.S.; Wang, X. Green and Size-Specific Synthesis of Stable Fe–Cu Oxides as Earth-Abundant Adsorbents for Malachite Green Removal. ACS Sustain. Chem. Eng. 2018, 6, 9229–9236. [Google Scholar] [CrossRef] [PubMed]
- Li, J.; Lu, Y.; Yin, W.; Gan, H.; Zhang, C.; Deng, X.; Lian, J. Distribution of heavy metals in agricultural soils near a petrochemical complex in Guangzhou, China. Environ. Monit. Assess. 2009, 153, 365–375. [Google Scholar] [CrossRef] [PubMed]
- Davis, H.T.; Aelion, C.M.; McDermott, S.; Lawson, A.B. Identifying natural and anthropogenic sources of metals in urban and rural soils using GIS-based data, PCA, and spatial interpolation. Environ. Pollut. 2009, 157, 2378–2385. [Google Scholar] [CrossRef] [Green Version]
- Jia, H.; Qian, H.; Qu, W.; Zheng, L.; Feng, W.; Ren, W. Fluoride Occurrence and Human Health Risk in Drinking Water Wells from Southern Edge of Chinese Loess Plateau. Int. J. Environ. Res. Public Health 2019, 16, 1683. [Google Scholar] [CrossRef] [Green Version]
- Facchinelli, A.; Sacchi, E.; Mallen, L. Multivariate statistical and GIS-based approach to identify heavy metal sources in soils. Environ. Pollut. 2001, 114, 313–324. [Google Scholar] [CrossRef]
- Geng, F.; Cai, C.-J.; Tie, X.; Yu, Q.; An, J.; Peng, L.; Zhou, G.; Xu, J. Analysis of VOC emissions using PCA/APCS receptor model at city of Shanghai, China. J. Atmos. Chem. 2009, 62, 229–247. [Google Scholar] [CrossRef]
- Johansson, C.; Norman, M.; Burman, L. Road traffic emission factors for heavy metals. Atmos. Environ. 2009, 43, 4681–4688. [Google Scholar] [CrossRef]
- Jiménez-Rodríguez, E.; Feria-Domínguez, J.M.; Sebastián-Lacave, A. Assessing the Health-Care Risk: The Clinical-VaR, a Key Indicator for Sound Management. Int. J. Environ. Res. Public Health 2018, 15, 639. [Google Scholar] [CrossRef] [PubMed] [Green Version]
- Schaefer, K.; Einax, J.W. Source Apportionment and Geostatistics: An Outstanding Combination for Describing Metals Distribution in Soil. Clean Soil Air Water 2016, 44, 877–884. [Google Scholar] [CrossRef]
- Vaccaro, S.; Sobiecka, E.; Contini, S.; Locoro, G.; Free, G.; Gawlik, B. The application of positive matrix factorization in the analysis, characterisation and detection of contaminated soils. Chemosphere 2007, 69, 1055–1063. [Google Scholar] [CrossRef]
- Maanan, M.; Saddik, M.; Maanan, M.; Chaibi, M.; Assobhei, O.; Zourarah, B. Environmental and ecological risk assessment of heavy metals in sediments of Nador lagoon, Morocco. Ecol. Indic. 2015, 48, 616–626. [Google Scholar] [CrossRef]
- Pekey, H.; Dogan, G. Application of positive matrix factorisation for the source apportionment of heavy metals in sediments: A comparison with aprevious factor analysis study. Microchem. J. 2013, 106, 233–237. [Google Scholar] [CrossRef]
- Jimenez-Ballesta, R.; Bravo, S.; Amorós, J.A.; Pérez-De-Los-Reyes, C.; García-Giménez, R.; Higueras, P.; Garcia-Navarro, F.J. Mineralogical and Geochemical Nature of Calcareous Vineyard Soils from Alcubillas (La Mancha, Central Spain). Int. J. Environ. Res. Public Health 2020, 17, 6229. [Google Scholar] [CrossRef] [PubMed]
- Josse, J.; Husson, F. Selecting the number of components in principal component analysis using cross-validation approximations. Comput. Stat. Data Anal. 2012, 56, 1869–1879. [Google Scholar] [CrossRef]
- Trujillogonzález, J.M.; Torresmora, M.A.; Jiménezballesta, R.; Zhang, J. Land-use-dependent spatial variation and exposure risk of heavy metals in road-deposited sediment in Villavicencio, Colombia. Environ. Geochem. Health 2019, 41, 667–679. [Google Scholar] [CrossRef]
- Kadi, M.W. “Soil Pollution Hazardous to Environment”: A case study on the chemical composition and correlation to automobile traffic of the roadside soil of Jeddah city, Saudi Arabia. J. Hazard. Mater. 2009, 168, 1280–1283. [Google Scholar] [CrossRef]
- Shabbaj, I.I.; Alghamdi, M.A.; Shamy, M.; Hassan, S.K.; Alsharif, M.M.; Khoder, M.I. Risk Assessment and Implication of Human Exposure to Road Dust Heavy Metals in Jeddah, Saudi Arabia. Int. J. Environ. Res. Public Health 2018, 15, 36. [Google Scholar] [CrossRef] [Green Version]
- Yaylaliabanuz, G. Heavy metal contamination of surface soil around Gebze industrial area, Turkey. Microchem. J. 2011, 99, 82–92. [Google Scholar] [CrossRef]
- Brima, E.I. Toxic Elements in Different Medicinal Plants and the Impact on Human Health. Int. J. Environ. Res. Public Health 2017, 14, 1209. [Google Scholar] [CrossRef] [PubMed] [Green Version]
- Duan, B.; Zhang, W.; Zheng, H.; Wu, C.; Zhang, Q.; Bu, Y. Comparison of Health Risk Assessments of Heavy Metals and As in Sewage Sludge from Wastewater Treatment Plants (WWTPs) for Adults and Children in the Urban District of Taiyuan, China. Int. J. Environ. Res. Public Health 2017, 14, 1194. [Google Scholar] [CrossRef] [PubMed] [Green Version]
- Xie, W.; Peng, C.; Wang, H.; Chen, W. Health Risk Assessment of Trace Metals in Various Environmental Media, Crops and Human Hair from a Mining Affected Area. Int. J. Environ. Res. Public Health 2017, 14, 1595. [Google Scholar] [CrossRef] [PubMed] [Green Version]


| Element | Cd | Hg | As | Pb | Cr | |
|---|---|---|---|---|---|---|
| RfD (mg·kg−1·d−1) | Respiratory intake | 1.00 × 10⁻⁵ | 3.00 × 10⁻⁴ | 1.50 × 10⁻⁵ | 3.52 × 10⁻³ | 2.86 × 10⁻⁵ |
| Skin intake | 2.50 × 10⁻⁵ | 3.00 × 10⁻⁴ | 1.23 × 10⁻⁴ | 5.25 × 10⁻⁴ | 6.00 × 10⁻⁵ | |
| Oral intake | 1.00 × 10⁻³ | 3.00 × 10⁻⁴ | 3.00 × 10⁻⁴ | 3.50 × 10⁻³ | 3.00 × 10⁻³ | |
| CSF (kg·d−1·mg−1) | Respiratory intake | 1.8 | 4.3 | 0.042 | 84 | |
| Skin intake | 0.38 | 0.03 | 0.001 | |||
| Oral intake | 6.1 | 1.5 | 0.5 |
| Description | Value | ||
|---|---|---|---|
| Children (3–12 Years Old) | Adult (≥18 Years Old) | ||
| Atmospheric particulate matter in adjacent areas in the research region, mg/m3 | 0.146 | 0.995 | |
| The consistence of particulate matter in the air; because the particulate matter in the air comes from the soil, it is assumed to be equal to the concentration of PTEs in the soil | |||
| Exposure time, h/day | 0.56 | 3.3 | |
| Average daily air intake, m3/day | 9.7 | 15.7 | |
| Exposure frequency, day/year | 350 | ||
| Exposure duration, year | 9 | 30 | |
| Concentration of PTEs in soil, mg/kg | Experimental measurement | ||
| Surface area of soil in contact with skin, cm2/day | 8880 | 16,000 | |
| Proportion of skin contact with soil | 39.30% | ||
| Soil adhesion factor, mg/cm2 | 0.2 | 0.07 | |
| Skin absorption efficiency factor, dimensionless | Cd, Hg, Pb, Cr is 0.001; As is 0.03 | ||
| Conversion factor from kg to mg | |||
| Weight, kg | 23.24 | 60.6 | |
| Average contact time, day | Carcinogenic: 70 × 365; Non-carcinogenic: ED × 365 | ||
| Average daily intake of soil, mg/d | 87 | 50 | |
| Cd | Hg | As | Pb | Cr | |
|---|---|---|---|---|---|
| Maximum (mg/kg) | 1.47 | 1.56 | 21.50 | 47.50 | 109.00 |
| Minimum (mg/kg) | 0.04 | 0.02 | 5.76 | 19.60 | 51.60 |
| Mean (mg/kg) | 0.14 | 0.05 | 12.89 | 29.23 | 78.58 |
| Standard deviation, SD (mg/kg) | 0.05 | 0.08 | 2.80 | 4.04 | 9.81 |
| Coefficient of variation (%) | 0.38 | 1.48 | 0.22 | 0.14 | 0.12 |
| Background value | 0.17 | 0.08 | 12.30 | 26.70 | 86.00 |
| Enrichment factors | 0.80 | 0.67 | 1.05 | 1.09 | 0.91 |
| HQ | HI | CR | TCR | ||||||
|---|---|---|---|---|---|---|---|---|---|
| Ing | Derm | Inh | Total | Ing | Derm | Inh | Total | ||
| Cd | Adult | 1.20 × 10⁻¹ | 1.21 × 10⁻⁴ | 1.34 × 10⁻⁹ | 1.20 × 10⁻¹ | 3.14 × 10⁻⁴ | 4.92 × 10⁻¹⁰ | 1.03 × 10⁻¹⁴ | 3.14 × 10⁻⁴ |
| Child | 5.45 × 10⁻¹ | 4.99 × 10⁻⁴ | 3.65 × 10⁻¹⁰ | 5.45 × 10⁻¹ | 4.27 × 10⁻⁴ | 1.55 × 10⁻⁹ | 8.45 × 10⁻¹⁶ | 4.27 × 10⁻⁴ | |
| Hg | Adult | 1.56 × 10⁻¹ | 3.93 × 10⁻⁶ | 1.74 × 10⁻¹¹ | 1.56 × 10⁻¹ | ||||
| Child | 7.08 × 10⁻¹ | 1.62 × 10⁻⁵ | 4.75 × 10⁻¹² | 7.08 × 10⁻¹ | |||||
| As | Adult | 37.70 | 6.94 × 10⁻³ | 1.26 × 10⁻⁷ | 37.70 | 7.27 × 10⁻³ | 1.10 × 10⁻⁸ | 2.32 × 10⁻¹² | 7.27 × 10⁻³ |
| Child | 171.00 | 2.87 × 10⁻² | 3.44 × 10⁻⁸ | 171.00 | 9.90 × 10⁻³ | 3.46 × 10⁻⁸ | 1.90 × 10⁻¹³ | 9.90 × 10⁻³ | |
| Pb | Adult | 7.33 | 1.23 × 10⁻³ | 8.10 × 10⁻¹⁰ | 7.33 | 5.14 × 10⁻¹⁴ | 5.14 × 10⁻¹⁴ | ||
| Child | 33.20 | 5.08 × 10⁻³ | 2.22 × 10⁻¹⁰ | 33.30 | 4.21 × 10⁻¹⁵ | 4.21 × 10⁻¹⁵ | |||
| Cr | Adult | 23.00 | 2.89 × 10⁻² | 2.68 × 10⁻⁷ | 23.00 | 1.48 × 10⁻² | 7.43 × 10⁻¹⁰ | 2.76 × 10⁻¹⁰ | 1.48 × 10⁻² |
| Child | 104.00 | 1.20 × 10⁻¹ | 7.33 × 10⁻⁸ | 104.00 | 2.01 × 10⁻² | 2.35 × 10⁻⁹ | 2.26 × 10⁻¹¹ | 2.01 × 10⁻² | |
| PTEs | Model | Nugget Value/C0 | Partial Base Station Value/C | Abutment Value/(C0 + C) | Nugget Ratio/[C0/(C0 + C)] | Range km | Coefficient |
|---|---|---|---|---|---|---|---|
| Cd | stable | 0.0004 | 0.0014 | 0.0018 | 0.2049 | 0.88 | 2.00 |
| Hg | stable | 0.0636 | 0.3167 | 0.3804 | 0.1673 | 0.01 | 2.00 |
| As | stable | 2.1634 | 5.3851 | 7.5485 | 0.2866 | 12.81 | 0.62 |
| Pb | stable | 0.0041 | 0.0120 | 0.0161 | 0.2554 | 6.86 | 0.47 |
| Cr | stable | 40.3058 | 61.9820 | 102.2877 | 0.3940 | 12.77 | 0.65 |
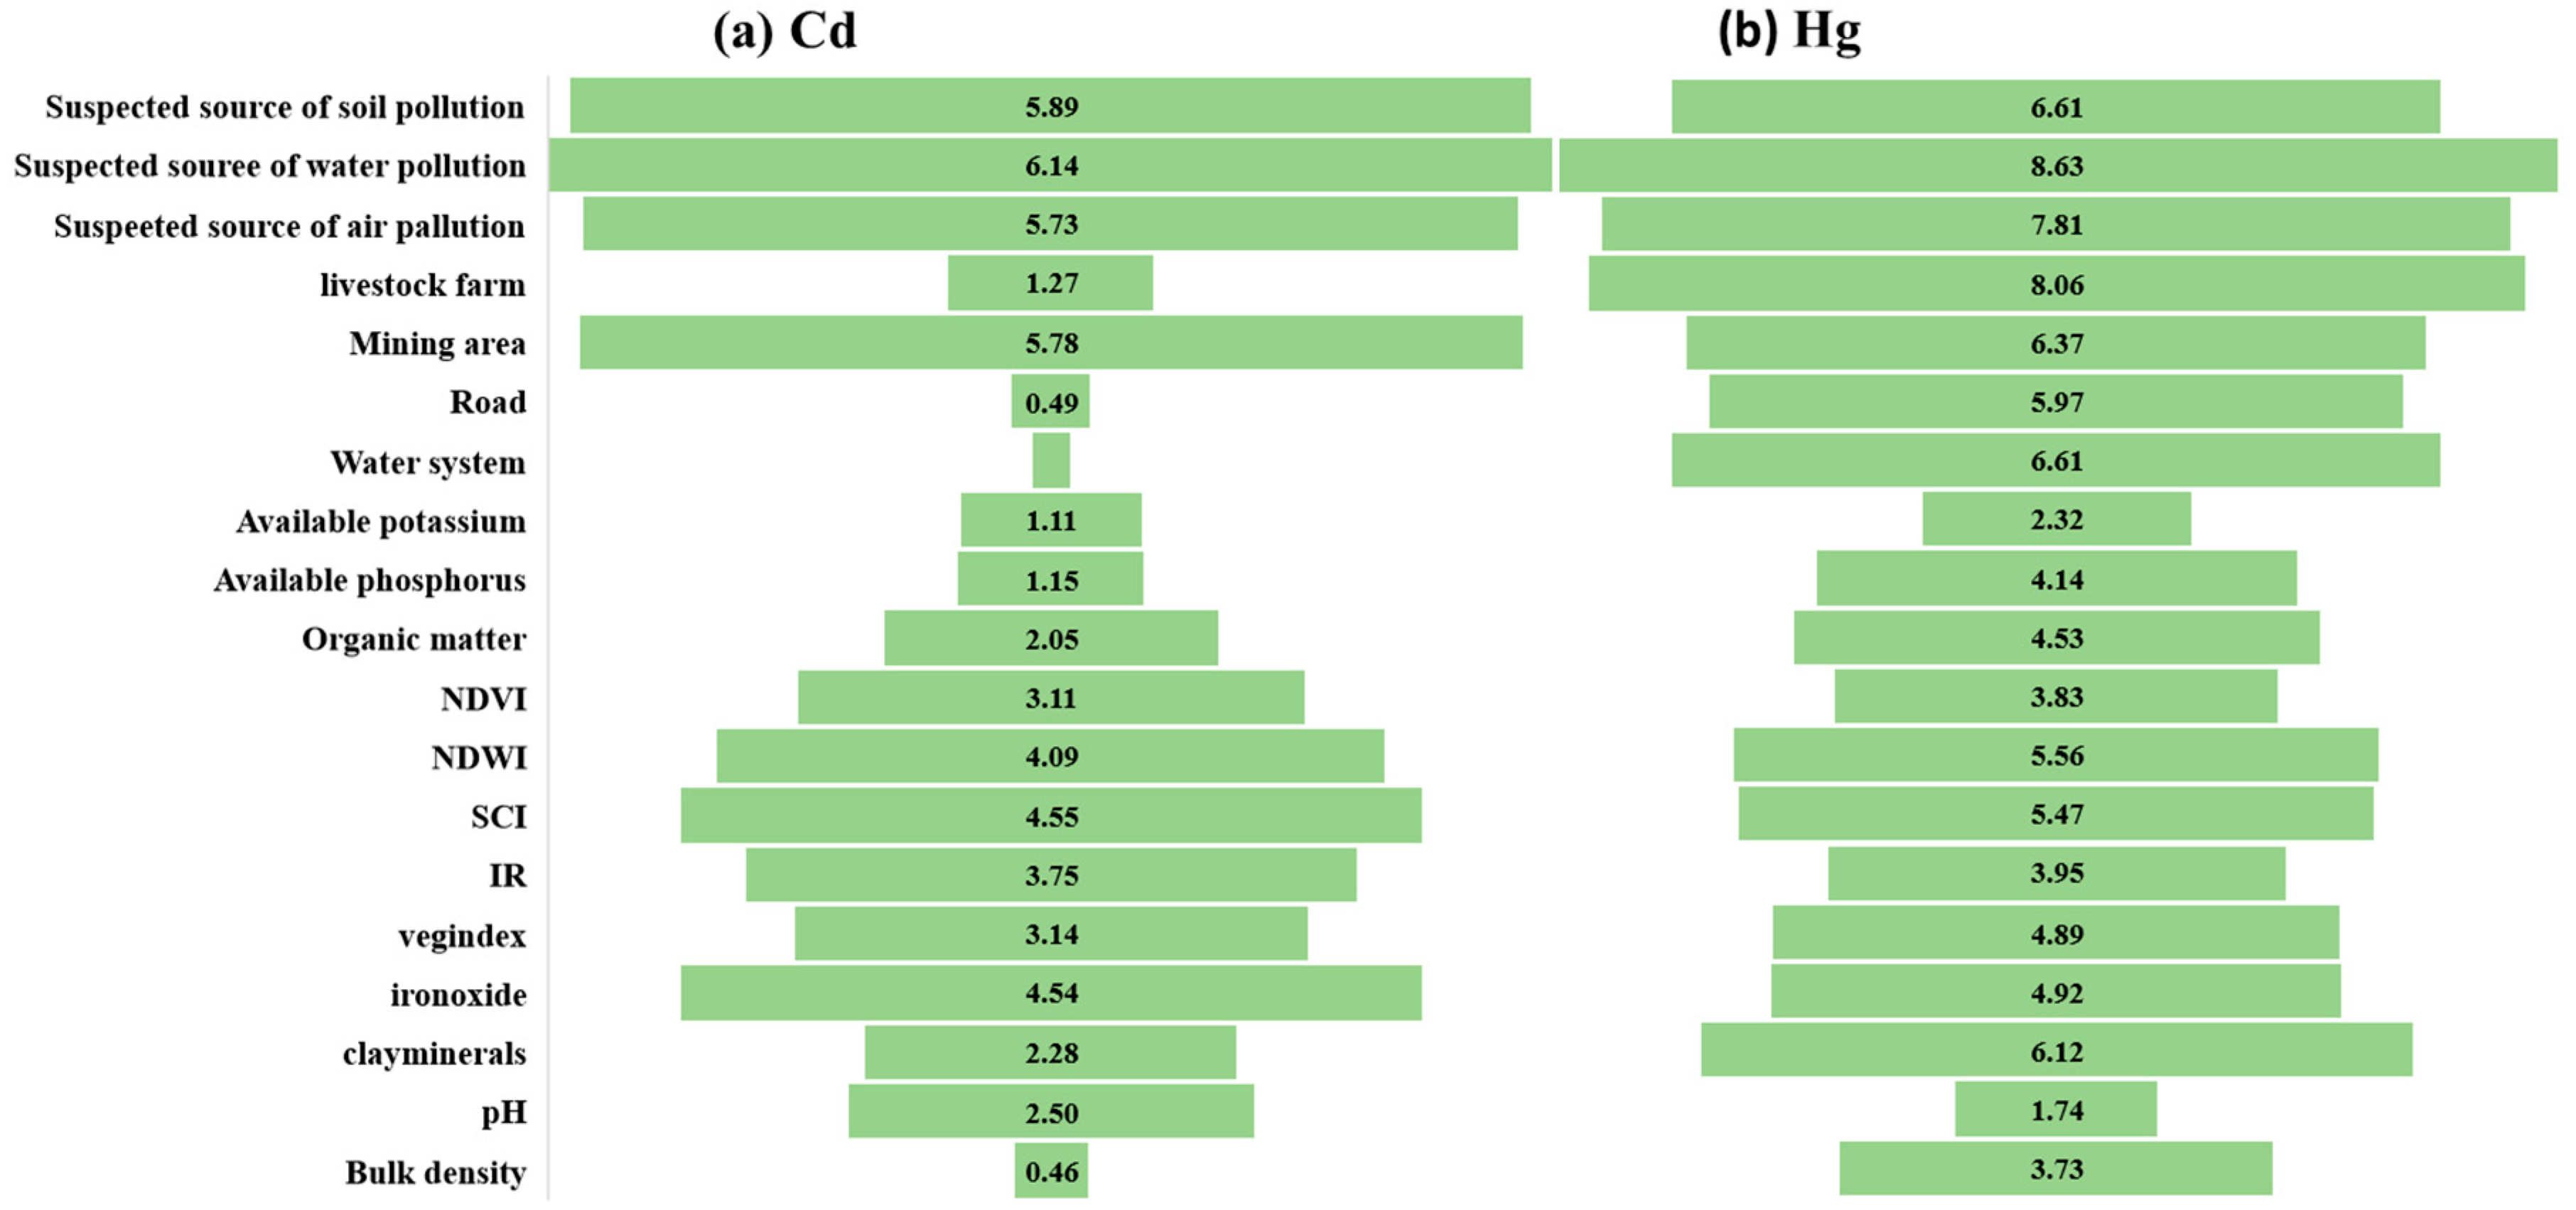
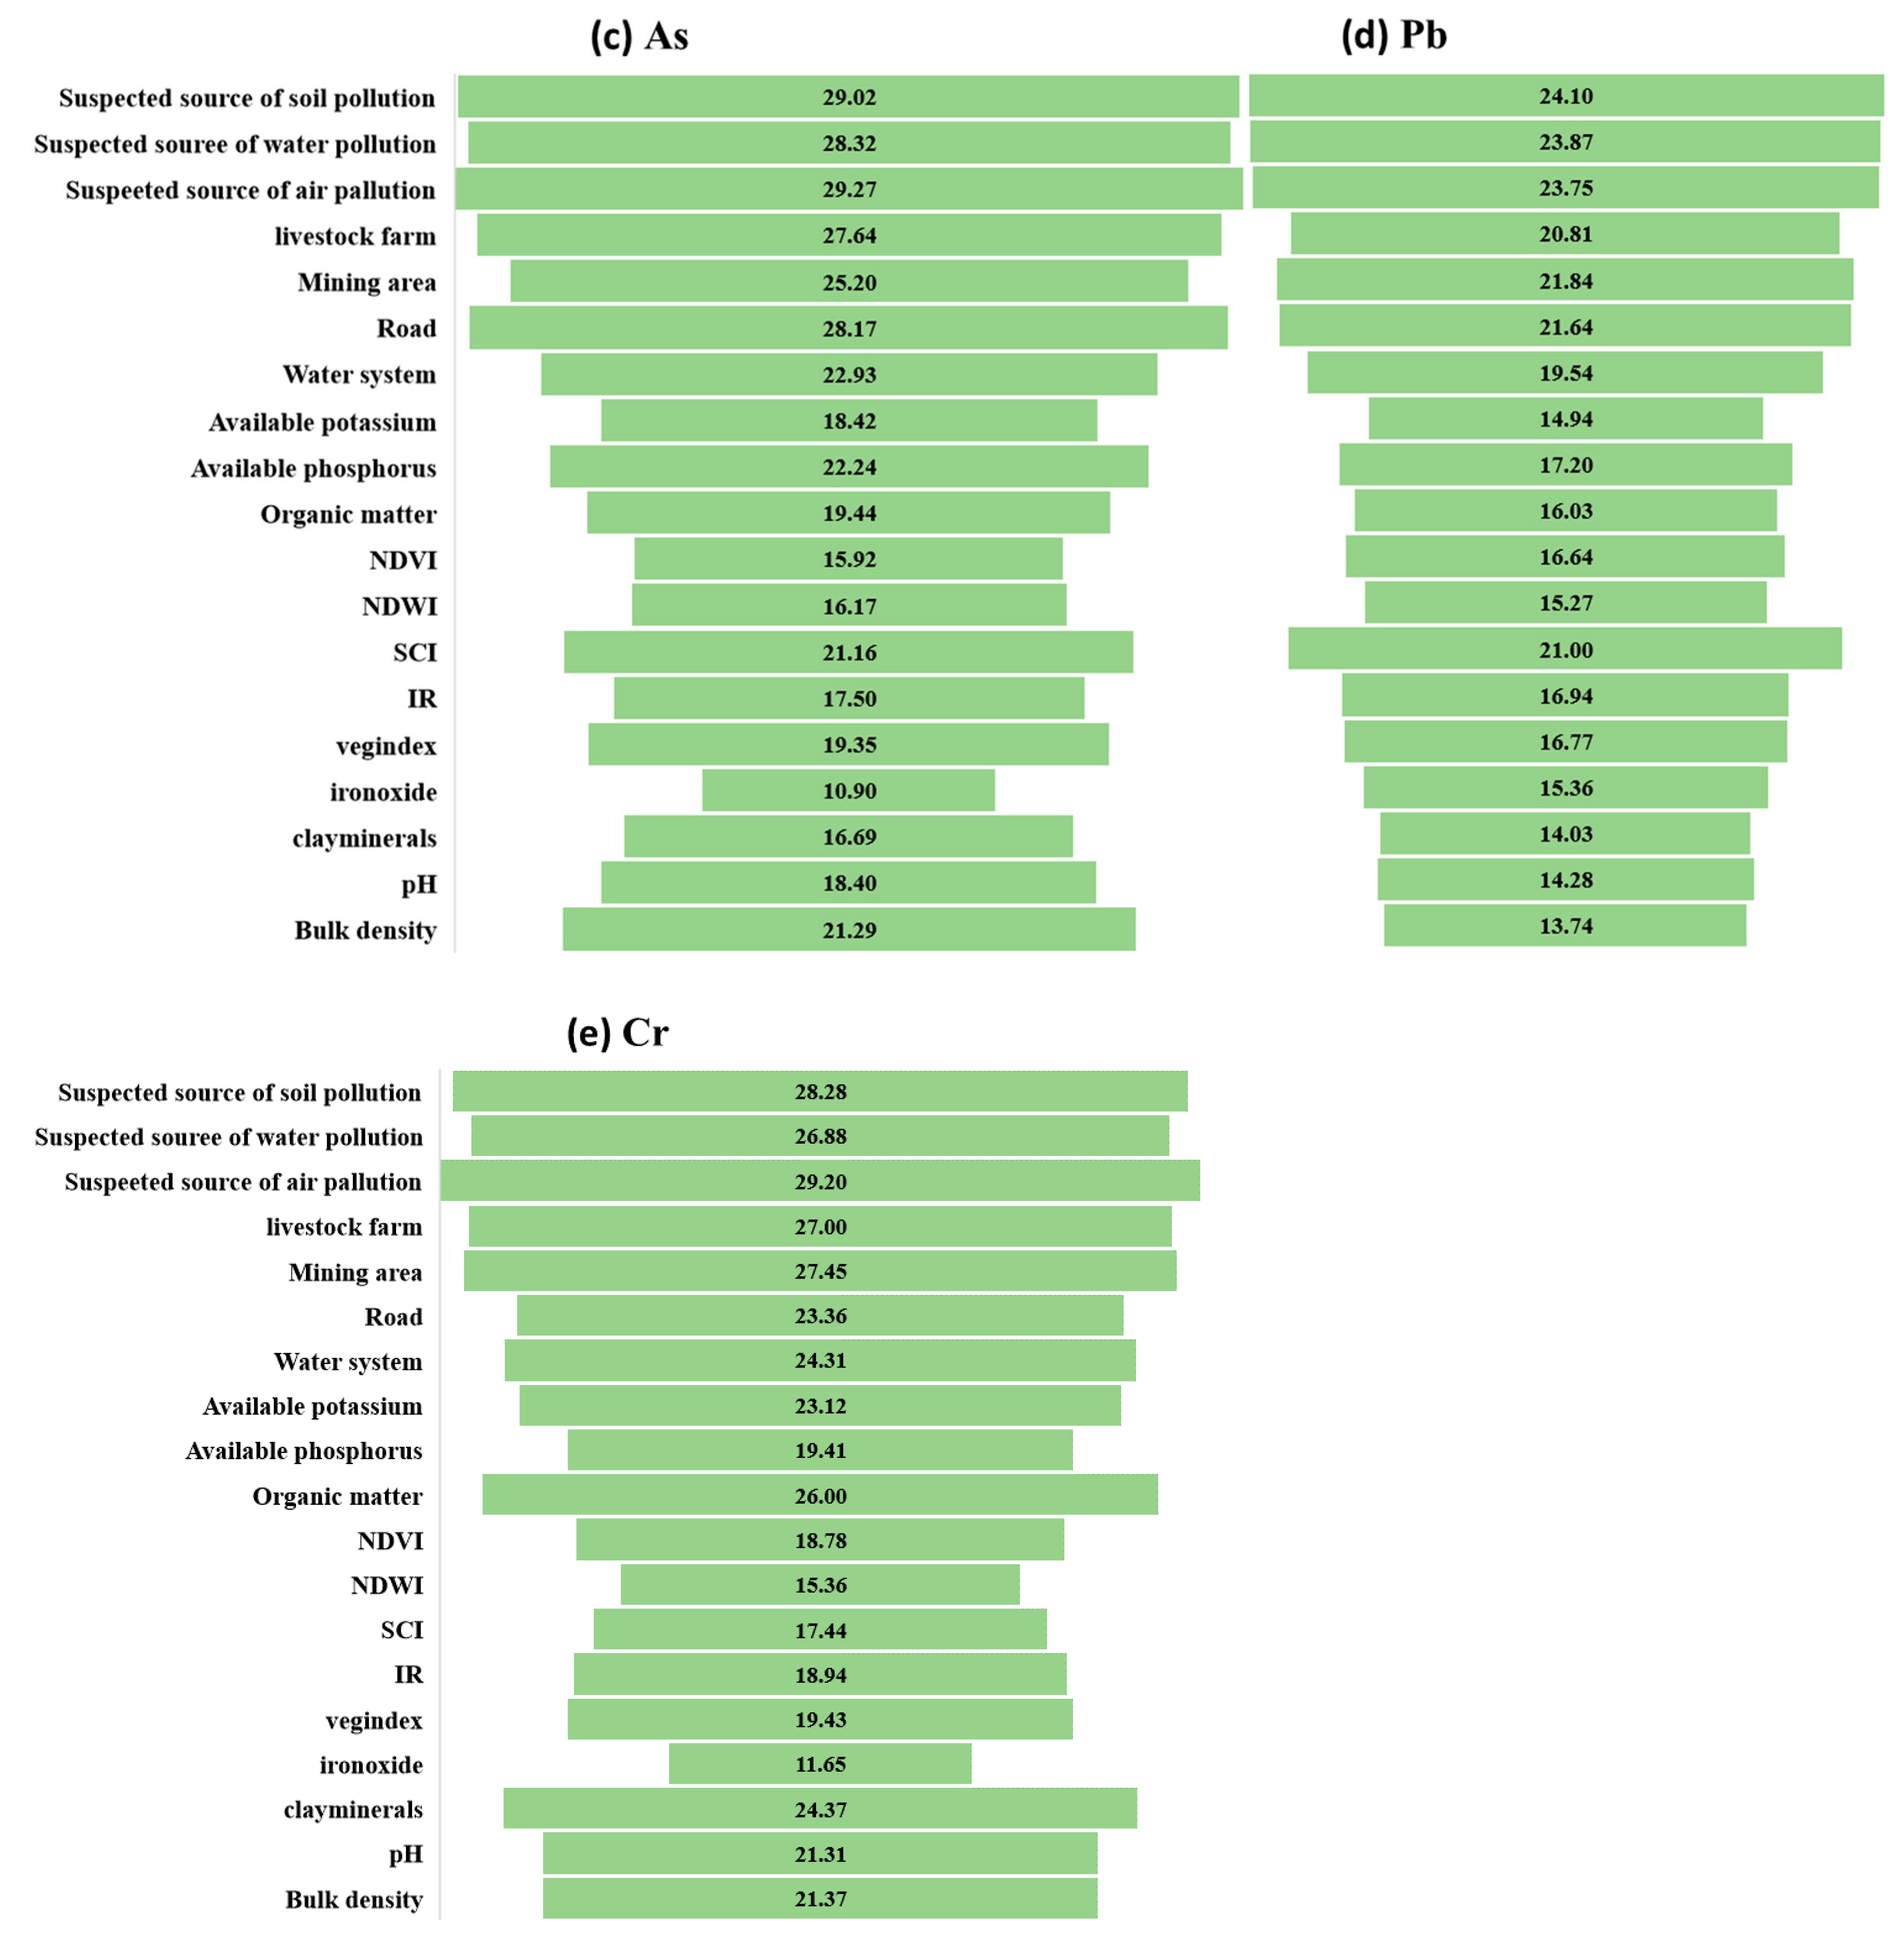
| % Increase in MSE | Cd | Hg | As | Pb | Cr |
|---|---|---|---|---|---|
| Suspected source of soil pollution | 5.89 | 6.61 | 29.02 | 24.10 | 29.20 |
| Suspected source of water pollution | 6.14 | 8.63 | 28.32 | 23.87 | 28.28 |
| Suspected source of air pollution | 5.73 | 7.81 | 29.27 | 23.75 | 27.45 |
| livestock farm | 1.27 | 8.06 | 27.64 | 21.84 | 27.00 |
| Mining area | 5.78 | 6.37 | 25.20 | 21.64 | 26.88 |
| Road | 0.49 | 5.97 | 28.17 | 21.00 | 26.00 |
| Water system | 0.23 | 6.61 | 22.93 | 20.81 | 24.37 |
| Available potassium | 1.11 | 2.32 | 18.42 | 19.54 | 24.31 |
| Available phosphorus | 1.15 | 4.14 | 22.24 | 17.20 | 23.36 |
| Organic matter | 2.05 | 4.53 | 19.44 | 16.94 | 23.12 |
| NDVI | 3.11 | 3.83 | 15.92 | 16.77 | 21.37 |
| NDWI | 4.09 | 5.56 | 16.17 | 16.64 | 21.31 |
| SCI | 4.55 | 5.47 | 21.16 | 16.03 | 19.43 |
| IR | 3.75 | 3.95 | 17.50 | 15.36 | 19.41 |
| vegindex | 3.14 | 4.89 | 19.35 | 15.27 | 18.94 |
| Ironoxide | 4.54 | 4.92 | 10.90 | 14.94 | 18.78 |
| Clayminerals | 2.28 | 6.12 | 16.69 | 14.28 | 17.44 |
| pH | 2.50 | 1.74 | 18.40 | 14.03 | 15.36 |
| Bulk density | 0.46 | 3.73 | 21.29 | 13.74 | 11.65 |
Publisher’s Note: MDPI stays neutral with regard to jurisdictional claims in published maps and institutional affiliations. |
© 2020 by the authors. Licensee MDPI, Basel, Switzerland. This article is an open access article distributed under the terms and conditions of the Creative Commons Attribution (CC BY) license (http://creativecommons.org/licenses/by/4.0/).
Share and Cite
Xiao, L.; Zhou, Y.; Huang, H.; Liu, Y.-J.; Li, K.; Li, M.-Y.; Tian, Y.; Wu, F. Application of Geostatistical Analysis and Random Forest for Source Analysis and Human Health Risk Assessment of Potentially Toxic Elements (PTEs) in Arable Land Soil. Int. J. Environ. Res. Public Health 2020, 17, 9296. https://0-doi-org.brum.beds.ac.uk/10.3390/ijerph17249296
Xiao L, Zhou Y, Huang H, Liu Y-J, Li K, Li M-Y, Tian Y, Wu F. Application of Geostatistical Analysis and Random Forest for Source Analysis and Human Health Risk Assessment of Potentially Toxic Elements (PTEs) in Arable Land Soil. International Journal of Environmental Research and Public Health. 2020; 17(24):9296. https://0-doi-org.brum.beds.ac.uk/10.3390/ijerph17249296
Chicago/Turabian StyleXiao, Liang, Yong Zhou, He Huang, Yu-Jie Liu, Ke Li, Meng-Yao Li, Yang Tian, and Fei Wu. 2020. "Application of Geostatistical Analysis and Random Forest for Source Analysis and Human Health Risk Assessment of Potentially Toxic Elements (PTEs) in Arable Land Soil" International Journal of Environmental Research and Public Health 17, no. 24: 9296. https://0-doi-org.brum.beds.ac.uk/10.3390/ijerph17249296