Environmental, Economic and Social Impact Assessment: Study of Bridges in China’s Five Major Economic Regions


Abstract
:1. Introduction
2. Methods
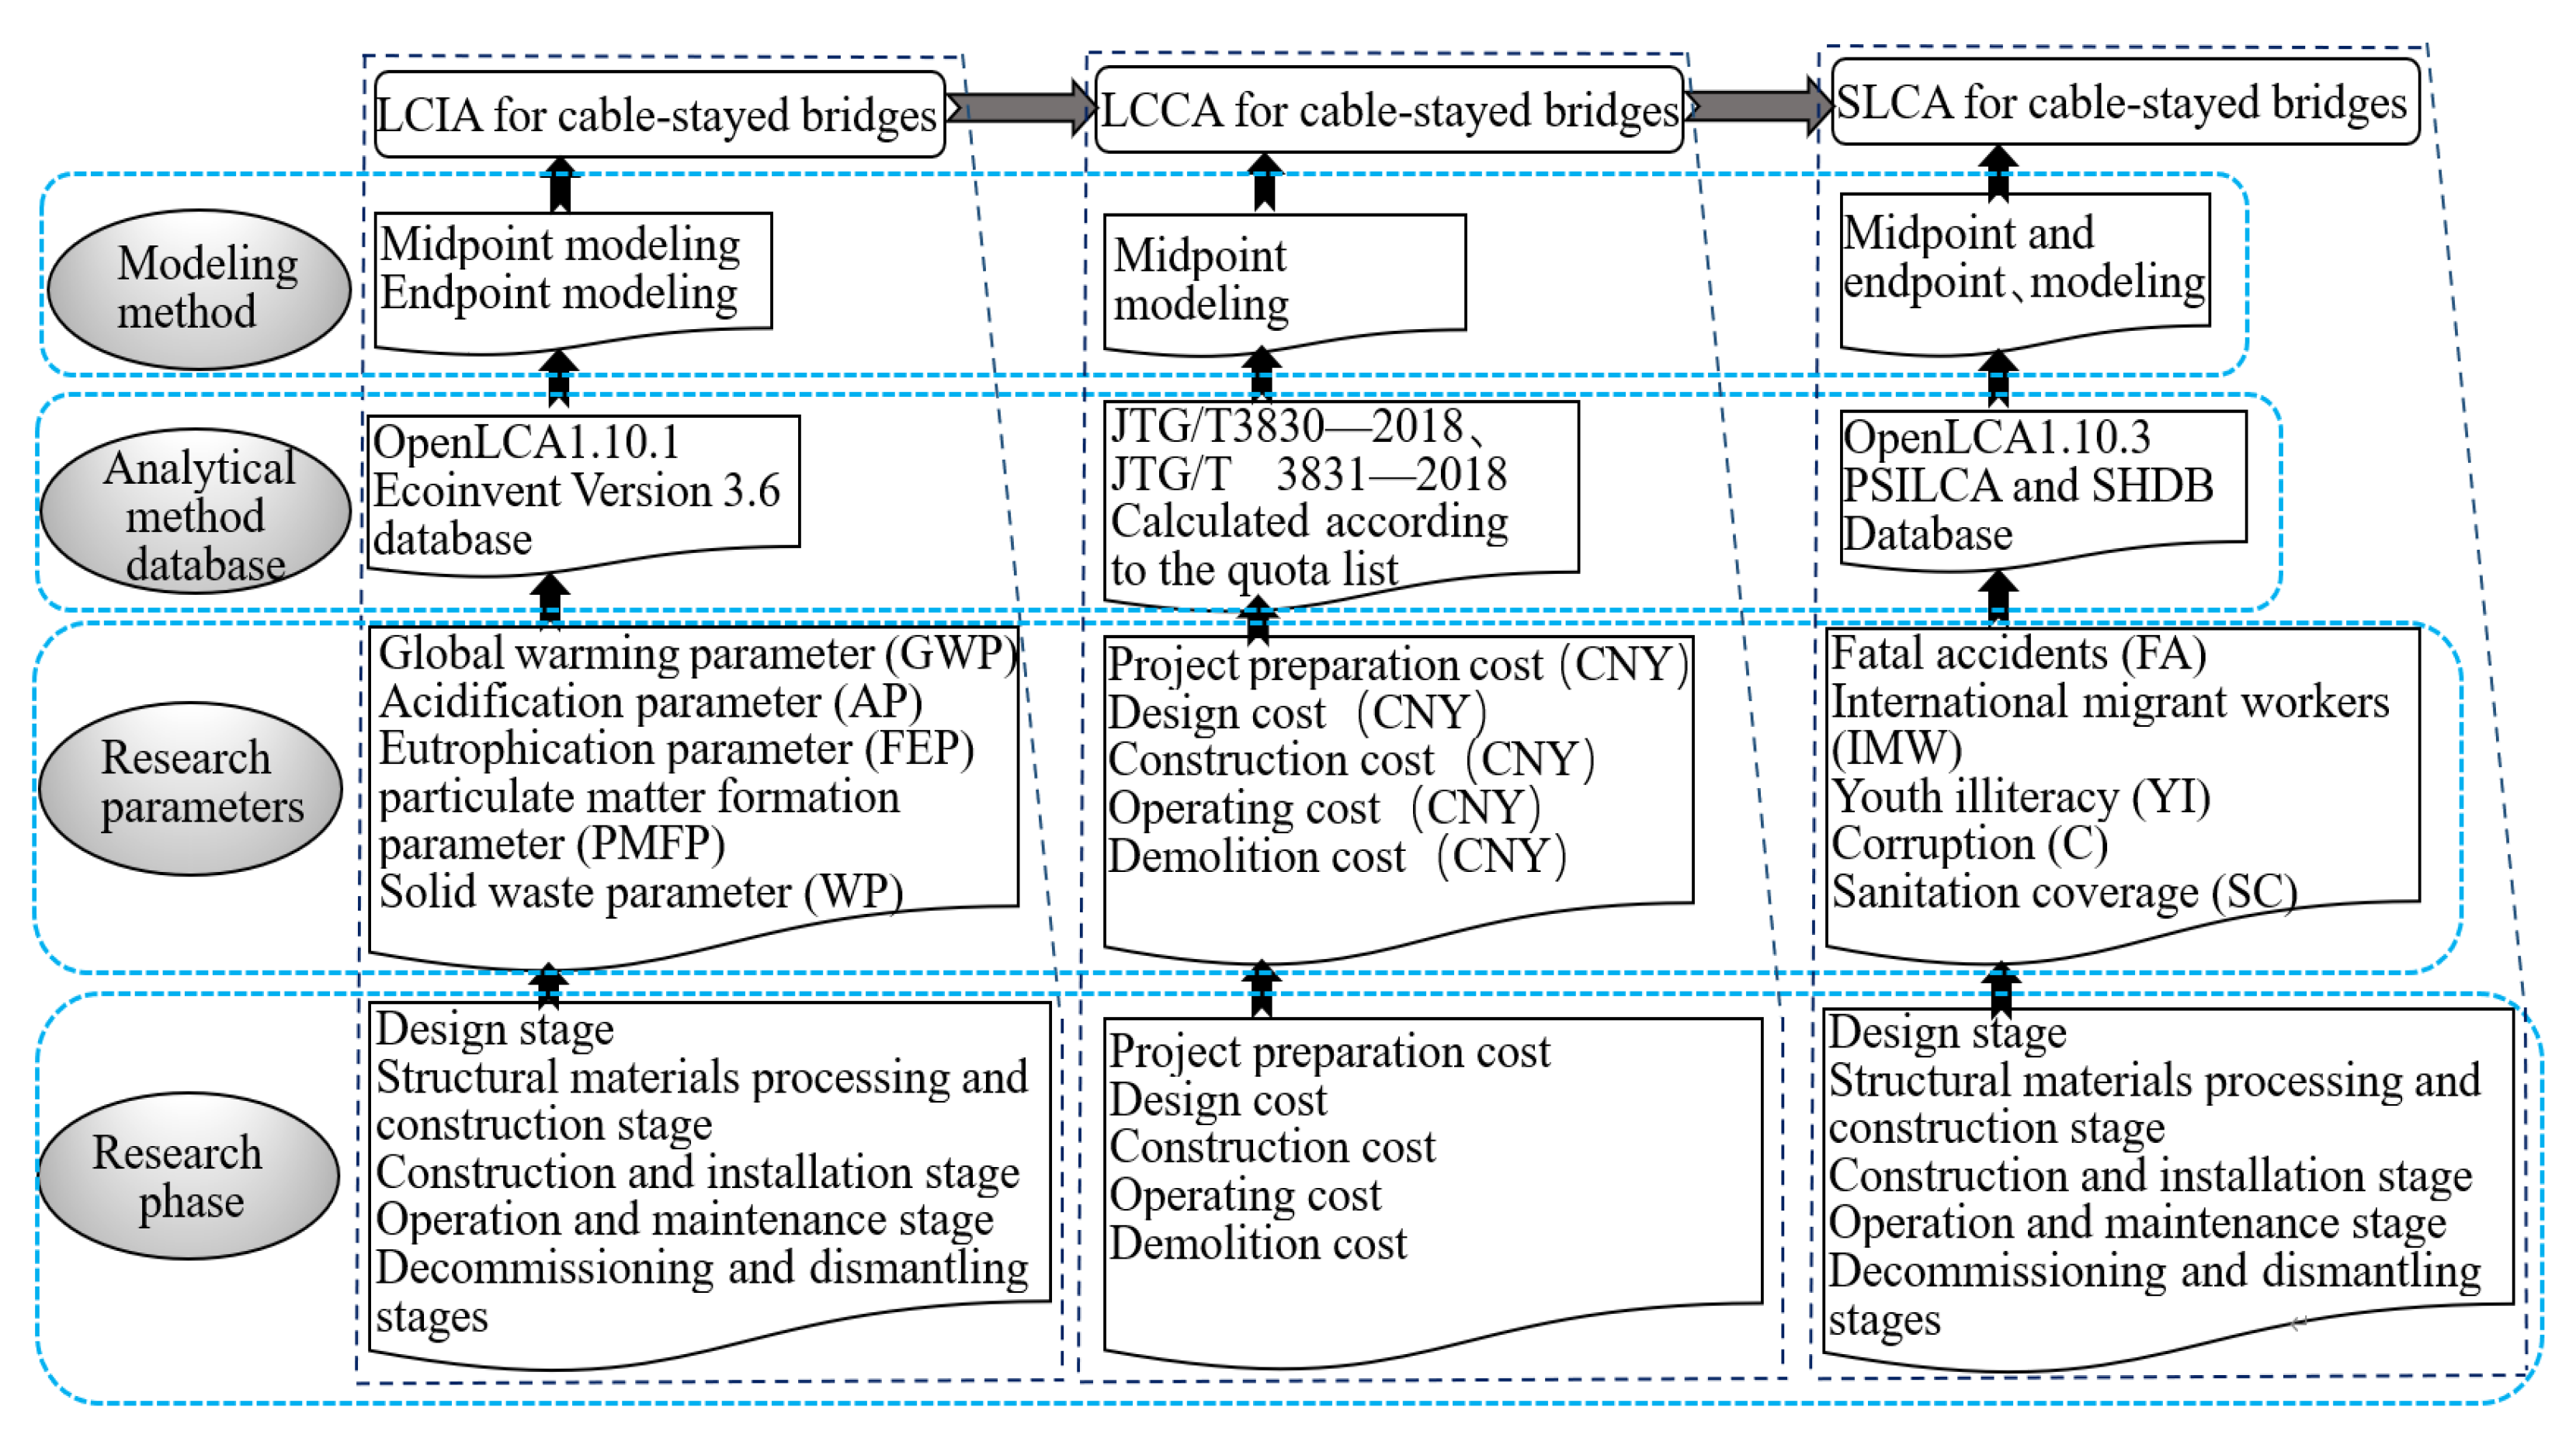
2.1. Modeling Analysis
2.1.1. LCIA
2.1.2. LCCA
2.1.3. SILA
2.2. Research Process
2.2.1. LCIA
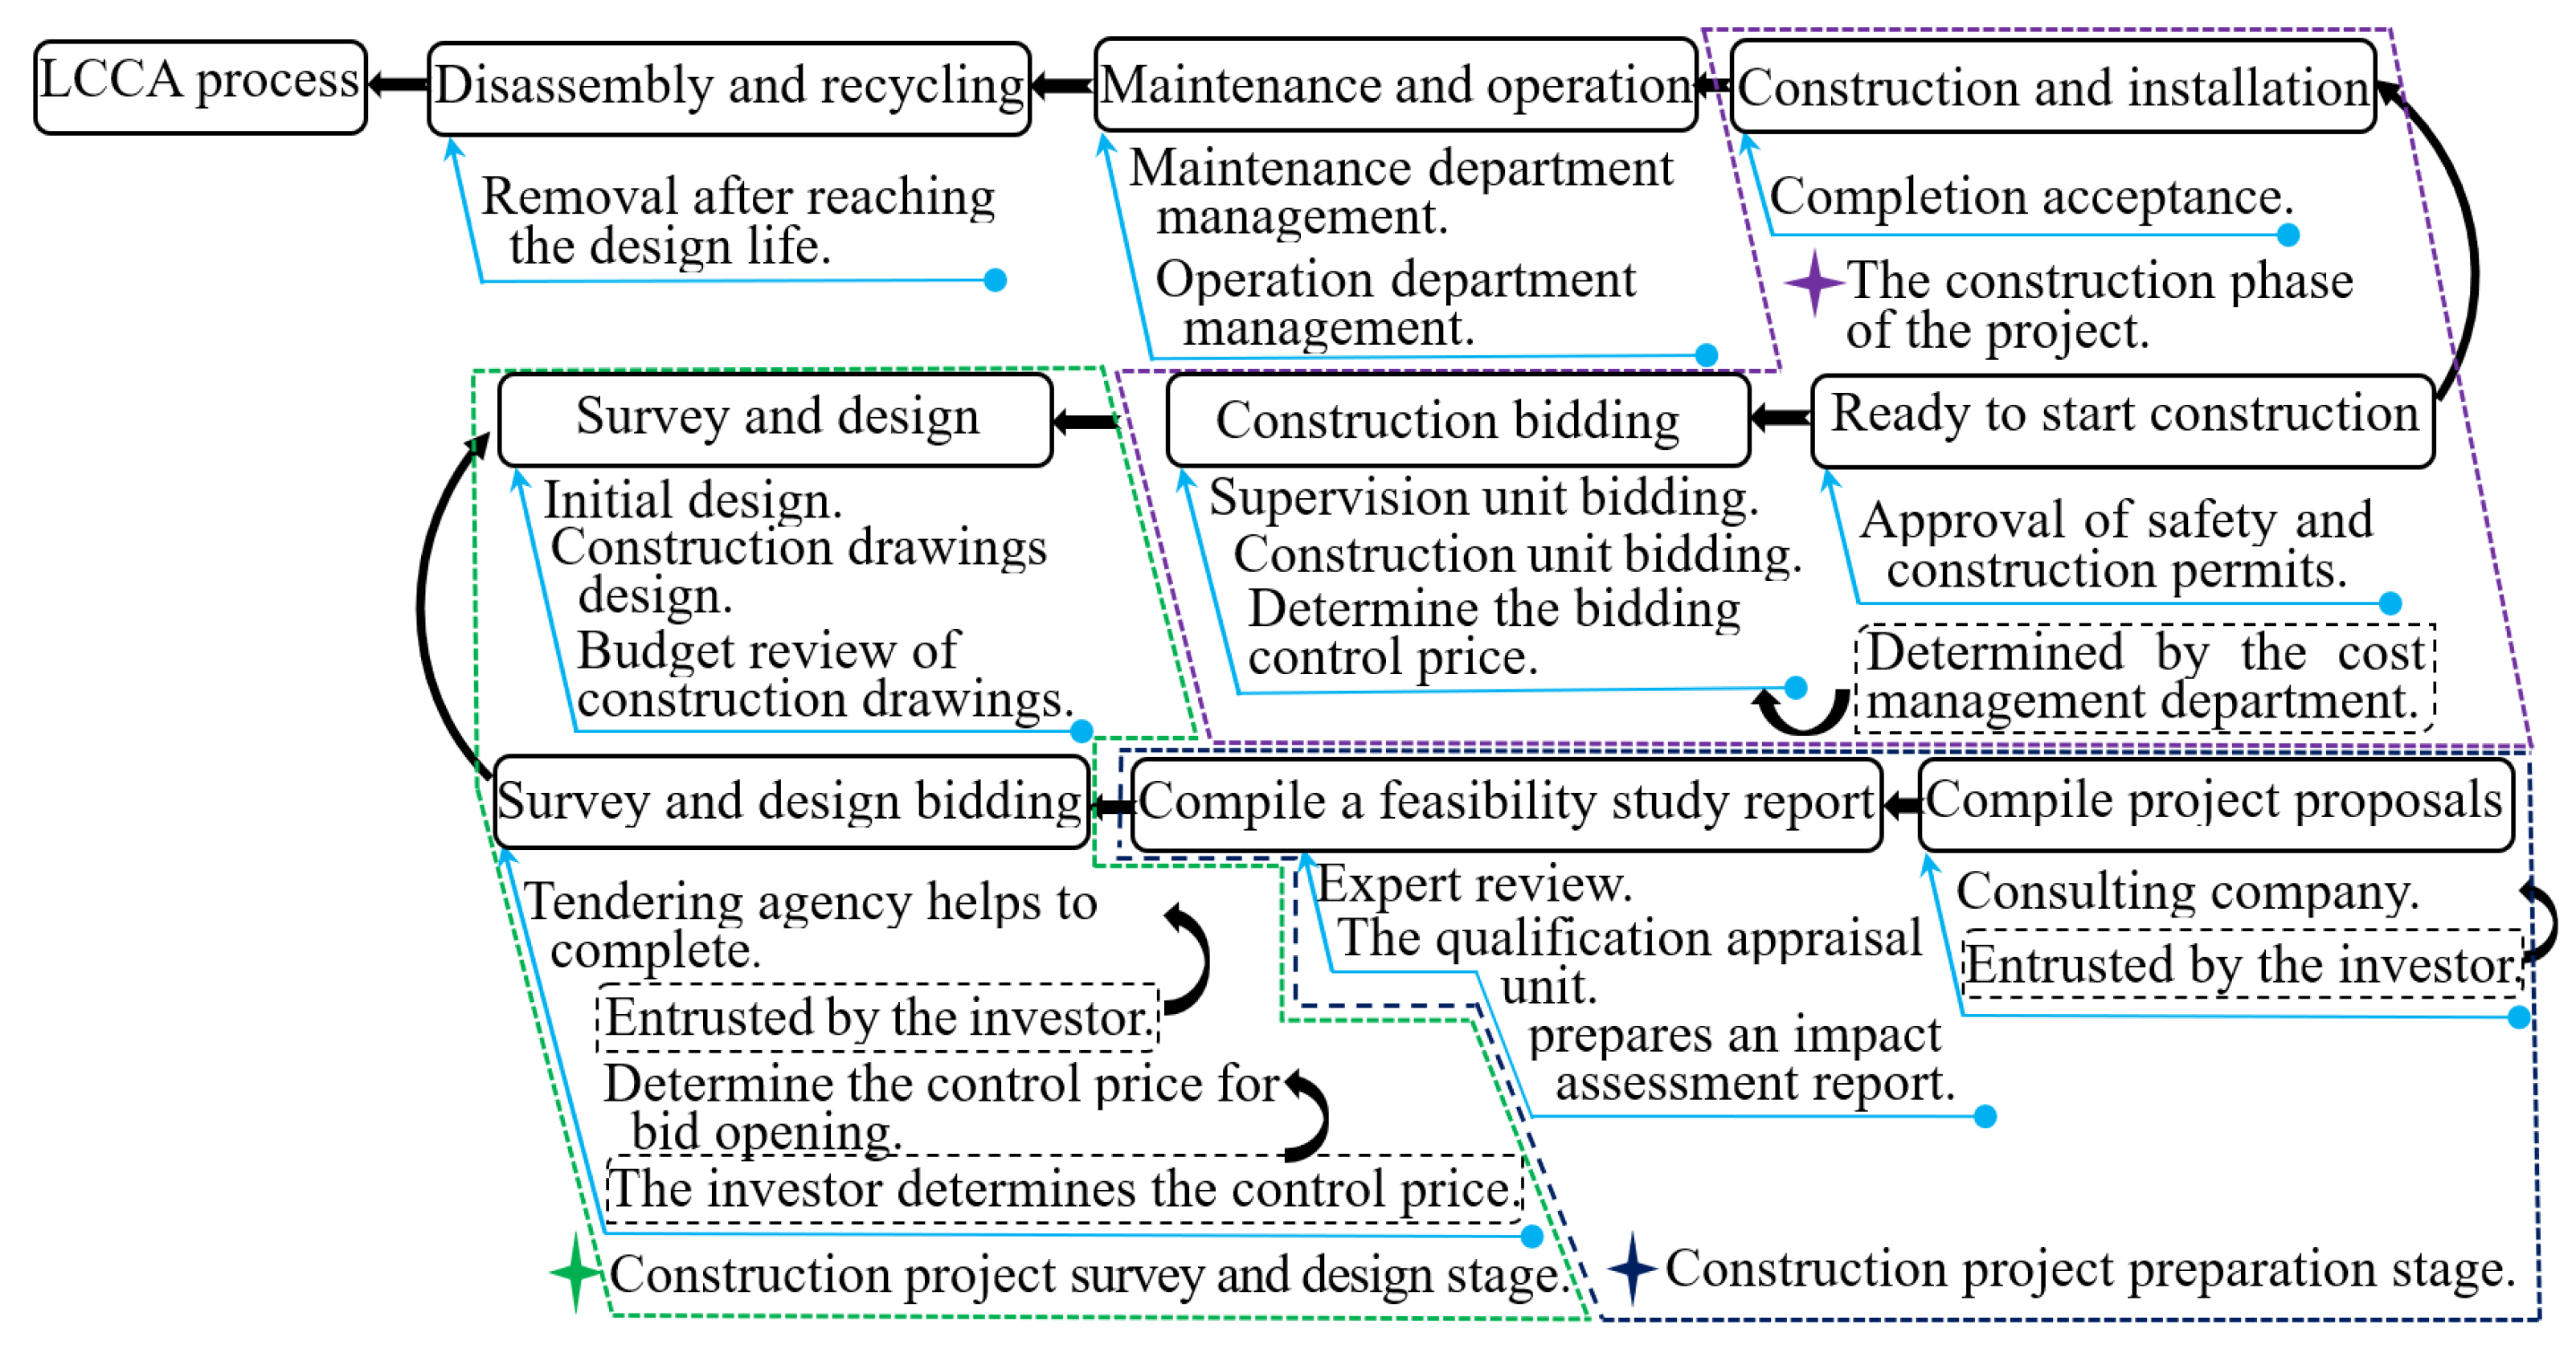
2.2.2. LCCA
2.2.3. SILA
3. Results and Discussion
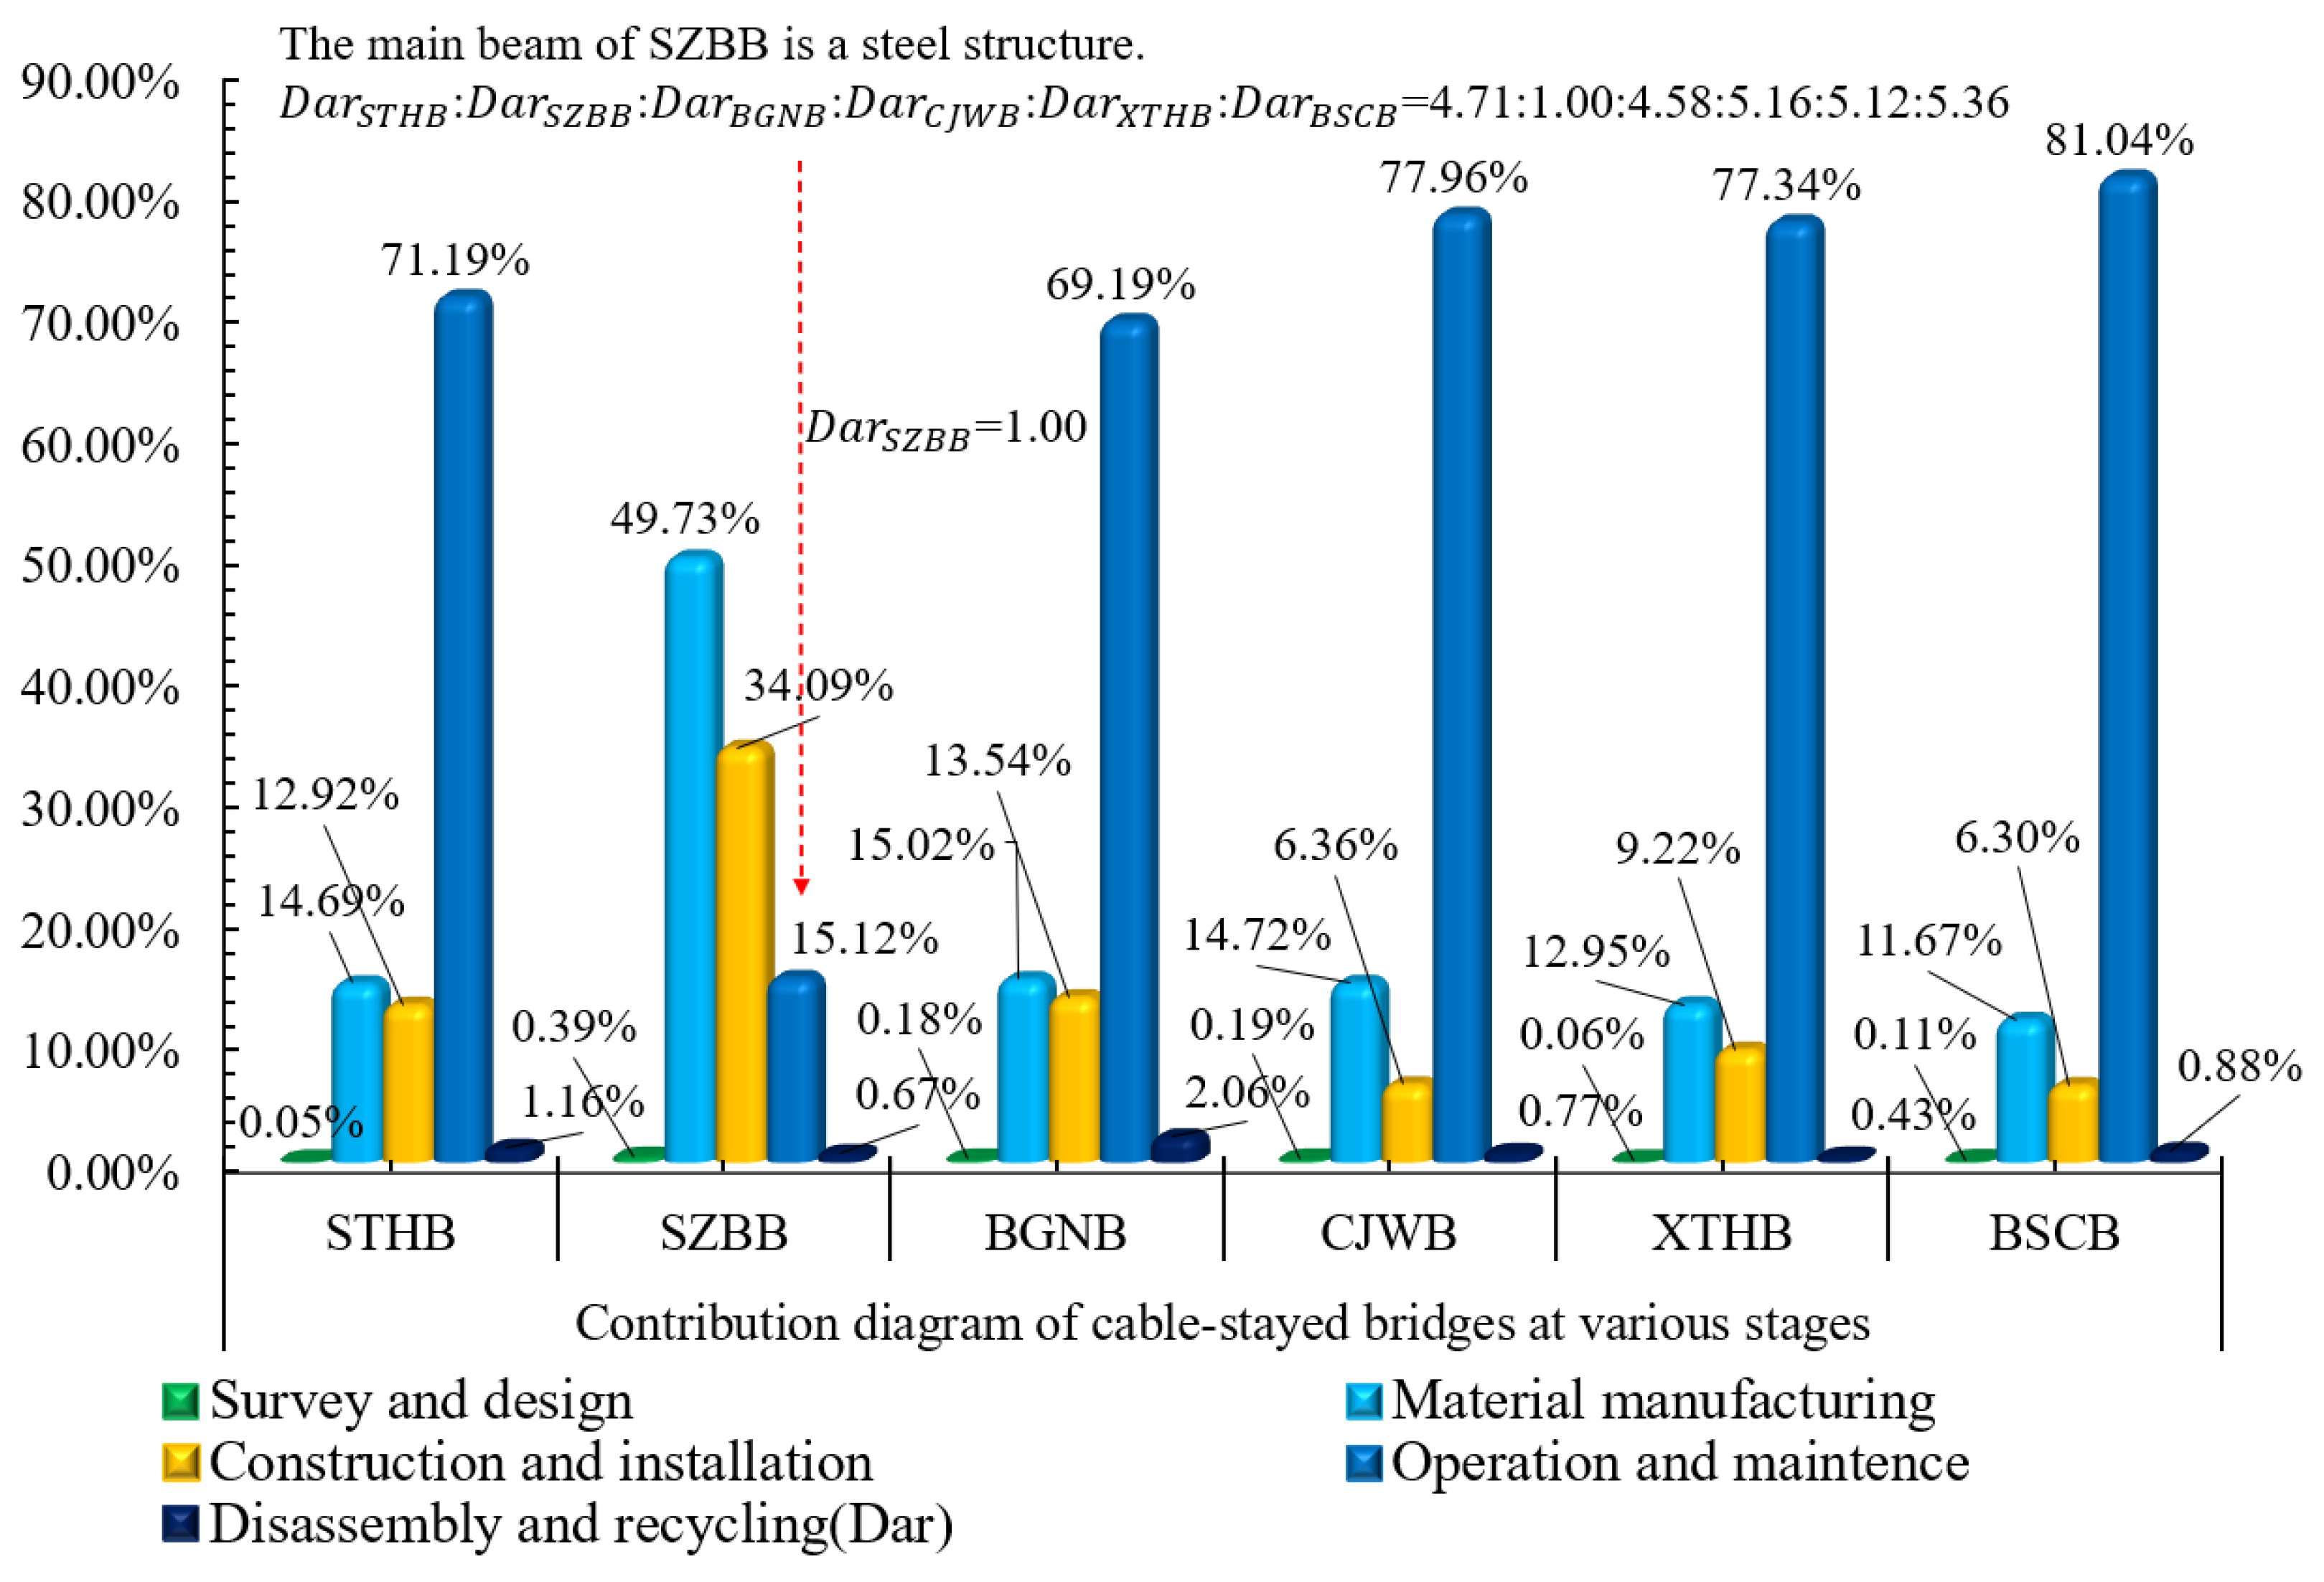
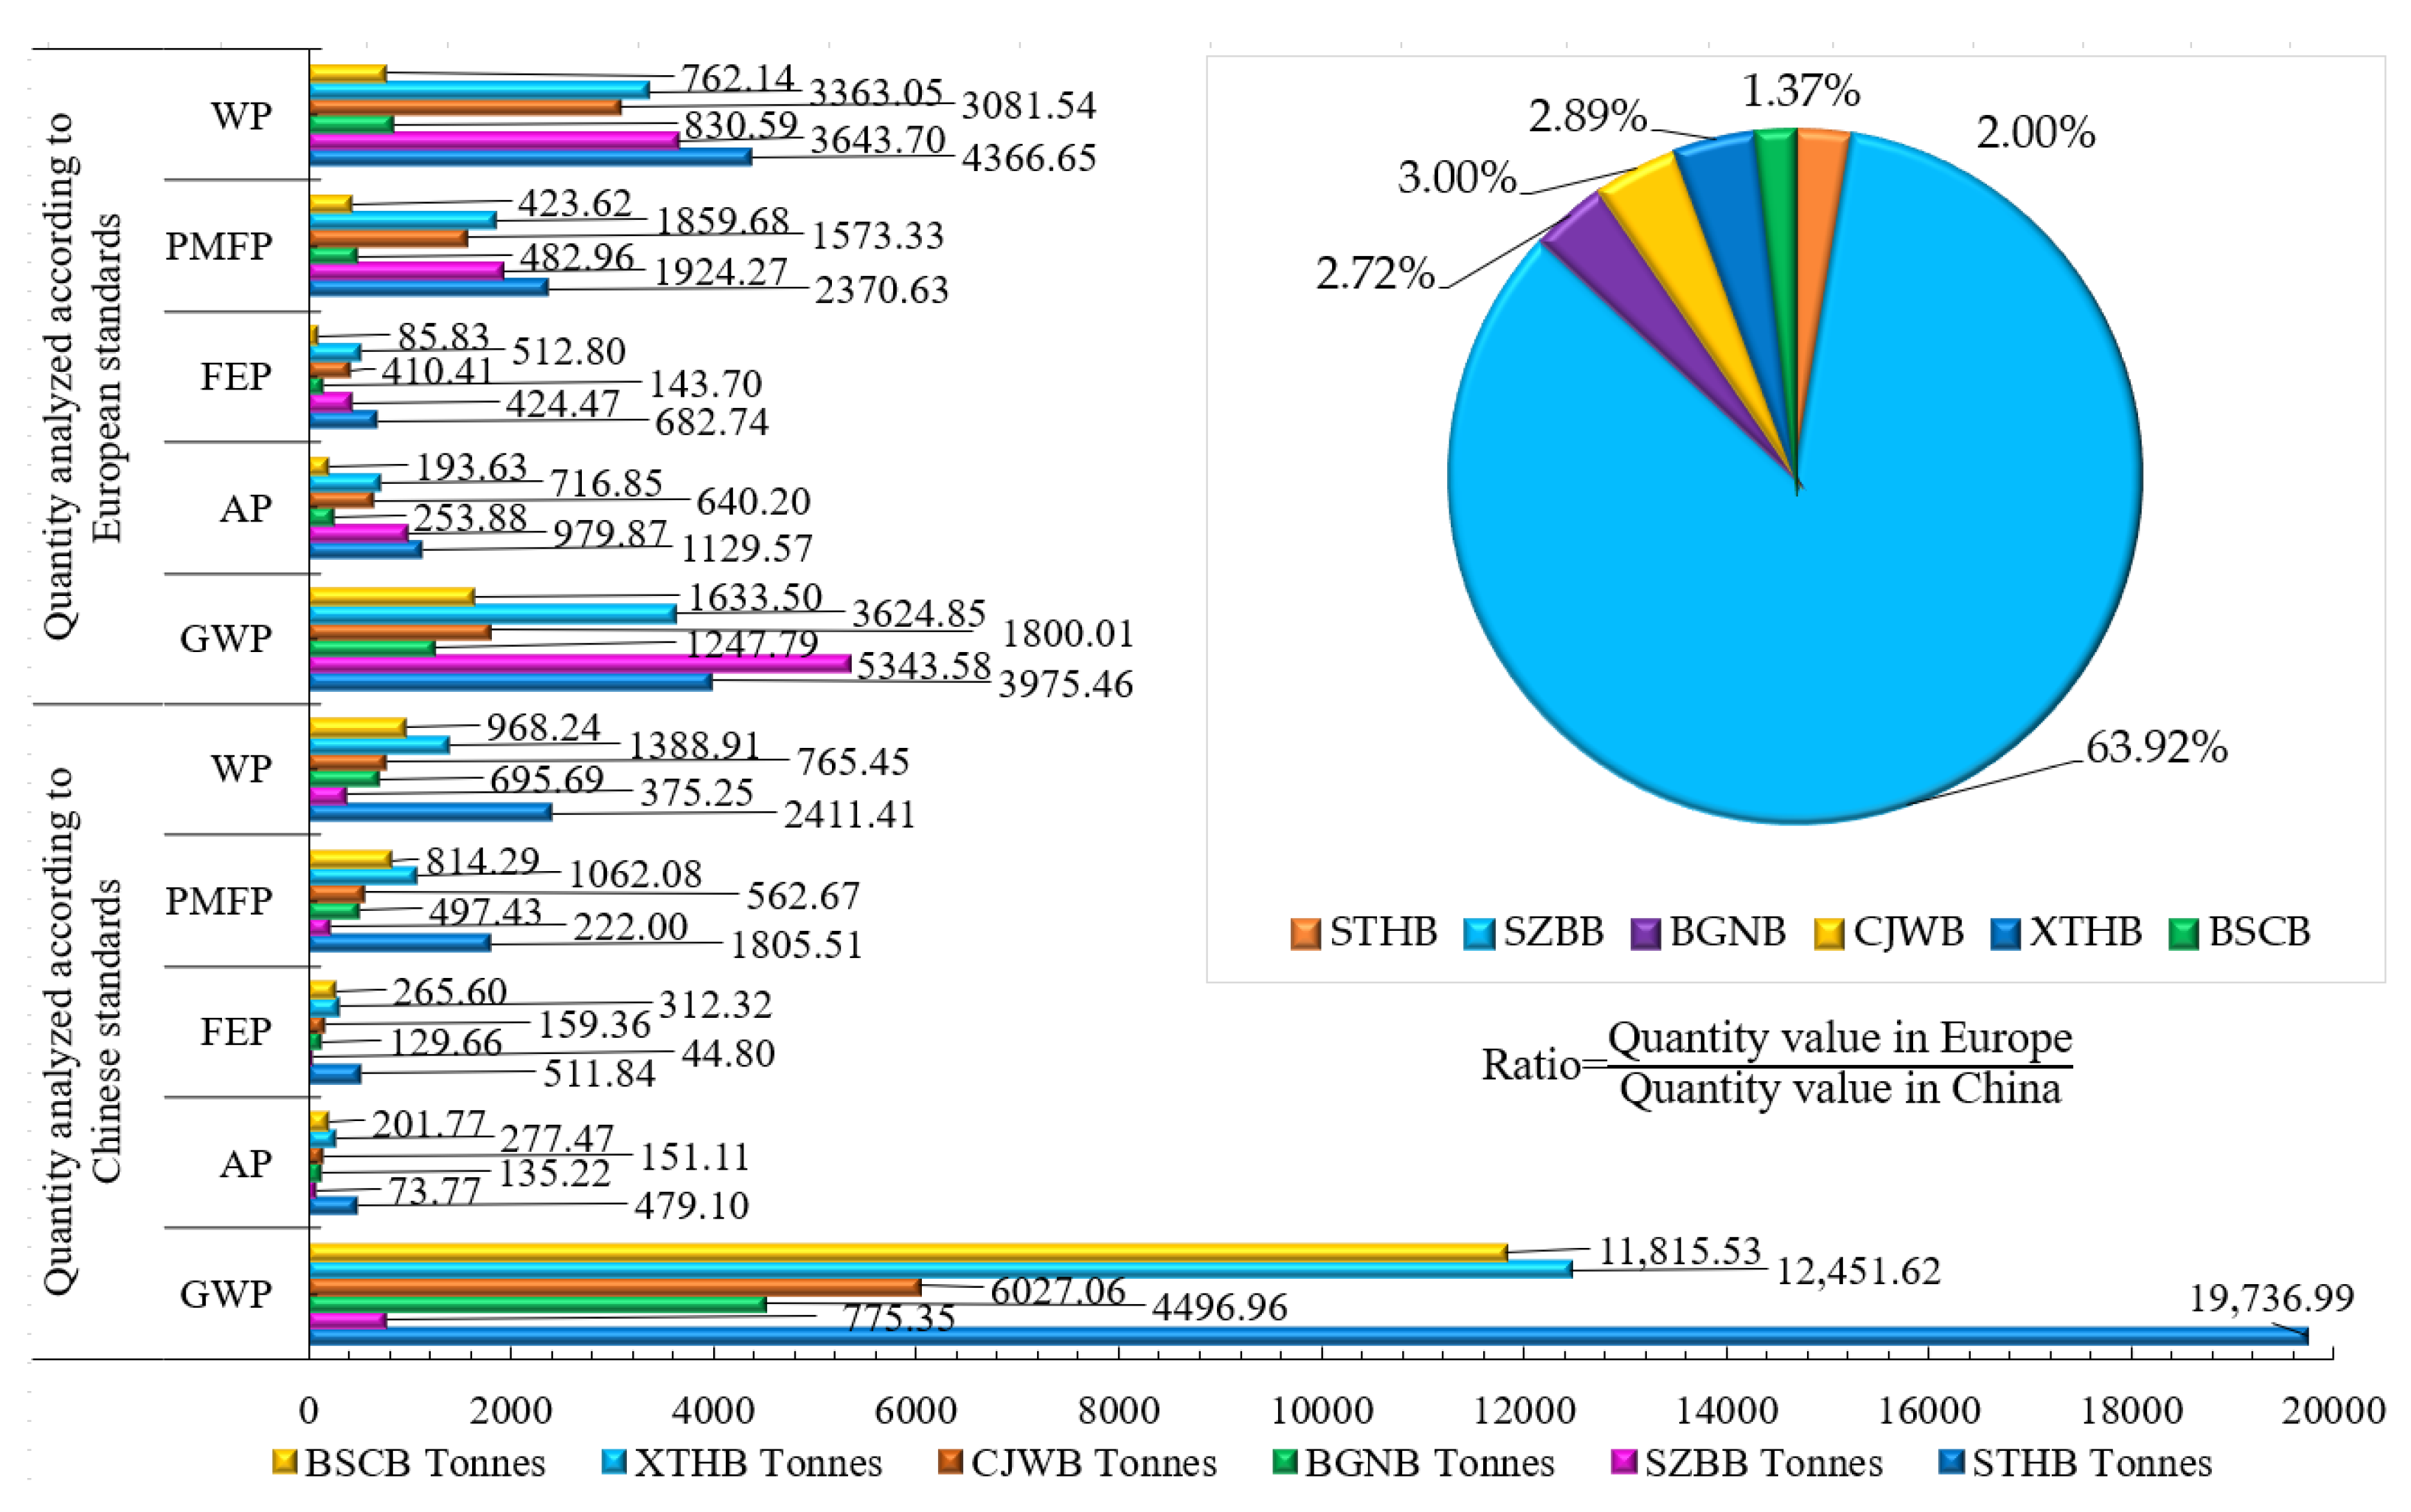
3.1. LCIA
3.2. Comparison
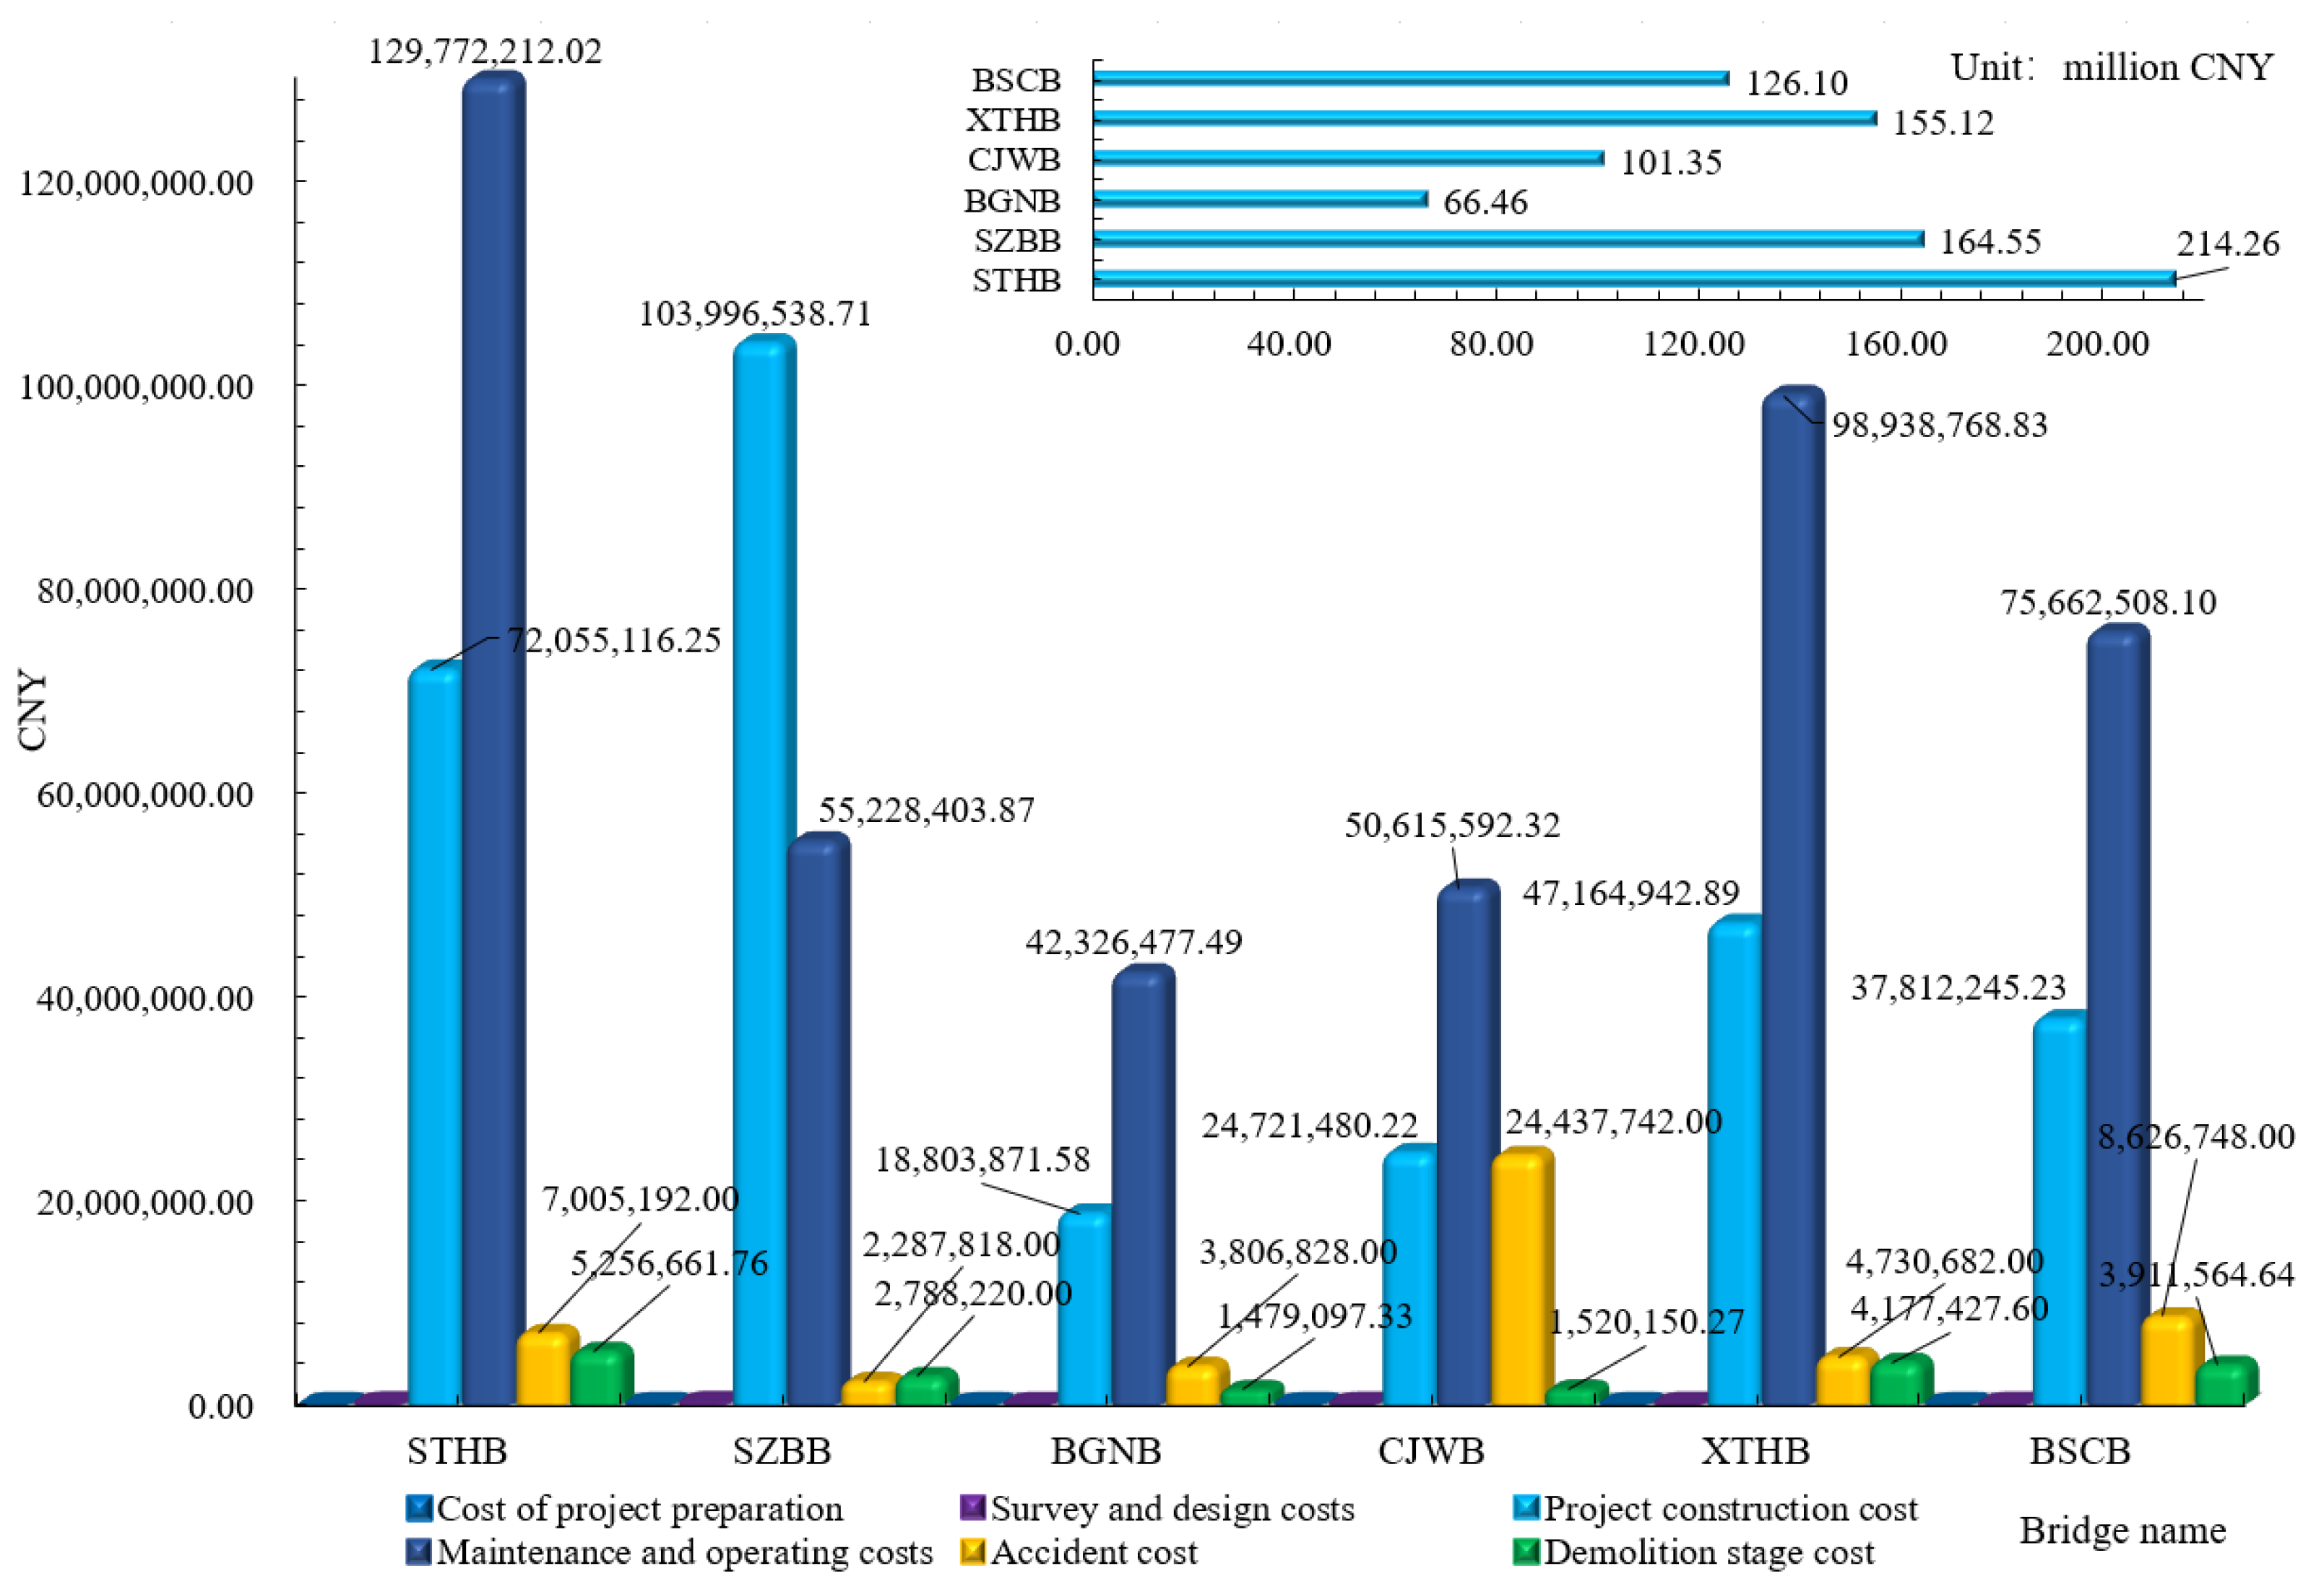
3.3. LCCA
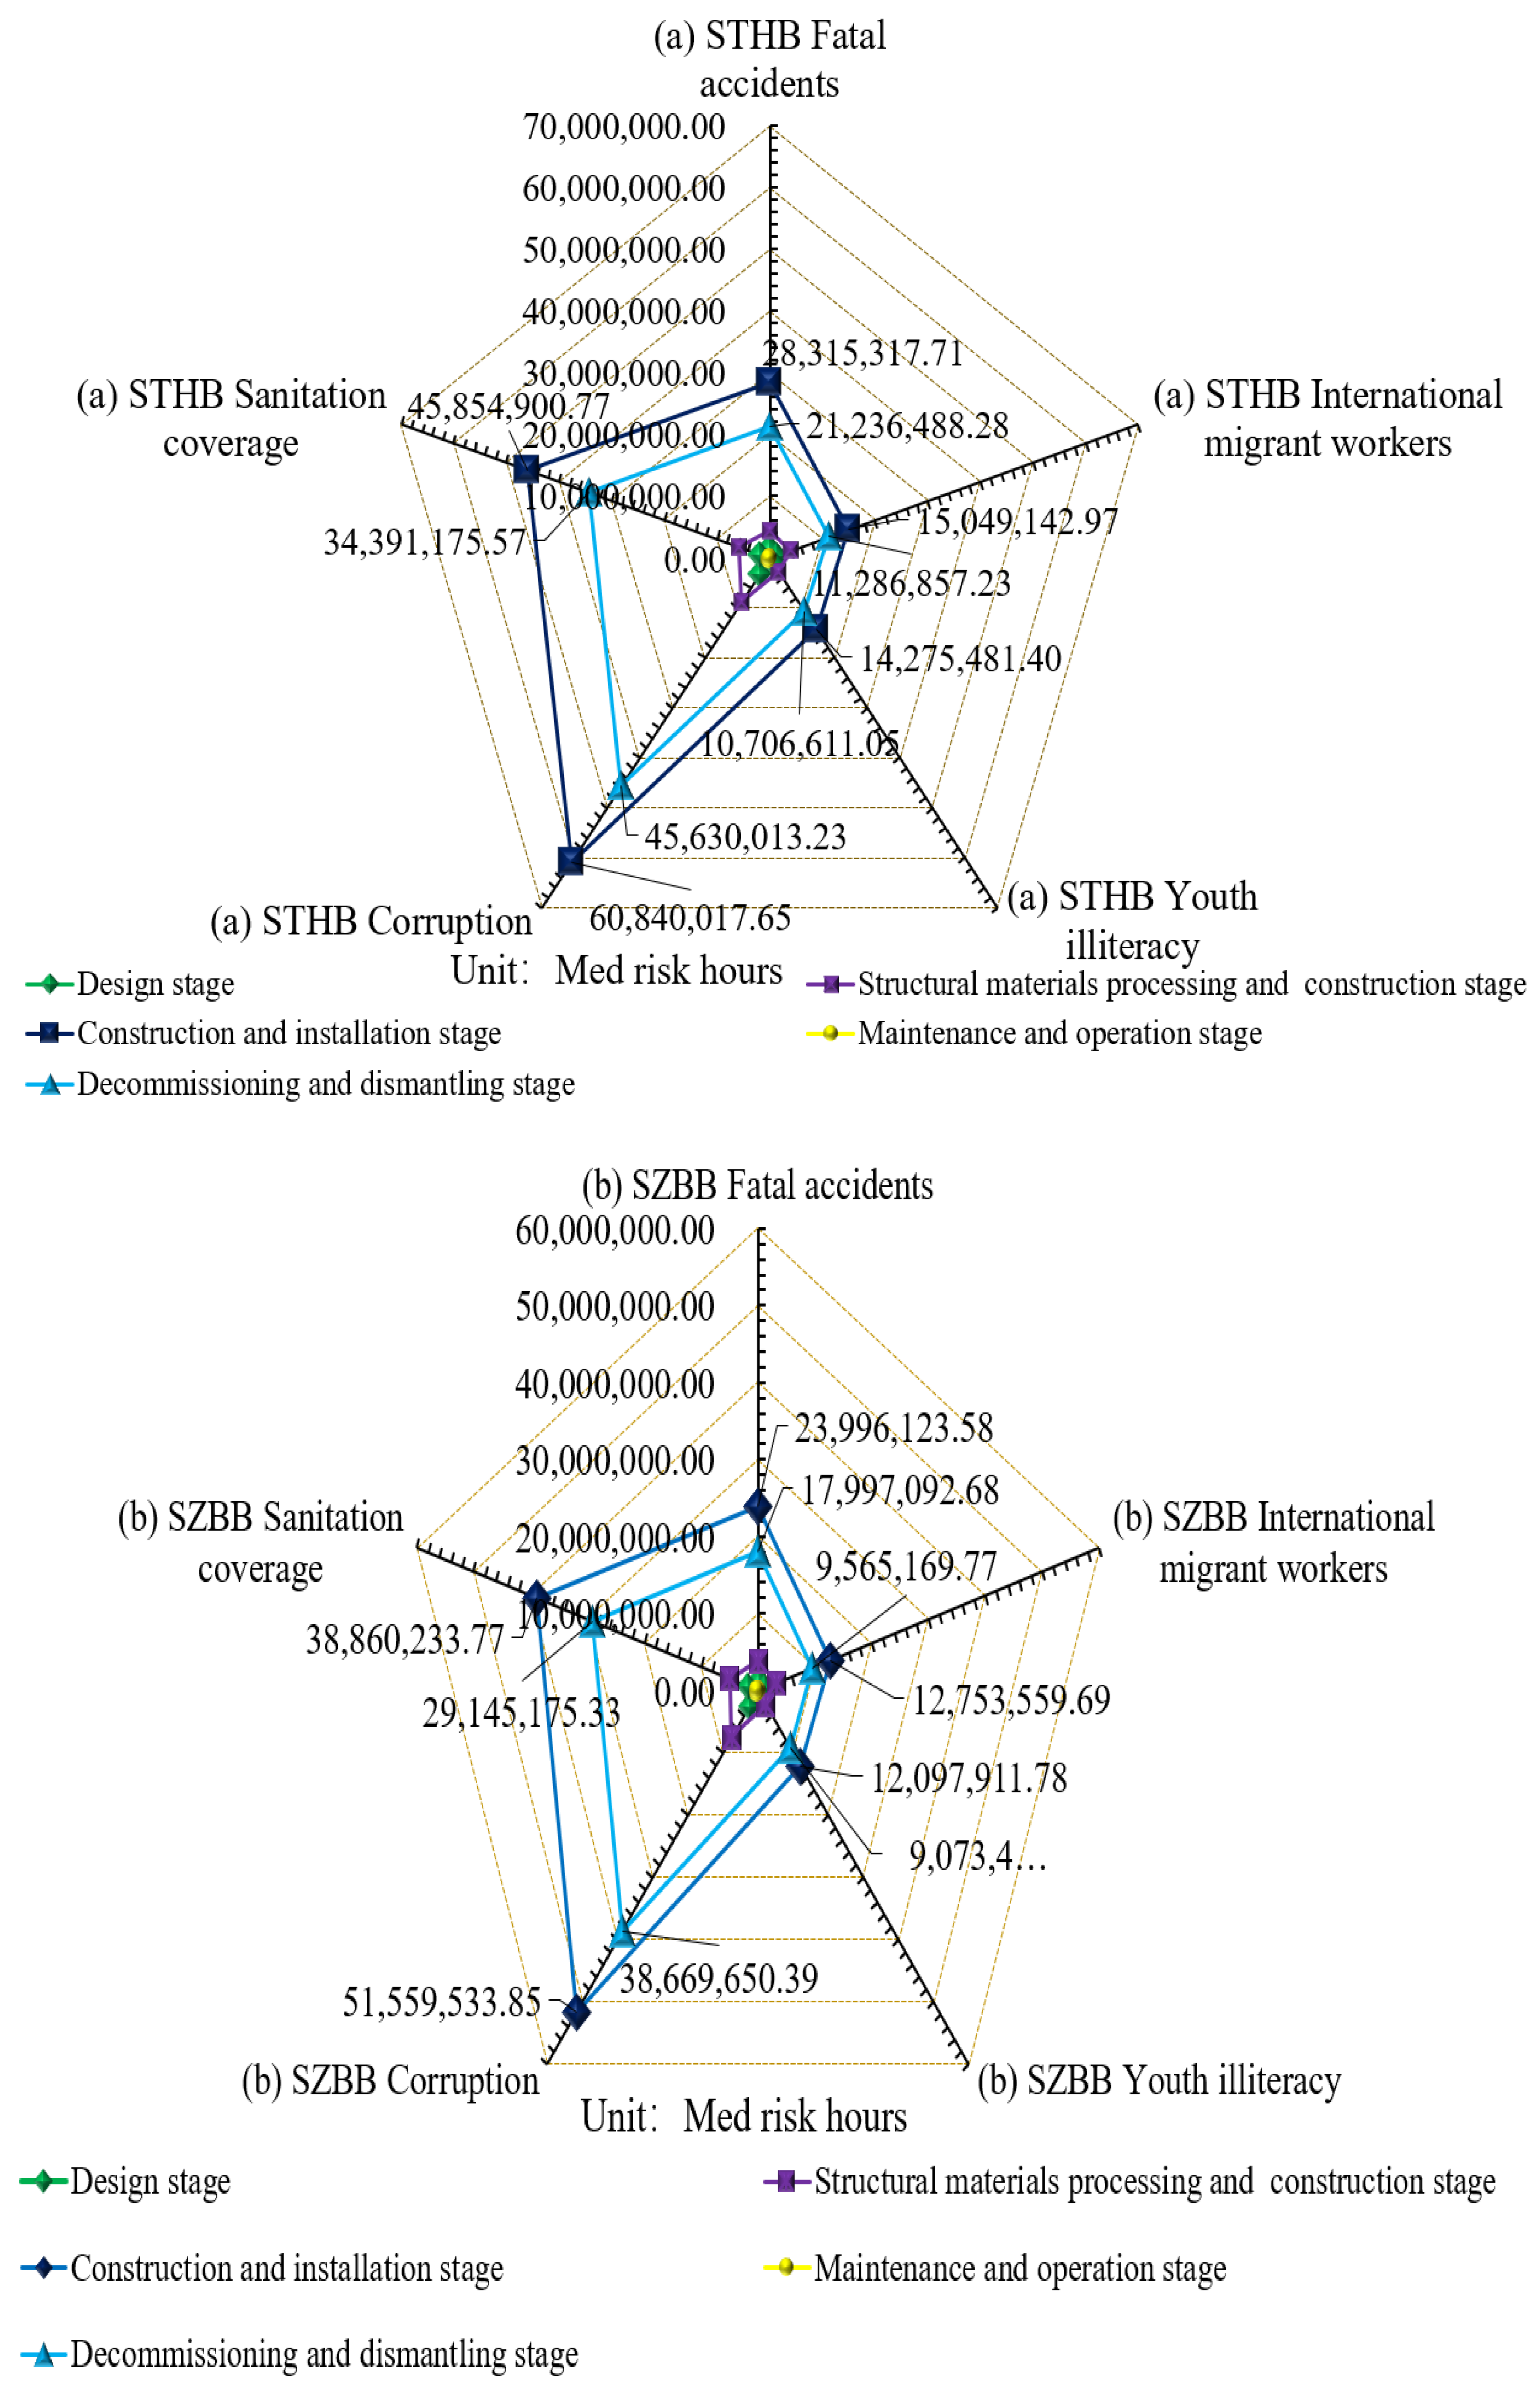
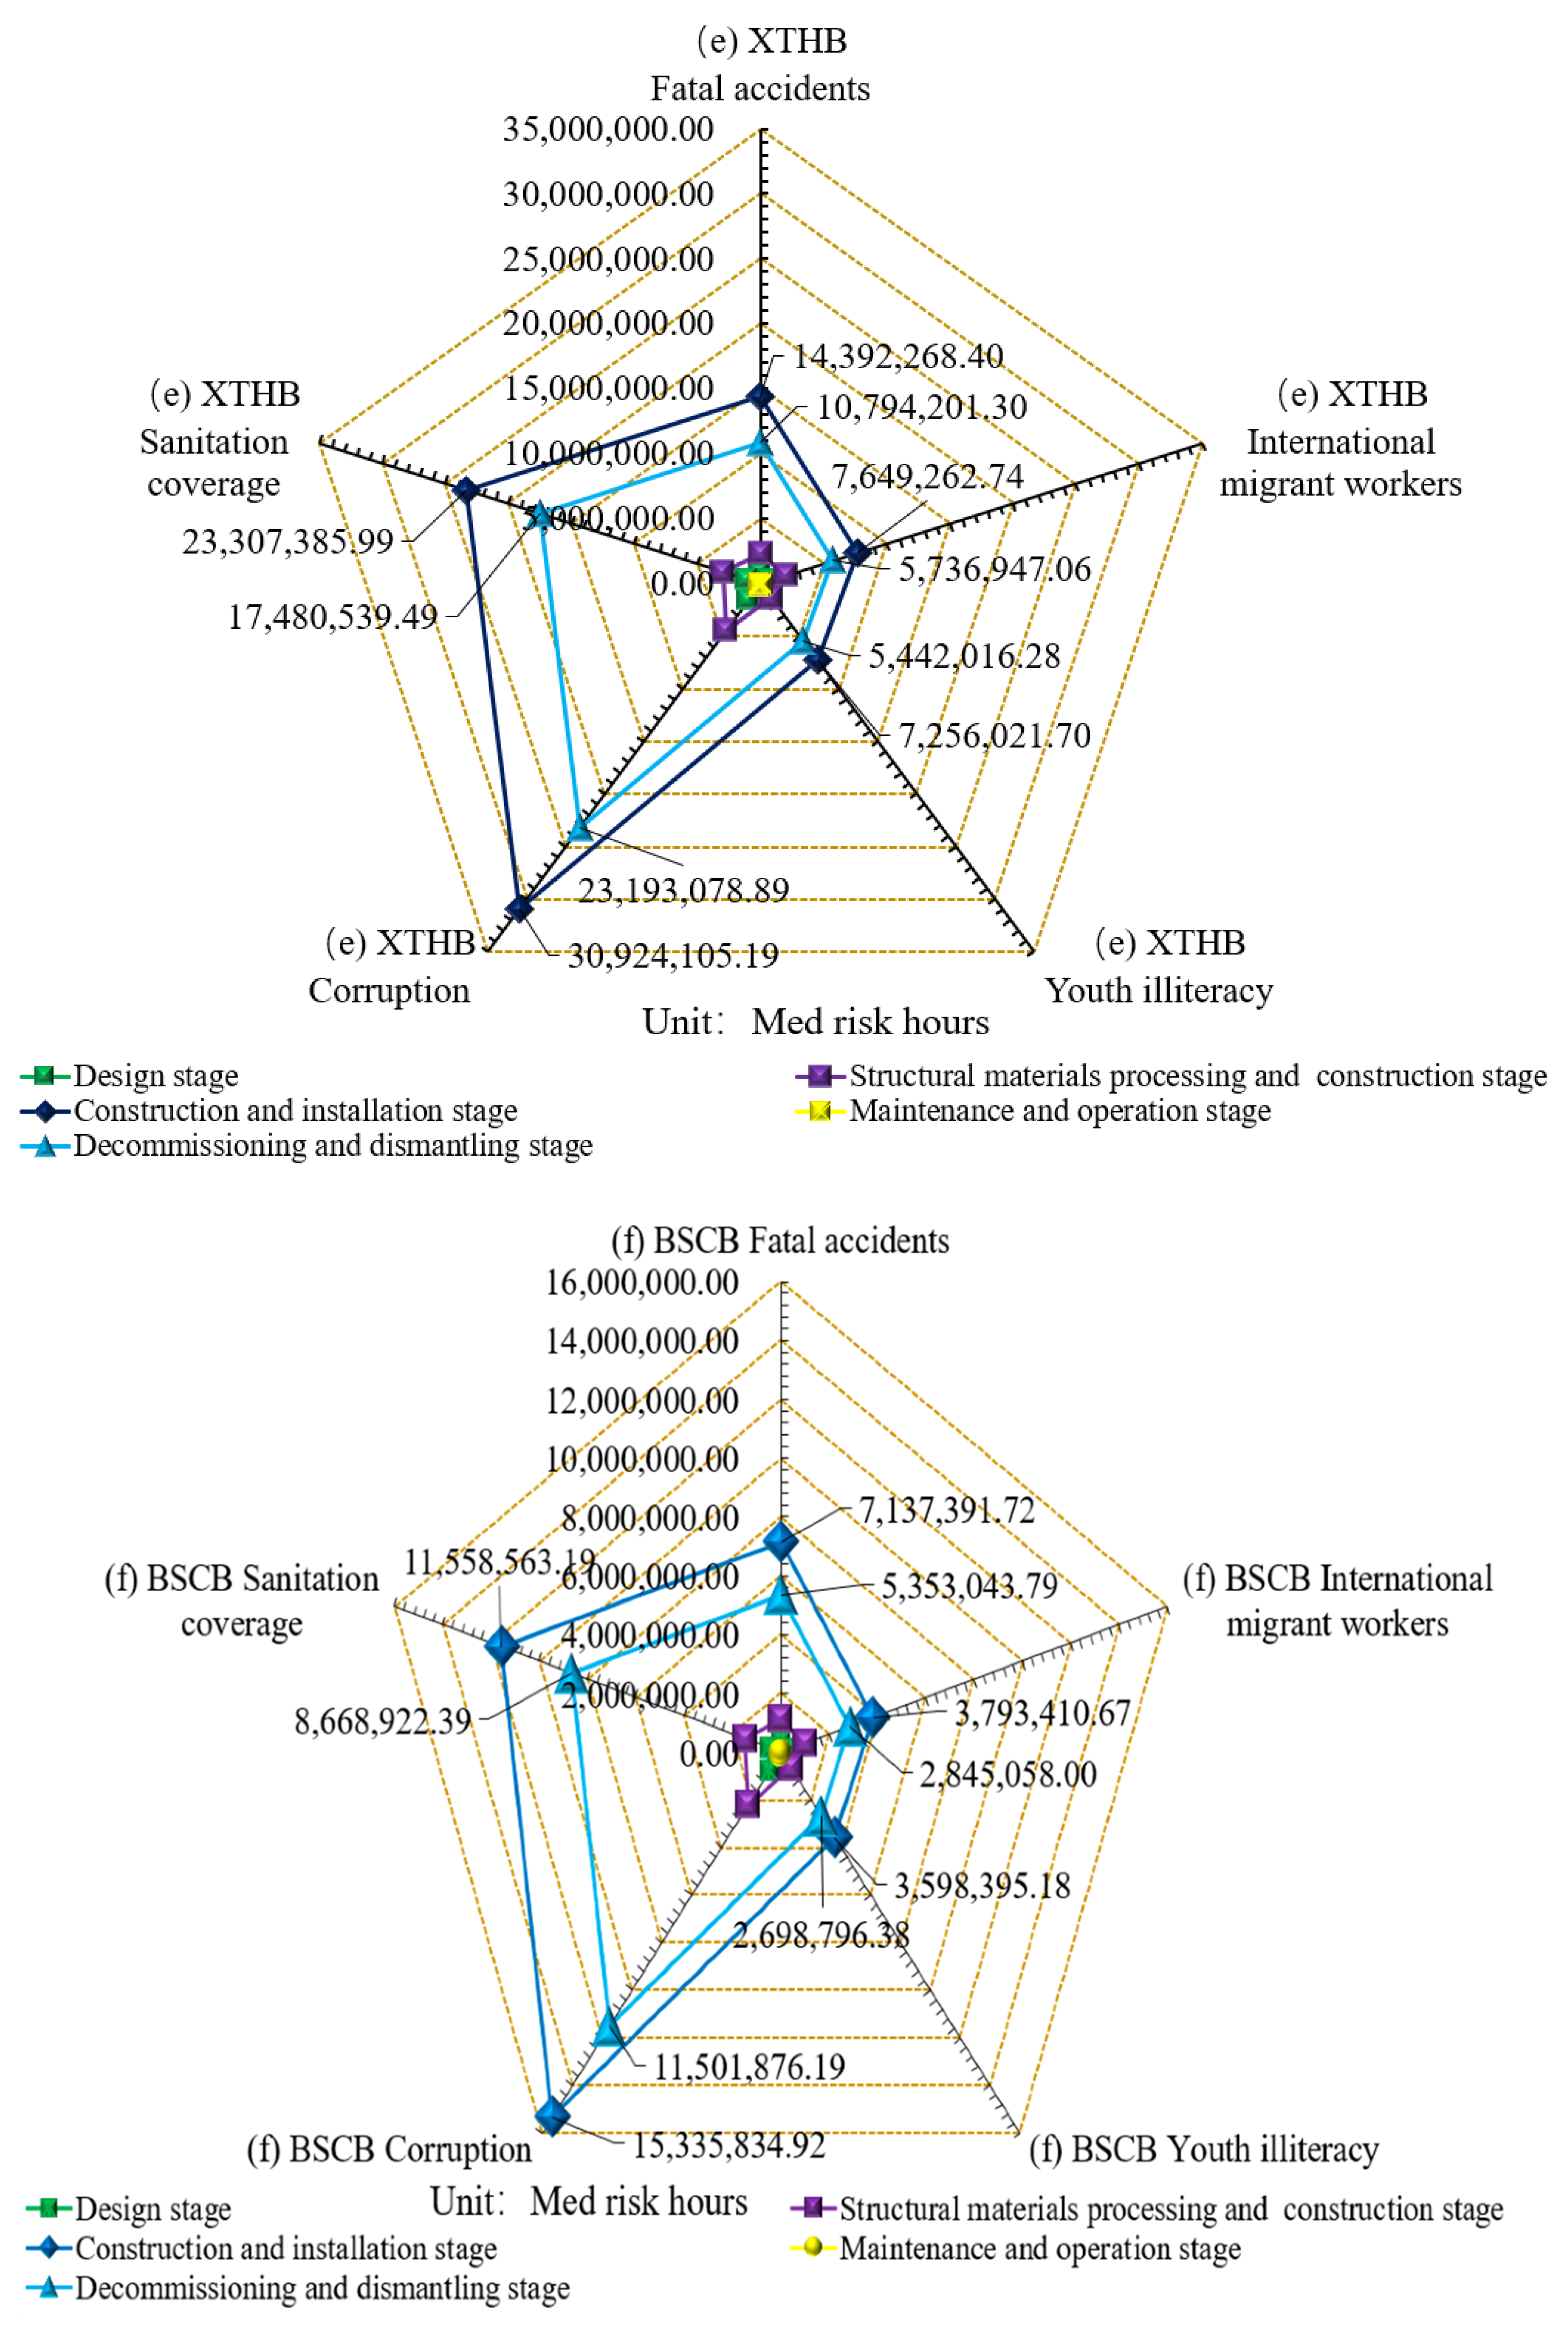
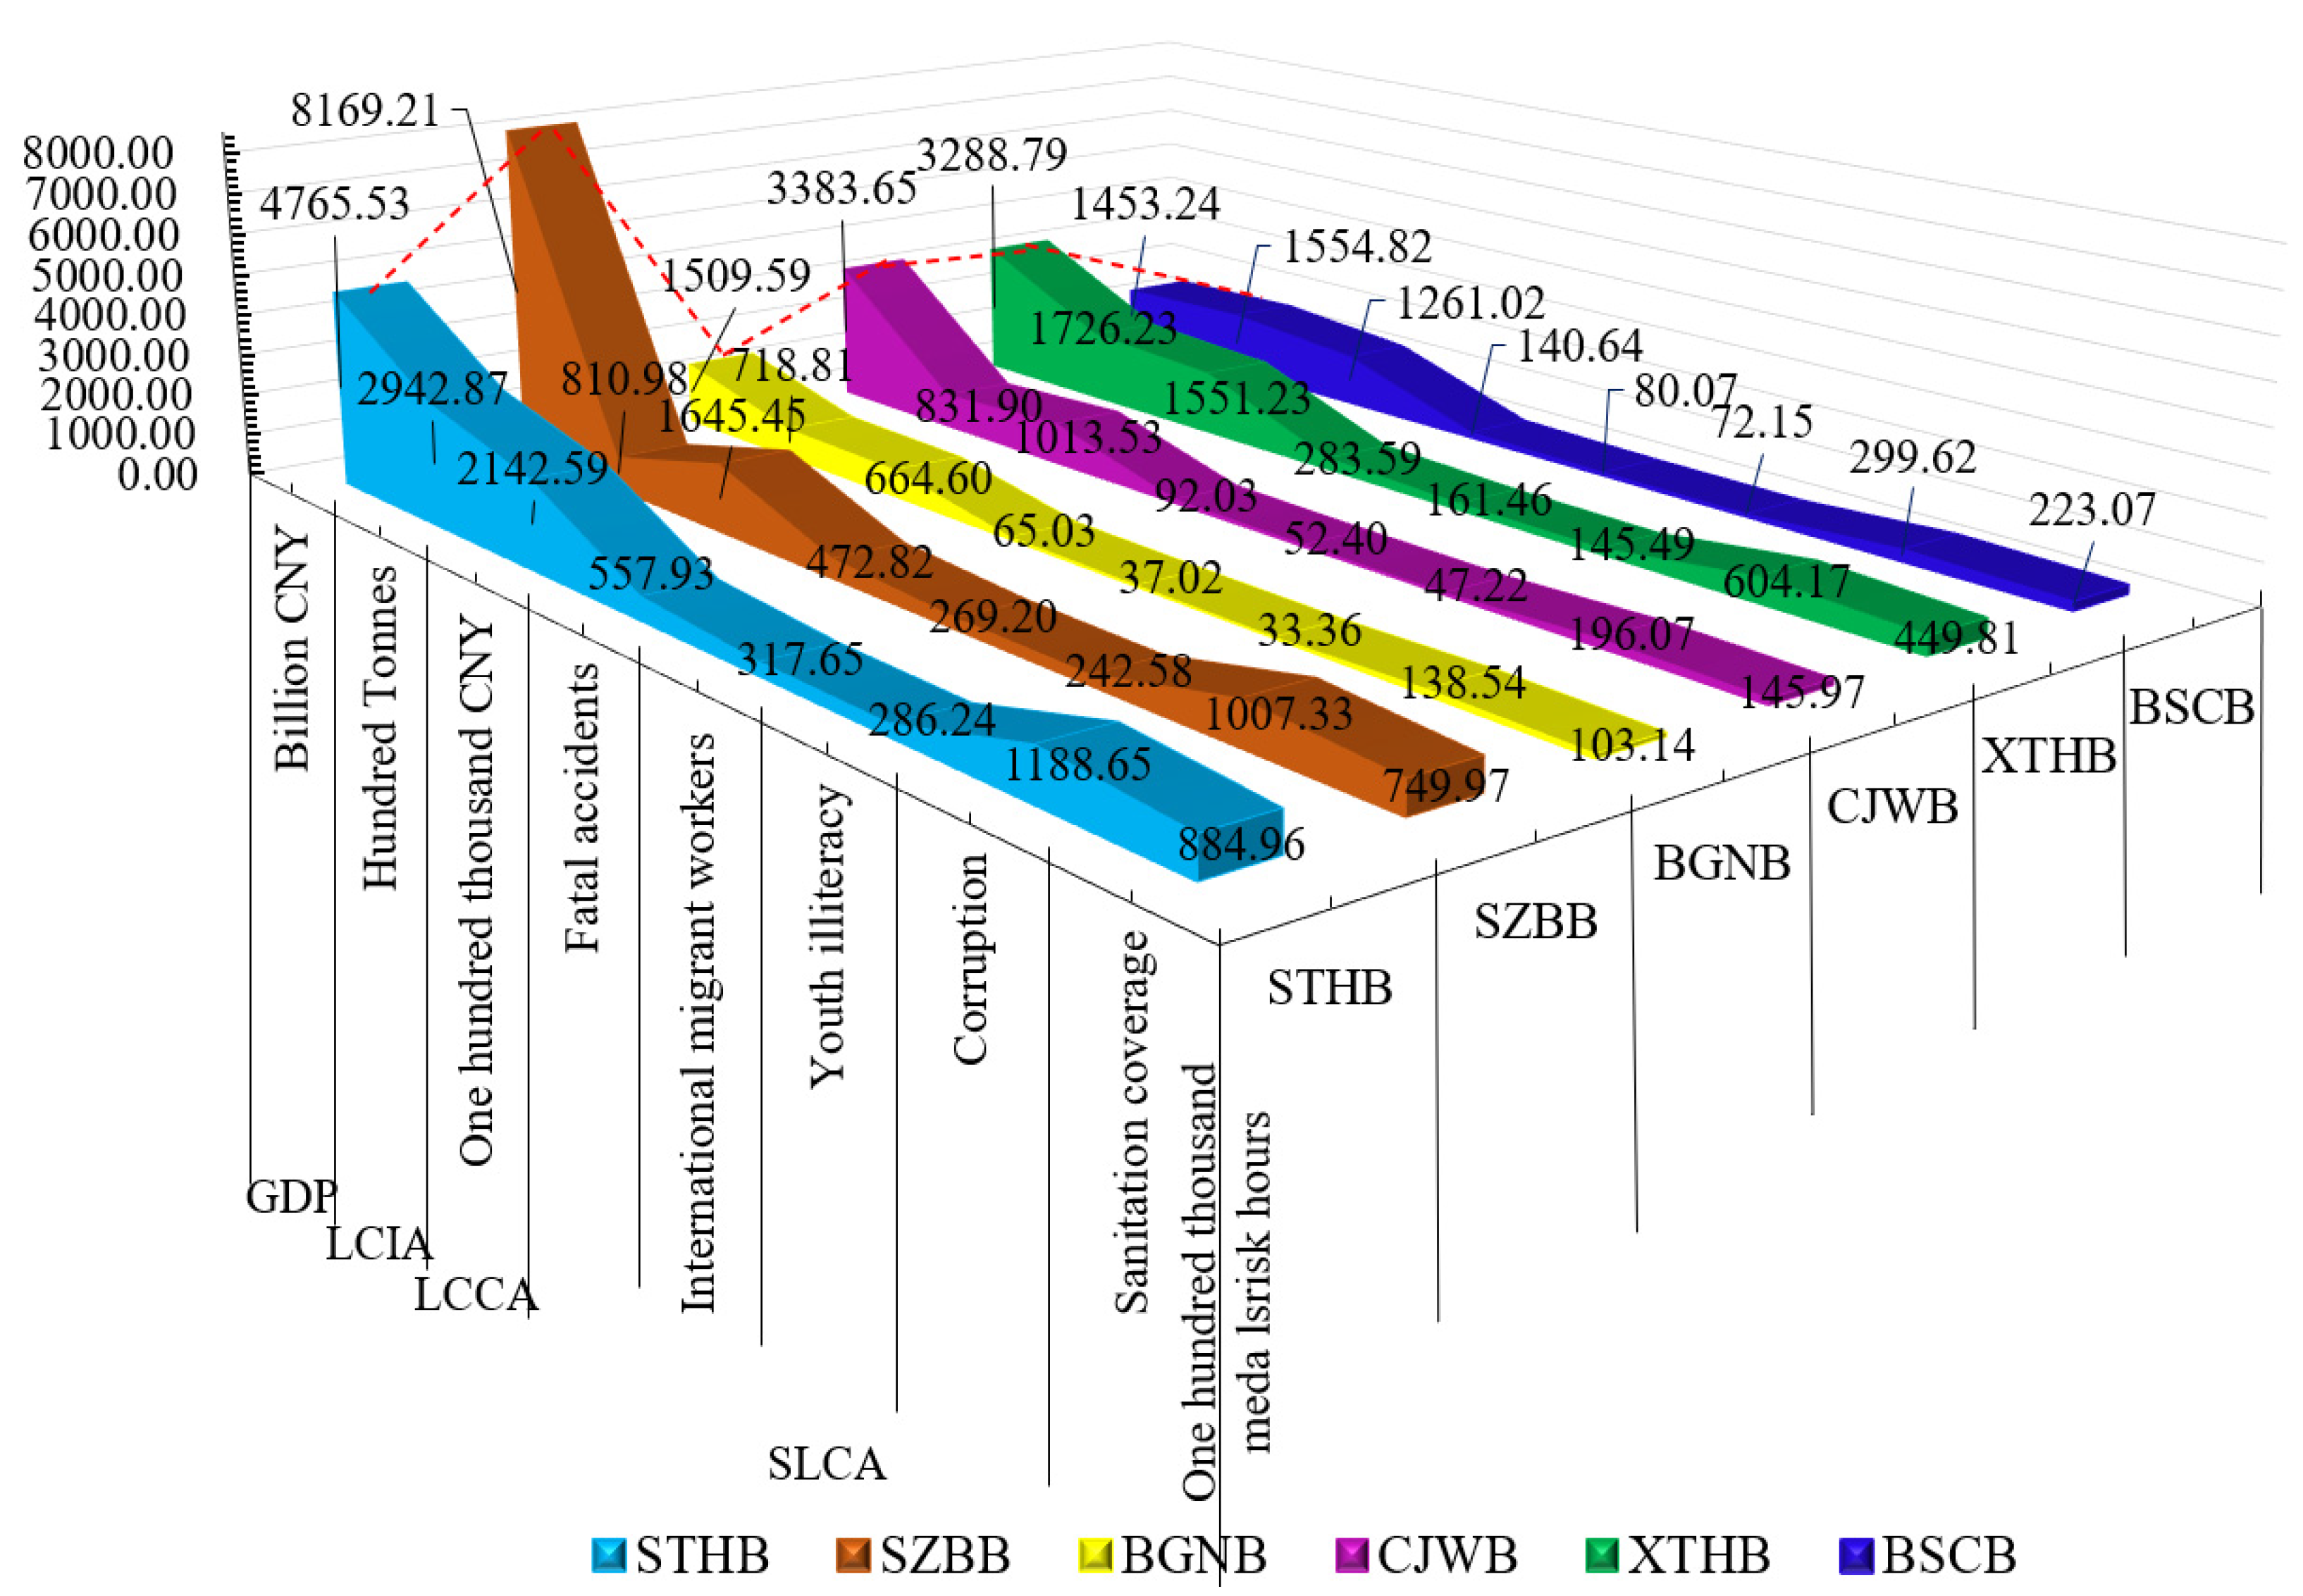
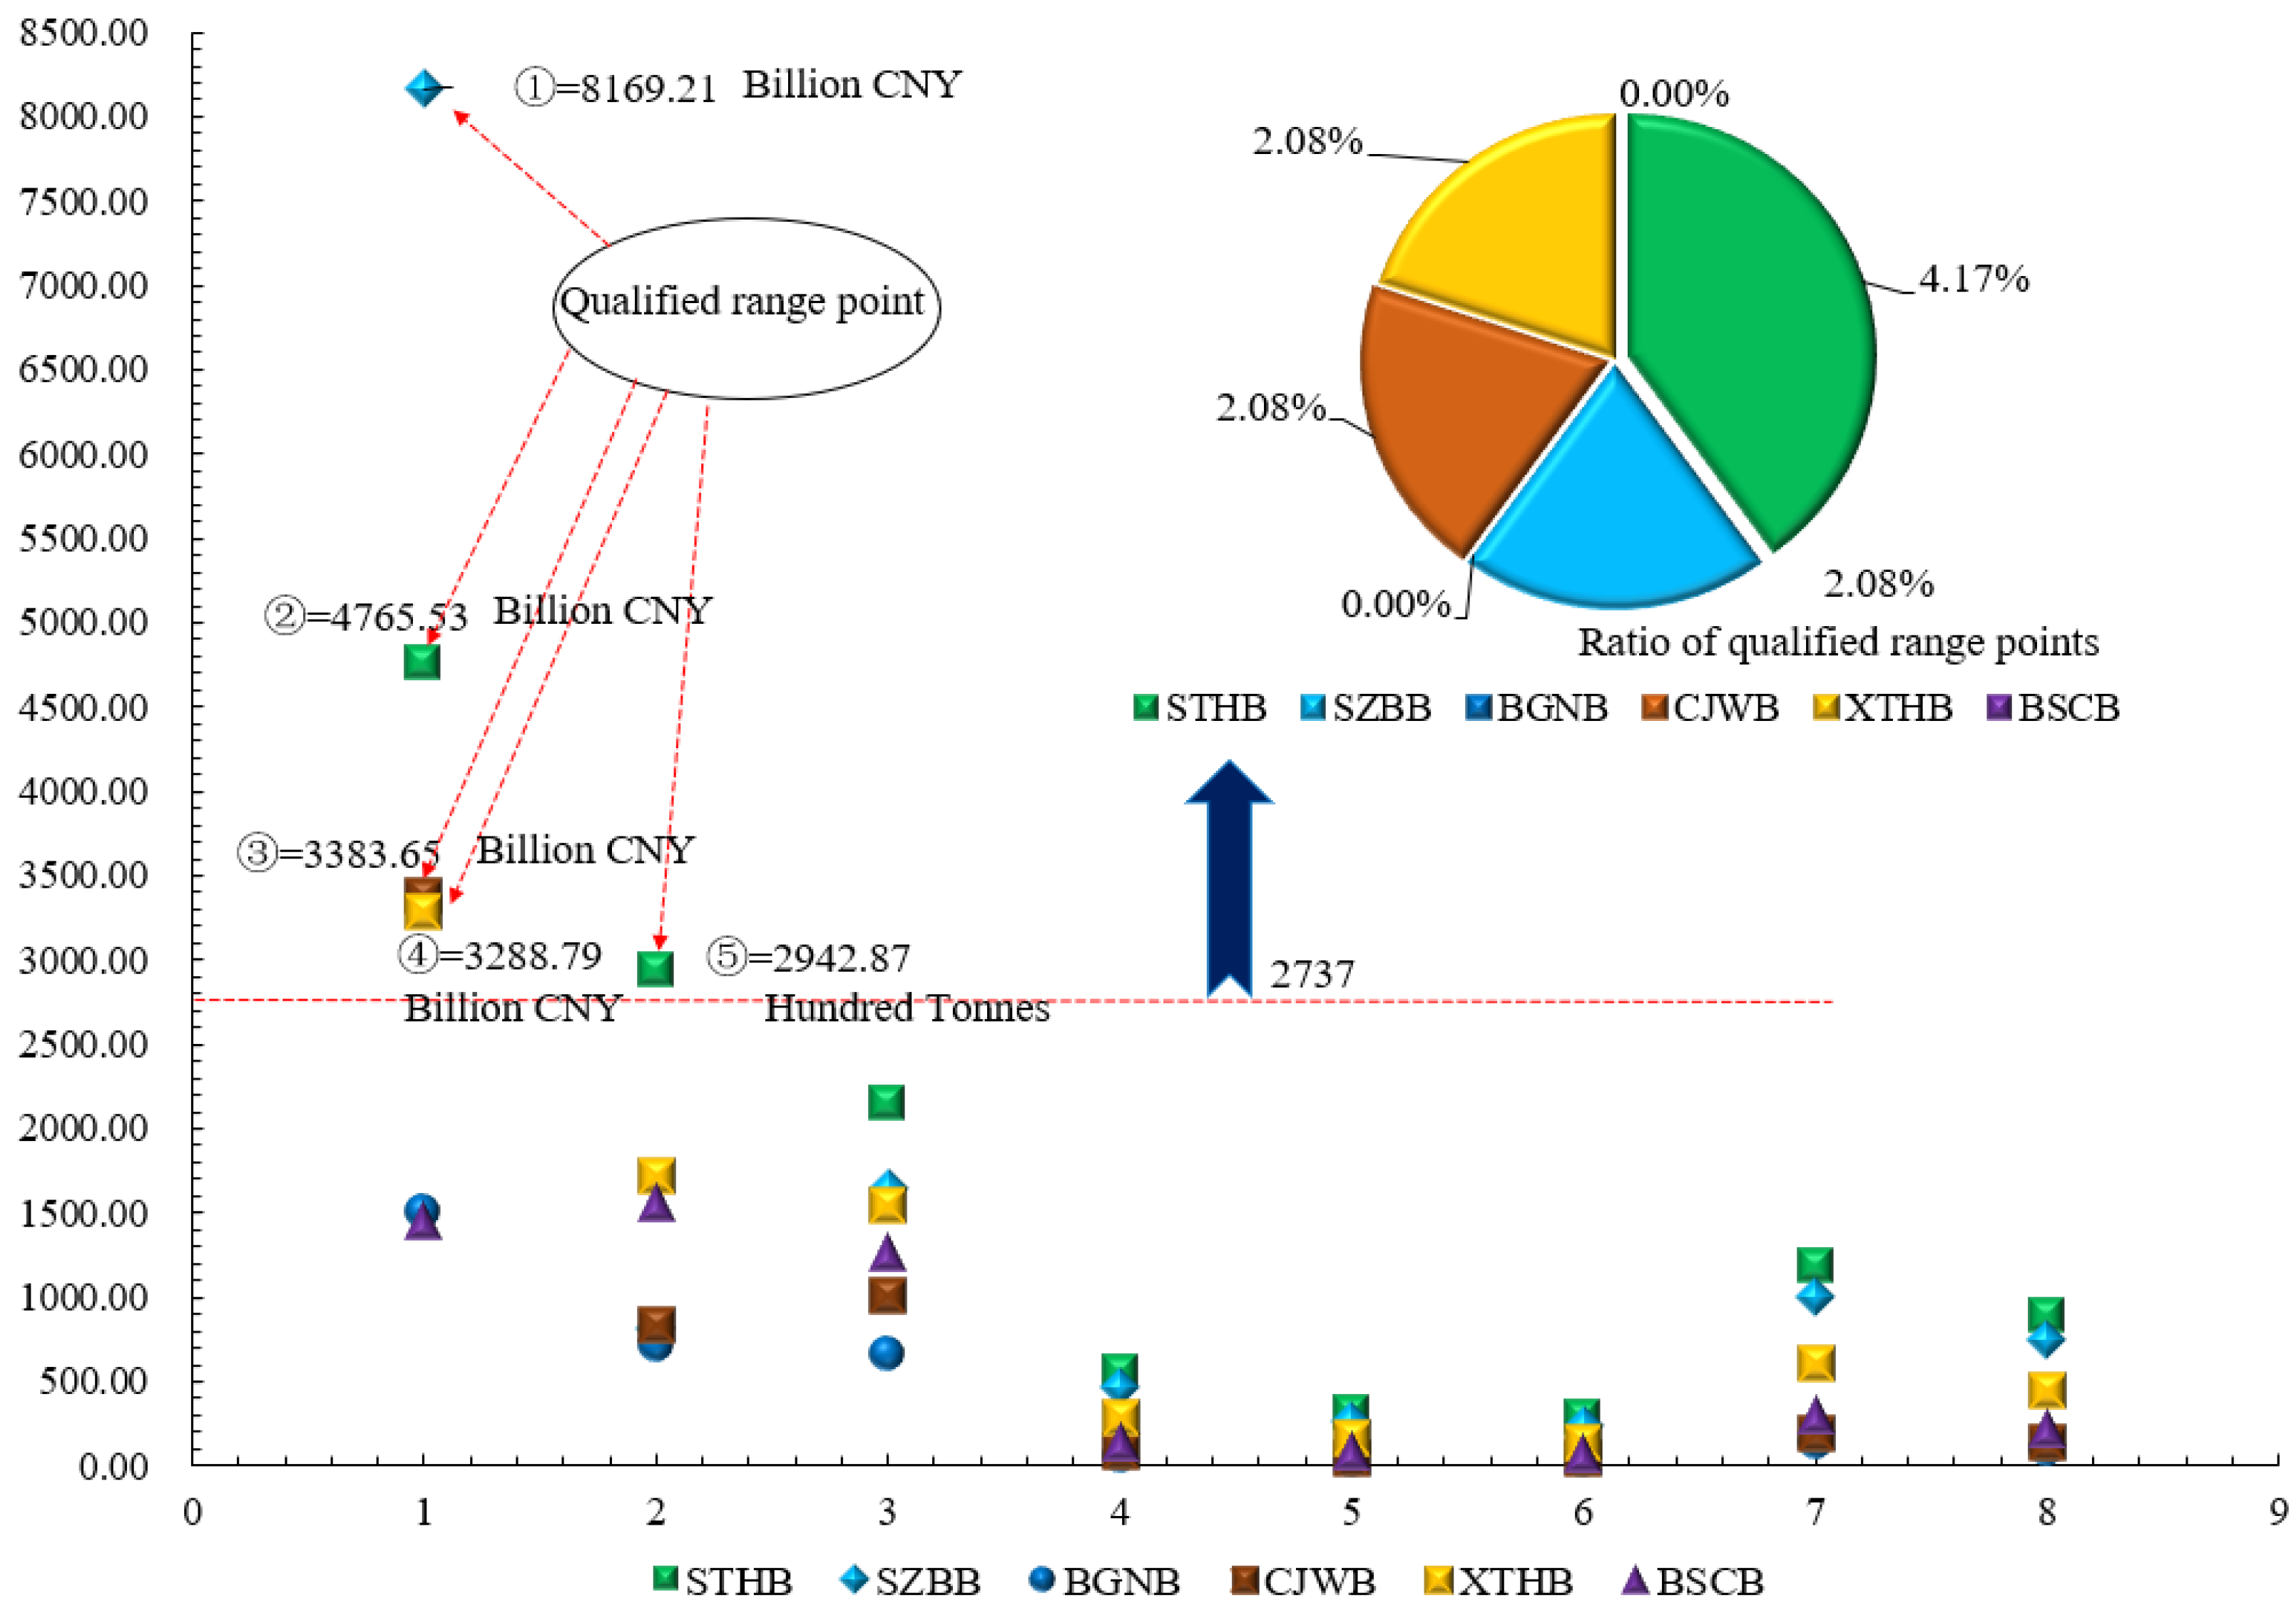
3.4. SILA
3.5. Deepen the Analysis
3.5.1. Economic Evaluation
3.5.2. Modelling and Discussion
4. Conclusions
Author Contributions
Funding
Conflicts of Interest
References
- ISO 14044:2006/AMD 1:2017. Environmental Management-Life Cycle Assessment-Requirements and Guidelines. ISO. 2006. Available online: https://www.iso.org/standard/72357.html (accessed on 20 November 2020).
- Wuni, Y.; Shen, G.Q.P.; Osei-Kyei, R. Scientometric review of global research trends on green buildings in construction journals from 1992 to 2018. Energy Build. 2019, 190, 69–85. [Google Scholar] [CrossRef]
- United Nations. World Population in 2050. Available online: https://www.un.org/development/desa/en/news/population/world-population-prospects-2017.html (accessed on 20 November 2020).
- Huisingh, D.; Zhang, Z.; Moore, J.C.; Qiao, Q.; Li, Q. Recent advances in carbon emissions reduction: Policies, technologies, monitoring, assessment and modeling. J. Clean. Prod. 2015, 103, 1–12. [Google Scholar] [CrossRef]
- Zhang, X. Toward a regenerative sustainability paradigm for the built environment: From vision to reality. J. Clean. Prod. 2014, 65, 3–6. [Google Scholar] [CrossRef] [Green Version]
- IPCC. Summary for Policymakers, Climate Change 2014: Mitigation of Climate Change. 2014. Available online: https://www.buildup.eu/en/practices/publications/ipcc-2014-climate-change-2014-mitigation-climate-change-contribution-working (accessed on 20 November 2020).
- Dong, Y.H.; Ng, S.T. A social life cycle assessment model for building construction in Hong Kong. Int. J. Life Cycle Assess. 2015, 20, 1166–1180. [Google Scholar] [CrossRef]
- Hellweg, S.; Canals, L.M.I. Emerging approaches, challenges and opportunities in life cycle assessment. Science 2014, 344, 1109–1113. [Google Scholar] [CrossRef]
- Hansen, J.; Sato, M.; Kharecha, P.; Beerling, D.; Berner, R.; Masson-Delmotte, V.; Pagani, M.; Raymo, M.; Royer, D.L.; Zachos, J.C. Target Atmospheric CO: Where should Humanity Aim? Open Atmos. Sci. J. 2008, 2, 217–231. [Google Scholar] [CrossRef] [Green Version]
- World Meteorological Organization. WMO Statement on the State of the Global Climate in 2016. 2017. Available online: https://library.wmo.int/doc_num.php?explnum_id=3414 (accessed on 20 November 2020).
- Muntean, M.; Guizzardi, D.; Schaaf, E.; Crippa, M.; Solazzo, E.; Olivier, J.G.J.; Vignati, E. Fossil CO2 Emissions of All World Countries: 2018 Report; EU Science Hub, European Commission, Joint Research Centre: Ispra (VA), Italy, 2018; ISBN 9789279972409. [Google Scholar] [CrossRef]
- Lin, B.; Liu, H. CO2 emissions of China’s commercial and residential buildings: Evidence and reduction policy. Build. Environ. 2015, 92, 418–431. [Google Scholar] [CrossRef]
- Kim, T.H.; Tae, S.H. Proposal of environmental impact assessment method for concrete in South Korea: An application in LCA (life cycle assessment). Int. J. Environ. Res. Public Health 2016, 13, 1074. [Google Scholar] [CrossRef] [Green Version]
- Hildenbrand, J.; Michael Srocka, A.C. OpenLCA 1.10. 2020. Available online: http://www.openlca.org/openlca/ (accessed on 23 November 2020).
- ISO,14044:2006/AMD 2:2020, Environmental Management-Life Cycle Assessment-Requirements and Guidelines. ISO. 2006. Available online: https://www.iso.org/standard/76122.html (accessed on 23 November 2020).
- Navarro, I.J.; Yepes, V.; Martí, J.V.; González-Vidosa, F. Life cycle impact assessment of corrosion preventive designs applied to prestressed concrete bridge decks. J. Clean. Prod. 2018, 196, 698–713. [Google Scholar] [CrossRef]
- O’Born, R. Life cycle assessment of large scale timber bridges: A case study from the world’s longest timber bridge design in Norway. Transp. Res. Part. D Transport. Environ. 2018, 59, 301–312. [Google Scholar] [CrossRef]
- Milani, C.J.; Kripka, M. Evaluation of short span bridge projects with a focus on sustainability. Struct. Infrastruct. Eng. 2020, 16, 367–380. [Google Scholar] [CrossRef]
- Trunzo, G.; Moretti, L.; D’Andrea, A. Life cycle analysis of road construction and use. Sustainability 2019, 11, 377. [Google Scholar] [CrossRef] [Green Version]
- Li, H.; Deng, Q.; Zhang, J.; Xia, B.; Skitmore, M. Assessing the life cycle CO2 emissions of reinforced concrete structures: Four cases from China. J. Clean. Prod. 2019, 210, 1496–1506. [Google Scholar] [CrossRef]
- Frangopol, D.M.; Dong, Y.; Sabatino, S. Bridge life-cycle performance and cost: Analysis, prediction, optimisation and decision-making. Struct. Infrastruct. Eng. 2017, 13, 1239–1257. [Google Scholar] [CrossRef]
- Goh, K.C.; Goh, H.H.; Chong, H.-Y. Integration Model of Fuzzy AHP and Life-Cycle Cost Analysis for Evaluating Highway Infrastructure Investments. J. Infrastruct. Syst. 2019, 25, 04018045. [Google Scholar] [CrossRef]
- Heidari, M.R.; Heravi, G.; Esmaeeli, A.N. Integrating life-cycle assessment and life-cycle cost analysis to select sustainable pavement: A probabilistic model using managerial flexibilities. J. Clean. Prod. 2020, 254. [Google Scholar] [CrossRef]
- Wang, Z.; Yang, D.Y.; Frangopol, D.M.; Jin, W. Inclusion of environmental impacts in life-cycle cost analysis of bridge structures. Sustain. Resilient Infrastruct. 2020, 5, 252–267. [Google Scholar] [CrossRef]
- Cadenazzi, T.; Dotelli, G.; Rossini, M.; Nolan, S.; Nanni, A. Life-Cycle Cost and Life-Cycle Assessment Analysis at the Design Stage of a Fiber-Reinforced Polymer-Reinforced Concrete Bridge in Florida. Adv. Civ. Eng. Mater. 2019, 8, 20180113. [Google Scholar] [CrossRef]
- ESMS. Social Impact Assessment (SIA). 2016. Available online: https://www.iucn.org/sites/dev/files/iucn_esms_sia_guidance_note.pdf (accessed on 23 November 2020).
- Zhang, A.; Zhong, R.Y.; Farooque, M.; Kang, K.; Venkatesh, V.G. Blockchain-based life cycle assessment: An implementation framework and system architecture. Resour. Conserv. Recycl. 2020, 152, 104512. [Google Scholar] [CrossRef]
- Parent, J.; Cucuzzella, C.; Revéret, J.P. Impact assessment in SLCA: Sorting the sLCIA methods according to their outcomes. Int. J. Life Cycle Assess. 2010, 15, 164–171. [Google Scholar] [CrossRef]
- Vanclay, F. Reflections on Social Impact Assessment in the 21st century. Impact Assess. Proj. Apprais. 2020, 38, 126–131. [Google Scholar] [CrossRef] [Green Version]
- Zamarrón-Mieza, I.; Yepes, V.; Moreno-Jiménez, J.M. A systematic review of application of multi-criteria decision analysis for aging-dam management. J. Clean. Prod. 2017, 147, 217–230. [Google Scholar] [CrossRef] [Green Version]
- Parsons, R. Forces for change in social impact assessment. Impact Assess. Proj. Apprais. 2020, 38, 278–286. [Google Scholar] [CrossRef]
- Vanclay, F. Statistical Analysis on the Number of Traffic Accidents in China. Impact Assess. Proj. Apprais. 2003, 21, 3–4. [Google Scholar] [CrossRef]
- Domínguez-Gómez, J.A. Four conceptual issues to consider in integrating social and environmental factors in risk and impact assessments. Environ. Impact Assess. Rev. 2016, 56, 113–119. [Google Scholar] [CrossRef] [Green Version]
- Fischer, T.B.; Jha-Thakur, U.; Fawcett, P.; Clement, S.; Hayes, S.; Nowacki, J. Consideration of urban green space in impact assessments for health. Impact Assess. Proj. Apprais. 2018, 36, 32–44. [Google Scholar] [CrossRef] [Green Version]
- Balasbaneh, A.T.; Marsono, A.K. Bin Applying multi-criteria decision-making on alternatives for earth-retaining walls: LCA, LCC, and S-LCA. Int. J. Life Cycle Assess. 2020, 25, 2140–2153. [Google Scholar] [CrossRef]
- Balasbaneh, A.T.; Marsono, A.K.B.; Khaleghi, S.J. Sustainability choice of different hybrid timber structure for low medium cost single-story residential building: Environmental, economic and social assessment. J. Build. Eng. 2018, 20, 235–247. [Google Scholar] [CrossRef]
- Penadés-Plà, V.; Martínez-Muñoz, D.; García-Segura, T.; Navarro, I.J.; Yepes, V. Environmental and Social Impact Assessment of Optimized Post-Tensioned Concrete Road Bridges. Sustainability 2020, 12, 4265. [Google Scholar] [CrossRef]
- Ali, M.S.; Aslam, M.S.; Mirza, M.S. A sustainability assessment framework for bridges—A case study: Victoria and Champlain Bridges, Montreal. Struct. Infrastruct. Eng. 2016, 12, 1381–1394. [Google Scholar] [CrossRef]
- Kloepffer, W. Life cycle sustainability assessment of products (with Comments by Helias A. Udo de Haes, p. 95). Int. J. Life Cycle Assess. 2008, 13, 89–95. [Google Scholar] [CrossRef]
- Hu, M. Building impact assessment—A combined life cycle assessment and multi-criteria decision analysis framework. Resour. Conserv. Recycl. 2019, 150, 104410. [Google Scholar] [CrossRef]
- Association, E.; Ecoinvent Datebase. Ecoinvent. 2019. Available online: https://www.ecoinvent.org/database/database.html (accessed on 23 November 2020).
- Bedec Datebase. The Regional Catalan Government. 2010. Available online: https://en.itec.cat/database/ (accessed on 23 November 2020).
- Psilca Greendatebase. Available online: https://psilca.net/ (accessed on 23 November 2020).
- Ortiz, O.; Castells, F.; Sonnemann, G. Sustainability in the construction industry: A review of recent developments based on LCA. Constr. Build. Mater. 2009, 23, 28–39. [Google Scholar] [CrossRef]
- Asdrubali, F.; Baldassarri, C.; Fthenakis, V. Life cycle analysis in the construction sector: Guiding the optimization of conventional Italian buildings. Energy Build. 2013, 64, 73–89. [Google Scholar] [CrossRef]
- European Union. International Reference Life Cycle Data System (ILCD) Handbook; Springer Science + Business Media B.V.: Berlin, Germany, 2011; p. 2011933605. Available online: https://0-link-springer-com.brum.beds.ac.uk/chapter/10.1007/978-94-007-1899-9_11 (accessed on 23 November 2020).
- Ramesh, T.; Prakash, R.; Shukla, K.K. Life cycle energy analysis of buildings: An overview. Energy Build. 2010, 42, 1592–1600. [Google Scholar] [CrossRef]
- Cabeza, L.F.; Rincón, L.; Vilariño, V.; Pérez, G.; Castell, A. Life cycle assessment (LCA) and life cycle energy analysis (LCEA) of buildings and the building sector: A review. Renew. Sustain. Energy Rev. 2014, 29, 394–416. [Google Scholar] [CrossRef]
- Chau, C.K.; Leung, T.M.; Ng, W.Y. A review on life cycle assessment, life cycle energy assessment and life cycle carbon emissions assessment on buildings. Appl. Energy 2015, 143, 395–413. [Google Scholar] [CrossRef]
- Baker, L. Of embodied emissions and inequality: Rethinking energy consumption. Energy Res. Soc. Sci. 2018, 36, 52–60. [Google Scholar] [CrossRef]
- Chen, L.; Pelton, R.E.O.; Smith, T.M. Comparative life cycle assessment of fossil and bio-based polyethylene terephthalate (PET) bottles. J. Clean. Prod. 2016, 137, 667–676. [Google Scholar] [CrossRef] [Green Version]
- Walker, S.; Rothman, R. Life cycle assessment of bio-based and fossil-based plastic: A review. J. Clean. Prod. 2020, 261, 121158. [Google Scholar] [CrossRef]
- Recipe. 2008. Available online: https://www.researchgate.net/publication/230770853_Recipe_2008 (accessed on 30 November 2020).
- New Version Recipe. New Version ReCiPe 2016 to Determine Environmental Impact|RIVM. 2016. Available online: https://www.rivm.nl/en/news/new-version-recipe-2016-to-determine-environmental-impact (accessed on 30 November 2020).
- Penadés-Plà, V.; Martí, J.V.; García-Segura, T.; Yepes, V. Life-cycle assessment: A comparison between two optimal post-tensioned concrete box-girder road bridges. Sustainability 2017, 1864, 1864. [Google Scholar] [CrossRef] [Green Version]
- Zhou, Z.; Alcalá, J.; Yepes, V. Bridge Carbon Emissions and Driving Factors Based on a Life-Cycle Assessment Case Study: Cable-Stayed Bridge over Hun He River in Liaoning, China. Int. J. Environ. Res. Public Health 2020, 17, 5953. [Google Scholar] [CrossRef]
- SimaPro. 2020. Available online: https://simapro.com/about/ (accessed on 23 November 2020).
- Lee, K.M.; Cho, H.N.; Cha, C.J. Life-cycle cost-effective optimum design of steel bridges considering environmental stressors. Eng. Struct. 2006, 28, 1252–1265. [Google Scholar] [CrossRef]
- Navarro, I.J.; Penadés-Plà, V.; Martínez-Muñoz, D.; Rempling, R.; Yepes, V. Life cycle sustainability assessment for multi-criteria decision making in bridge design: A review. J. Civil Eng. Manag. 2020, 26, 690–704. [Google Scholar] [CrossRef]
- García-Segura, T.; Penadés-Plà, V.; Yepes, V. Sustainable bridge design by metamodel-assisted multi-objective optimization and decision-making under uncertainty. J. Clean. Prod. 2018, 202, 904–915. [Google Scholar] [CrossRef]
- Jang, B.; Mohammadi, J. Impact of fatigue damage from overloads on bridge life-cycle cost analysis. Bridge Struct. 2019, 15, 181–186. [Google Scholar] [CrossRef]
- Matos, J.; Solgaard, A.; Santos, C.; Silva, M.S.; Linneberg, P.; Strauss, A.; Casas, J.; Caprani, C.; Akiyama, M. Life cycle cost, as a tool for decision making on concrete infrastructures. In Proceedings of the High-Tech Concrete: Where Technology and Engineering Meet, Maastricht, The Netherlands, 12–14 June 2017; Springer International Publishing: Berlin, Germany, 2017; pp. 1832–1839. [Google Scholar] [CrossRef] [Green Version]
- Edited by the Policy Research Office, National Development and Reform Commission, 2011. National Development and Re-Form Commission Notified to Reduce Fees for Some Construction Projects. Available online: https://www.ndrc.gov.cn/xwdt/xwfb/201103/t20110323_956782.html (accessed on 23 November 2020).
- Edited by the Ministry of Construction, National Development and Reform Commission, 2002. Engineering Survey and Design Charging Standards. Available online: https://wenku.baidu.com/view/3fa74a62effdc8d376eeaeaad1f34693daef1088.html (accessed on 23 November 2020).
- Stewart, M.G. Analysis of Climate Change Impacts on the Deterioration of Concrete Infrastructure—Part. 1: Mechanisms, Practices... Analysis of Climate Change Impacts on the Deterioration of Concrete Infrastructure Part. 1: Mechanisms, Practices, Modelling and Sim; CSIRO: Canberra, Australia, 2016; ISBN 9780643103658. pp. 1–88. Available online: https://apo.org.au/sites/default/files/resource-files/2011-02/apo-nid25469_5.pdf (accessed on 23 November 2020).
- Rossi, B.; Marquart, S.; Rossi, G. Comparative life cycle cost assessment of painted and hot-dip galvanized bridges. J. Environ. Manag. 2017, 197, 41–49. [Google Scholar] [CrossRef]
- Ministry of Communications of China, 2004; Code for Maintenance of Highway Bridge and Culvers. Available online: http://www.chhca.org.cn/web_html/001/HYDT03.asp (accessed on 23 November 2020).
- Wang, H.; Schandl, H.; Wang, X.; Ma, F.; Yue, Q.; Wang, G.; Wang, Y.; Wei, Y.; Zhang, Z.; Zheng, R. Measuring progress of China’s circular economy. Resour. Conserv. Recycl. 2020, 163, 105070. [Google Scholar] [CrossRef]
- National Bureau of Statistics-2019. Available online: http://www.stats.gov.cn/tjsj/ndsj/ (accessed on 23 November 2020). (In Chinese)
- Wang, D.; Liu, Q.; Ma, L.; Zhang, Y.; Cong, H. Road traffic accident severity analysis: A census-based study in China. J. Saf. Res. 2019, 70, 135–147. [Google Scholar] [CrossRef]
- Van der Vlegel, M.; Haagsma, J.A.; de Munter, L.; de Jongh, M.A.C.; Polinder, S. Health Care and Productivity Costs of Non-Fatal Traffic Injuries: A Comparison of Road User Types. Int. J. Environ. Res. Public Health 2020, 17, 2217. [Google Scholar] [CrossRef] [Green Version]
- Al-Rukaibi, F.; AlKheder, S.; AlOtaibi, N.; Almutairi, M. Traffic crashes cost estimation in Kuwait. Int. J. Crashworthiness 2020, 25, 203–212. [Google Scholar] [CrossRef]
- Jiménez, J.R.; Ayuso, J.; Agrela, F.; López, M.; Galvín, A.P. Utilisation of unbound recycled aggregates from selected CDW in unpaved rural roads. Resour. Conserv. Recycl. 2012, 58, 88–97. [Google Scholar] [CrossRef]
- Tavira, J.; Jiménez, J.R.; Ayuso, J.; Sierra, M.J.; Ledesma, E.F. Functional and structural parameters of a paved road section constructed with mixed recycled aggregates from non-selected construction and demolition waste with excavation soil. Constr. Build. Mater. 2018, 164, 57–69. [Google Scholar] [CrossRef]
- Sangiorgi, C.; Lantieri, C.; Dondi, G. Construction and demolition waste recycling: An application for road construction. Int. J. Pavement Eng. 2015, 16, 530–537. [Google Scholar] [CrossRef]
- Prenzel, P.V.; Vanclay, F. How social impact assessment can contribute to conflict management. Environ. Impact Assess. Rev. 2014, 45, 30–37. [Google Scholar] [CrossRef]
- Vanclay, F. International principles for social impact assessment. Impact Assess. Proj. Apprais. 2003, 21, 5–12. [Google Scholar] [CrossRef]
- Esteves, A.M.; Franks, D.; Vanclay, F. Social impact assessment: The state of the art. Impact Assess. Proj. Apprais. 2012, 30, 34–42. [Google Scholar] [CrossRef]
- Sierra, L.A.; Pellicer, E.; Yepes, V. Method for estimating the social sustainability of infrastructure projects. Environ. Impact Assess. Rev. 2017, 65, 41–53. [Google Scholar] [CrossRef] [Green Version]
- Navarro, I.J.; Yepes, V.; Martí, J.V. Social life cycle assessment of concrete bridge decks exposed to aggressive environments. Environ. Impact Assess. Rev. 2018, 72, 50–63. [Google Scholar] [CrossRef]
- Shab-Home. 2020. Available online: http://www.socialhotspot.org/ (accessed on 23 November 2020).
- Ciroth, A.; Eisfeldt, F. PSILCA-A Product Social Impact Life Cycle Assessment Database Database Version 1.0. 2016. Available online: https://www.openlca.org/wp-content/uploads/2016/08/PSILCA_documentation_v1.1.pdf (accessed on 23 November 2020).
- Wiki. Geographical Division of China-Wikiwand. Wiki. 2020. Available online: https://www.wikiwand.com/en/Geography_of_China (accessed on 23 November 2020).
- List of New Cities in China-Wikiwand. 2020. Available online: https://m.sohu.com/n/486287408/ (accessed on 23 November 2020).
- Baishan City People’s Government. 2020. Available online: http://www.cbs.gov.cn/sq/sthj/201805/t20180519_323816.html. (accessed on 23 November 2020).
- Dargay, J.; Gately, D.; Sommer, M. The saturation is 807 cars per 1000 people. Energy J. 2007, 28, 143–170. [Google Scholar] [CrossRef] [Green Version]
- Wu, T.; Zhang, M.; Ou, X. Analysis of Future Vehicle Energy Demand in China Based on a Gompertz Function Method and Computable General Equilibrium Model. Energies 2014, 7, 7454–7482. [Google Scholar] [CrossRef] [Green Version]
- Huzhou Statistical Yearbook-2019. Available online: http://tjj.huzhou.gov.cn/hustats/html/tjnj2019/05.html (accessed on 20 November 2020).
- Shi, Y.; Guo, S.; Sun, P. The role of infrastructure in China’s regional economic growth. J. Asian Econ. 2017, 49, 26–41. [Google Scholar] [CrossRef]
- Announced by the Ministry of Transport of the People’s Republic of China, M. of T. of the P.R. of Highway Engineering Construction Project Estimate Budget Preparation Method (JTG 3830-2018). Ministry of Transport of the People’s Republic of China. 2019. Available online: http://xxgk.mot.gov.cn/2020/jigou/glj/202006/t20200623_3313130.html (accessed on 24 November 2020). (In Chinese)
- Department of Science and Technology, Ministry of Transport. Announced by the Ministry of Transport of the People’s Republic of China, M. of T. of the P.R. of. Highway Engineering Industry Standard. China Communications Press Co.,Ltd. 2018. Available online: http://www.mot.gov.cn/ (accessed on 24 November 2020).
- Vanclay, F.; Franks, D.M. International Association for Impact Assessment Purpose and Intended Readership. 2015, pp. 1–74. Available online: https://www.socialimpactassessment.com/documents/IAIA%202015%20Social%20Impact%20Assessment%20guidance%20document.pdf (accessed on 24 November 2020).
- Appiah-Opoku, S. Land access and resettlement: A guide to best practice, by Gerry Reddy, Eddie Smyth, and Michael Steyn. Impact Assess. Proj. Apprais. 2015, 33, 290. [Google Scholar] [CrossRef]
- Fomento, T. Virtual de Publicaciones del M. de. 2010. Code on Structural Concrete (EHE-08) Articles and Annexes. Available online: http://asidac.es/asidac-en/wp-content/uploads/2016/07/EHE-ENG.pdf (accessed on 26 November 2020).
- Suzuki, S.; Nijkamp, P. An evaluation of energy-environment-economic efficiency for EU, APEC and ASEAN countries: Design of a Target-Oriented DFM model with fixed factors in Data Envelopment Analysis. Energy Policy 2016, 88, 100–112. [Google Scholar] [CrossRef]
- Government, C. Data of GDP. Available online: http://www.gov.cn/shuju/index.htm (accessed on 24 November 2020).


| Methods | Description | Characteristic | Limitation | References |
|---|---|---|---|---|
| LCIA | Preventive design using 15 different methods of LCA concrete bridge deck. | How to reduce environmental pollution in the maintenance stage: Design and evaluation of 15 preventive measures. | The research content is relatively concentrated, single, and focuses on material replacement. | [16] |
| Use LCIA to evaluate the rationality of the bridge design. | Use wooden bridges and alternative concrete to analyse the LCA impact of a cable-stayed bridge. | Ideal research design for the future. There are currently no large-span wooden bridges in operation. There are assumptions and uncertainties in the maintenance assessment of wooden bridges. | [17] | |
| Apply life cycle sustainability assessment to the superstructure of small span bridges. | The study was conducted using 27 bridges, and it was determined that a bridge composed of steel and concrete was the best indicator. | The LCA study of ordinary highway bridges, the conclusion is whether it is suitable for long-span special bridges. | [18] | |
| LCA was used to assess the environmental impact of the entire 60-year life span of the provincial highway. | The research structure has a complete range of tunnels, bridges, roadbeds, culverts, etc. | The road selection is in a remote area, and the research data are not representative. | [19] | |
| Several cases (schools, hospitals, commercial and residential buildings) were quantitatively studied using LCA. | There are many types of structures studied, and an evaluation model is established to quantitatively analyse emissions. | The research conclusions are poorly comparable, and the LCA data are highly uncertain. | [20] | |
| LCCA | The article introduces a general framework for evaluating bridge life cycle performance and cost. | The focus is on analysis, prediction, optimization and decision-making under bridge uncertainty. | All the articles in this article are cost theory analysis, and there is no specific bridge case analysis. | [21] |
| Research and develop an LCCA model to evaluate highway infrastructure investment. | Contributed to the systematic and informatised evaluation method of highway infrastructure investment. | Lack of case studies and model application research. | [22] | |
| The energy consumption cost of highway pavement is analysed based on LCCA and LCA. | Combining LCA and LCCA to determine the best pavement frame, road expansion projects are more practical. | Case application analysis of pavement concrete sustainability, no structural concrete evaluation. | [23] | |
| Quantify the life cycle environmental impact of the structure through environmental costs. | Calculate the environmental costs of materials, energy, transportation and construction equipment for the bridge structure. | The main research is the LCCA influence of the bridge girder structure. | [24] | |
| The LCC and LCA analysis of concrete bridges were discussed, and the optimization scheme was proposed. | Economic and environmental impact analysis of reinforced concrete and prestressed concrete bridges. | The bridge structure is simply a simply supported beam bridge across the river. | [25] | |
| Use SLCA to clarify the assessment (IA) methods and information covered in the different impact guidelines. | Use representational models to analyse the difference and connection between social influence and social performance. | All are written descriptions, without modeling and data analysis. | [26,27,28] | |
| Use SIA to study and practice all issues related to social issues in the entire project life cycle (before conception to after closure). | Analysed the overall social issues in the process of community and project management. Put forward that the biggest social problem management in the project is corruption. | Lack of case application analysis and discussion. | [29,30] | |
| SIA is undergoing a revolutionary force and revolutionary force for change. | SIA’s unfamiliarity with social sciences and the concerns of practitioners’ lack of competence. | Lack of case application analysis and discussion. | [31,32] | |
| EIA and SIA have technical flaws in analysis and evaluation. | Consider four conceptual elements in a sociological context of complexity and vitality. | Talked about the project SIA’s attention to sensitive factors and the improvement of social responsibility. How to realize the scientific methodology needs to be developed. | [33,34] | |
| LCIA\LCCA\SILA | Evaluate the sustainability performance of different concrete and stone walls used in the building. | Multi-criteria decision analysis methods are used to evaluate and prioritise the alternative walls generated by LCA, LCC and S-LCA. | The research is sustainable and comprehensive, the evaluation structure is single, and recycling is not considered. | [35] |
| The study analysed the impact of different mixed timber building structures on three different categories of environment, economy and society. | The comparison of wood and concrete in the building structure has been analysed to improve sustainability. | There are few studies on the three pillars of sustainability. This article has the same research route and different structures. | [36] | |
| Three box-type concrete bridges were optimised and sustainable. | Researchers focus on the environmental pillar, while the social pillar has been slow to develop. | It mainly studies the process of sustainability assessment and briefly analyses three precast concrete bridges. | [37] | |
| Discussed the framework for assessing the sustainability of bridges, including related technical, economic, environmental and social issues. | The sustainability of four versions of the same bridge was studied, and the local details of the bridge were analysed. | There is a lack of sustainable research on regional and actual operating bridges. | [38] |
| Check Method | Inspection Cycle | Check Parts | Maintenance Cycle |
|---|---|---|---|
| Daily check | Working day | Pier foundation, cone slope, side wall of bridge abutment, pavement of bridge deck, drainage system, sidewalk, railing, guardrail, anti-collision wall of bridge deck, lighting system on bridge, expansion device, bridge head laying plate, sign, marking and traffic safety facilities, bridge installation sensors, wiring, cables, anchorage protection inspection, bridge damping device normal operation, support cleaning, rust and corrosion prevention. | Maintenance/year, Overhaul/5 years. |
| Frequency check | One time/every month | ||
| Regular check | One time/one to three years | Coating layer of exposed concrete. | Maintenance/year, Replacement/5 years. |
| Bridge deck paving, waterproof layer. | Maintenance/year, Overhaul/2 years, Replacement/10 years. | ||
| Anti-collision guardrail, expansion joint. | Maintenance/year, Overhaul/2-5 years, Replacement/15 years. | ||
| Cable-stayed bridge cables, slings, tie rods, external damping devices. | Maintenance/year, Overhaul/5 years, Replacement/20 years. | ||
| Main beams, steel supports, bridge floor drainage pipes, bridge floor lighting facilities. | Maintenance/year, Overhaul/5 years, Replacement/50 years. | ||
| Basin type rubber bearing. | Maintenance/year, Overhaul/5 years, Replacement/25 years. | ||
| Damping device between towers and beams. | Maintenance/year, Overhaul/5 years, Replacement/30 years. | ||
| Main beams, steel supports, bridge floor drainage pipes, bridge floor lighting facilities. | Maintenance/year, Overhaul/5 years, Replacement/50 years. |
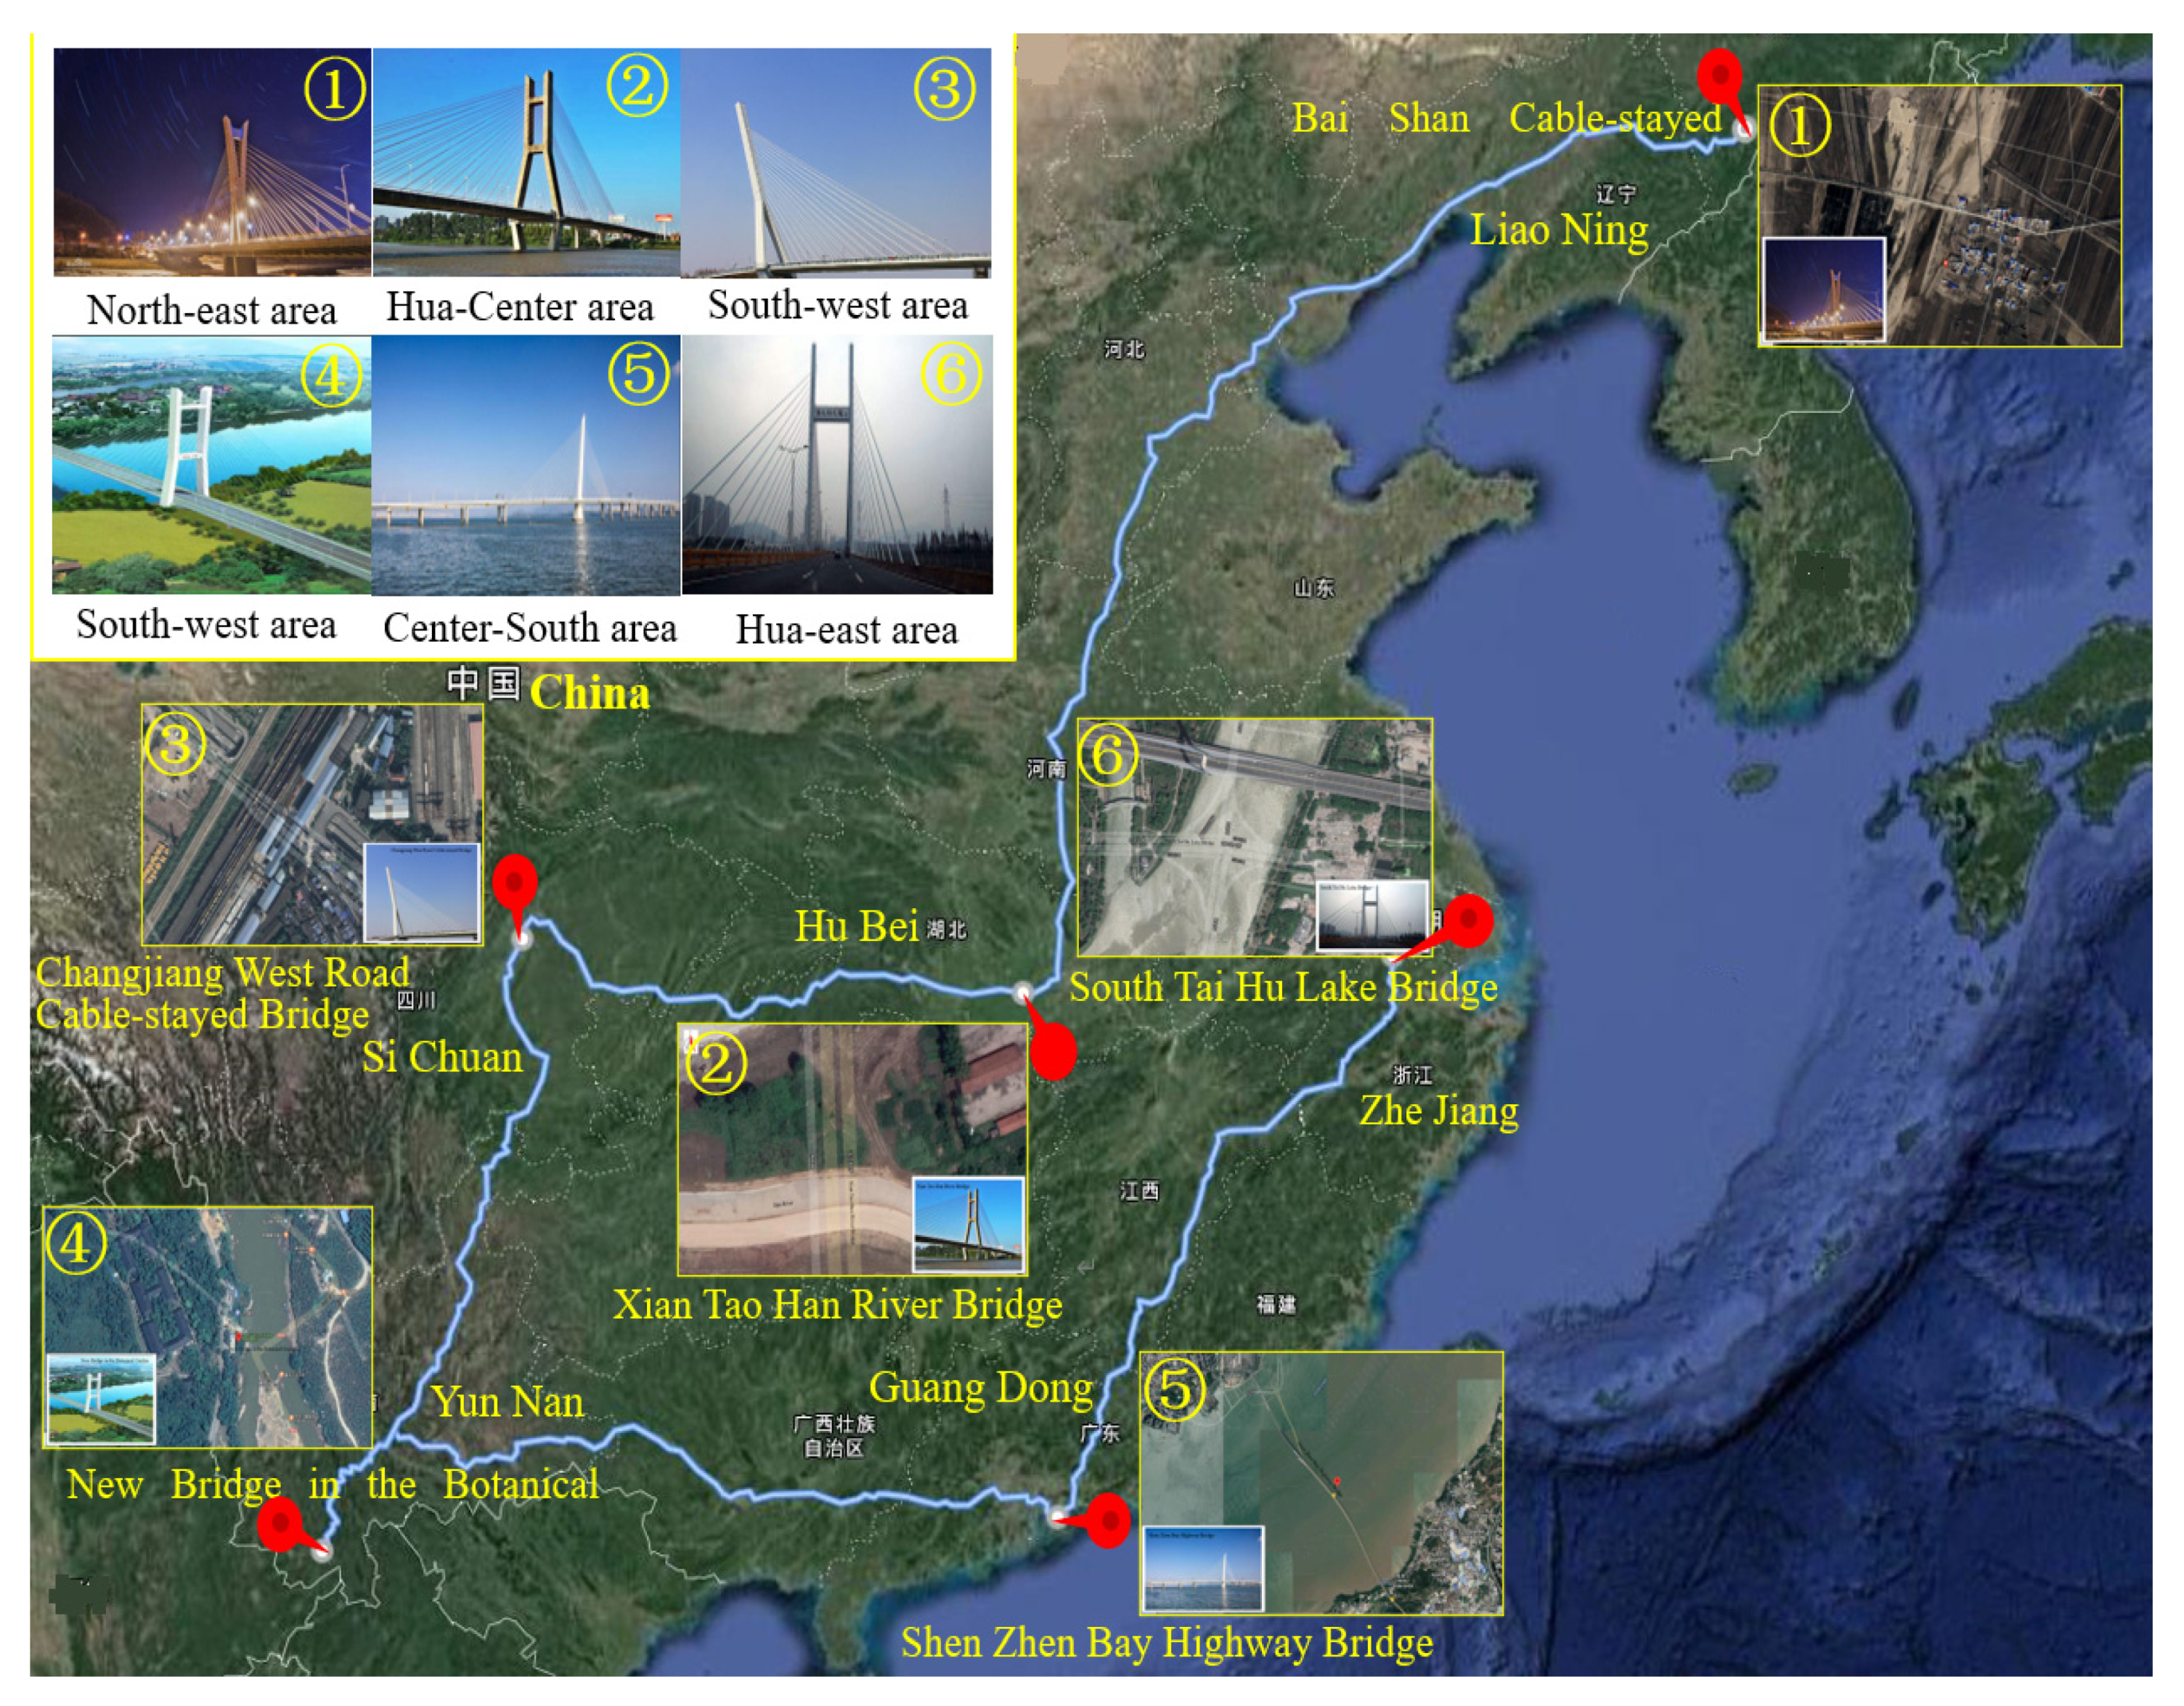
| Bridge Name | Regional Location | Basic Situation | Bridge Layout Drawing |
|---|---|---|---|
| South Tai Hu Lake Bridge (338 m) | East China, Huzhou in Zhejiang | The main bridge is a double-cable, plane H-shaped, single-tower, concrete, cable-stayed bridge with a span layout of 160 + 190 + 38 m, an urban expressway level, and a design speed of 60 Km/h. The standard section width of the bridge is 40.5 m. The main beam adopts the cross-section form of double main ribs, the building height is 3.055 m, the full width is 40.5 m, and the standard main rib is 2.7 m high and 1.7 m wide. The transverse partition is 0.28 m wide; the bridge deck is 28 cm thick, and each cable plane has 24 pairs of cables. |  |
| Shenzhen Bay Bridge (345 m) | Central and South China, Shenzhen Bay | The North Channel Bridge adopts the “180 + 90 + 75 m” span layout, the main beam adopts bolt-welded streamlined steel box girder, the beam height is 4.12 m, the standard section length is 12 m, and the overall width is 38.6 m. The total height of the pylon is 139.053 m. The main beam adopts a single-box, four-chamber, thin-walled structure composed of steel box beams with cantilever arms. The top plate thickness of the bridge deck is 18 mm; the bottom plate is 12–20 mm. The bridge has a total of 12 pairs of stay cables with a cable distance of 3 m and a standard cable distance of 12 m. |  |
| New Bridge of Xishuangbanna Tropical Botanical Garden (225 m) | Southwest China, Xishuangbanna Prefecture | The main bridge is an elliptical steel box with a concrete tower column, double cable plane, cable-stayed bridge with a span of 75 + 90 m and a total length of 165 m. The side span is 75 m and the main span is 90 m. The full width of the bridge deck is 14.2 m, the side main beam is 1.8 m high, the bottom width is 1.2 m, the outer top and bottom width is 1.55 m, and the bridge deck is 22 cm thick. The tower column of the cable-stayed bridge adopts a steel box concrete structure with a cross section of 2.5 * 4.0 m and a steel plate thickness of 20 mm. |  |
| Cable-stayed Bridge of Changjiang West Road, Deyang City (136 m) | Southwest China, Deyang City | Single tower, single cable, plane cable-stayed bridge without back cable, main span 108 m, side span 27.7 m, harp-shaped cable surface, tower and beam consolidation. The standard cable distance on the beam is 8 m, the standard section is 8 m long and weighs about 300 Tons. The main beam adopts a pre-stressed concrete, single-chamber, three-box, flat, thin-walled box beam. The top plate of the box is 24 m wide; the bottom plate is 8.4 m wide, the beam height is 2.5 m, the top plate thickness is 24 cm, the bottom plate thickness is 30 cm, the inclined web plate thickness is 22 cm, and the vertical web plate thickness is 30 cm. A horizontal partition is set every 4 m with a thickness of 28 cm. The approach bridge adopts multi-span continuous beams, all of which are 20 m in span, and the main beam is a 1.4 m high box girder. |  |
| Hanjiang Highway Bridge in Xiantao City (312 m) | Central China, Xiantao City | The main bridge is a 50 + 82 + 180 m, three-span, single-tower, double-cable plane cable-stayed bridge, the main girder has a full cross-section width of 25.6 m, a basic section length of 8 m, a basic width of side ribs of 1.8 m, and a basic spacing of 8 m between the diaphragms. The roof thickness of the main beam is 0.30 m, and the beam height is 1.9 m. |  |
| Baishan Bridge in Baishan City (410 m) | Northeast China, Baishan City | The main bridge is a two-span, single-cable, plane cable-stayed bridge with a span of 85 + 85 m. The main beam adopts a single box three-chamber section, the beam height is 2.0 m, the thickness of the top plate is 20 cm, and the thickness of the bottom plate is 40 cm. The section of the main tower adopts an “H” shaped cross-section concrete tower column. Oblique cable harp layout, single-cable deck bridge type, double-width layout with a net width of 15.5 m and a total width of 23.3 m. |  |
| Number | Cost Incurred | Ratio | Calculation Method | STHB | SZBB | BGNB | CJWB | XTHB | BSCB |
|---|---|---|---|---|---|---|---|---|---|
| 1 | Direct project cost | 63,392,933.82 | 92,208,319.2 | 15,353,271.88 | 20,691,737.1 | 40,938,707.24 | 32,501,337.6 | ||
| 2 | Insurance fee | 1,901,788.015 | 2,766,249.576 | 460,598.1564 | 620,752.114 | 1,228,161.217 | 975,040.129 | ||
| 2-1 | Project insurance stipulated in the contract | 2.50% | 1*2(2-1) | 1,584,823.346 | 2,305,207.98 | 383,831.797 | 517,293.428 | 1,023,467.681 | 812,533.441 |
| 2-2 | Third-party liability insurance stipulated in the contract | 0.50% | 1*2(2-2) | 316,964.6691 | 461,041.596 | 76,766.3594 | 103,458.686 | 204,693.5362 | 162,506.688 |
| 3 | Completion Files. | 500,000 | Constant cost | 500,000 | 500,000 | 500,000 | 500,000 | 500,000 | 500,000 |
| 4 | Construction environmental protection fees | 1,000,000 | Constant cost | 1,000,000 | 1,000,000 | 1,000,000 | 1,000,000 | 1,000,000 | 1,000,000 |
| 5 | Safety production fees | 1.50% | 1*5 | 950,894.0074 | 1,383,124.788 | 230,299.0782 | 310,376.057 | 614,080.6085 | 487,520.064 |
| 6 | Engineering management software (temporary estimate) | 100,000 | Constant cost | 100,000 | 100,000 | 100,000 | 100,000 | 100,000 | 100,000 |
| 7 | Application fee for building information model technology | 100,000 | Constant cost | 100,000 | 100,000 | 100,000 | 100,000 | 100,000 | 100,000 |
| 8 | Temporary road construction, maintenance and dismantling fees | 101,428.6941 | 147,533.3107 | 24,565.23501 | 33,106.7794 | 65,501.93158 | 52,002.1402 | ||
| 8-1 | Fees for the construction, maintenance and dismantling of the original roads | 0.08% | 1*8(8-1) | 50,714.34706 | 73,766.65536 | 12,282.6175 | 16,553.3897 | 32,750.96579 | 26,001.0701 |
| 8-2 | Construction, maintenance and dismantling fees of temporary steel trestle and wharf | 0.08% | 1*8(8-2) | 50,714.34706 | 73,766.65536 | 12,282.6175 | 16,553.3897 | 32,750.96579 | 26,001.0701 |
| 9 | Temporarily occupying land and occupying the river | 0.25% | 1*9 | 158,482.3346 | 230,520.798 | 38,383.1797 | 51,729.3428 | 102,346.7681 | 81,253.3441 |
| 10 | Erection, maintenance and dismantling of temporary power supply facilities | 0.08% | 1*10 | 50,714.34706 | 73,766.65536 | 12,282.6175 | 16,553.3897 | 32,750.96579 | 26,001.0701 |
| 11 | Provision, maintenance and dismantling of telecommunications facilities | 0.08% | 1*11 | 50,714.34706 | 73,766.65536 | 12,282.6175 | 16,553.3897 | 32,750.96579 | 26,001.0701 |
| 12 | Water supply and sewage facilities | 0.08% | 1*12 | 50,714.34706 | 73,766.65536 | 12,282.6175 | 16,553.3897 | 32,750.96579 | 26,001.0701 |
| 13 | The construction fee of the contractor’s project department | 0.42% | 1*13 | 266,250.3221 | 387,274.9406 | 64,483.74189 | 86,905.2959 | 171,942.5704 | 136,505.618 |
| 14 | Provisional expenses. | 5.00% | (1 + 2 + 3 + 4 + 5 + 6 + 7 + 8 + 9 + 10 + 11 + 12 + 13)*14 | 3,431,196.012 | 4,952,216.129 | 895,422.4561 | 1,177,213.34 | 2,245,949.661 | 1,800,583.11 |
| The total fees of the project | 1 +…+ 14 | 72,055,116.25 | 103,996,538.7 | 18,803,871.58 | 24,721,480.2 | 47,164,942.89 | 37,812,245.2 | ||
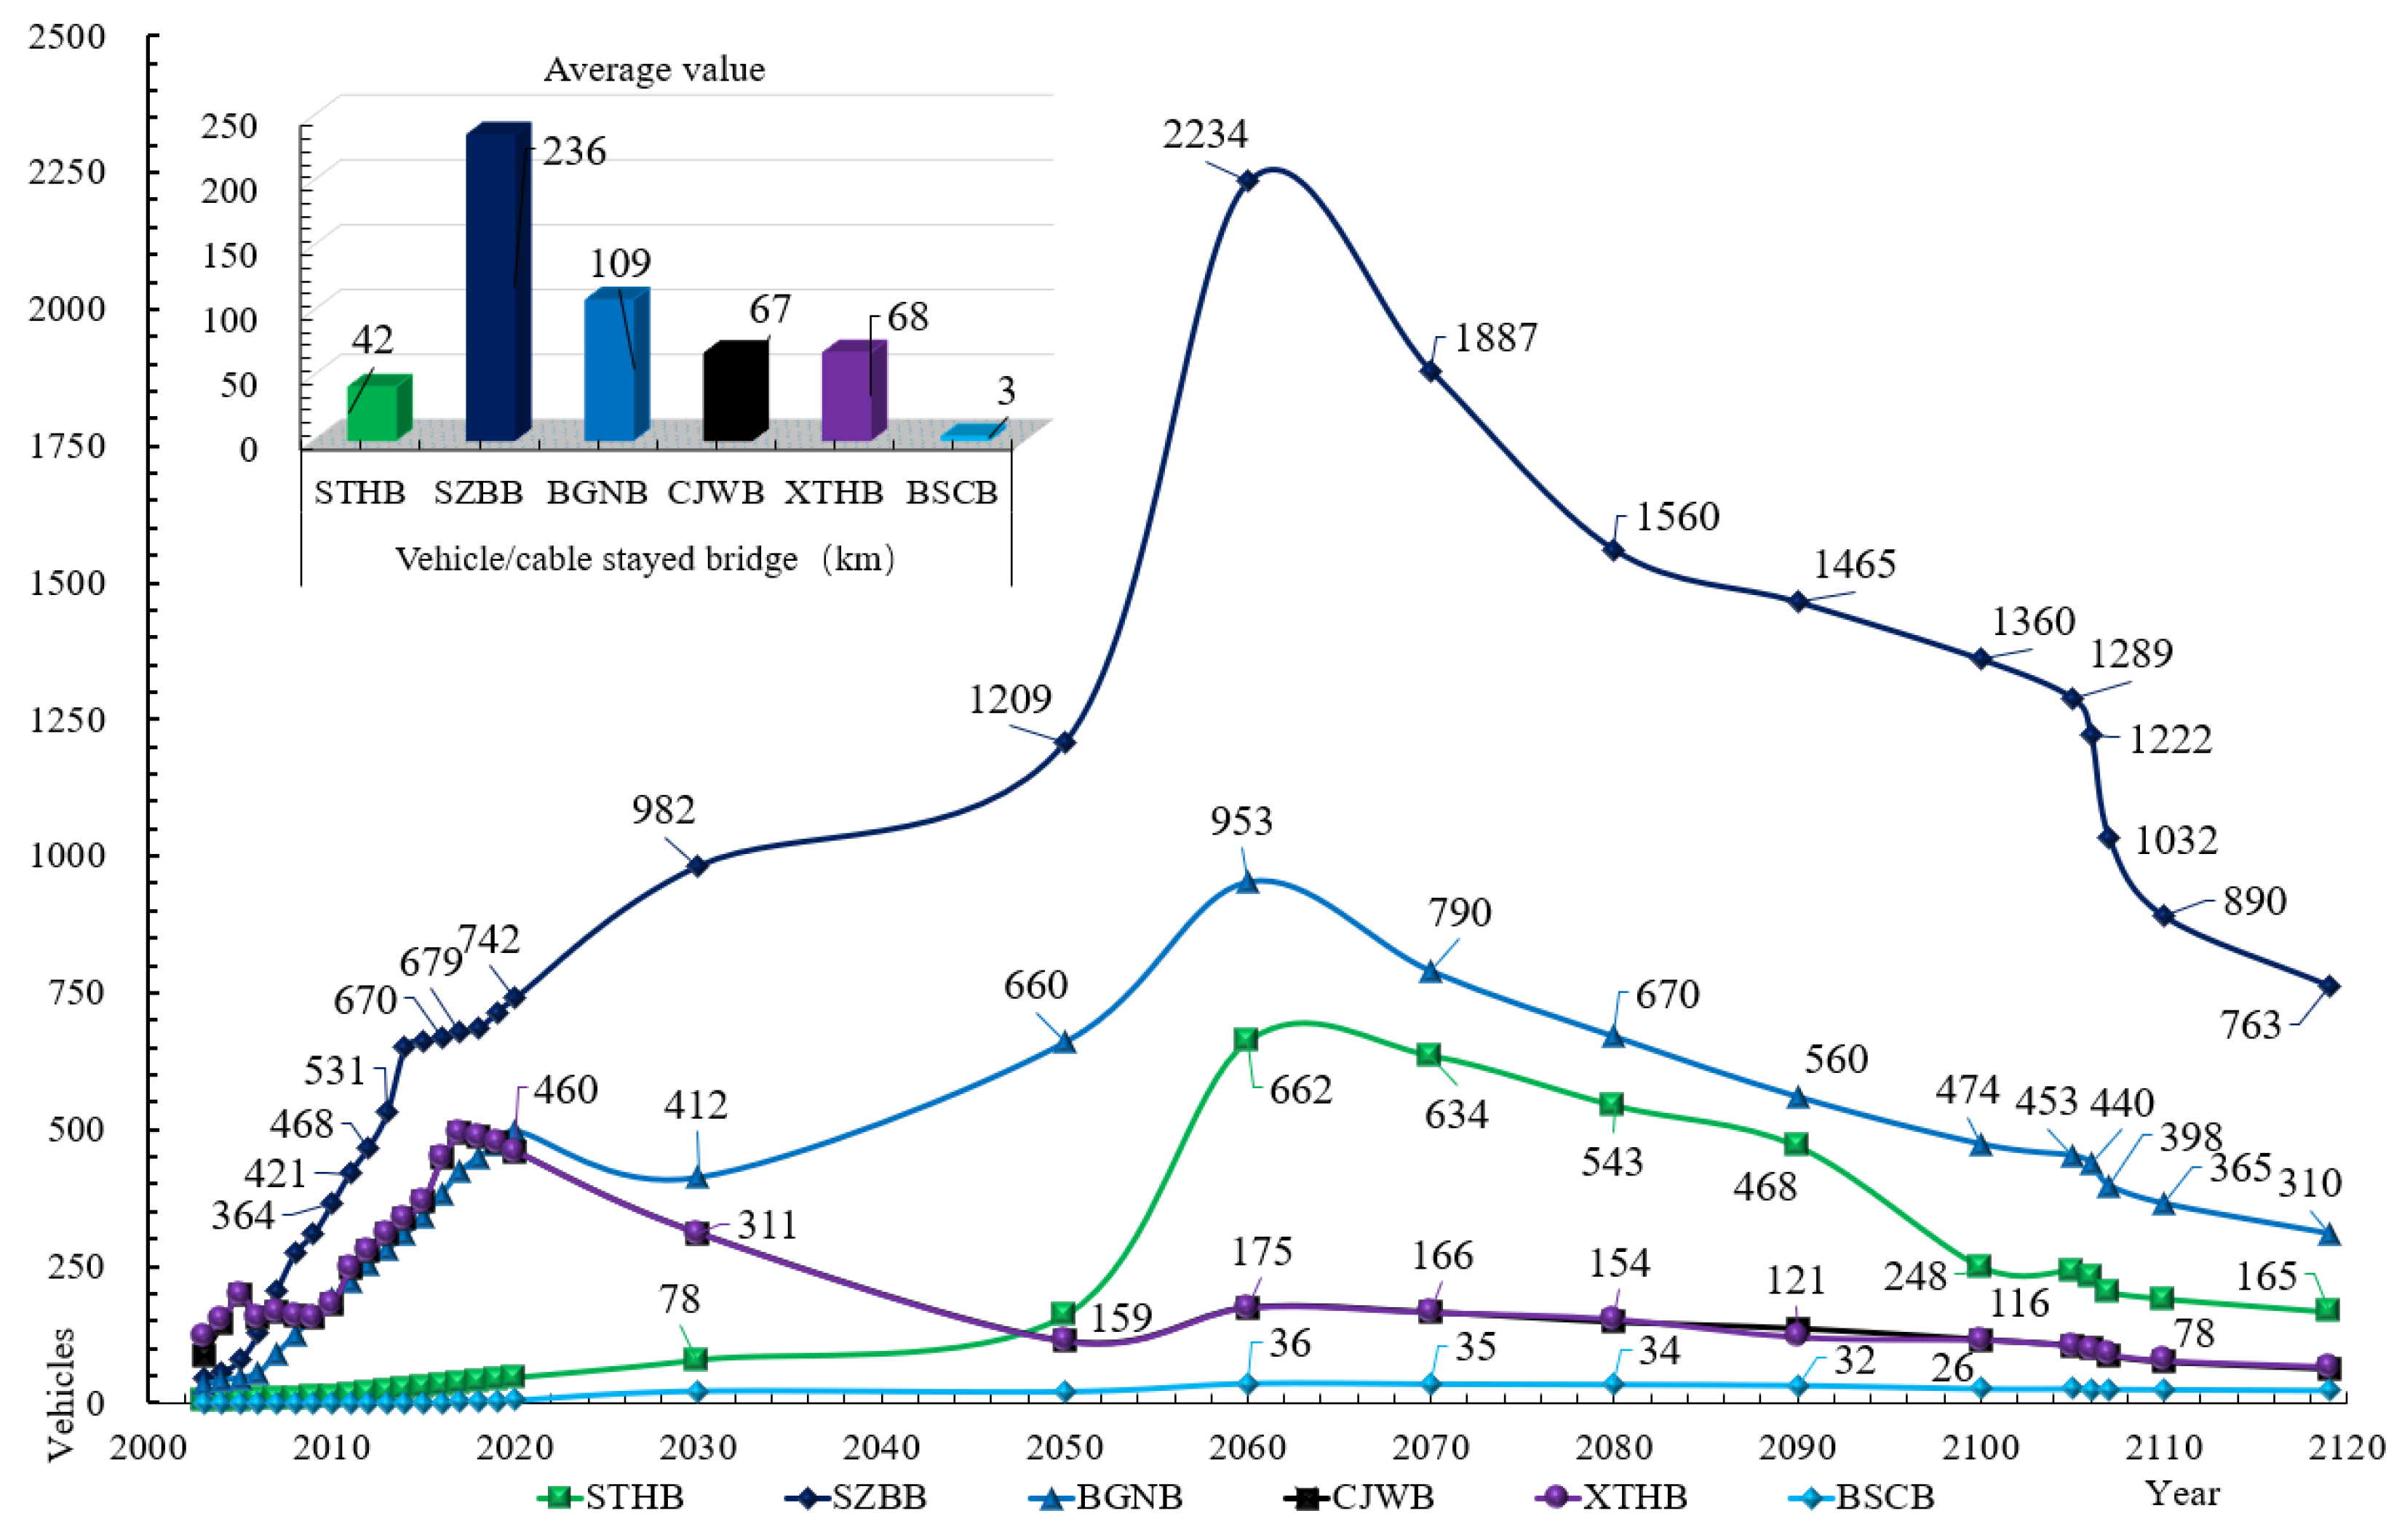
| Bridge Name | Time Period (Years) | Accident Loss (CNY/Time) | Times of Accidents | Comprehensive Loss Fee (CNY) |
|---|---|---|---|---|
| STHB | 2006~2018, 2019~2030, 2031~2105 | 3866 | 693\659\460 | 7,005,192 |
| SZBB | 2007~2018, 2019~2030, 2031~2106 | 3259 | 268\255\179 | 2,287,818 |
| BGNB | 2006~2018, 2019~2030, 2031~2105 | 4831 | 301\286\201 | 3,806,828 |
| CJWB | 2005~2018, 2019~2030, 2031~2104 | 8706 | 1070\1019\718 | 24,437,742 |
| XTHB | 2003~2018, 2019~2030, 2031~2102 | 6885 | 262\250\175 | 4,730,682 |
| BSCB | 2019~2030, 2031~2118 | 7213 | 456\434\306 | 8,626,748 |
| Bridge Name | GWP | AP | FEP | PMFP | WP |
|---|---|---|---|---|---|
| STHB | 285,792,121.03 | 758,359.05 | 778,387.38 | 2,755,862.99 | 4,202,670.97 |
| SZBB | 75,192,817.81 | 538,510.86 | 445,853.55 | 1,469,182.83 | 3,451,343.80 |
| BGNB | 69,261,736.42 | 214,170.43 | 251,077.34 | 756,768.56 | 1,397,595.57 |
| CJWB | 80,429,187.06 | 236,629.18 | 264,255.94 | 845,577.45 | 1,414,549.54 |
| XTHB | 167,606,486.66 | 424,005.32 | 502,313.61 | 1,559,831.83 | 2,530,246.34 |
| BSCB | 151,598,681.32 | 322,031.97 | 424,120.38 | 1,219,842.08 | 1,917,809.39 |
| Bridge Name | Quantity Analysed According to Chinese Standards | Quantity Analysed According to European Standards |
|---|---|---|
| STHB | 202,577,714.70 | 4,060,953.15 |
| SZBB | 8,469,275.96 | 5,413,303.55 |
| BGNB | 46,427,579.22 | 1,264,900.09 |
| CJWB | 61,909,222.65 | 1,857,067.35 |
| XTHB | 127,556,952.20 | 3,689,371.79 |
| BSCB | 120,405,196.80 | 1,648,154.08 |
| Cost Name | STHB | SZBB | BGNB | CJWB | XTHB | BSCB |
|---|---|---|---|---|---|---|
| Cost of project preparation | 0.01% | 0.02% | 0.01% | 0.01% | 0.01% | 0.01% |
| Survey and design costs | 0.07% | 0.13% | 0.06% | 0.05% | 0.06% | 0.06% |
| Project construction costs | 33.63% | 63.20% | 28.29% | 24.39% | 30.40% | 29.99% |
| Maintenance and operating costs | 60.57% | 33.56% | 63.69% | 49.94% | 63.78% | 60.00% |
| Accident costs | 3.27% | 1.39% | 5.73% | 24.11% | 3.05% | 6.84% |
| Demolition stage costs | 2.45% | 1.69% | 2.23% | 1.50% | 2.69% | 3.10% |
| Bridge Name | Fatal Accidents | International Migrant Workers | Youth Illiteracy | Corruption | Sanitation Coverage |
|---|---|---|---|---|---|
| STHB | 55,792,892.84 | 31,765,165.76 | 28,624,476.33 | 118,864,998.3 | 88,496,114.86 |
| SZBB | 47,282,293.11 | 26,919,734.79 | 24,258,123.41 | 1,007,33434 | 74,996,993.87 |
| BGNB | 6,502,779.89 | 3,702,297.38 | 3,336,243.37 | 13,853,967.44 | 10,314,409.72 |
| CJWB | 9,202,951.4 | 5,239,614.97 | 4,721,563.11 | 19,606,597.66 | 14,597,297.3 |
| XTHB | 28,358,724.3 | 16,145,776.5 | 14,549,409.27 | 60,417,367.61 | 44,981,301.3 |
| BSCB | 14,063,615.15 | 8,006,988.77 | 7,215,320.78 | 29,962,088.48 | 22,307,058.1 |
Publisher’s Note: MDPI stays neutral with regard to jurisdictional claims in published maps and institutional affiliations. |
© 2020 by the authors. Licensee MDPI, Basel, Switzerland. This article is an open access article distributed under the terms and conditions of the Creative Commons Attribution (CC BY) license (http://creativecommons.org/licenses/by/4.0/).
Share and Cite
Zhou, Z.; Alcalá, J.; Yepes, V. Environmental, Economic and Social Impact Assessment: Study of Bridges in China’s Five Major Economic Regions. Int. J. Environ. Res. Public Health 2021, 18, 122. https://0-doi-org.brum.beds.ac.uk/10.3390/ijerph18010122
Zhou Z, Alcalá J, Yepes V. Environmental, Economic and Social Impact Assessment: Study of Bridges in China’s Five Major Economic Regions. International Journal of Environmental Research and Public Health. 2021; 18(1):122. https://0-doi-org.brum.beds.ac.uk/10.3390/ijerph18010122
Chicago/Turabian StyleZhou, ZhiWu, Julián Alcalá, and Víctor Yepes. 2021. "Environmental, Economic and Social Impact Assessment: Study of Bridges in China’s Five Major Economic Regions" International Journal of Environmental Research and Public Health 18, no. 1: 122. https://0-doi-org.brum.beds.ac.uk/10.3390/ijerph18010122