
Role of Mesh Pore Size in Dynamic Membrane Bioreactors


Abstract
:1. Introduction
2. Materials and Methods
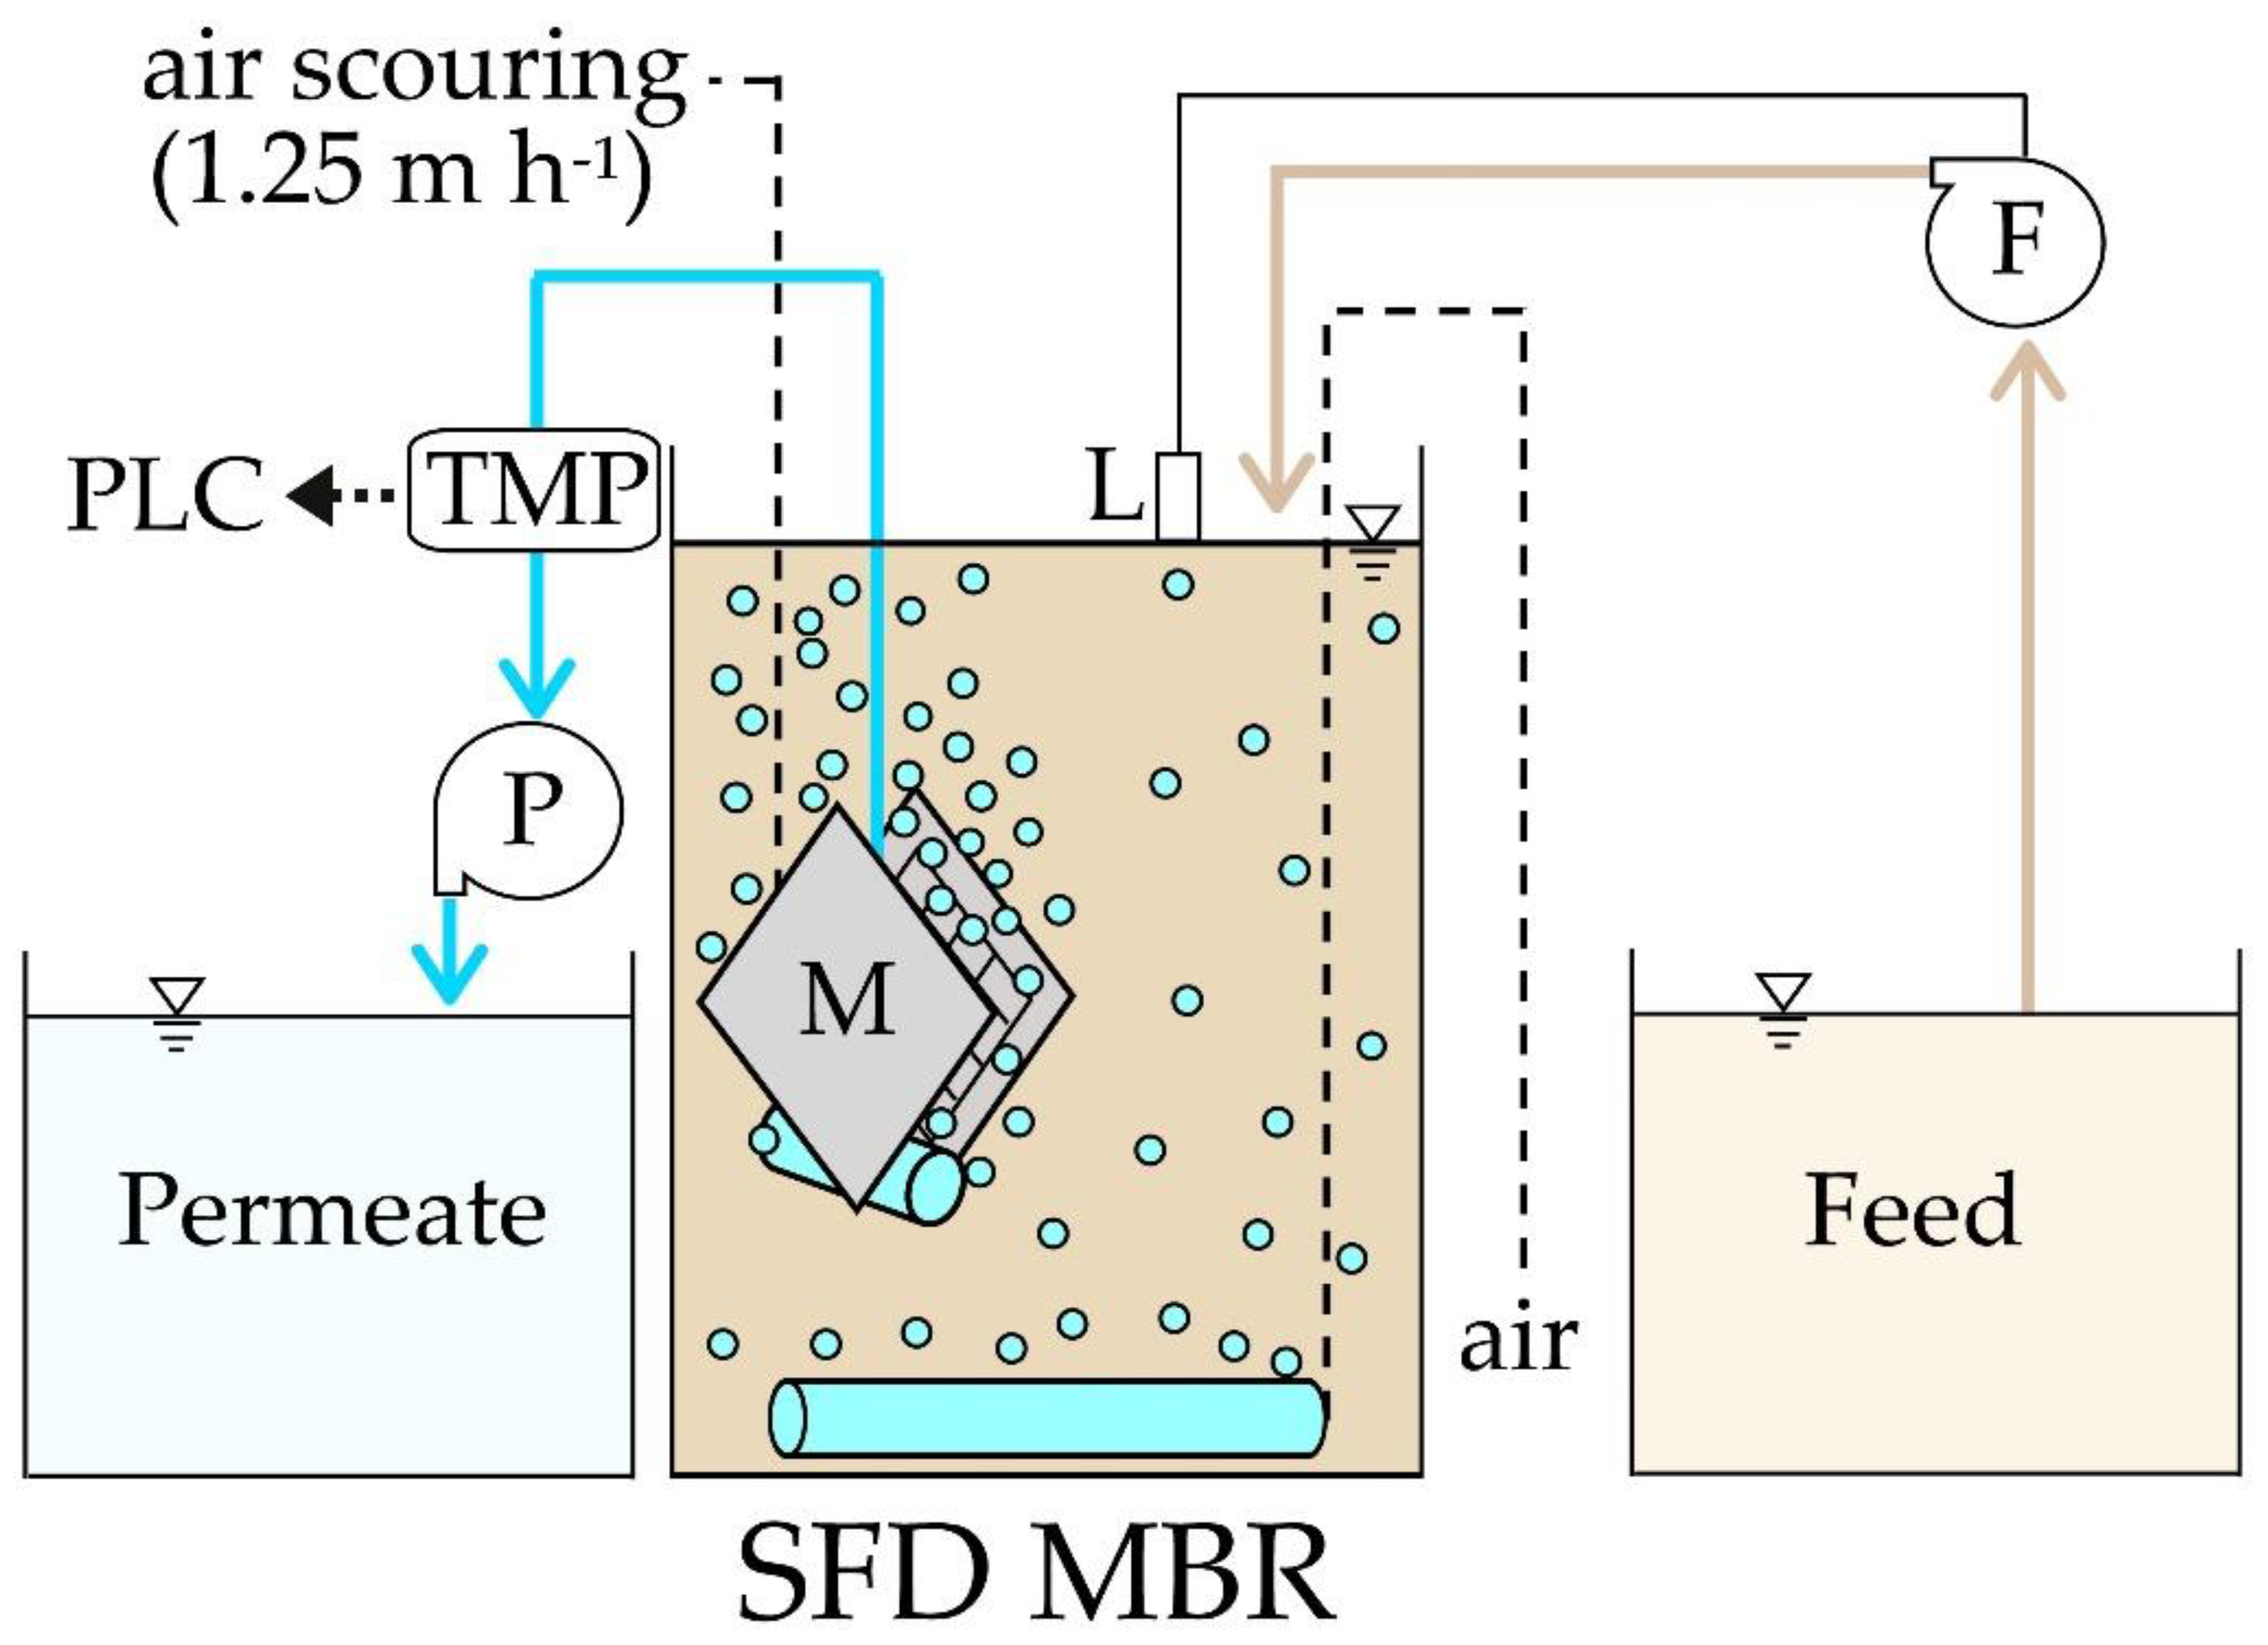
2.1. Bioreactor Operation
2.2. Monitoring and Analyses
3. Results
3.1. Average Performance
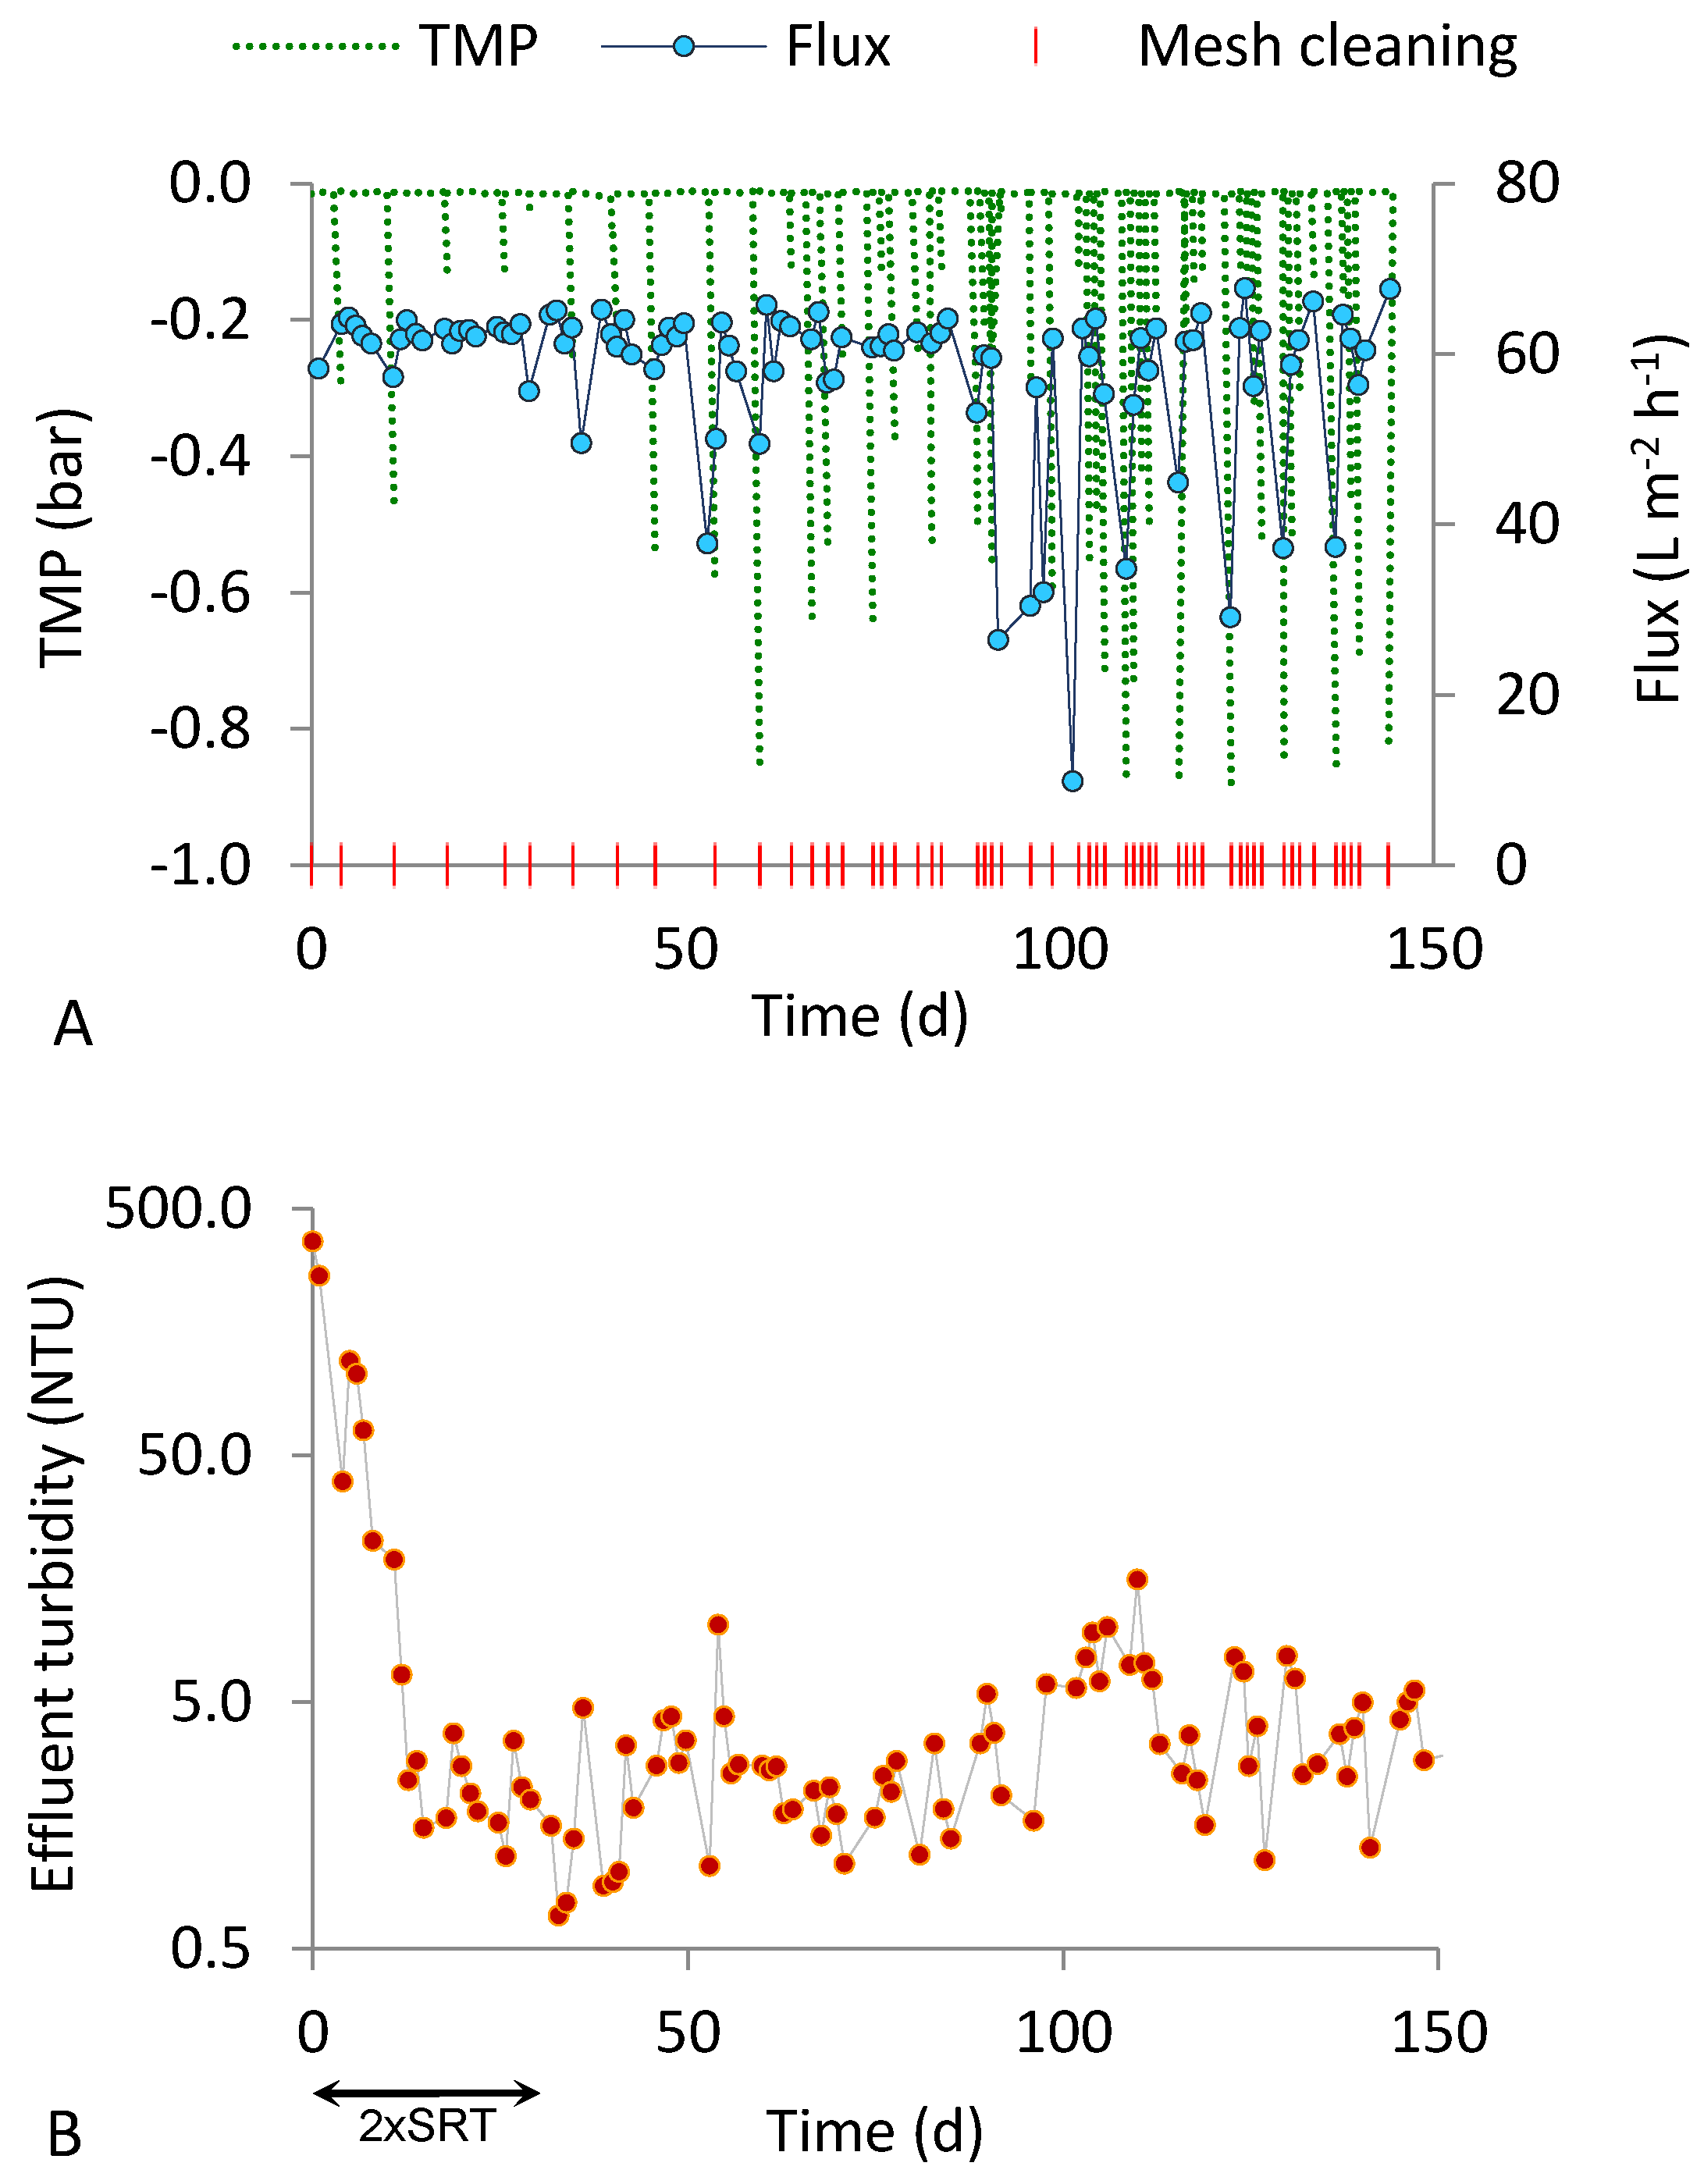
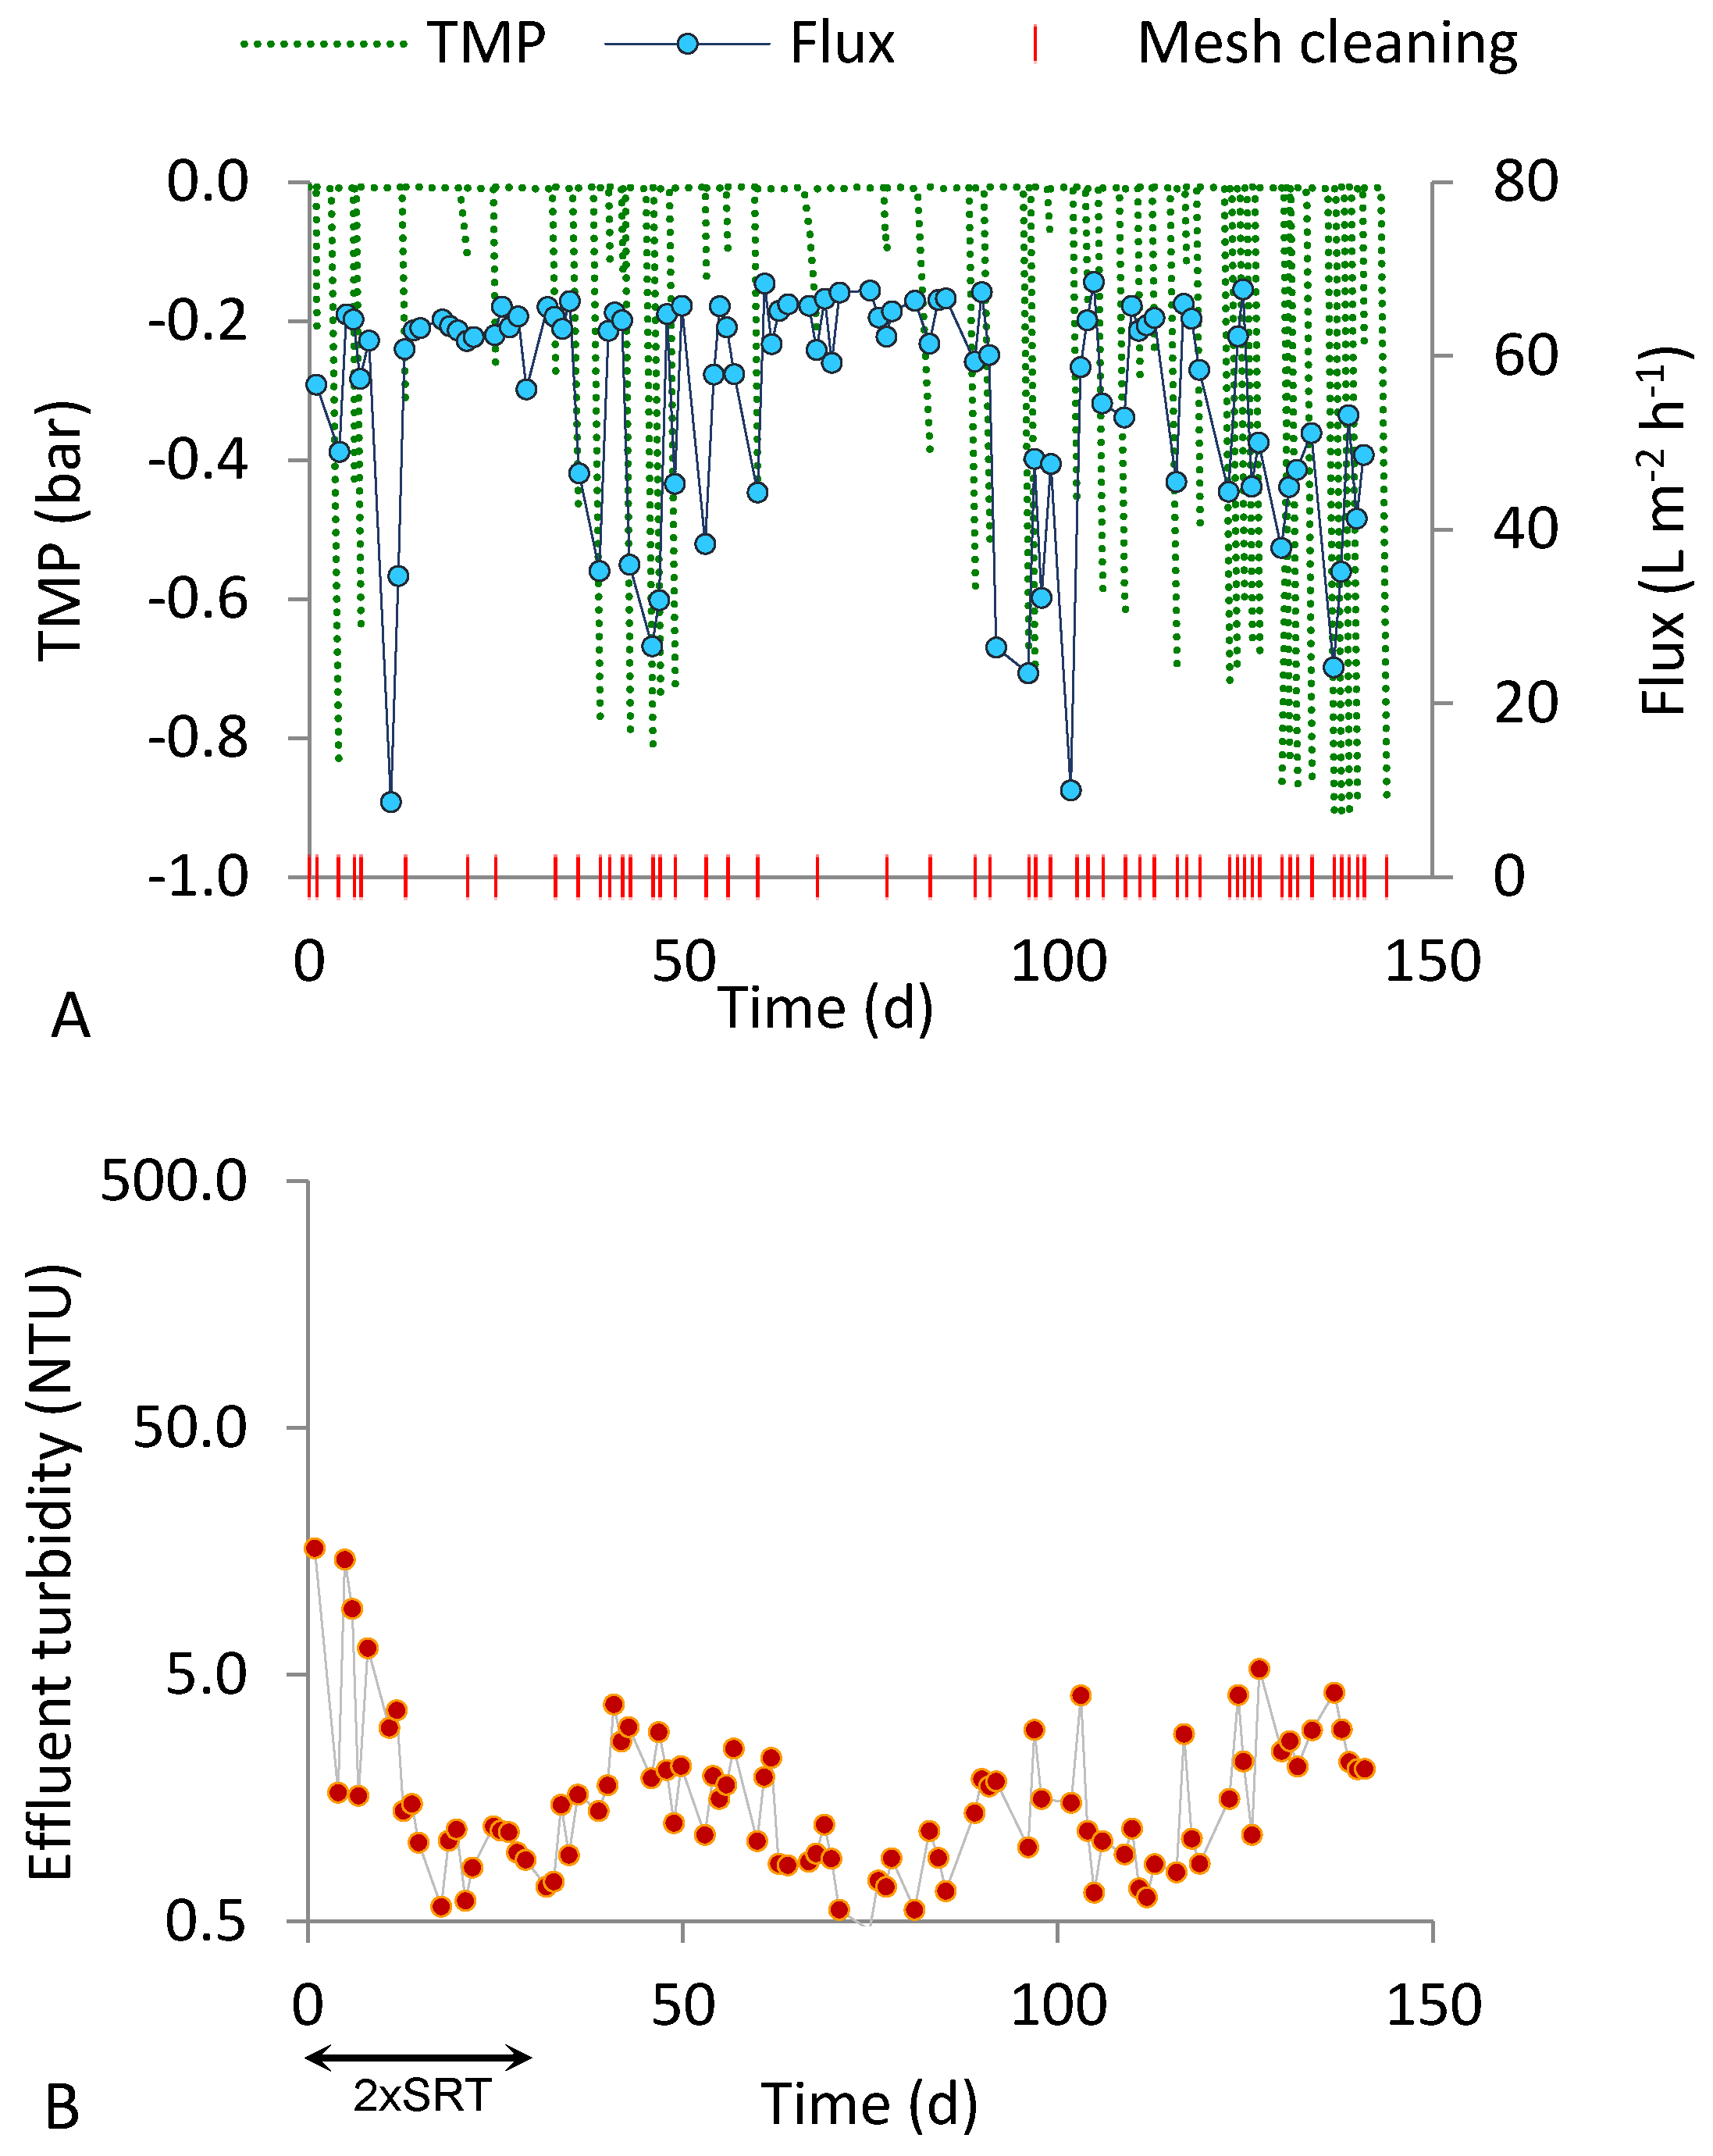
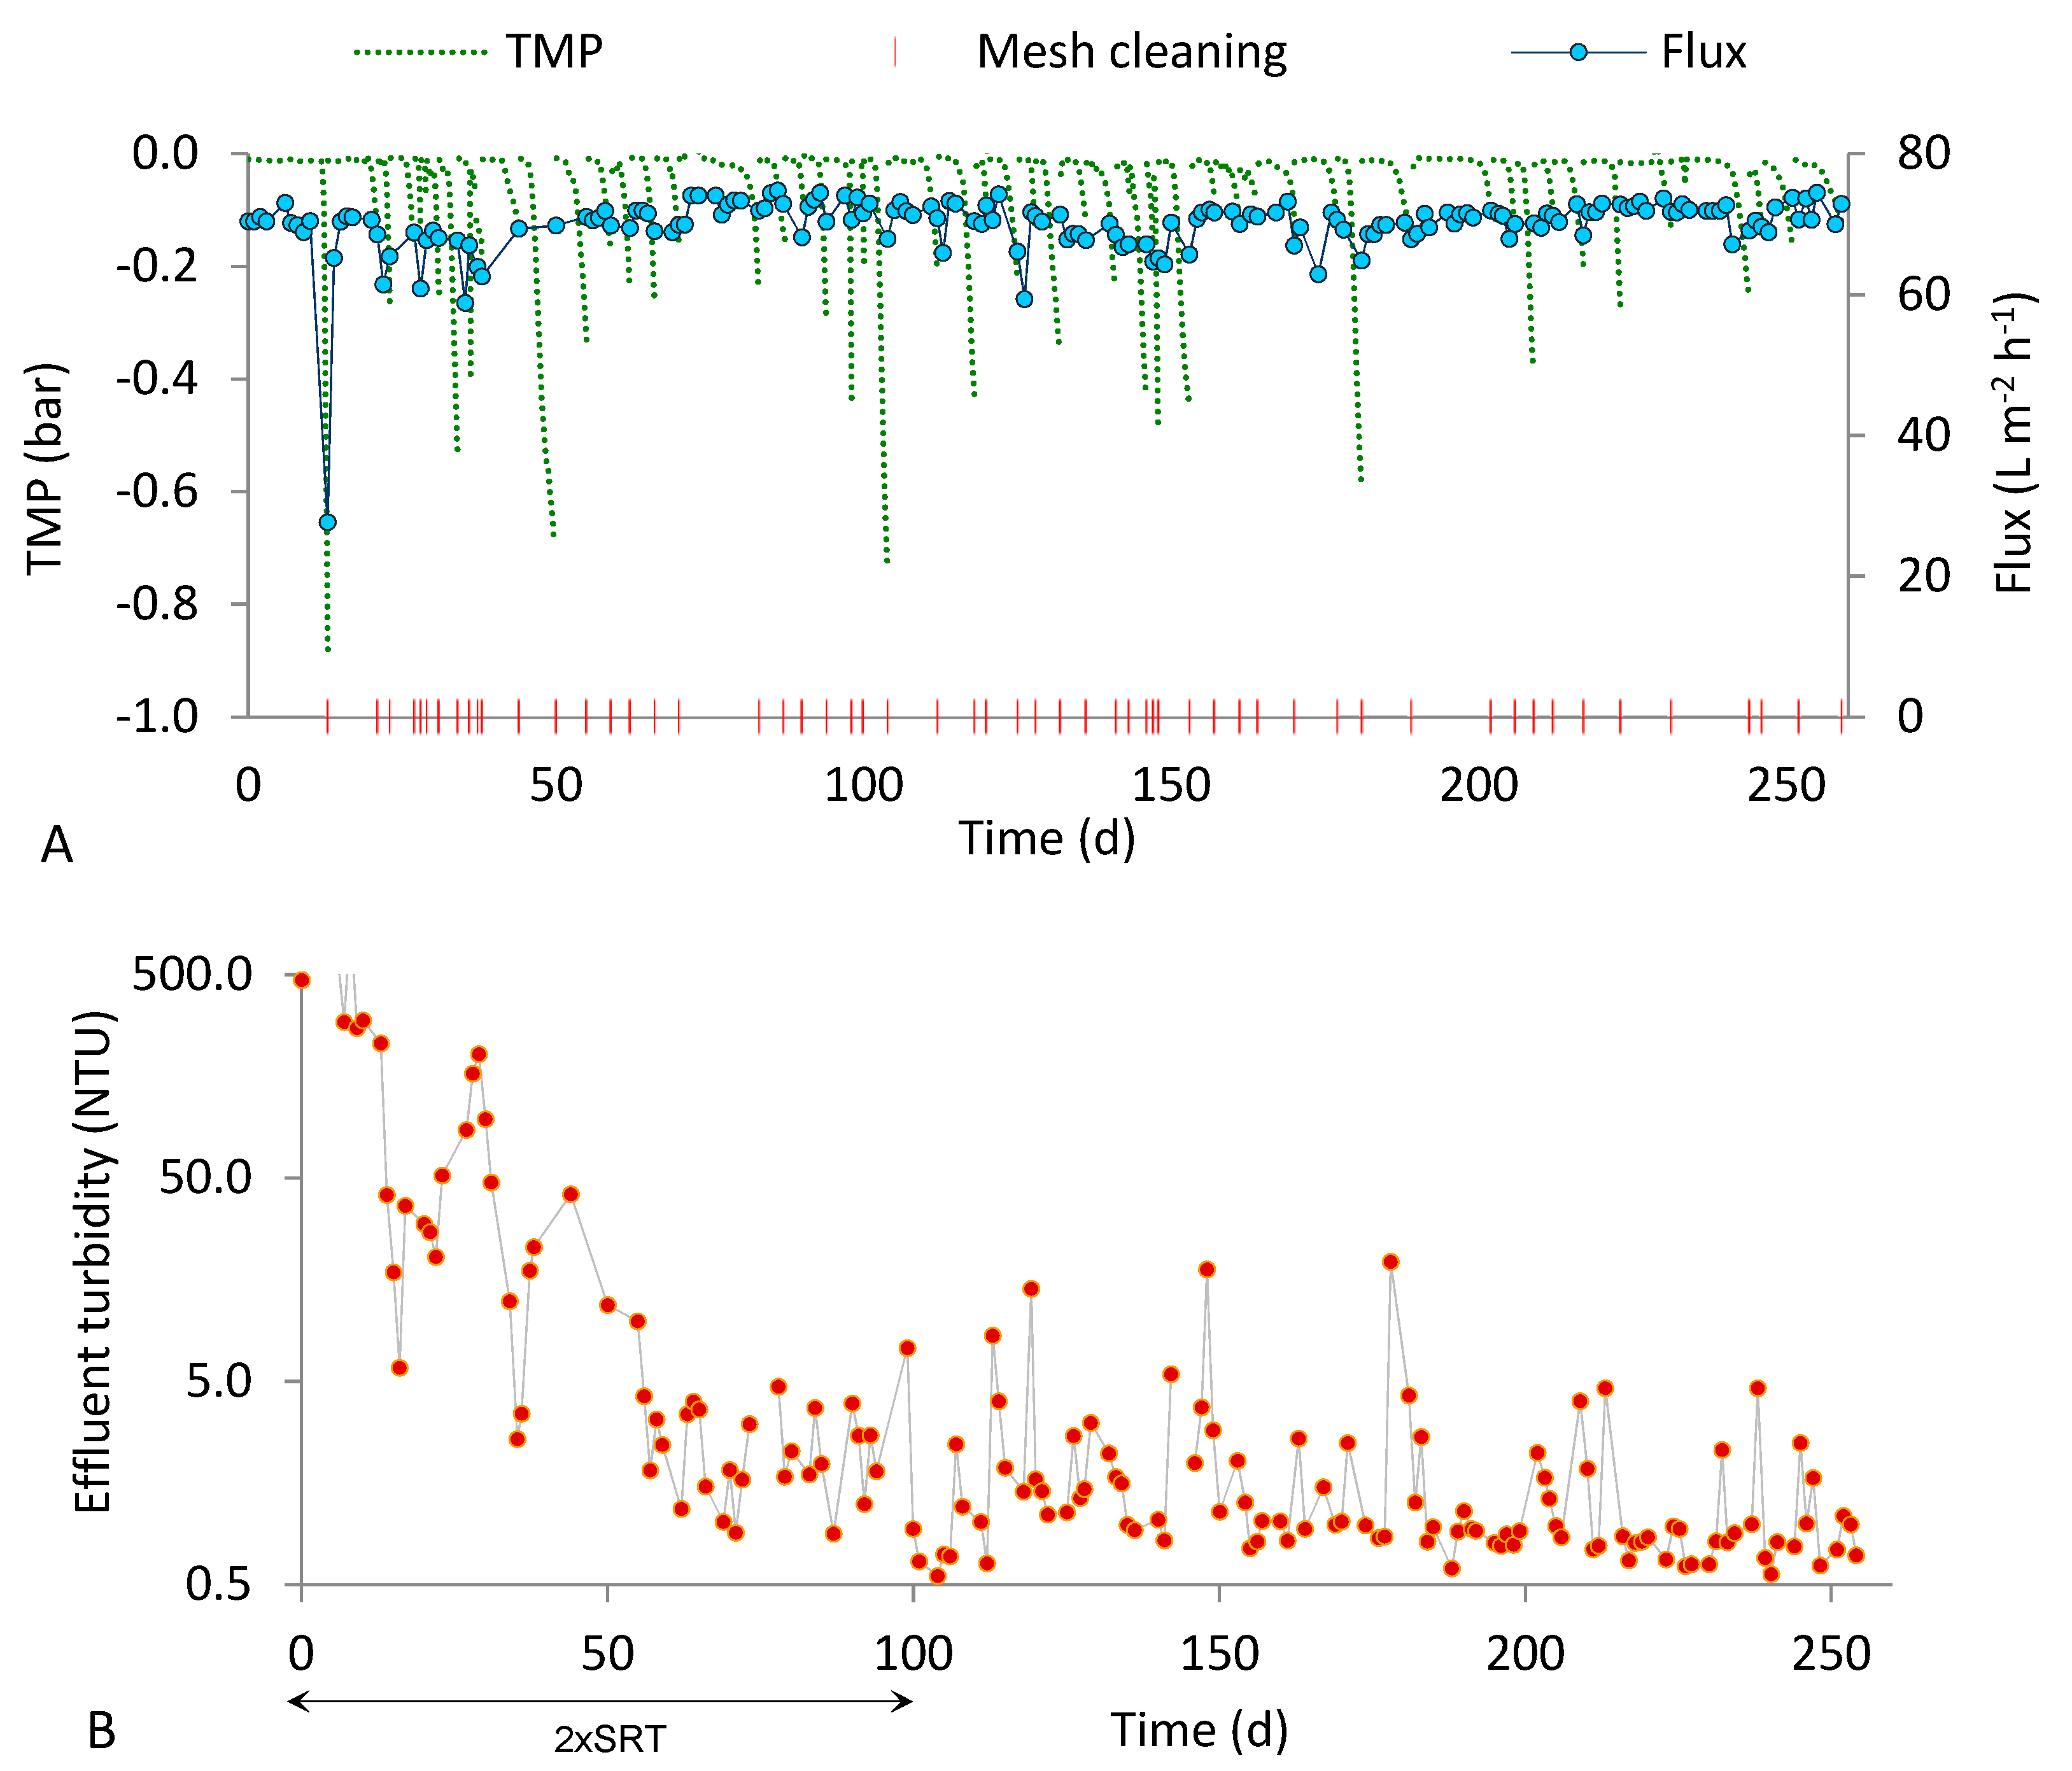
3.2. 15 D SRT
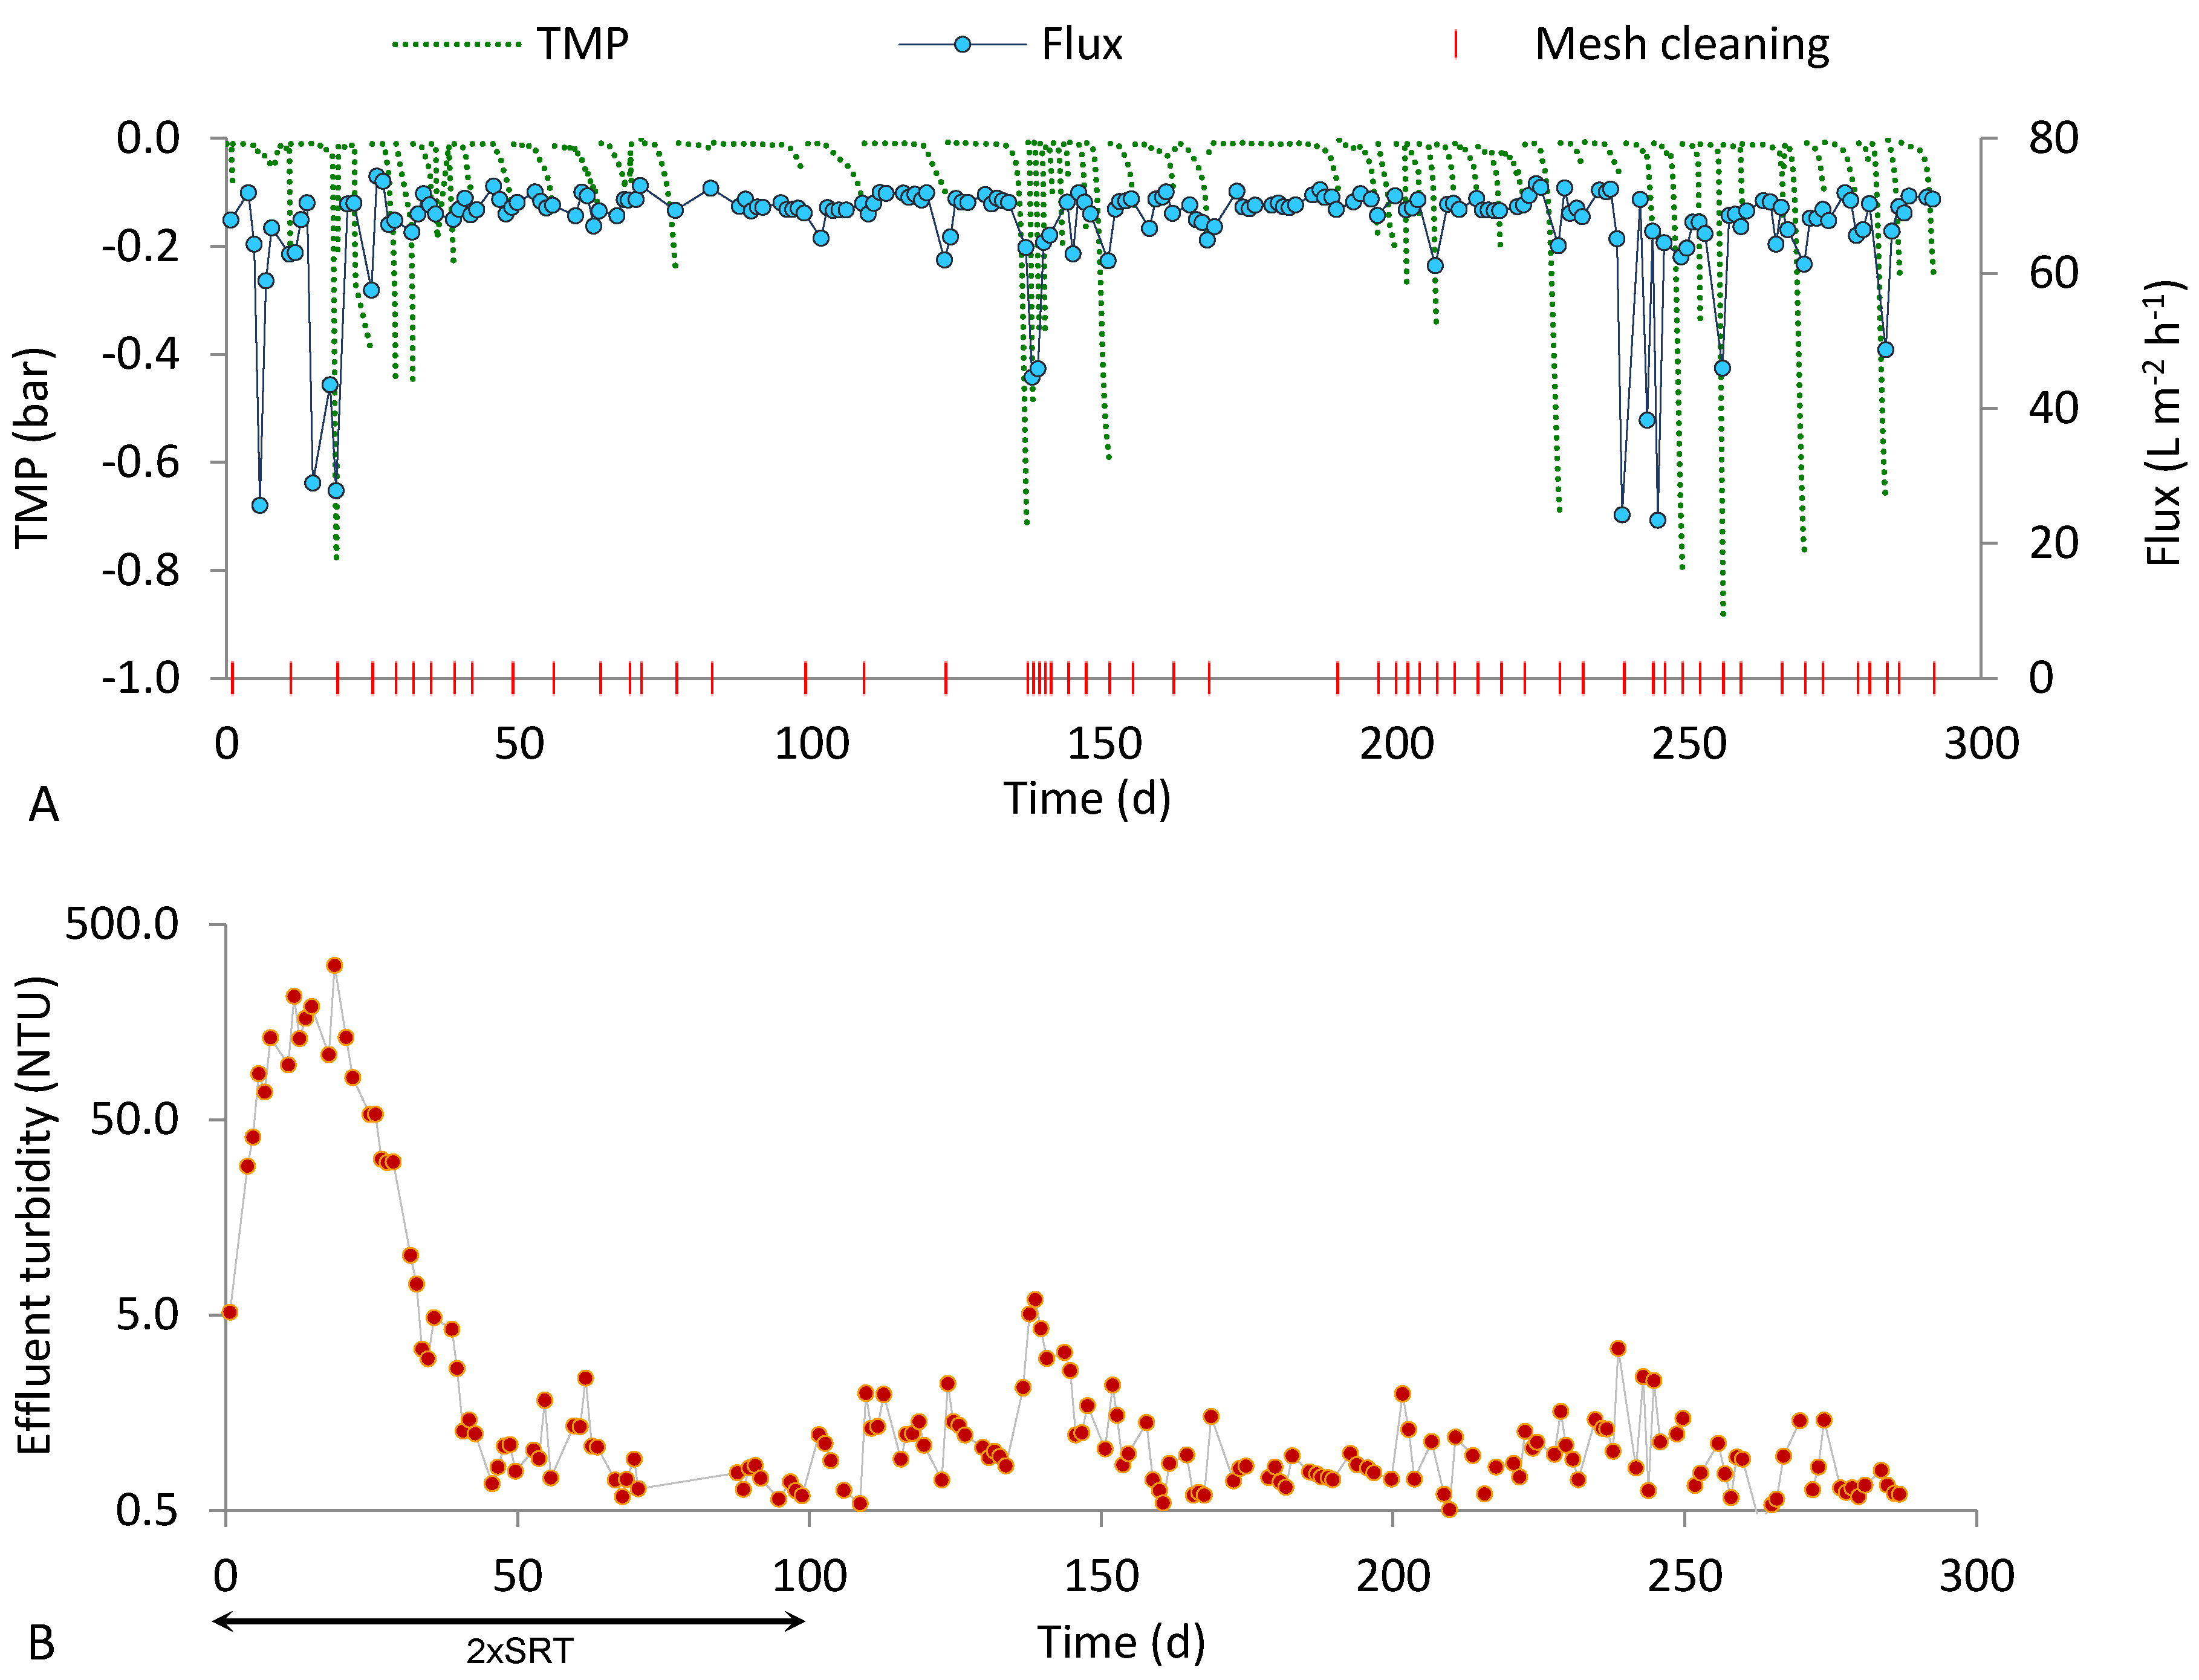
3.3. 50 D SRT
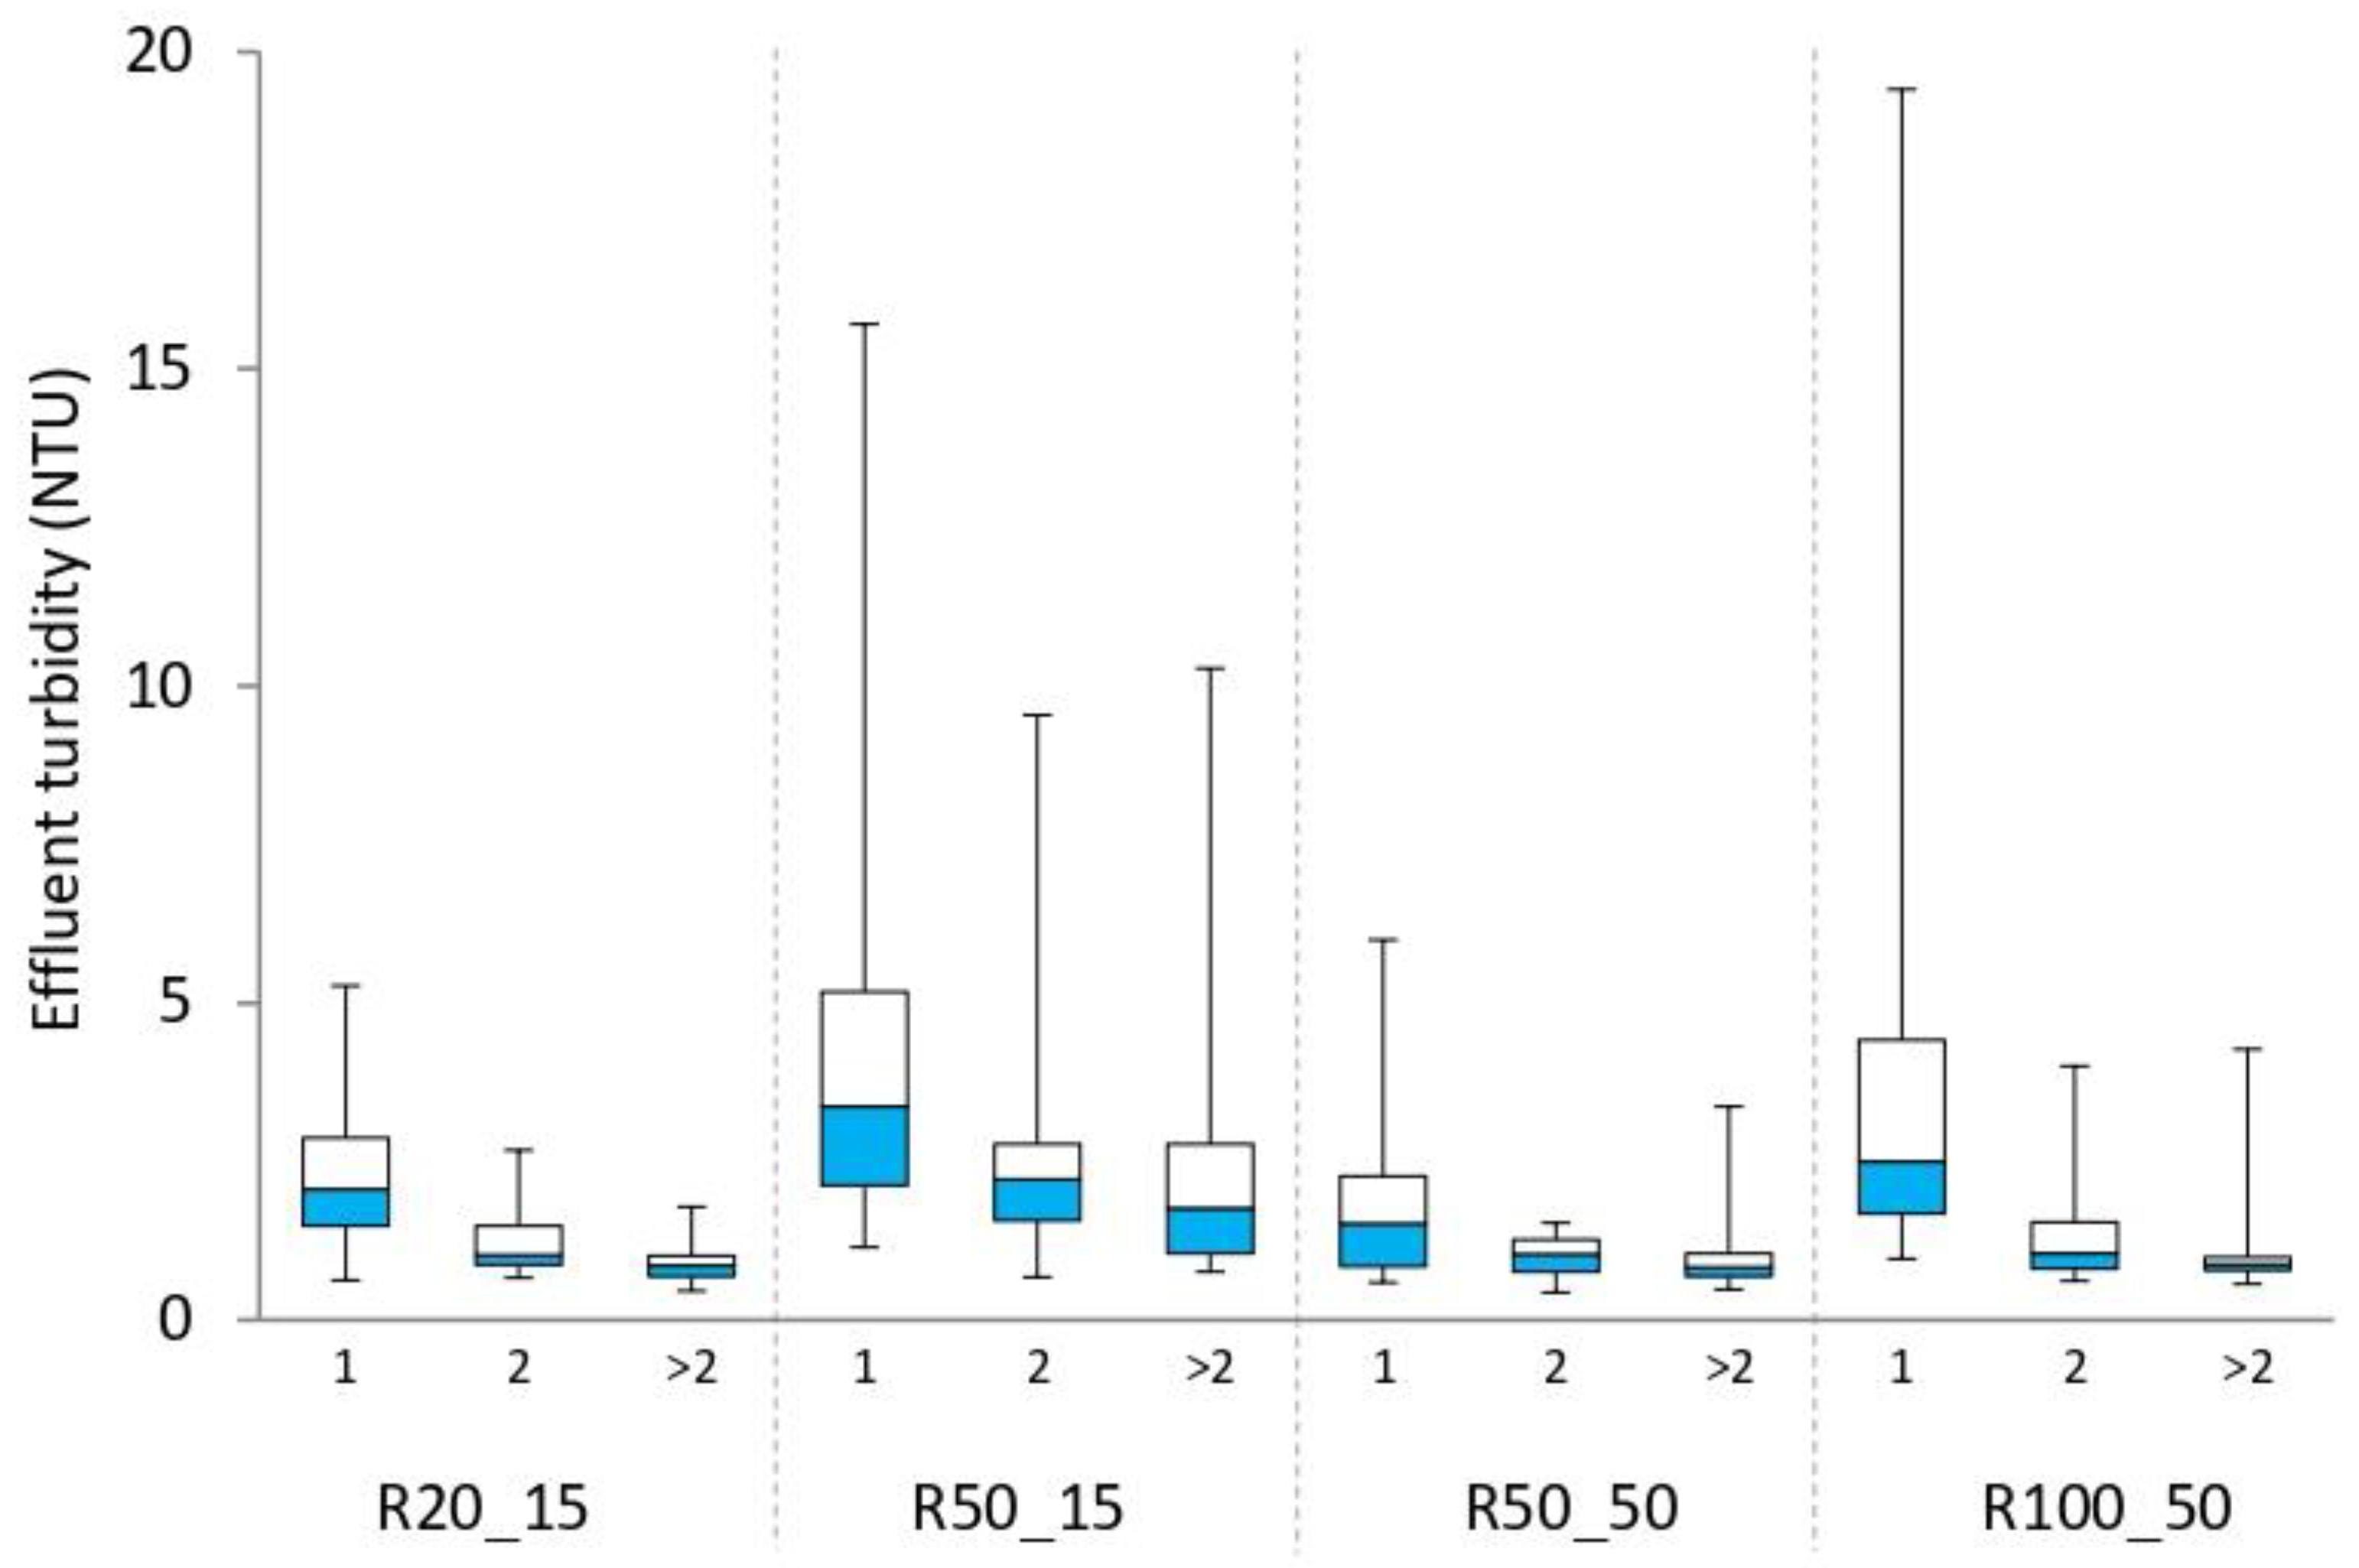
3.4. Statistical Inference
4. Discussion
5. Conclusions
Supplementary Materials
Author Contributions
Funding
Institutional Review Board Statement
Informed Consent Statement
Data Availability Statement
Acknowledgments
Conflicts of Interest
References
- Judd, S. The MBR Book; Elsevier Ltd.: Amsterdam, The Netherland, 2011. [Google Scholar]
- Xiao, L.; Liang, S.; Wang, X.; Chen, C.; Huang, X. Current state and challenges of full-scale membrane bioreactor applications: A critical review. Bioresour. Technol. 2019, 271, 476–481. [Google Scholar] [CrossRef]
- Liu, H.; Yang, C.; Pu, W.; Zhang, J. Formation mechanism and structure of dynamic membrane in the dynamic membrane bioreactor. Chem. Eng. J. 2009, 148, 290–295. [Google Scholar] [CrossRef]
- Hu, Y.; Wang, X.C.; Tian, W.; Ngo, H.H.; Chen, R. Towards stable operation of a dynamic membrane bioreactor (DMBR): Operational process, behavior and retention effect of dynamic membrane. J. Membr. Sci. 2016, 498, 20–29. [Google Scholar] [CrossRef]
- Xiong, J.; Fu, D.; Prasad Singh, R.; Ducoste, J.J. Structural characteristics and development of the cake layer in a dynamic membrane bioreactor. Sep. Purif. Technol. 2016, 167, 88–96. [Google Scholar] [CrossRef]
- Vergine, P.; Salerno, C.; Berardi, G.; Pollice, A. Sludge cake and biofilm formation as valuable tools in wastewater treatment by coupling Integrated Fixed-Film Activated Sludge (IFAS) with Self Forming Dynamic Membrane BioReactors (SFD-MBR). Bioresour. Technol. 2018, 268, 121–127. [Google Scholar] [CrossRef] [PubMed]
- Pollice, A.; Vergine, P. Self-forming dynamic membrane bioreactors (SFD MBR) for wastewater treatment: Principles and applications. In Advanced Membrane Separation Processes for Sustainable Water and Wastewater Management-Case Studies and Sustainability Analysis; Mannina, G., Pandey, A., Larroche, C., Ng, H.Y., Ngo, H.H., Eds.; Elsevier: Amsterdam, The Netherland, 2020; pp. 235–258. [Google Scholar] [CrossRef]
- Rezvani, F.; Mehrnia, M.R.; Poostchi, A.A. Optimal operating strategies of SFDM formation for MBR application. Sep. Purif. Technol. 2014, 124, 124–133. [Google Scholar] [CrossRef]
- Fakhimi, N.; Mehrnia, M.R. Control of mixing for optimal formation of dynamic membrane in MBRs. Desalin. Water Treat. 2015, 57, 15759–15771. [Google Scholar] [CrossRef]
- Salerno, C.; Vergine, P.; Berardi, G.; Pollice, A. Influence of air scouring on the performance of a Self Forming Dynamic Membrane BioReactor (SFD MBR) for municipal wastewater treatment. Bioresour. Technol. 2017, 223, 301–306. [Google Scholar] [CrossRef] [PubMed]
- Saleem, M.; Alibardi, L.; Cossu, R.; Lavagnolo, M.C.; Spagni, A. Analysis of fouling development under dynamic membrane filtration operation. Chem. Eng. J. 2017, 312, 136–143. [Google Scholar] [CrossRef]
- Saleem, M.; Spagni, A.; Alibardi, L.; Bertucco, A.; Lavagnolo, M.C. Assessment of dynamic membrane filtration for biological treatment of old landfill leachate. J. Environ. Manag. 2018, 213, 27–35. [Google Scholar] [CrossRef] [Green Version]
- Cai, D.; Huang, J.; Liu, G.; Li, M.; Yu, Y.; Meng, F. Effect of support material pore size on the filtration behavior of dynamic membrane bioreactor. Bioresour. Technol. 2018, 255, 359–363. [Google Scholar] [CrossRef]
- Ersahin, M.E.; Ozgun, H.; Tao, Y.; van Lier, J.B. Effect of Support Material Properties on Dynamic Membrane Filtration Performance. Sep. Sci. Technol. 2013, 48, 2263–2269. [Google Scholar] [CrossRef]
- Vergine, P.; Salerno, C.; Berardi, G.; Pollice, A. Self-Forming Dynamic Membrane BioReactors (SFD MBR) for municipal wastewater treatment: Relevance of solids retention time and biological process stability. Sep. Purif. Technol. 2021, 255, 117735. [Google Scholar] [CrossRef]
- American Public Health Association (APHA); American Water Works Association (AWWA); Water Environment Federation (WEF). Standard Methods for the Examination of Water and Wastewater, 21st ed.; APHA: Washington, DC, USA, 2005. [Google Scholar]
- Fan, B.; Huang, X. Characteristics of a self-forming dynamic membrane coupled with a bioreactor for municipal wastewater treatment. Environ. Sci. Technol. 2002, 36, 5245–5251. [Google Scholar] [CrossRef] [PubMed]
- Fuchs, W.; Resch, C.; Kernstock, M.; Mayer, M.; Scoeberl, P.; Braun, R. Influence of operational conditions on the performance of a mesh filter activated sludge process. Water Res. 2005, 39, 803–810. [Google Scholar] [CrossRef] [PubMed]
- Zahid, W.M.; El-Shafai, S.A. Use of cloth-media filter for membrane bioreactor treating municipal wastewater. Bioresour. Technol. 2011, 102, 2193–2198. [Google Scholar] [CrossRef] [PubMed]
- Wang, Y.K.; Sheng, G.P.; Li, W.W.; Yu, H.Q. A pilot investigation into membrane bioreactor using mesh filter for treating low-strength municipal wastewater. Bioresour. Technol. 2012, 122, 17–21. [Google Scholar] [CrossRef]
- Ozdemir, B.; Saatci, A.; Yenigun, O. Evaluation of cake filtration biological reactors (CFBR) vs. membrane biological reactors (MBR) in a pilot scale plant. Desalination 2012, 135–144. [Google Scholar] [CrossRef]
- Chu, L.; Li, S. Filtration capability and operational characteristics of dynamic membrane bioreactor for municipal wastewater treatment. Sep. Purif. Technol. 2006, 51, 173–179. [Google Scholar] [CrossRef]
- Sabaghian, M.; Mehrnia, M.R.; Esmaieli, M.; Noormohammadi, D. Formation and performance of selfforming dynamic membrane (SFDM) in membrane bioreactor (MBR) for treating low-strength wastewater. Water Sci. Technol. 2018, 78, 904–911. [Google Scholar] [CrossRef] [PubMed]
- Alavi Moghaddam, M.R.; Satoh, H.; Mino, T. Effect of important operational parameters on performance of coarse pore filtration activated sludge process. Water Sci. Technol. 2002, 46, 229–236. [Google Scholar] [CrossRef] [Green Version]
- Ahmed, Z.; Cho, J.; Lim, B.; Song, K.; Ahn, K. Effects of sludge retention time on membrane fouling and microbial community structure in a membrane bioreactor. J. Membr. Sci. 2007, 287, 211–218. [Google Scholar] [CrossRef]
- Al-Halbouni, D.; Traber, J.; Lyko, S.; Wintgens, T.; Melin, T.; Tacke, D.; Janote, A.; Dott, W.; Hollender, J. Correlation of EPS content in activated sludge at different sludge retention times with membrane fouling phenomena. Water Res. 2008, 42, 1475–1488. [Google Scholar] [CrossRef]
- Guan, D.; Dai, J.; Watanabe, Y.; Chen, G. Changes in the physical properties of the dynamic layer and its correlation with permeate quality in a self-forming dynamic membrane bioreactor. Water Res. 2018, 140, 67–76. [Google Scholar] [CrossRef]
- Vergine, P.; Salerno, C.; Berardi, G.; Pappagallo, G.; Pollice, A. The Self Forming Dynamic Membrane Bio-Reactor (SFD MBR) as a suitable technology for agro-industrial wastewater treatment. New Biotechnol. 2020, 56, 87–95. [Google Scholar] [CrossRef] [PubMed]
- Mahat, S.B.; Omar, R.; Lee, J.L.; Idris, A.I.M.; Man, H.C.; Kamal, S.M.M.; Idris, A. Effect of pore size of monofilament woven filter cloth as supporting material for dynamic membrane filtration on performance using aerobic membrane bioreactor technology. Asia-Pac. J. Chem. Eng. 2020, 15, e2453. [Google Scholar] [CrossRef]


| Parameter | 10th Percentile | Median | 90th Percentile |
|---|---|---|---|
| pH | 7.0 | 7.5 | 7.9 |
| Electrical conductivity (µS cm−1) | 1831 | 2340 | 2656 |
| Chemical oxygen demand (mgO2 L−1) | 357 | 389 | 410 |
| Total suspended solids (mg L−1) | 121 | 186 | 279 |
| Total nitrogen (mg L−1) | 46.3 | 61.5 | 71.3 |
| N–NH4+ (mg L−1) | 32.4 | 43.0 | 52.1 |
| Total phosphorus (mg L−1) | 9.1 | 12.8 | 17.2 |
| Run | Mesh Pore Size (µm) | SRT (d) | Flow Rate (*) (L d−1) | Flux (*) (L m−2 h−1) | HRT (*) (h) | VLR (*) (gCOD L−1 d−1) | Test Time (d) |
|---|---|---|---|---|---|---|---|
| R20_15 | 20 | 15 | 10.6 | 61.3 | 9.5 | 0.93 | 141 |
| R50_15 | 50 | 15 | 10.6 | 61.3 | 9.5 | 0.93 | 141 |
| R50_50 | 50 | 50 | 11.7 | 67.7 | 8.6 | 1.09 | 293 |
| R100_50 | 100 | 50 | 12.3 | 71.2 | 8.2 | 1.14 | 253 |
| Parameter | R20_15 | R50_15 | R50_50 | R100_50 |
|---|---|---|---|---|
| MLSS (g L−1) | 2.3 ± 0.6 | 2.0 ± 0.7 | 7.7 ± 0.7 | 7.4 ± 0.4 |
| Effluent COD (mgO2 L−1) | 28.7 ± 6.7 | 34.2 ± 6.8 | 24.6 ± 3.6 | 25.0 ± 8.7 |
| Effluent TSS (mg L−1) | 5.1 ± 2.7 | 9.4 ± 6.1 | 4.9 ± 1.6 | 7.0 ± 7.9 |
| Effluent turbidity (NTU) | 1.7 ± 1.0 | 4.1 ± 3.5 | 1.2 ± 0.8 | 1.8 ± 2.9 |
| Cleaning requirements (d−1) (*) | 0.39 | 0.42 | 0.20 | 0.20 |
| Compared Runs (Variables Changed) | Compared Dataset | ||||
|---|---|---|---|---|---|
| All Data | 1st Day | 2nd Day | >2 Days | ||
| 1 | R20_15 vs. R50_15 (pore size) | <0.01 | <0.01 | 0.293 | <0.01 |
| 2 | R50_50 vs. R100_50 (pore size) | 0.016 | 0.013 | 0.285 | 0.327 |
| 3 | R50_15 vs. R100_50 (pore size and SRT) | <0.01 | 0.395 | 0.025 | <0.01 |
| 4 | R20_15 vs. R50_50 (pore size and SRT) | <0.01 | 0.129 | 0.430 | 0.490 |
| 5 | R20_15 vs. R100_50 (pore size and SRT) | 0.046 | 0.180 | 0.897 | 0.184 |
| Pore Size (µm) | Sludge | Test Type | Influence on Productivity (Pressure and/or Flux Measures) | Influence on Effluent Quality (Turbidity or TSS) | Reference |
|---|---|---|---|---|---|
| 10, 40 | Anaerobic | Short filtration test (1–2 h) | 3 different materials were tested. Significant differences only in one case | Not studied | [14] |
| 10, 52, 85, 200 | Anaerobic | Short filtration test (5 h) | No significant differences (p-value > 0.05) | No significant differences (p-value > 0.05) | [11] |
| 10, 52, 85, 200 | Anoxic-aerobic | Long-term operation (120 d) | Lower productivity at smaller pore size | Lower quality at larger pore size | [12] |
| 1, 5, 10, 25, 50 | Aerobic | Short filtration test (70 h) | Significantly lower productivity only with 1 and 5 µm | Significantly lower quality for 25 and 50 µm | [13] |
| 5, 10, 25 | Aerobic | Long-term operation (120 d) | Lower productivity at smaller pore size | No significant differences | [13] |
| 20, 40, 60 | Aerobic | Short-term operation (4 d) | No significant differences | Lower quality at bigger pore size | [29] |
| 20, 50 | Aerobic | Long-term operation (60 d) | Lower productivity at smaller pore size | 3 different air scouring rates were tested. Significant differences (p-value < 0.05) in 2 cases | [10] |
| 20, 50, 100 | Aerobic | Long-term operation (141–293 d) | No significant differences | Lower quality at larger pore size | This study |
Publisher’s Note: MDPI stays neutral with regard to jurisdictional claims in published maps and institutional affiliations. |
© 2021 by the authors. Licensee MDPI, Basel, Switzerland. This article is an open access article distributed under the terms and conditions of the Creative Commons Attribution (CC BY) license (http://creativecommons.org/licenses/by/4.0/).
Share and Cite
Vergine, P.; Salerno, C.; Casale, B.; Berardi, G.; Pollice, A. Role of Mesh Pore Size in Dynamic Membrane Bioreactors. Int. J. Environ. Res. Public Health 2021, 18, 1472. https://0-doi-org.brum.beds.ac.uk/10.3390/ijerph18041472
Vergine P, Salerno C, Casale B, Berardi G, Pollice A. Role of Mesh Pore Size in Dynamic Membrane Bioreactors. International Journal of Environmental Research and Public Health. 2021; 18(4):1472. https://0-doi-org.brum.beds.ac.uk/10.3390/ijerph18041472
Chicago/Turabian StyleVergine, Pompilio, Carlo Salerno, Barbara Casale, Giovanni Berardi, and Alfieri Pollice. 2021. "Role of Mesh Pore Size in Dynamic Membrane Bioreactors" International Journal of Environmental Research and Public Health 18, no. 4: 1472. https://0-doi-org.brum.beds.ac.uk/10.3390/ijerph18041472