
Is There a Relationship between the Morphology of Connective Tissue and Reactivity during a Drop Jump? Influence of Sex and Athletic Performance Level


 ,
,  ,
,  and
and 
Abstract
:1. Introduction
2. Materials and Methods
Subjects
3. Procedures
4. Materials and Testing
4.1. RSI
4.2. Ultrasound Measurements
5. Statistical Analysis
6. Results
7. Discussion
8. Conclusions
Author Contributions
Funding
Institutional Review Board Statement
Informed Consent Statement
Data Availability Statement
Conflicts of Interest
References
- Kubo, K.; Tabata, T.; Ikebukuro, T.; Igarashi, K.; Yata, H.; Tsunoda, N. Effects of mechanical properties of muscle and tendon on performance in long distance runners. Eur. J. Appl. Physiol. 2010, 110, 507–514. [Google Scholar] [CrossRef]
- Reeves, N.D. Adaptation of the tendon to mechanical usage. J. Musculoskelet. Neuronal Interact. 2006, 6, 174–180. [Google Scholar] [PubMed]
- Murtagh, C.F.; Stubbs, M.; Vanrenterghem, J.; O’Boyle, A.; Morgans, R.; Drust, B.; Erskine, R.M. Patellar tendon properties distinguish elite from non-elite soccer players and are related to peak horizontal but not vertical power. Eur. J. Appl. Physiol. 2018, 118, 1737–1749. [Google Scholar] [CrossRef] [PubMed] [Green Version]
- Monte, A.; Zamparo, P. Correlations between muscle-tendon parameters and acceleration ability in 20 m sprints. PLoS ONE 2019, 14, e0213347. [Google Scholar] [CrossRef] [Green Version]
- Gruber, M.; Kramer, A.; Mulder, E.; Rittweger, J. The Importance of Impact Loading and the Stretch Shortening Cycle for Spaceflight Countermeasures. Front. Physiol. 2019, 10, 311. [Google Scholar] [CrossRef] [Green Version]
- Vogt, M.; Hoppeler, H.H. Eccentric exercise: Mechanisms and effects when used as training regime or training adjunct. J. Appl. Physiol. 2014, 116, 1446–1454. [Google Scholar] [CrossRef] [Green Version]
- Komi, P.V. Stretch-shortening cycle: A powerful model to study normal and fatigued muscle. J. Biomech. 2000, 33, 1197–1206. [Google Scholar] [CrossRef] [Green Version]
- Blickhan, R. The spring-mass model for running and hopping. J. Biomech. 1989, 22, 1217–1227. [Google Scholar] [CrossRef]
- McMahon, T.A.; Cheng, G.C. The mechanics of running: How does stiffness couple with speed? J. Biomech. 1990, 23 (Suppl. 1), 65–78. [Google Scholar] [CrossRef]
- Kipp, K.; Kiely, M.T.; Geiser, C.F. Reactive Strength Index Modified Is a Valid Measure of Explosiveness in Collegiate Female Volleyball Players. J. Strength Cond. Res. 2016, 30, 1341–1347. [Google Scholar] [CrossRef] [PubMed] [Green Version]
- Beattie, K.; Carson, B.P.; Lyons, M.; Kenny, I.C. The relationship between maximal strength and reactive strength. Int. J. Sports Physiol. Perform. 2017, 12, 548–553. [Google Scholar] [CrossRef]
- Davies, G.; Riemann, B.L.; Manske, R. Current Concepts of Plyometric Exercise. Int. J. Sports Phys. Ther. 2015, 10, 760–786. [Google Scholar] [PubMed]
- Snyder, B.W.; Munford, S.N.; Connaboy, C.; Lamont, H.S.; Davis, S.E.; Moir, G.L. Assessing Plyometric Ability during Vertical Jumps Performed by Adults and Adolescents. Sports 2018, 6, 132. [Google Scholar] [CrossRef] [Green Version]
- Suchomel, T.J.; Sole, C.J.; Bailey, C.A.; Grazer, J.L.; Beckham, G.K. A comparison of reactive strength index-modified between six US collegiate athletic teams. J. Strength Cond. Res. 2015, 29, 1310–1316. [Google Scholar] [CrossRef] [PubMed] [Green Version]
- Sole, C.; Suchomel, T.; Stone, M. Preliminary Scale of Reference Values for Evaluating Reactive Strength Index-Modified in Male and Female NCAA Division I Athletes. Sports 2018, 6, 133. [Google Scholar] [CrossRef] [Green Version]
- Intziegianni, K.; Cassel, M.; Hain, G.; Mayer, F. Gender Differences of Achilles tendon Cross-sectional Area during Loading. Sports Med. Int. Open 2017, 1, E135–E140. [Google Scholar] [CrossRef] [PubMed] [Green Version]
- Kudron, C.; Carlson, M.J.; Meron, A.; Sridhar, B.; Brakke Holman, R. Using Ultrasound Measurement of the Achilles Tendon in Asymptomatic Runners to Assist in Predicting Tendinopathy. J. Ultrasound Med. 2020, 39, 491–496. [Google Scholar] [CrossRef]
- Kubo, K.; Miyazaki, D.; Yamada, K.; Yata, H.; Shimoju, S.; Tsunoda, N. Passive and active muscle stiffness in plantar flexors of long distance runners. J. Biomech. 2015, 48, 1937–1943. [Google Scholar] [CrossRef] [PubMed]
- Magnusson, S.P.; Kjaer, M. Region-specific differences in Achilles tendon cross-sectional area in runners and non-runners. Eur. J. Appl. Physiol. 2003, 90, 549–553. [Google Scholar] [CrossRef]
- Piercy, K.L.; Troiano, R.P.; Ballard, R.M.; Carlson, S.A.; Fulton, J.E.; Galuska, D.A.; George, S.M.; Olson, R.D. The Physical Activity Guidelines for Americans. JAMA 2018, 320, 2020–2028. [Google Scholar] [CrossRef] [PubMed]
- Cormack, S.J.; Newton, R.U.; McGuigan, M.R.; Doyle, T.L. Reliability of measures obtained during single and repeated countermovement jumps. Int. J. Sports Physiol. Perform. 2008, 3, 131–144. [Google Scholar] [CrossRef] [PubMed] [Green Version]
- Glatthorn, J.F.; Gouge, S.; Nussbaumer, S.; Stauffacher, S.; Impellizzeri, F.M.; Maffiuletti, N.A. Validity and reliability of Optojump photoelectric cells for estimating vertical jump height. J. Strength Cond. Res. 2011, 25, 556–560. [Google Scholar] [CrossRef]
- Markwick, W.J.; Bird, S.P.; Tufano, J.J.; Seitz, L.B.; Haff, G.G. The intraday reliability of the reactive strength index calculated from a drop jump in professional men’s basketball. Int. J. Sports Physiol. Perform. 2015, 10, 482–488. [Google Scholar] [CrossRef]
- Young, W.B.; Pryor, J.F.; Wilson, G.J. Countermovement and Drop Jump Performance. J. Strength Cond. Res. 1995, 9, 232–236. [Google Scholar]
- Del Bano-Aledo, M.E.; Martinez-Paya, J.J.; Rios-Diaz, J.; Mejias-Suarez, S.; Serrano-Carmona, S.; de Groot-Ferrando, A. Ultrasound measures of tendon thickness: Intra-rater, Inter-rater and Inter-machine reliability. Muscles Ligaments Tendons J. 2017, 7, 192–199. [Google Scholar] [CrossRef] [PubMed] [Green Version]
- Kernozek, T.W.; Knaus, A.; Rademaker, T.; Almonroeder, T.G. The effects of habitual foot strike patterns on Achilles tendon loading in female runners. Gait Posture 2018, 66, 283–287. [Google Scholar] [CrossRef]
- Rosager, S.; Aagaard, P.; Dyhre-Poulsen, P.; Neergaard, K.; Kjaer, M.; Magnusson, S.P. Load-displacement properties of the human triceps surae aponeurosis and tendon in runners and non-runners. Scand. J. Med. Sci. Sports 2002, 12, 90–98. [Google Scholar] [CrossRef] [PubMed]
- Koo, T.K.; Li, M.Y. A Guideline of Selecting and Reporting Intraclass Correlation Coefficients for Reliability Research. J. Chiropr. Med. 2016, 15, 155–163. [Google Scholar] [CrossRef] [Green Version]
- Hopkins, W.G.; Marshall, S.W.; Batterham, A.M.; Hanin, J. Progressive statistics for studies in sports medicine and exercise science. Med. Sci. Sports Exerc. 2009, 41, 3–13. [Google Scholar] [CrossRef] [Green Version]
- Cohen, J. Statistical Power Analysis for the Behavioral Sciences; Academic Press: Cambridge, MA, USA, 1988. [Google Scholar]
- Earp, J.E.; Kraemer, W.J.; Cormie, P.; Volek, J.S.; Maresh, C.M.; Joseph, M.; Newton, R.U. Influence of muscle-tendon unit structure on rate of force development during the squat, countermovement, and drop jumps. J. Strength Cond Res. 2011, 25, 340–347. [Google Scholar] [CrossRef]
- Zellers, J.A.; Pohlig, R.T.; Cortes, D.H.; Gravare Silbernagel, K. Achilles tendon cross-sectional area at 12 weeks post-rupture relates to 1-year heel-rise height. Knee Surg. Sports Traumatol. Arthrosc. 2020, 28, 245–252. [Google Scholar] [CrossRef]
- Kubo, K.; Kawakami, Y.; Fukunaga, T. Influence of elastic properties of tendon structures on jump performance in humans. J. Appl. Physiol. 1999, 87, 2090–2096. [Google Scholar] [CrossRef] [PubMed]
- Kongsgaard, M.; Aagaard, P.; Kjaer, M.; Magnusson, S.P. Structural Achilles tendon properties in athletes subjected to different exercise modes and in Achilles tendon rupture patients. J. Appl. Physiol. 2005, 99, 1965–1971. [Google Scholar] [CrossRef] [Green Version]
- Hansen, M.; Kjaer, M. Sex Hormones and Tendon. Adv. Exp. Med. Biol. 2016, 920, 139–149. [Google Scholar] [CrossRef]


| Men (n = 30) | ||
| RSI20 | RSI30 | |
| PT-thickness | −0.050 | −0.233 |
| PT-CSA | −0.203 | −0.475 * |
| AT-thickness | −0.053 | −0.114 |
| AT-CSA | 0.111 | 0.079 |
| PF-thickness | 0.140 | 0.160 |
| Women (n = 14) | ||
| RSI20 | RSI30 | |
| PT-thickness | −0.240 | −0.224 |
| PT-CSA | −0.373 | −0.300 |
| AT-thickness | 0.143 | 0.080 |
| AT-CSA | 0.395 | 0.283 |
| PF-thickness | 0.375 | 0.421 |
| Variable | All (n = 44) | Sex | p-Value (ES) | ES | |
|---|---|---|---|---|---|
| Men (n = 30) | Women (n = 14) | ||||
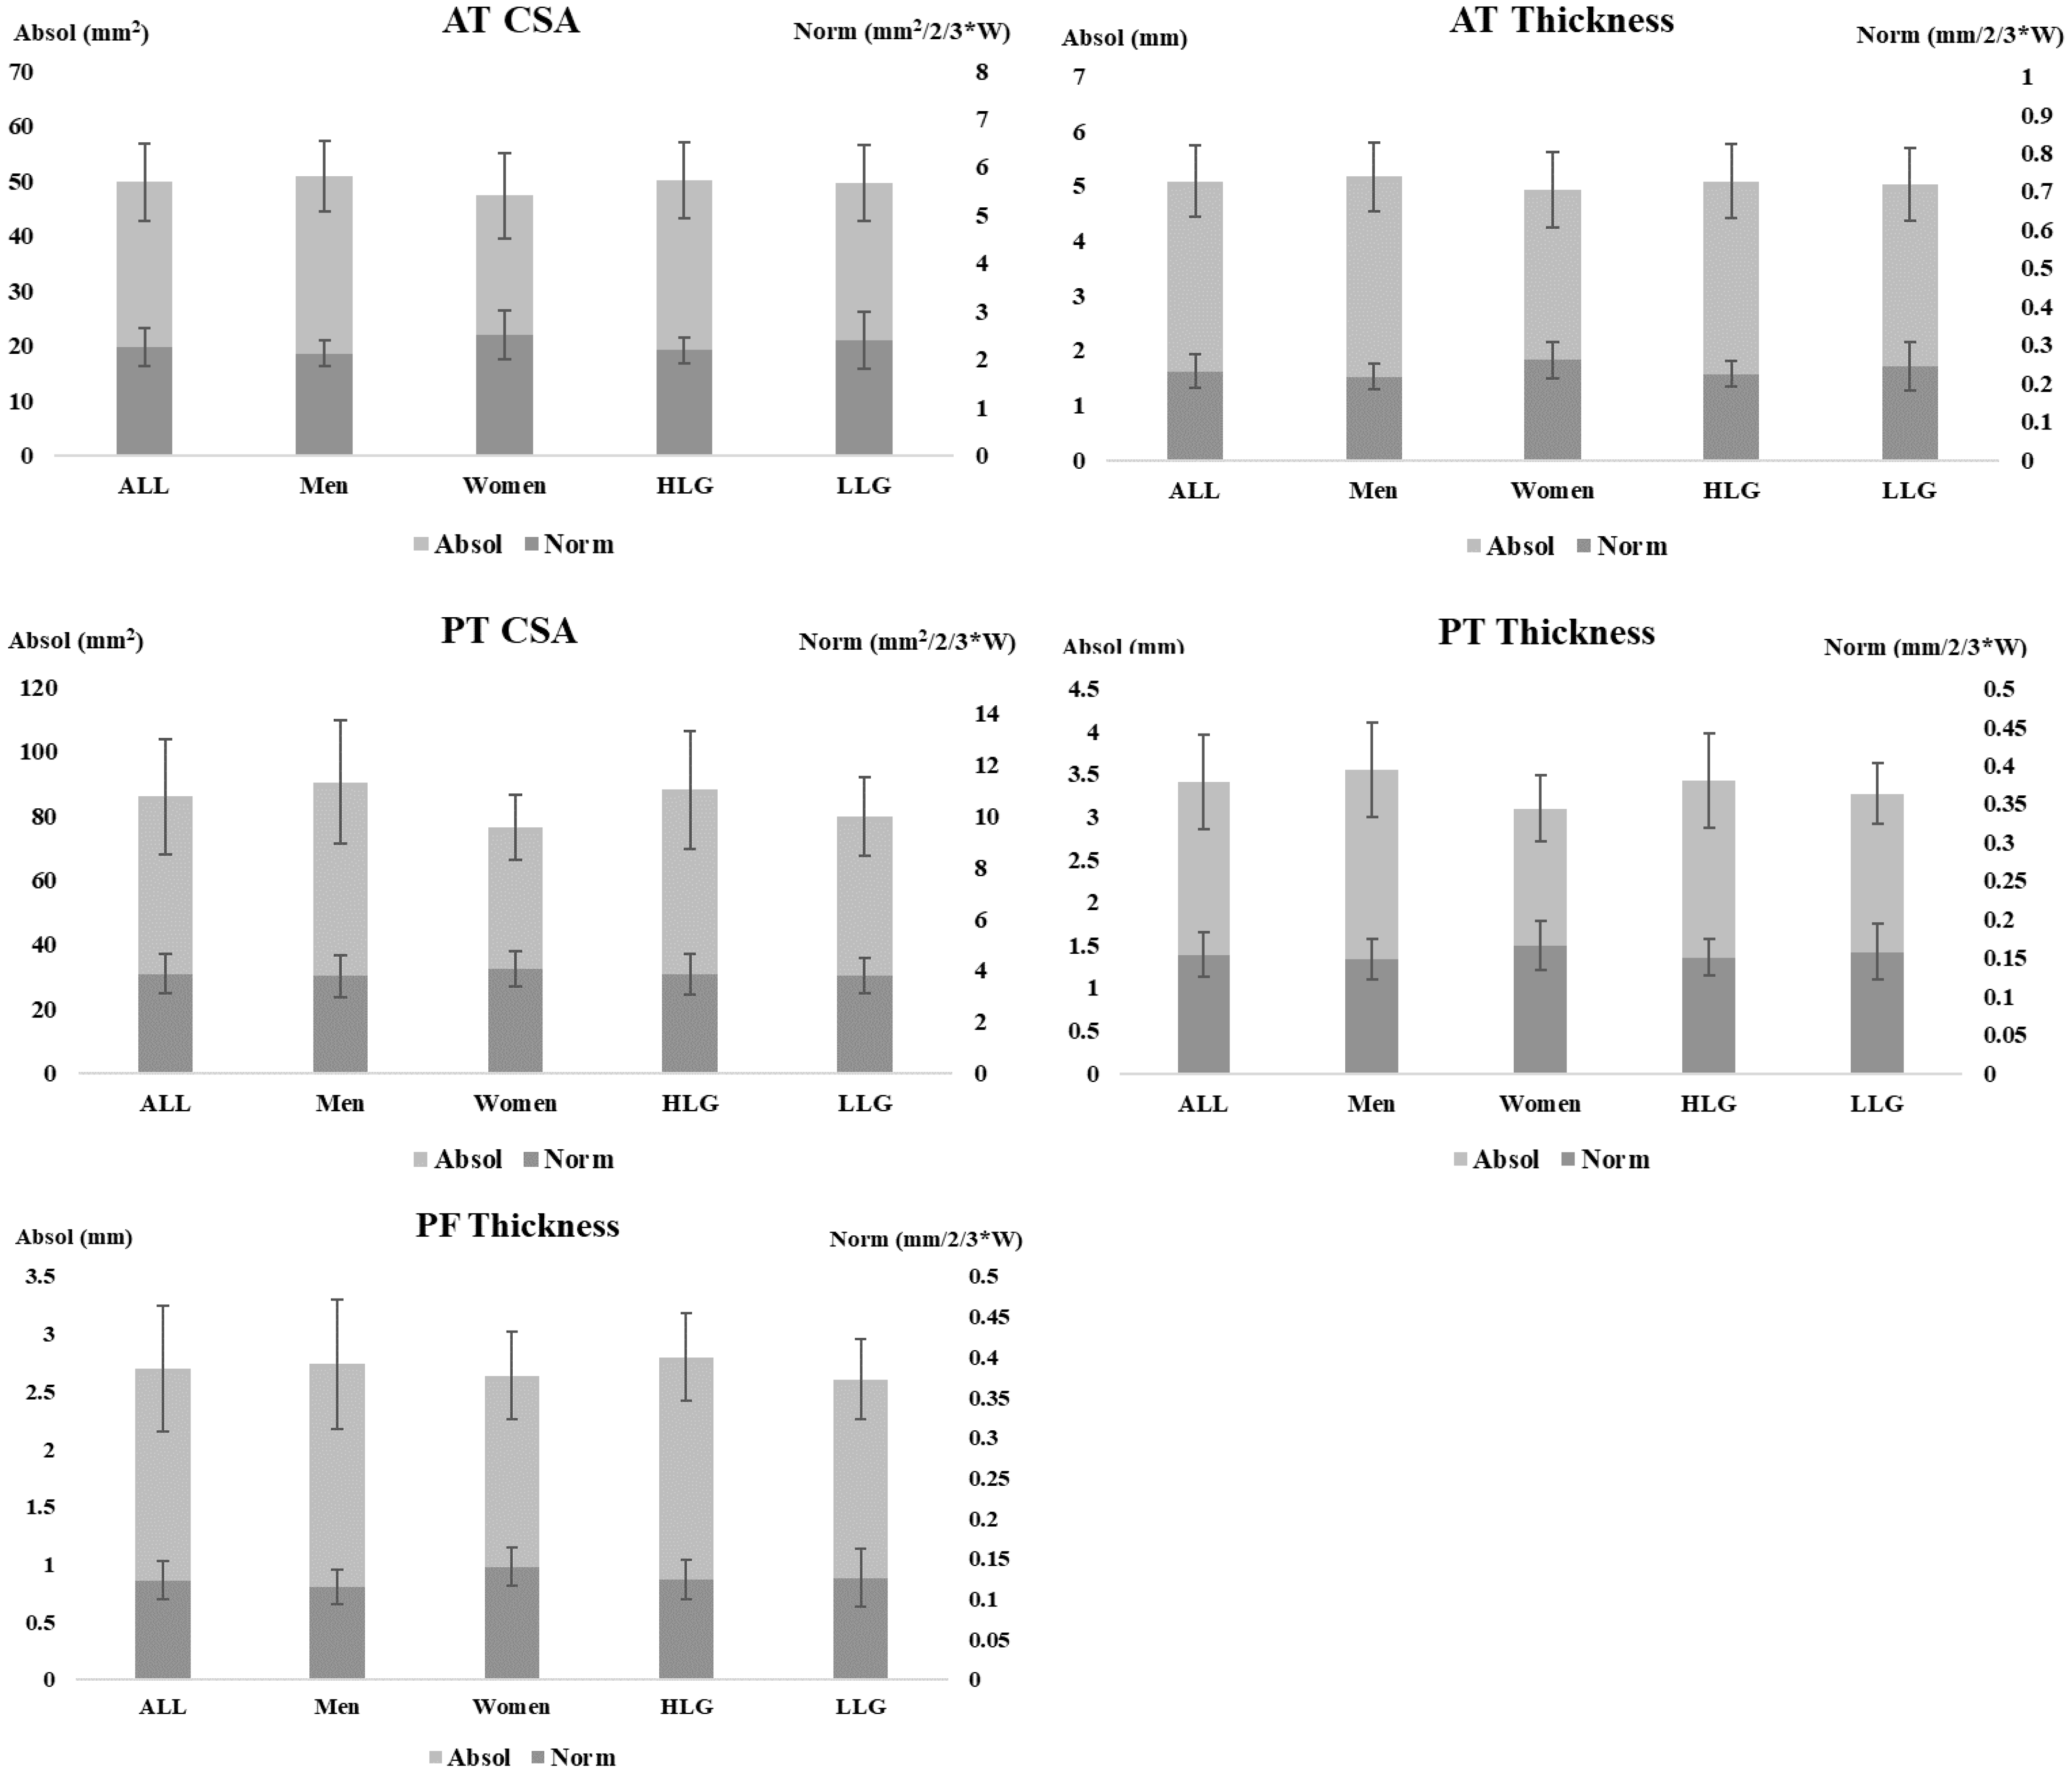
| Connective tissue | |||||
| PT-thickness | 0.154 (0.029) | 0.149 (0.026) | 0.166 (0.032) | 0.065 (0.62) | 0.58 |
| PT-CSA | 3.869 (0.772) | 3.782 (0.805) | 4.054 (0.687) | 0.282 (0.59) | 0.36 |
| AT-thickness | 0.232 (0.043) | 0.218 (0.034) | 0.261 (0.047) | 0.001 (1.09) | 1.04 |
| AT-CSA | 2.253 (0.397) | 2.132 (0.260) | 2.511 (0.513) | 0.002 (1.16) | 0.93 |
| PF-thickness | 0.123 (0.024) | 0.115 (0.022) | 0.140 (0.025) | 0.001 (0.87) | 1.06 |
| Drop jump performance parameters | |||||
| DJ20 (cm) | 24.25 (5.85) | 26.26 (5.72) | 20.09 (3.48) | <0.001 (1.24) | 1.30 |
| RSI20 | 1.96 (0.52) | 2.13 (0.48) | 1.59 (0.41) | <0.001 (1.17) | 1.21 |
| DJ30 (cm) | 26.07 (6.30) | 28.25 (6.23) | 21.57 (3.48) | <0.001 (1.26) | 1.32 |
| RSI30 | 2.11 (0.53) | 2.29 (0.47) | 1.74 (0.46) | <0.001 (1.38) | 1.18 |
| Variable | All (n = 44) | Athletic Performance | p-Value (ES) | ES | |
|---|---|---|---|---|---|
| HLG (n = 24) | LLG (n = 20) | ||||
| Connective tissue | |||||
| PT-thickness | 0.154 (0.029) | 0.151 (0.024) | 0.158 (0.036) | 0.853 (0.62) | 0.23 |
| PT-CSA | 3.869 (0.772) | 3.866 (0.793) | 3.800 (0.700) | 0.342 (0.67) | 0.09 |
| AT-thickness | 0.232 (0.043) | 0.224 (0.033) | 0.244 (0.064) | 0.909 (0.31) | 0.39 |
| AT-CSA | 2.253 (0.397) | 2.198 (0.265) | 2.392 (0.588) | 0.834 (0.55) | 0.43 |
| PF-thickness | 0.123 (0.024) | 0.124 (0.022) | 0.126 (0.024) | 0.164 (0.38) | 0.09 |
| Drop jump performance parameters | |||||
| DJ20 (cm) | 24.25 (5.85) | 24.09 (5.66) | 23.07 (5.63) | 0.547 (0.16) | 0.18 |
| RSI20 | 1.96 (0.52) | 2.04 (0.49) | 1.74 (0.49) | 0.288 (0.41) | 0.61 |
| DJ30 (cm) | 26.07 (6.30) | 25.91 (5.91) | 24.68 (5.67) | 0.592 (0.24) | 0.21 |
| RSI30 | 2.11 (0.53) | 2.21 (0.56) | 1.93 (0.48) | 0.465 (0.33) | 0.54 |
Publisher’s Note: MDPI stays neutral with regard to jurisdictional claims in published maps and institutional affiliations. |
© 2021 by the authors. Licensee MDPI, Basel, Switzerland. This article is an open access article distributed under the terms and conditions of the Creative Commons Attribution (CC BY) license (http://creativecommons.org/licenses/by/4.0/).
Share and Cite
Rubio-Peirotén, A.; García-Pinillos, F.; Jaén-Carrillo, D.; Cartón-Llorente, A.; Roche-Seruendo, L.E. Is There a Relationship between the Morphology of Connective Tissue and Reactivity during a Drop Jump? Influence of Sex and Athletic Performance Level. Int. J. Environ. Res. Public Health 2021, 18, 1969. https://0-doi-org.brum.beds.ac.uk/10.3390/ijerph18041969
Rubio-Peirotén A, García-Pinillos F, Jaén-Carrillo D, Cartón-Llorente A, Roche-Seruendo LE. Is There a Relationship between the Morphology of Connective Tissue and Reactivity during a Drop Jump? Influence of Sex and Athletic Performance Level. International Journal of Environmental Research and Public Health. 2021; 18(4):1969. https://0-doi-org.brum.beds.ac.uk/10.3390/ijerph18041969
Chicago/Turabian StyleRubio-Peirotén, Alberto, Felipe García-Pinillos, Diego Jaén-Carrillo, Antonio Cartón-Llorente, and Luis E. Roche-Seruendo. 2021. "Is There a Relationship between the Morphology of Connective Tissue and Reactivity during a Drop Jump? Influence of Sex and Athletic Performance Level" International Journal of Environmental Research and Public Health 18, no. 4: 1969. https://0-doi-org.brum.beds.ac.uk/10.3390/ijerph18041969