
Associations between Prenatal Exposure to Phthalates and Timing of Menarche and Growth and Adiposity into Adulthood: A Twenty-Years Birth Cohort Study

 , , , ,
Abstract
:1. Introduction
2. Materials and Methods
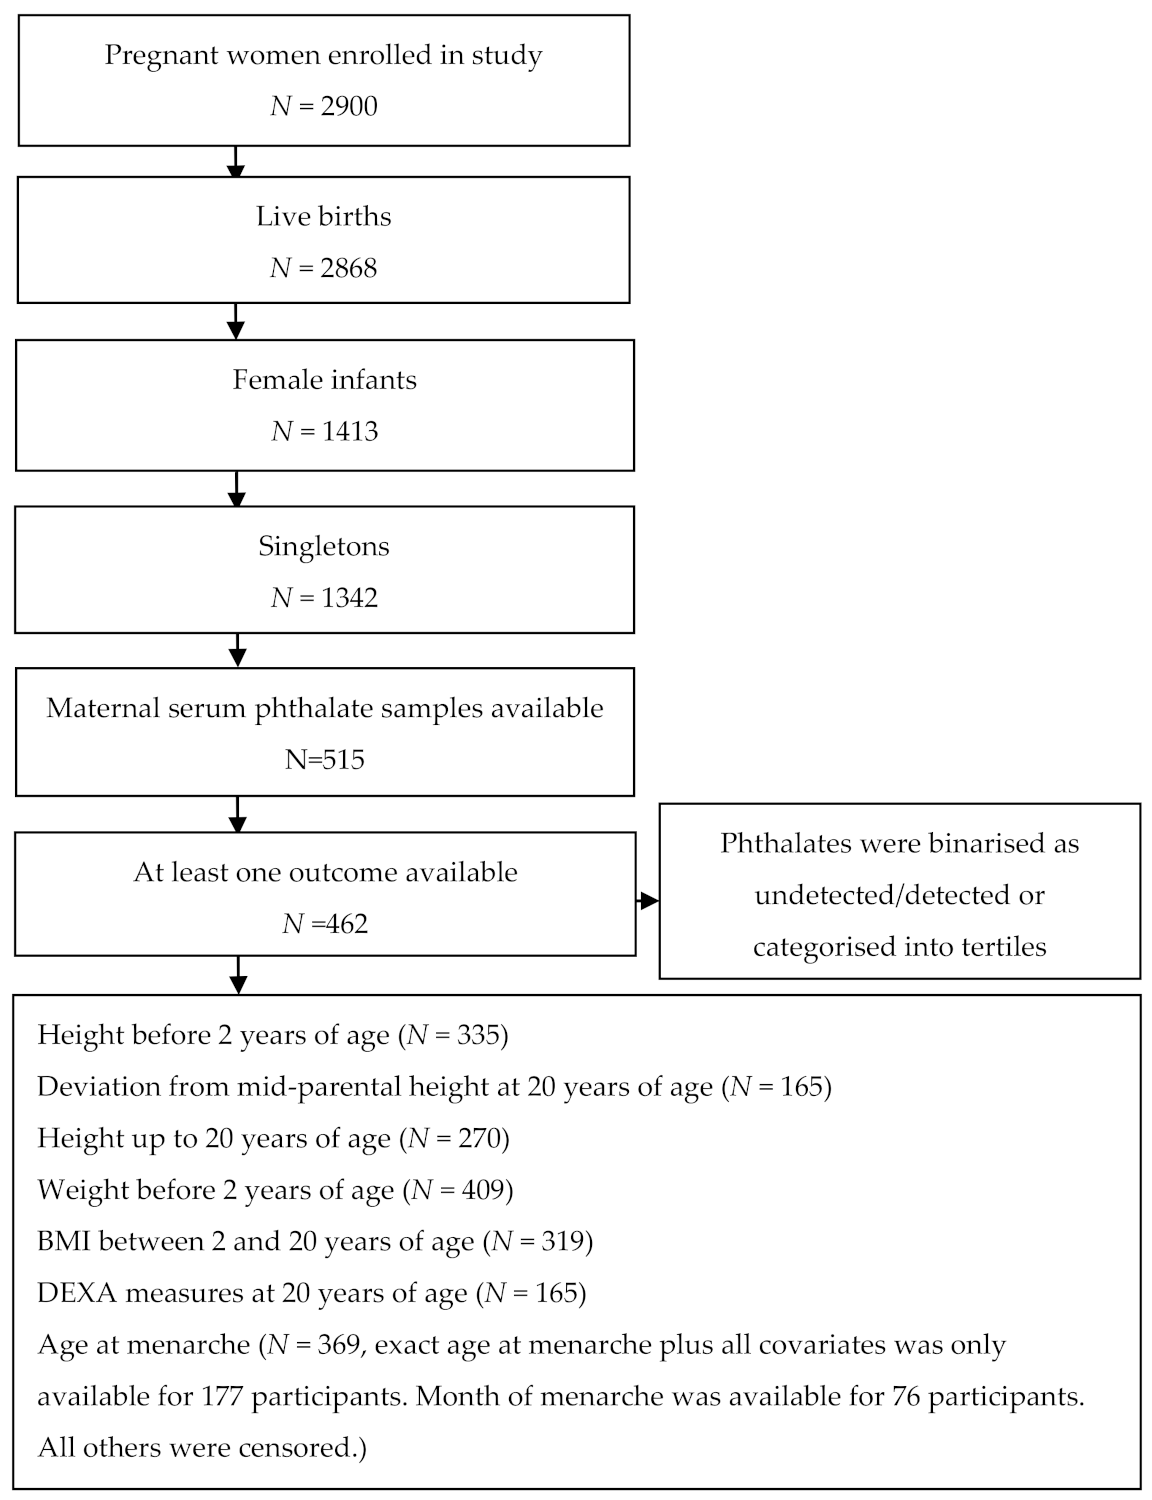
2.1. Study Population
2.2. Management of Stored Maternal Blood Samples
2.3. Phthalate Measurements
2.4. Categorisation of Phthalates
2.5. Statistical Analysis
2.6. Ethical Approval
3. Results
3.1. Age at Menarche
3.2. Height before Two Years of Age
3.3. Height up to 20 Years of Age
3.4. Deviation from Midparental Height at 20 Years of Age
3.5. Weight before Two Years of Age
3.6. BMI between Two and Twenty Years of Age
3.7. DEXA Measures of Body Composition at 20 Years of Age
4. Discussion
Limitations
5. Conclusions
Supplementary Materials
Author Contributions
Funding
Institutional Review Board Statement
Informed Consent Statement
Data Availability Statement
Acknowledgments
Conflicts of Interest
References
- Gore, A.C.; Chappell, V.A.; Fenton, S.E.; Flaws, J.A.; Nadal, A.; Prins, G.S.; Toppari, J.; Zoeller, R.T. EDC-2: The Endocrine Society’s Second Scientific Statement on Endocrine-Disrupting Chemicals. Endocr. Rev. 2015, 36, E1–E150. [Google Scholar] [CrossRef] [PubMed]
- Katsikantami, I.; Sifakis, S.; Tzatzarakis, M.N.; Vakonaki, E.; Kalantzi, O.I.; Tsatsakis, A.M.; Rizos, A.K. A global assessment of phthalates burden and related links to health effects. Environ. Int. 2016, 97, 212–236. [Google Scholar] [CrossRef] [PubMed]
- Centers for Disease Control and Prevention. Fourth Report on Human Exposure to Environmental Chemicals; National Center for Environmental Health: Atlanta, GA, USA, 2019. [Google Scholar]
- Henriksen, L.S.; Mathiesen, B.K.; Assens, M.; Krause, M.; Skakkebaek, N.E.; Juul, A.; Andersson, A.M.; Hart, R.J.; Newnham, J.P.; Keelan, J.A.; et al. Use of stored serum in the study of time trends and geographical differences in exposure of pregnant women to phthalates. Environ. Res. 2020, 184, 109231. [Google Scholar] [CrossRef] [PubMed]
- Janjua, N.R.; Frederiksen, H.; Skakkebaek, N.E.; Wulf, H.C.; Andersson, A.M. Urinary excretion of phthalates and paraben after repeated whole-body topical application in humans. Int. J. Androl. 2008, 31, 118–130. [Google Scholar] [CrossRef] [PubMed]
- Hsu, N.Y.; Lee, C.C.; Wang, J.Y.; Li, Y.C.; Chang, H.W.; Chen, C.Y.; Bornehag, C.G.; Wu, P.C.; Sundell, J.; Su, H.J. Predicted risk of childhood allergy, asthma, and reported symptoms using measured phthalate exposure in dust and urine. Indoor Air 2012, 22, 186–199. [Google Scholar] [CrossRef] [PubMed]
- Adibi, J.J.; Whyatt, R.M.; Hauser, R.; Bhat, H.K.; Davis, B.J.; Calafat, A.M.; Hoepner, L.A.; Perera, F.P.; Tang, D.; Williams, P.L. Transcriptional biomarkers of steroidogenesis and trophoblast differentiation in the placenta in relation to prenatal phthalate exposure. Environ. Health Perspect. 2010, 118, 291–296. [Google Scholar] [CrossRef] [PubMed]
- Mose, T.; Mortensen, G.K.; Hedegaard, M.; Knudsen, L.E. Phthalate monoesters in perfusate from a dual placenta perfusion system, the placenta tissue and umbilical cord blood. Reprod. Toxicol. 2007, 23, 83–91. [Google Scholar] [CrossRef]
- Frederiksen, H.; Skakkebaek, N.E.; Andersson, A.M. Metabolism of phthalates in humans. Mol. Nutr. Food Res. 2007, 51, 899–911. [Google Scholar] [CrossRef]
- Kortenkamp, A. Ten years of mixing cocktails: A review of combination effects of endocrine-disrupting chemicals. Environ. Health Perspect. 2007, 115, 98–105. [Google Scholar] [CrossRef] [Green Version]
- Berman, Y.E.; Doherty, D.A.; Main, K.M.; Frederiksen, H.; Keelan, J.A.; Newnham, J.P.; Hart, R.J. The influence of prenatal exposure to phthalates on subsequent male growth and body composition in adolescence. Environ. Res. 2020, 110313. [Google Scholar] [CrossRef]
- Holmgren, A.; Niklasson, A.; Aronson, A.S.; Sjoberg, A.; Lissner, L.; Albertsson-Wikland, K. Nordic populations are still getting taller-secular changes in height from the 20th to 21st century. Acta Paediatr. 2019, 108, 1311–1320. [Google Scholar] [CrossRef] [Green Version]
- Finucane, M.M.; Stevens, G.A.; Cowan, M.J.; Danaei, G.; Lin, J.K.; Paciorek, C.J.; Singh, G.M.; Gutierrez, H.R.; Lu, Y.; Bahalim, A.N.; et al. National, regional, and global trends in body-mass index since 1980: Systematic analysis of health examination surveys and epidemiological studies with 960 country-years and 9.1 million participants. Lancet 2011, 377, 557–567. [Google Scholar] [CrossRef] [Green Version]
- World Health Organisation. Available online: https://www.who.int/news-room/fact-sheets/detail/obesity-and-overweight (accessed on 17 March 2021).
- Wabitsch, M.; Moss, A.; Kromeyer-Hauschild, K. Unexpected plateauing of childhood obesity rates in developed countries. BMC Med. 2014, 12, 17. [Google Scholar] [CrossRef] [Green Version]
- Faienza, M.F.; Wang, D.Q.; Fruhbeck, G.; Garruti, G.; Portincasa, P. The dangerous link between childhood and adulthood predictors of obesity and metabolic syndrome. Intern. Emerg. Med. 2016, 11, 175–182. [Google Scholar] [CrossRef]
- Bornhorst, C.; Tilling, K.; Russo, P.; Kourides, Y.; Michels, N.; Molnar, D.; Rodriguez, G.; Moreno, L.A.; Krogh, V.; Ben-Shlomo, Y.; et al. Associations between early body mass index trajectories and later metabolic risk factors in European children: The IDEFICS study. Eur. J. Epidemiol. 2016, 31, 513–525. [Google Scholar] [CrossRef] [Green Version]
- Sloboda, D.M.; Hickey, M.; Hart, R. Reproduction in females: The role of the early life environment. Hum. Reprod. Update 2010. [Google Scholar] [CrossRef] [Green Version]
- Hart, R.; Doherty, D.A.; Frederiksen, H.; Keelan, J.A.; Hickey, M.; Sloboda, D.; Pennell, C.E.; Newnham, J.P.; Skakkebaek, N.E.; Main, K.M. The influence of antenatal exposure to phthalates on subsequent female reproductive development in adolescence: A pilot study. Reproduction 2014, 147, 379–390. [Google Scholar] [CrossRef] [Green Version]
- Hart, R.J.; Frederiksen, H.; Doherty, D.A.; Keelan, J.A.; Skakkebaek, N.E.; Minaee, N.S.; McLachlan, R.; Newnham, J.P.; Dickinson, J.E.; Pennell, C.E.; et al. The Possible Impact of Antenatal Exposure to Ubiquitous Phthalates upon Male Reproductive Function at 20 Years of Age. Front. Endocrinol. 2018, 9, 288. [Google Scholar] [CrossRef]
- Brix, N.; Ernst, A.; Lauridsen, L.L.B.; Parner, E.T.; Arah, O.A.; Olsen, J.; Henriksen, T.B.; Ramlau-Hansena, C.H. Childhood overweight and obesity and timing of puberty in boys and girls: Cohort and sibling-matched analyses. Int. J. Epidemiol. 2020, 49, 834–844. [Google Scholar] [CrossRef]
- Cathey, A.; Watkins, D.J.; Sanchez, B.N.; Tamayo-Ortiz, M.; Solano-Gonzalez, M.; Torres-Olascoaga, L.; Tellez-Rojo, M.M.; Peterson, K.E.; Meeker, J.D. Onset and tempo of sexual maturation is differentially associated with gestational phthalate exposure between boys and girls in a Mexico City birth cohort. Environ. Int. 2020, 136, 105469. [Google Scholar] [CrossRef]
- Watkins, D.J.; Sanchez, B.N.; Tellez-Rojo, M.M.; Lee, J.M.; Mercado-Garcia, A.; Blank-Goldenberg, C.; Peterson, K.E.; Meeker, J.D. Phthalate and bisphenol A exposure during in utero windows of susceptibility in relation to reproductive hormones and pubertal development in girls. Environ. Res. 2017, 159, 143–151. [Google Scholar] [CrossRef] [PubMed]
- Burgio, E.; Lopomo, A.; Migliore, L. Obesity and diabetes: From genetics to epigenetics. Mol. Biol. Rep. 2015, 42, 799–818. [Google Scholar] [CrossRef] [PubMed]
- Taxvig, C.; Dreisig, K.; Boberg, J.; Nellemann, C.; Schelde, A.B.; Pedersen, D.; Boergesen, M.; Mandrup, S.; Vinggaard, A.M. Differential effects of environmental chemicals and food contaminants on adipogenesis, biomarker release and PPARgamma activation. Mol. Cell Endocrinol. 2012, 361, 106–115. [Google Scholar] [CrossRef] [PubMed]
- Buckley, J.P.; Engel, S.M.; Mendez, M.A.; Richardson, D.B.; Daniels, J.L.; Calafat, A.M.; Wolff, M.S.; Herring, A.H. Prenatal Phthalate Exposures and Childhood Fat Mass in a New York City Cohort. Environ. Health Perspect. 2016, 124, 507–513. [Google Scholar] [CrossRef] [PubMed] [Green Version]
- Heggeseth, B.C.; Holland, N.; Eskenazi, B.; Kogut, K.; Harley, K.G. Heterogeneity in childhood body mass trajectories in relation to prenatal phthalate exposure. Environ. Res. 2019, 175, 22–33. [Google Scholar] [CrossRef] [PubMed]
- Maresca, M.M.; Hoepner, L.A.; Hassoun, A.; Oberfield, S.E.; Mooney, S.J.; Calafat, A.M.; Ramirez, J.; Freyer, G.; Perera, F.P.; Whyatt, R.M.; et al. Prenatal Exposure to Phthalates and Childhood Body Size in an Urban Cohort. Environ. Health Perspect. 2016, 124, 514–520. [Google Scholar] [CrossRef] [PubMed] [Green Version]
- Yang, T.C.; Peterson, K.E.; Meeker, J.D.; Sanchez, B.N.; Zhang, Z.; Cantoral, A.; Solano, M.; Tellez-Rojo, M.M. Exposure to Bisphenol A and phthalates metabolites in the third trimester of pregnancy and BMI trajectories. Pediatr. Obes. 2018, 13, 550–557. [Google Scholar] [CrossRef]
- Harley, K.G.; Berger, K.; Rauch, S.; Kogut, K.; Claus Henn, B.; Calafat, A.M.; Huen, K.; Eskenazi, B.; Holland, N. Association of prenatal urinary phthalate metabolite concentrations and childhood BMI and obesity. Pediatr. Res. 2017, 82, 405–415. [Google Scholar] [CrossRef]
- de Cock, M.; de Boer, M.R.; Lamoree, M.; Legler, J.; van de Bor, M. First year growth in relation to prenatal exposure to endocrine disruptors-a Dutch prospective cohort study. Int. J. Environ. Res. Public Health 2014, 11, 7001–7021. [Google Scholar] [CrossRef]
- Botton, J.; Philippat, C.; Calafat, A.M.; Carles, S.; Charles, M.A.; Slama, R.; The Eden Mother-Child Cohort Study Group. Phthalate pregnancy exposure and male offspring growth from the intra-uterine period to five years of age. Environ. Res. 2016, 151, 601–609. [Google Scholar] [CrossRef]
- Desai, M.; Beall, M.; Ross, M.G. Developmental origins of obesity: Programmed adipogenesis. Curr. Diab. Rep. 2013, 13, 27–33. [Google Scholar] [CrossRef] [Green Version]
- Braun, J.M. Early-life exposure to EDCs: Role in childhood obesity and neurodevelopment. Nat. Rev. Endocrinol. 2017, 13, 161–173. [Google Scholar] [CrossRef] [Green Version]
- Juul, F.; Chang, V.W.; Brar, P.; Parekh, N. Birth weight, early life weight gain and age at menarche: A systematic review of longitudinal studies. Obes. Rev. 2017, 18, 1272–1288. [Google Scholar] [CrossRef]
- Macdonald, W.; Newnham, J.; Gurrin, L.; Evans, S. Effect of frequent prenatal ultrasound on birthweight: Follow up at 1 year of age. Lancet 1996, 348, 482. [Google Scholar] [CrossRef]
- Morris, N.M.; Udry, J.R. Validation of a self-administered instrument to assess stage of adolescent development. J. Youth Adolesc. 1980, 9, 271–280. [Google Scholar] [CrossRef]
- Olsen, I.E.; Groveman, S.A.; Lawson, M.L.; Clark, R.H.; Zemel, B.S. New intrauterine growth curves based on United States data. Pediatrics 2010, 125, e214–e224. [Google Scholar] [CrossRef] [Green Version]
- Control, C.F.D. Growth Charts Center for Disease Control and Prevention 2000. Available online: http://www.cdc.gov/nccdphp/dnpao/growthcharts/resources/sas.htm (accessed on 10 March 2020).
- Hart, R.J.; Doherty, D.A.; Keelan, J.A.; McLachlan, R.; Skakkebaek, N.E.; Norman, R.J.; Dickinson, J.E.; Pennell, C.E.; Newnham, J.P.; Hickey, M.; et al. Early Life Events Predict Adult Testicular Function; Data Derived from the Western Australian (Raine) Birth Cohort. J. Clin. Endocrinol. Metab. 2016, 101, 3333–3344. [Google Scholar] [CrossRef]
- Straker, L.; Mountain, J.; Jacques, A.; White, S.; Smith, A.; Landau, L.; Stanley, F.; Newnham, J.; Pennell, C.; Eastwood, P. Cohort Profile: The Western Australian Pregnancy Cohort (Raine) Study-Generation 2. Int. J. Epidemiol. 2017, 46, 1384j–1385j. [Google Scholar] [CrossRef] [Green Version]
- Lew, M.J. Three inferential questions, two types of p-value. Supplementary material to the ASA’s statement on p-values. Am. Stat. 2016, 70, 129–133. [Google Scholar]
- Wasserstein, R.L.; Lazar, N.A. The ASA’s statement on p-values: Context, process, and purpose. Am. Stat. 2016, 70, 129–133. [Google Scholar] [CrossRef] [Green Version]
- Fudvoye, J.; Parent, A.S. Secular trends in growth. Ann. Endocrinol. 2017, 78, 88–91. [Google Scholar] [CrossRef] [PubMed]
- Valvi, D.; Casas, M.; Romaguera, D.; Monfort, N.; Ventura, R.; Martinez, D.; Sunyer, J.; Vrijheid, M. Prenatal Phthalate Exposure and Childhood Growth and Blood Pressure: Evidence from the Spanish INMA-Sabadell Birth Cohort Study. Environ. Health Perspect. 2015, 123, 1022–1029. [Google Scholar] [CrossRef] [PubMed]
- Boas, M.; Frederiksen, H.; Feldt-Rasmussen, U.; Skakkebaek, N.E.; Hegedus, L.; Hilsted, L.; Juul, A.; Main, K.M. Childhood exposure to phthalates: Associations with thyroid function, insulin-like growth factor I, and growth. Environ. Health Perspect 2010, 118, 1458–1464. [Google Scholar] [CrossRef] [PubMed] [Green Version]
- Berger, K.; Eskenazi, B.; Kogut, K.; Parra, K.; Lustig, R.H.; Greenspan, L.C.; Holland, N.; Calafat, A.M.; Ye, X.; Harley, K.G. Association of Prenatal Urinary Concentrations of Phthalates and Bisphenol A and Pubertal Timing in Boys and Girls. Environ. Health Perspect. 2018, 126, 97004. [Google Scholar] [CrossRef] [Green Version]
- Golestanzadeh, M.; Riahi, R.; Kelishadi, R. Association of phthalate exposure with precocious and delayed pubertal timing in girls and boys: A systematic review and meta-analysis. Environ. Sci. Process. Impacts 2020, 22, 873–894. [Google Scholar] [CrossRef]
- Hou, J.W.; Lin, C.L.; Tsai, Y.A.; Chang, C.H.; Liao, K.W.; Yu, C.J.; Yang, W.; Lee, M.J.; Huang, P.C.; Sun, C.W.; et al. The effects of phthalate and nonylphenol exposure on body size and secondary sexual characteristics during puberty. Int. J. Hygiene Environ. Health 2015, 218, 603–615. [Google Scholar] [CrossRef]
- Talia, C.; Connolly, L.; Fowler, P.A. The insulin-like growth factor system: A target for endocrine disruptors? Environ. Int. 2020, 147, 106311. [Google Scholar] [CrossRef]
- Qian, Y.; Shao, H.; Ying, X.; Huang, W.; Hua, Y. The Endocrine Disruption of Prenatal Phthalate Exposure in Mother and Offspring. Front. Public Health 2020, 8, 366. [Google Scholar] [CrossRef]
- Hines, E.P.; Calafat, A.M.; Silva, M.J.; Mendola, P.; Fenton, S.E. Concentrations of phthalate metabolites in milk, urine, saliva, and Serum of lactating North Carolina women. Environ. Health Perspect. 2009, 117, 86–92. [Google Scholar] [CrossRef]
- Silva, M.J.; Barr, D.B.; Reidy, J.A.; Malek, N.A.; Hodge, C.C.; Caudill, S.P.; Brock, J.W.; Needham, L.L.; Calafat, A.M. Urinary levels of seven phthalate metabolites in the U.S. population from the National Health and Nutrition Examination Survey (NHANES) 1999–2000. Environ. Health Perspect. 2004, 112, 331–338. [Google Scholar] [CrossRef]
- Olsen, L.; Lampa, E.; Birkholz, D.A.; Lind, L.; Lind, P.M. Circulating levels of bisphenol A (BPA) and phthalates in an elderly population in Sweden, based on the Prospective Investigation of the Vasculature in Uppsala Seniors (PIVUS). Ecotoxicol. Environ. Saf. 2012, 75, 242–248. [Google Scholar] [CrossRef]
- Frederiksen, H.; Jorgensen, N.; Andersson, A.M. Correlations between phthalate metabolites in urine, serum, and seminal plasma from young Danish men determined by isotope dilution liquid chromatography tandem mass spectrometry. J. Anal. Toxicol. 2010, 34, 400–410. [Google Scholar] [CrossRef] [Green Version]
- de Groot, C.J.; van den Berg, A.; Ballieux, B.; Kroon, H.M.; Rings, E.; Wit, J.M.; van den Akker, E.L.T. Determinants of Advanced Bone Age in Childhood Obesity. Horm. Res. Paediatr. 2017, 87, 254–263. [Google Scholar] [CrossRef]
- Mouritsen, A.; Frederiksen, H.; Sorensen, K.; Aksglaede, L.; Hagen, C.; Skakkebaek, N.E.; Main, K.M.; Andersson, A.M.; Juul, A. Urinary phthalates from 168 girls and boys measured twice a year during a 5-year period: Associations with adrenal androgen levels and puberty. J. Clin. Endocrinol. Metab. 2013, 98, 3755–3764. [Google Scholar] [CrossRef] [Green Version]


| Phthalate Diester | Abbreviation | Human Serum Metabolite | Abbreviation |
|---|---|---|---|
| Di-methyl phthalate | DMP | Mono-methyl phthalate | MMP a |
| Di-ethyl phthalate | DEP | Mono-ethyl phthalate | MEP |
| Di-iso-propyl phthalate | DiPrP | Mono-(4-oxopentyl) phthalate | MiPrP a |
| DPrP | Mono-propyl phthalate | MPrP a | |
| Di-iso-butyl phthalate | DiBP | Mono-iso-butyl phthalate | MiBP |
| Di-n-butyl phthalate | DnBP | Mono-n-butyl phthalate | MnBP |
| Mono-(3-hydroxybutyl) phthalate | MHBP | ||
| Butylbenzyl phthalate | BBzP | Mono-benzyl phthalate | MBzP |
| Di-n-pentyl phthalate | DPP | Mono-n-pentyl phthalate | MPP a |
| Mono-(4-hydroxypentyl) phthalate | MHPP a | ||
| Di-(2-ethyl-hexyl) phthalate | DEHP | Mono-(2-ethyl-hexyl) phthalate | MEHP |
| Mono-(2-ethyl-5-hydroxyhexyl) phthalate | MEHHP a | ||
| Mono- (2-ethyl-5-oxohexyl) phthalate | MEOHP a | ||
| Mono-(2-ethyl-5-carboxypentyl) phthalate | MECPP | ||
| Mono-(2-carboxymethyl-hexyl) phthalate | MCMHP | ||
| Di-n-hexyl phthalate | DHxP | Mono-n-hexyl phthalate | MHxP a |
| Mono-(5-hydroxyhexyl) phthalate | MHHxP a | ||
| Mono-(5-carboxypentyl) phthalate | MCPeP a | ||
| Di-cyclohexyl phthalate | DCHP | Mono-cyclohexyl phthalate | MCHP a |
| Di-n-heptyl phthalate | DHpP | Mono-n-heptyl phthalate | MhepP a |
| Mono-(6-hydroxyheptyl) phthalate | MHHpP a | ||
| Mono-(6-carboxyhexyl) phthalate | MCHxP a | ||
| Di-octyl phthalate | DOP | Mono-octyl phthalate | MOP a |
| Mono-3-carboxypropyl phthalate | MCPP | ||
| Di-iso-nonyl phthalate | DiNP | Mono-iso-nonyl phthalate | MiNP |
| Mono-hydroxy-iso-nonyl phthalate | MHiNP a | ||
| Mono-oxo-iso-nonyl phthalate | MOiNP a | ||
| Mono-carboxy-iso-octyl phthalate | MCiOP | ||
| Di-iso-decylphthalate | DiDP | Mono-iso-decyl phthalate | MiDP |
| Mono-(9-hydroxydecyl) phthalate | MHiDP a | ||
| Mono-(9-oxodecyl) phthalate | MOiDP a | ||
| Mono-(9-carboxynonyl) phthalate | MCiNP a | ||
| Sums of phthalate metabolites | |||
| ΣMBP(i + n) | Sum of MiBP and MnBP in ng/mL | ||
| ∑DEHPmetab | Molar sum of MEHP, MCMHP, and MECPP expressed as DEHP in ng/mL | ||
| ∑DiNPmetab | Molar sum of MiNP and MCIOP expressed as DiNP in ng/mL | ||
| ∑DEHP + DiNPmetab | Molar sum of MEHP, MCMHP, MECPP, MiNP, MCiOP expressed as MEHP in ng/mL | ||
| ∑low MW phth.metab | Molar sum of MEP, MiBP, MnBP, and MHBP expressed as MEP in ng/mL | ||
| ∑high MW phth.metab | Molar sum of MBzP, MEHP, MCMHP, MECPP, MCPP, MiNP, MCiOP, and MiDP expressed as MEHP in ng/mL | ||
| ∑all phth.metab | Molar sum of MEP, MiBP, MnBP, MHBP, MBzP, MEHP, MCMHP, MECPP, MCPP, MiNP, MCiOP, and MiDP expressed as MEHP in ng/mL | ||
| Included in Study | Not Included in Study | ||||
|---|---|---|---|---|---|
| (Maternal Serum Phthalate Levels and Outcome Data Available) n = 462 | (Maternal Serum Phthalate Levels or Outcome Data Unavailable) n = 880 | ||||
| N | Median (IQR) or N(%) | N | Median (IQR) or N(%) | p-Value a | |
| Participants’ characteristics at 20 years | |||||
| Age at 20 years follow up (years) | 194 | 20.1 (19.7–20.4) | 427 | 19.9 (19.7–20.2) | 0.007 |
| Age at DEXA scan | 165 | 20.1 (19.7–20.4) | 387 | 19.9 (19.7–20.2) | 0.011 |
| Height at 20 years follow up (m) | 188 | 1.7 (1.6–1.7) | 419 | 1.7 (1.6–1.7) | 0.574 |
| Weight at 20 years follow up (kg) | 188 | 64.0 (56.6–71.8) | 419 | 64.8 (57.2–73.5) | 0.630 |
| Age at menarche b | 253 | 12.9 (12.0–13.6) | 515 | 12.7 (12.0–13.4) | 0.173 |
| BMI at 20 years follow up (kg/m2) | 188 | 22.8 (20.5–26.3) | 419 | 23.1 (21.1–26.3) | 0.322 |
| BMI category | 188 | 419 | 0.806 | ||
| Underweight | 12 (6.4) | 21 (5.0) | |||
| Normal | 118 (62.8) | 256 (61.1) | |||
| Overweight | 32 (17.0) | 82 (19.6) | |||
| Obese | 26 (13.8) | 60 (14.3) | |||
| Adiposity (DEXA) at 20 yrs | |||||
| Soft tissue percentage | 165 | 41 (34–48) | 387 | 40 (35–47) | 0.895 |
| Total fat percentage | 165 | 39 (33–46) | 387 | 39 (33–45) | 0.837 |
| Total fat mass (kg) | 165 | 24.4 (18.1–32.2) | 387 | 24.8 (19.4–32.4) | 0.521 |
| Total lean mass (kg) | 165 | 36.0 (32.7–39.6) | 387 | 36.7 (33.6–40) | 0.245 |
| Total soft tissue mass (kg) | 165 | 61.2 (54.8–67.4) | 387 | 62.1 (55.1–69.9) | 0.421 |
| Maternal characteristics in pregnancy | |||||
| Maternal age at delivery | 462 | 28.1 (23.9–32.1) | 875 | 28 (23.3–32.2) | 0.788 |
| Smoked during pregnancy | 462 | 131 (28.3) | 875 | 245 (28.0) | 0.891 |
| Drunk alcohol during first trimester | 462 | 202 (43.7) | 875 | 395 (45.1) | 0.619 |
| Maternal height (m) | 456 | 1.6 (1.6–1.7) | 870 | 1.6 (1.6–1.7) | 0.246 |
| Maternal BMI (pre-pregnancy) | 456 | 21.2 (19.6–23.8) | 870 | 21.3 (19.7–23.6) | 0.642 |
| Maternal BMI category | 456 | 870 | 0.515 | ||
| Underweight | 64 (14.0) | 98 (11.3) | |||
| Normal | 307 (67.3) | 612 (70.3) | |||
| Overweight | 54 (11.8) | 101 (11.6) | |||
| Obese | 31 (6.8) | 59 (6.8) | |||
| Maternal education since leaving school | 462 | 880 | 0.821 | ||
| Missing | 6 (1.3) | 10 (1.1) | |||
| None | 230 (49.8) | 446 (50.7) | |||
| Trade | 181 (39.2) | 332 (37.7) | |||
| University | 45 (9.7) | 92 (10.5) | |||
| Maternal Race | 462 | 880 | 0.055 | ||
| Caucasian | 403 (87.2) | 763 (86.7) | |||
| Chinese | 30 (6.5) | 35 (4.0) | |||
| Indian | 10 (2.2) | 33 (3.8) | |||
| Other | 19 (4.1) | 49 (5.6) | |||
| Marital Status | 462 | 880 | 0.699 | ||
| Married or de facto | 384 (83.1) | 724 (82.3) | |||
| Not married or de facto | 78 (16.9) | 156 (17.7) | |||
| Participants characteristics at birth | |||||
| Gestational age at birth | 462 | 880 | 0.188 | ||
| <34 weeks | 13 (2.8) | 20 (2.3) | |||
| 34–36 weeks | 33 (7.1) | 43 (4.9) | |||
| 37 + weeks | 416 (90.0) | 817 (92.8) | |||
| Birthweight (kg) | 462 | 3.3 (2.9–3.6) | 880 | 3.3 (3.0–3.6) | 0.308 |
| Adjusted birthweight percentile | 462 | 880 | 0.999 | ||
| ≤3rd | 14 (3.0) | 26 (3.0) | |||
| 4th–10th | 37 (8.0) | 70 (8.0) | |||
| 11th–49th | 169 (36.6) | 321 (36.5) | |||
| 50th–89th | 189 (40.9) | 360 (40.9) | |||
| ≥90th | 53 (11.5) | 103 (11.7) | |||
| Expected birthweight ratio | 462 | 1.0 (0.9–1.1) | 878 | 1.0 (0.9–1.1) | 0.768 |
| Unadjusted | Adjusted | ||||
|---|---|---|---|---|---|
| Median (IQR) | HR (95% CI) | HR (95% CI) | |||
| MEP | |||||
| ≤1.15 | 12.96 (12.10, 13.70) | ref | ref | ||
| >1.15 and ≤4.71 | 12.78 (12.00, 13.50) | 1.21 (0.89, 1.65) | 1.20 (0.88, 1.64) | ||
| >4.71 | 12.98 (12.14, 13.74) | 0.97 (0.72, 1.31) | 0.95 (0.70, 1.29) | ||
| MiBP | |||||
| Not Detectable | 12.83 (12.02, 13.52) | ref | ref | ||
| Detectable | 12.96 (12.10, 13.74) | 0.83 (0.64, 1.06) | 0.82 (0.63, 1.05) | ||
| MnBP | |||||
| ≤1.41 | 12.90 (12.04, 13.68) | ref | ref | ||
| >1.41 and ≤3.44 | 12.85 (12.03, 13.59) | 1.07 (0.79, 1.46) | 1.16 (0.84, 1.59) | ||
| >3.44 | 12.96 (12.08, 13.74) | 0.93 (0.69, 1.26) | 0.92 (0.68, 1.26) | ||
| MHBP | |||||
| Not Detectable | 12.89 (12.04, 13.62) | ref | ref | ||
| Detectable | 12.95 (12.08, 13.70) | 0.93 (0.72, 1.20) | 0.91 (0.70, 1.18) | ||
| MBzP | |||||
| Not Detectable | 12.96 (12.10, 13.74) | ref | ref | ||
| Detectable | 12.84 (12.03, 13.53) | 1.20 (0.93, 1.53) | 1.19 (0.92, 1.53) | ||
| MEHP | |||||
| ≤2.71 | 12.85 (12.03, 13.59) | ref | ref | ||
| >2.71 and ≤4.69 | 12.90 (12.04, 13.68) | 0.93 (0.68, 1.26) | 0.92 (0.67, 1.25) | ||
| >4.69 | 12.96 (12.10, 13.71) | 0.88 (0.65, 1.19) | 0.82 (0.60, 1.12) | ||
| MECPP | |||||
| ≤0.59 | 12.84 (12.03, 13.55) | ref | ref | ||
| >0.59 and ≤1.02 | 13.07 (12.19, 13.82) | 0.78 (0.58, 1.05) | 0.78 (0.57, 1.07) | ||
| >1.02 | 12.83 (12.02, 13.52) | 1.03 (0.76, 1.41) | 0.99 (0.72, 1.36) | ||
| MCMHP | |||||
| ≤1.03 | 12.79 (12.02, 13.52) | ref | ref | ||
| >1.03 and ≤1.69 | 13.05 (12.19, 13.82) | 0.74 (0.55, 1.01) | 0.71 (0.52, 0.98) | ↑ | |
| >1.69 | 12.89 (12.04, 13.62) | 0.91 (0.67, 1.23) | 0.86 (0.64, 1.17) | ||
| MCPP | |||||
| Not Detectable | 12.92 (12.07, 13.68) | ref | ref | ||
| Detectable | 12.89 (12.04, 13.62) | 1.05 (0.82, 1.35) | 1.20 (0.92, 1.57) | ||
| MiNP | |||||
| ≤2.77 | 12.85 (12.04, 13.60) | ref | ref | ||
| >2.77 and ≤4.87 | 12.92 (12.07, 13.68) | 0.93 (0.68, 1.25) | 0.95 (0.69, 1.30) | ||
| >4.87 | 12.95 (12.08, 13.70) | 0.91 (0.67, 1.24) | 0.82 (0.60, 1.12) | ||
| MCiOP | |||||
| Not Detectable | 12.85 (12.03, 13.59) | ref | ref | ||
| Detectable | 12.96 (12.10, 13.74) | 0.86 (0.67, 1.11) | 0.83 (0.64, 1.07) | ||
| MiDP | |||||
| Not Detectable | 12.89 (12.04, 13.64) | ref | ref | ||
| Detectable | 12.92 (12.07, 13.68) | 0.98 (0.76, 1.26) | 1.01 (0.78, 1.31) | ||
| ∑MBP(i + n) | |||||
| ≤2.06 | 12.84 (12.03, 13.53) | ref | ref | ||
| >2.06 and ≤5.14 | 12.89 (12.04, 13.62) | 0.94 (0.69, 1.27) | 0.93 (0.68, 1.26) | ||
| >5.14 | 12.99 (12.15, 13.77) | 0.82 (0.60, 1.11) | 0.80 (0.59, 1.09) | ||
| ∑DEHPmetab | |||||
| ≤6.59 | 12.96 (12.10, 13.74) | ref | ref | ||
| >6.59 and ≤9.73 | 12.78 (12.01, 13.50) | 1.24 (0.91, 1.68) | 1.11 (0.81, 1.52) | ||
| >9.73 | 12.96 (12.10, 13.74) | 1.00 (0.74, 1.35) | 0.93 (0.69, 1.26) | ||
| ∑DiNPmetab | |||||
| ≤4.15 | 12.84 (12.03, 13.55) | ref | ref | ||
| >4.15 and ≤7.31 | 12.90 (12.04, 13.68) | 0.92 (0.68, 1.25) | 0.92 (0.67, 1.27) | ||
| >7.31 | 12.98 (12.14, 13.75) | 0.84 (0.62, 1.14) | 0.73 (0.53, 1.00) | ↑ | |
| ∑DEHP + DiNPmetab | |||||
| ≤8.42 | 12.87 (12.04, 13.62) | ref | ref | ||
| >8.42 and ≤11.72 | 12.87 (12.04, 13.62) | 0.99 (0.73, 1.34) | 0.92 (0.68, 1.25) | ||
| >11.72 | 12.98 (12.14, 13.75) | 0.86 (0.63, 1.18) | 0.77 (0.56, 1.07) | ||
| ∑low MW phth.metab | |||||
| ≤4.2 | 12.90 (12.04, 13.68) | ref | ref | ||
| >4.2 and ≤10.46 | 12.76 (12.01, 13.50) | 1.16 (0.85, 1.58) | 1.16 (0.85, 1.58) | ||
| >10.46 | 13.04 (12.16, 13.79) | 0.86 (0.64, 1.17) | 0.84 (0.62, 1.14) | ||
| ∑high MW phth.metab | |||||
| ≤9.22 | 12.76 (12.01, 13.48) | ref | ref | ||
| >9.22 and ≤13.43 | 12.96 (12.10, 13.74) | 0.79 (0.58, 1.07) | 0.72 (0.53, 0.99) | ↑ | |
| >13.43 | 12.96 (12.10, 13.74) | 0.80 (0.58, 1.09) | 0.76 (0.55, 1.04) | ||
| ∑all phth.metab | |||||
| ≤17.39 | 12.89 (12.04, 13.62) | ref | ref | ||
| >17.39 and ≤28.0 | 12.84 (12.03, 13.52) | 1.07 (0.79, 1.44) | 1.05 (0.77, 1.42) | ||
| >28.0 | 13.04 (12.18, 13.79) | 0.83 (0.61, 1.13) | 0.79 (0.58, 1.08) | ||
| Change in Height from 0–2 Years of Age (N = 335) Change Z-Score | Linear Mixed Model for Heights a (N = 270) Marginal Mean Z-Score (95% CI) | Deviation from Mid-Parental Height at 20 Years of Age (N = 165) Deviation Z-Score | ||||||||
|---|---|---|---|---|---|---|---|---|---|---|
| βPhthalate (95% CI) | 0–2 Years | 2–10 Years | 10–20 Years | βPhthalate (95% CI) | ||||||
| MEP | ||||||||||
| ≤1.15 | ref | −0.12 (−0.28, 0.04) | 0.00 (−0.14, 0.14) | 0.60 (0.43, 0.77) | ref | |||||
| >1.15 and ≤4.71 | −0.19 (−0.38, 0.00) | ↓ | −0.20 (−0.37, −0.04) | −0.02 (−0.16, 0.12) | 0.59 (0.42, 0.76) | −0.02 (−0.30, 0.26) | ||||
| >4.71 | 0.00 (−0.19, 0.18) | −0.19 (−0.35, −0.03) | 0.13 (−0.01, 0.26) | 0.70 (0.53, 0.87) | 0.02 (−0.26, 0.31) | |||||
| MiBP | ||||||||||
| Not Detectable | ref | −0.23 (−0.38, −0.08) | −0.03 (−0.15, 0.10) | 0.56 (0.41, 0.71) | ref | |||||
| Detectable | −0.07 (−0.23, 0.09) | −0.13 (−0.27, 0.02) | 0.09 (−0.03, 0.20) | 0.68 (0.54, 0.81) | 0.17 (−0.08, 0.42) | |||||
| MnBP | b | |||||||||
| ≤1.41 | ref | −0.17 (−0.33, 0.00) | −0.02 (−0.16, 0.12) | 0.60 (0.44, 0.77) | ref | |||||
| >1.41 and ≤3.44 | 0.12 (−0.07, 0.30) | −0.08 (−0.24, 0.08) | 0.09 (−0.04, 0.23) | 0.64 (0.47, 0.81) | 0.14 (−0.14, 0.42) | |||||
| >3.44 | −0.15 (−0.34, 0.04) | −0.26 (−0.42, −0.10) | 0.03 (−0.11, 0.17) | 0.63 (0.46, 0.80) | 0.20 (−0.10, 0.49) | |||||
| MHBP | ||||||||||
| Not Detectable | ref | −0.12 (−0.26, 0.02) | 0.05 (−0.06, 0.16) | 0.64 (0.50, 0.77) | ref | |||||
| Detectable | −0.24 (−0.40, −0.09) | ↓ | −0.24 (−0.40, −0.09) | 0.01 (−0.11, 0.14) | 0.61 (0.46, 0.77) | 0.07 (−0.16, 0.30) | ||||
| MBzP | ||||||||||
| Not Detectable | ref | −0.18 (−0.33, −0.04) | −0.08 (−0.19, 0.04) | 0.55 (0.41, 0.69) | ref | |||||
| Detectable | −0.04 (−0.20, 0.12) | −0.14 (−0.29, 0.01) | 0.16 (0.04, 0.27) | ↑ | 0.71 (0.56, 0.85) | 0.15 (−0.09, 0.39) | ||||
| MEHP | ||||||||||
| ≤2.71 | ref | −0.15 (−0.32, 0.01) | 0.12 (−0.02, 0.26) | 0.69 (0.52, 0.86) | ref | |||||
| >2.71 and ≤4.69 | 0.04 (−0.15, 0.23) | −0.12 (−0.28, 0.04) | −0.02 (−0.16, 0.12) | 0.57 (0.40, 0.74) | 0.14 (−0.15, 0.42) | |||||
| >4.69 | −0.01 (−0.20, 0.18) | −0.25 (−0.41, −0.08) | 0.02 (−0.12, 0.16) | 0.62 (0.45, 0.79) | 0.06 (−0.23, 0.36) | |||||
| MECPP | ||||||||||
| ≤0.59 | ref | −0.20 (−0.37, −0.04) | −0.10 (−0.24, 0.04) | 0.51 (0.34, 0.68) | ref | |||||
| >0.59 and ≤1.02 | 0.06 (−0.14, 0.25) | −0.10 (−0.26, 0.06) | 0.10 (−0.04, 0.23) | ↑ | 0.70 (0.53, 0.87) | 0.21 (−0.08, 0.49) | ||||
| >1.02 | −0.10 (−0.29, 0.09) | −0.19 (−0.35, −0.03) | 0.10 (−0.04, 0.23) | ↑ | 0.66 (0.49, 0.83) | −0.02 (−0.30, 0.26) | ||||
| MCMHP | ||||||||||
| ≤1.03 | ref | −0.19 (−0.35, −0.02) | 0.06 (−0.07, 0.20) | 0.59 (0.42, 0.76) | ref | |||||
| >1.03 and ≤1.69 | −0.04 (−0.23, 0.15) | −0.20 (−0.37, −0.03) | 0.01 (−0.14, 0.15) | 0.63 (0.46, 0.81) | 0.05 (−0.23, 0.33) | |||||
| >1.69 | 0.00 (−0.19, 0.18) | −0.14 (−0.30, 0.02) | 0.04 (−0.09, 0.18) | 0.66 (0.49, 0.82) | −0.09 (−0.37, 0.18) | |||||
| MCPP | ||||||||||
| Not Detectable | ref | −0.14 (−0.28, 0.00) | 0.08 (−0.03, 0.20) | 0.66 (0.52, 0.79) | ref | |||||
| Detectable | −0.04 (−0.20, 0.12) | −0.22 (−0.37, −0.06) | −0.03 (−0.15, 0.10) | 0.59 (0.43, 0.74) | 0.14 (−0.09, 0.37) | |||||
| MiNP | ||||||||||
| ≤2.77 | ref | −0.20 (−0.36, −0.03) | −0.03 (−0.17, 0.12) | 0.63 (0.46, 0.81) | ref | |||||
| >2.77 and ≤4.87 | −0.11 (−0.31, 0.08) | −0.14 (−0.30, 0.03) | 0.00 (−0.14, 0.13) | 0.59 (0.43, 0.76) | −0.19 (−0.46, 0.09) | |||||
| >4.87 | −0.10 (−0.3, 0.10) | −0.16 (−0.32, 0.00) | 0.12 (−0.01, 0.25) | 0.65 (0.48, 0.82) | −0.16 (−0.46, 0.15) | |||||
| MCiOP | ||||||||||
| Not Detectable | ref | −0.10 (−0.25, 0.04) | 0.05 (−0.07, 0.18) | 0.64 (0.49, 0.78) | ref | |||||
| Detectable | −0.22 (−0.38, −0.07) | ↓ | −0.23 (−0.38, −0.09) | 0.02 (−0.10, 0.14) | 0.62 (0.48, 0.76) | 0.04 (−0.19, 0.27) | ||||
| MiDP | ||||||||||
| Not Detectable | ref | −0.20 (−0.34, −0.07) | 0.09 (−0.02, 0.20) | 0.66 (0.53, 0.79) | ref | |||||
| Detectable | 0.07 (−0.09, 0.23) | −0.11 (−0.26, 0.05) | −0.05 (−0.18, 0.08) | 0.57 (0.42, 0.73) | 0.05 (−0.18, 0.29) | |||||
| ∑MBP(i + n) | ||||||||||
| ≤2.06 | ref | −0.17 (−0.33, 0.00) | −0.04 (−0.18, 0.10) | 0.56 (0.39, 0.74) | ref | |||||
| >2.06 and ≤5.14 | −0.07 (−0.26, 0.13) | −0.12 (−0.28, 0.04) | 0.06 (−0.07, 0.20) | 0.65 (0.49, 0.82) | −0.03 (−0.31, 0.25) | |||||
| >5.14 | −0.18 (−0.38, 0.01) | −0.22 (−0.38, −0.06) | 0.07 (−0.07, 0.21) | 0.66 (0.49, 0.83) | 0.19 (−0.11, 0.48) | |||||
| ∑DEHPmetab | ||||||||||
| ≤6.59 | ref | −0.20 (−0.36, −0.04) | −0.04 (−0.18, 0.10) | 0.55 (0.37, 0.72) | ref | |||||
| >6.59 and ≤9.73 | 0.03 (−0.16, 0.23) | −0.10 (−0.26, 0.06) | 0.12 (−0.02, 0.26) | 0.69 (0.51, 0.86) | 0.07 (−0.22, 0.35) | |||||
| >9.73 | −0.10 (−0.29, 0.09) | −0.22 (−0.38, −0.06) | 0.03 (−0.11, 0.17) | 0.65 (0.48, 0.82) | 0.09 (−0.18, 0.37) | |||||
| ∑DiNPmetab | ||||||||||
| ≤4.15 | ref | −0.19 (−0.35, −0.02) | −0.03 (−0.18, 0.11) | 0.61 (0.44, 0.79) | ref | |||||
| >4.15 and ≤7.31 | −0.08 (−0.27, 0.12) | −0.13 (−0.29, 0.04) | 0.00 (−0.14, 0.14) | 0.63 (0.46, 0.80) | −0.08 (−0.36, 0.19) | |||||
| >7.31 | −0.12 (−0.32, 0.07) | −0.18 (−0.34, −0.02) | 0.12 (−0.02, 0.25) | 0.63 (0.47, 0.80) | −0.12 (−0.42, 0.18) | |||||
| ∑DEHP + DiNPmetab | ||||||||||
| ≤8.42 | ref | −0.24 (−0.41, −0.07) | −0.04 (−0.19, 0.10) | 0.59 (0.41, 0.76) | ref | |||||
| >8.42 and ≤11.72 | 0.05 (−0.14, 0.24) | −0.07 (−0.23, 0.09) | 0.13 (0.00, 0.26) | 0.69 (0.53, 0.85) | 0.08 (−0.20, 0.36) | |||||
| >11.72 | −0.11 (−0.30, 0.08) | −0.22 (−0.38, −0.06) | 0.01 (−0.13, 0.15) | 0.60 (0.43, 0.77) | −0.07 (−0.35, 0.21) | |||||
| ∑low MW phth.metab | ||||||||||
| ≤4.2 | ref | −0.12 (−0.28, 0.04) | 0.01 (−0.13, 0.15) | 0.64 (0.47, 0.81) | ref | |||||
| >4.2 and ≤10.46 | −0.12 (−0.31, 0.08) | −0.16 (−0.32, 0.00) | 0.01 (−0.13, 0.15) | 0.57 (0.4, 0.74) | 0.01 (−0.28, 0.31) | |||||
| >10.46 | −0.10 (−0.29, 0.09) | −0.23 (−0.39, −0.07) | 0.09 (−0.05, 0.23) | 0.67 (0.50, 0.84) | 0.00 (−0.28, 0.29) | |||||
| ∑high MW phth.metab | ||||||||||
| ≤9.22 | ref | −0.23 (−0.40, −0.06) | 0.01 (−0.13, 0.15) | 0.60 (0.42, 0.77) | ref | |||||
| >9.22 and ≤13.43 | 0.01 (−0.18, 0.20) | −0.09 (−0.25, 0.07) | 0.08 (−0.06, 0.21) | 0.68 (0.51, 0.84) | 0.18 (−0.10, 0.45) | |||||
| >13.43 | −0.04 (−0.23, 0.16) | −0.20 (−0.36, −0.04) | 0.02 (−0.12, 0.16) | 0.60 (0.43, 0.77) | −0.01 (−0.29, 0.26) | |||||
| ∑all phth.metab | ||||||||||
| ≤17.39 | ref | −0.12 (−0.28, 0.05) | 0.04 (−0.10, 0.18) | 0.64 (0.47, 0.81) | ref | |||||
| >17.39 and ≤28.0 | −0.05 (−0.24, 0.14) | −0.15 (−0.31, 0.01) | −0.02 (−0.16, 0.11) | 0.63 (0.46, 0.80) | 0.04 (−0.24, 0.31) | |||||
| >28.0 | −0.16 (−0.35, 0.02) | −0.24 (−0.41, −0.08) | 0.09 (−0.04, 0.23) | 0.61 (0.44, 0.78) | 0.01 (−0.27, 0.30) | |||||
| Change in Weight from 0–2 Years of Age (N = 409) Change Z-Score | Linear Mixed Model for BMI a (N = 319) Marginal Mean Z-Score (95% CI) | |||||
|---|---|---|---|---|---|---|
| βPhthalate (95% CI) | 2–10 Years | 10–20 Years | ||||
| MEP | ||||||
| ≤1.15 | ref | 0.15 (−0.03, 0.33) | 0.18 (0.00, 0.35) | |||
| >1.15 and ≤4.71 | −0.07 (−0.30, 0.17) | 0.37 (0.20, 0.53) | 0.27 (0.10, 0.44) | |||
| >4.71 | 0.09 (−0.14, 0.33) | 0.28 (0.10, 0.45) | 0.22 (0.05, 0.40) | |||
| MiBP | ||||||
| Not Detectable | ref | 0.26 (0.11, 0.41) | 0.22 (0.07, 0.38) | |||
| Detectable | −0.03 (−0.22, 0.16) | 0.28 (0.14, 0.41) | 0.22 (0.09, 0.36) | |||
| MnBP | ||||||
| ≤1.41 | ref | 0.27 (0.09, 0.44) | 0.19 (0.02, 0.37) | |||
| >1.41 and ≤3.44 | −0.01 (−0.25, 0.23) | 0.29 (0.11, 0.46) | 0.23 (0.05, 0.40) | |||
| >3.44 | −0.15 (−0.38, 0.09) | 0.26 (0.09, 0.43) | 0.25 (0.08, 0.42) | |||
| MHBP | ||||||
| Not Detectable | ref | 0.19 (0.06, 0.32) | 0.14 (0.01, 0.27) | |||
| Detectable | −0.21 (−0.40, −0.02) | ↓ | 0.39 (0.23, 0.54) | 0.35 (0.20, 0.51) | ↑ | |
| MBzP | ||||||
| Not Detectable | ref | 0.27 (0.14, 0.41) | 0.22 (0.08, 0.36) | |||
| Detectable | −0.04 (−0.23, 0.15) | 0.26 (0.12, 0.41) | 0.22 (0.08, 0.37) | |||
| MEHP | ||||||
| ≤2.71 | ref | 0.30 (0.12, 0.48) | 0.25 (0.07, 0.43) | |||
| >2.71 and ≤4.69 | −0.16 (−0.39, 0.07) | 0.19 (0.02, 0.36) | 0.20 (0.02, 0.37) | |||
| >4.69 | 0.02 (−0.21, 0.25) | 0.32 (0.15, 0.49) | 0.23 (0.06, 0.40) | |||
| MECPP | ||||||
| ≤0.59 | ref | 0.30 (0.13, 0.48) | 0.19 (0.01, 0.36) | |||
| >0.59 and ≤1.02 | −0.06 (−0.29, 0.18) | 0.25 (0.08, 0.42) | 0.24 (0.06, 0.41) | |||
| >1.02 | −0.15 (−0.38, 0.09) | 0.26 (0.08, 0.43) | 0.25 (0.07, 0.43) | |||
| MCMHP | ||||||
| ≤1.03 | ref | 0.34 (0.17, 0.51) | 0.27 (0.10, 0.44) | |||
| >1.03 and ≤1.69 | −0.20 (−0.44, 0.03) | 0.17 (−0.01, 0.34) | 0.16 (−0.02, 0.33) | |||
| >1.69 | −0.04 (−0.26, 0.19) | 0.30 (0.13, 0.47) | 0.24 (0.07, 0.41) | |||
| MCPP | ||||||
| Not Detectable | ref | 0.34 (0.21, 0.46) | 0.32 (0.19, 0.45) | |||
| Detectable | −0.06 (−0.25, 0.13) | 0.17 (0.02, 0.33) | 0.08 (−0.07, 0.24) | ↓ | ||
| MiNP | ||||||
| ≤2.77 | ref | 0.21 (0.03, 0.38) | 0.14 (−0.03, 0.32) | |||
| >2.77 and ≤4.87 | 0.11 (−0.13, 0.35) | 0.37 (0.19, 0.54) | 0.32 (0.14, 0.49) | |||
| >4.87 | 0.00 (−0.24, 0.24) | 0.24 (0.07, 0.41) | 0.21 (0.04, 0.38) | |||
| MCiOP | ||||||
| Not Detectable | ref | 0.35 (0.2, 0.49) | 0.28 (0.13, 0.43) | |||
| Detectable | −0.35 (−0.54, −0.16) | ↓ | 0.20 (0.06, 0.34) | 0.17 (0.04, 0.31) | ||
| MiDP | ||||||
| Not Detectable | ref | 0.27 (0.14, 0.40) | 0.26 (0.13, 0.39) | |||
| Detectable | −0.04 (−0.23, 0.16) | 0.27 (0.12, 0.43) | 0.17 (0.01, 0.33) | |||
| ∑MBP(i + n) | ||||||
| ≤2.06 | ref | 0.25 (0.07, 0.43) | 0.14 (−0.04, 0.32) | |||
| >2.06 and ≤5.14 | −0.20 (−0.44, 0.04) | 0.29 (0.13, 0.46) | 0.27 (0.10, 0.44) | |||
| >5.14 | −0.18 (−0.41, 0.06) | 0.26 (0.09, 0.43) | 0.25 (0.08, 0.43) | |||
| ∑DEHPmetab | ||||||
| ≤6.59 | ref | 0.26 (0.08, 0.43) | 0.18 (0.01, 0.36) | |||
| >6.59 and ≤9.73 | −0.14 (−0.38, 0.09) | 0.22 (0.05, 0.39) | 0.21 (0.03, 0.38) | |||
| >9.73 | −0.04 (−0.27, 0.19) | 0.32 (0.16, 0.49) | 0.28 (0.11, 0.45) | |||
| ∑DiNPmetab | ||||||
| ≤4.15 | ref | 0.22 (0.05, 0.39) | 0.17 (−0.01, 0.34) | |||
| >4.15 and ≤7.31 | 0.10 (−0.13, 0.34) | 0.32 (0.14, 0.49) | 0.31 (0.13, 0.49) | |||
| >7.31 | −0.05 (−0.29, 0.19) | 0.27 (0.10, 0.44) | 0.20 (0.03, 0.37) | |||
| ∑DEHP + DiNPmetab | ||||||
| ≤8.42 | ref | 0.16 (−0.01, 0.34) | 0.17 (−0.01, 0.35) | |||
| >8.42 and ≤11.72 | 0.06 (−0.17, 0.30) | 0.36 (0.19, 0.52) | 0.28 (0.11, 0.45) | |||
| >11.72 | −0.09 (−0.32, 0.15) | 0.27 (0.10, 0.44) | 0.21 (0.04, 0.38) | |||
| ∑low MW phth.metab | ||||||
| ≤4.2 | ref | 0.18 (0.00, 0.35) | 0.14 (−0.04, 0.31) | |||
| >4.2 and ≤10.46 | −0.15 (−0.39, 0.08) | 0.33 (0.16, 0.50) | 0.30 (0.13, 0.47) | |||
| >10.46 | 0.00 (−0.23, 0.24) | 0.30 (0.12, 0.47) | 0.23 (0.06, 0.40) | |||
| ∑high MW phth.metab | ||||||
| ≤9.22 | ref | 0.20 (0.02, 0.38) | 0.17 (−0.01, 0.35) | |||
| >9.22 and ≤13.43 | 0.00 (−0.24, 0.23) | 0.30 (0.14, 0.47) | 0.25 (0.07, 0.42) | |||
| >13.43 | −0.02 (−0.26, 0.21) | 0.30 (0.13, 0.47) | 0.25 (0.08, 0.42) | |||
| ∑all phth.metab | ||||||
| ≤17.39 | ref | 0.18 (0.01, 0.36) | 0.13 (−0.05, 0.31) | |||
| >17.39 and ≤28.0 | −0.08 (−0.32, 0.16) | 0.26 (0.09, 0.42) | 0.26 (0.09, 0.43) | |||
| >>28.0 | −0.15 (−0.39, 0.08) | 0.36 (0.19, 0.53) | 0.27 (0.10, 0.45) | |||
| Fat Mass (g) | Lean Mass (g) | Soft Tissue Mass (g) | ||||
|---|---|---|---|---|---|---|
| Geometric Mean (95% CI) | Geometric Mean (95% CI) | Geometric Mean (95% CI) | ||||
| MEP | ||||||
| ≤1.15 | ref | ref | ref | |||
| >1.15 and ≤4.71 | 0.91 (0.78, 1.06) | 0.99 (0.94, 1.05) | 0.96 (0.88, 1.04) | |||
| >4.71 | 0.93 (0.80, 1.09) | 0.98 (0.92, 1.03) | 0.96 (0.89, 1.04) | |||
| MiBP | ||||||
| Not Detectable | ref | ref | ref | |||
| Detectable | 1.11 (0.97, 1.27) | 1.03 (0.98, 1.08) | 1.07 (1.00, 1.14) | ↑ | ||
| MnBP | ||||||
| ≤1.41 | ref | ref | ref | |||
| >1.41 and ≤3.44 | 1.00 (0.86, 1.16) | 1.03 (0.97, 1.08) | 1.02 (0.95, 1.09) | |||
| >3.44 | 1.05 (0.89, 1.23) | 1.05 (0.99, 1.11) | 1.05 (0.97, 1.14) | |||
| MHBP | ||||||
| Not Detectable | ref | ref | ref | |||
| Detectable | 1.05 (0.93, 1.19) | 1.04 (0.99, 1.09) | 1.05 (0.98, 1.11) | |||
| MBzP | ||||||
| Not Detectable | ref | ref | ref | |||
| Detectable | 0.96 (0.84, 1.09) | 1.00 (0.96, 1.05) | 0.98 (0.92, 1.05) | |||
| MEHP | a | |||||
| ≤2.71 | ref | ref | ref | |||
| >2.71 and ≤4.69 | 1.02 (0.86, 1.19) | 1.08 (1.02, 1.14) | ↑ | 1.05 (0.98, 1.14) | ||
| >4.69 | 0.93 (0.78, 1.09) | 1.03 (0.97, 1.09) | 0.98 (0.91, 1.06) | |||
| MECPP¥ | ||||||
| ≤0.59 | ref | ref | ref | |||
| >0.59 and ≤1.02 | 0.89 (0.76, 1.05) | 1.02 (0.96, 1.08) | 0.97 (0.89, 1.05) | |||
| >1.02 | 0.94 (0.80, 1.11) | 1.01 (0.96, 1.07) | 0.98 (0.91, 1.07) | |||
| MCMHP | ||||||
| ≤1.03 | ref | ref | ref | |||
| >1.03 and ≤1.69 | 0.89 (0.76, 1.03) | 0.99 (0.94, 1.05) | 0.95 (0.88, 1.02) | |||
| >1.69 | 0.94 (0.81, 1.09) | 1.03 (0.97, 1.08) | 0.99 (0.92, 1.07) | |||
| MCPP | ||||||
| Not Detectable | ref | ref | ref | |||
| Detectable | 0.95 (0.84, 1.08) | 0.99 (0.95, 1.04) | 0.98 (0.92, 1.04) | |||
| MiNP | ||||||
| ≤2.77 | ref | ref | ref | |||
| >2.77 and ≤4.87 | 1.07 (0.92, 1.23) | 0.96 (0.91, 1.02) | 1.00 (0.93, 1.07) | |||
| >4.87 | 0.94 (0.79, 1.11) | 0.97 (0.91, 1.03) | 0.96 (0.88, 1.04) | |||
| MCiOP | ||||||
| Not Detectable | ref | ref | ref | |||
| Detectable | 0.96 (0.85, 1.09) | 1.02 (0.98, 1.07) | 1.00 (0.94, 1.06) | |||
| MiDP | ||||||
| Not Detectable | ref | ref | ref | |||
| Detectable | 1.02 (0.90, 1.16) | 0.97 (0.93, 1.02) | 0.99 (0.93, 1.06) | |||
| ∑MBP(i + n) | ||||||
| ≤2.06 | ref | ref | ref | |||
| >2.06 and ≤5.14 | 1.08 (0.93, 1.26) | 0.99 (0.94, 1.05) | 1.03 (0.96, 1.11) | |||
| >5.14 | 1.08 (0.92, 1.27) | 1.05 (0.99, 1.11) | 1.07 (0.99, 1.16) | |||
| ∑DEHPmetab | ||||||
| ≤6.59 | ref | ref | ref | |||
| >6.59 and ≤9.73 | 0.91 (0.77, 1.06) | 1.00 (0.95, 1.06) | 0.96 (0.89, 1.04) | |||
| >9.73 | 0.93 (0.80, 1.08) | 1.02 (0.96, 1.07) | 0.98 (0.91, 1.05) | |||
| ∑DiNPmetab | ||||||
| ≤4.15 | ref | ref | ref | |||
| >4.15 and ≤7.31 | 1.06 (0.92, 1.23) | 0.97 (0.92, 1.02) | 1.00 (0.93, 1.07) | |||
| >7.31 | 0.91 (0.77, 1.08) | 0.97 (0.91, 1.03) | 0.95 (0.87, 1.03) | |||
| ∑DEHP + DiNPmetab | ||||||
| ≤8.42 | ref | ref | ref | |||
| >8.42 and ≤11.72 | 1.02 (0.88, 1.19) | 1.00 (0.95, 1.06) | 1.01 (0.94, 1.09) | |||
| >11.72 | 0.92 (0.79, 1.07) | 0.99 (0.94, 1.05) | 0.96 (0.89, 1.03) | |||
| ∑low MW phth.metab | ||||||
| ≤4.2 | ref | ref | ref | |||
| >4.2 and ≤0.46 | 1.14 (0.98, 1.33) | 1.00 (0.94, 1.05) | 1.05 (0.97, 1.13) | |||
| >10.46 | 1.04 (0.89, 1.22) | 1.01 (0.95, 1.07) | 1.03 (0.95, 1.11) | |||
| ∑high MW phth.metab | ||||||
| ≤9.22 | ref | ref | ref | |||
| >9.22 and ≤13.43 | 1.01 (0.86, 1.17) | 1.04 (0.98, 1.10) | 1.02 (0.95, 1.10) | |||
| >13.43 | 0.96 (0.83, 1.12) | 1.00 (0.94, 1.05) | 0.98 (0.91, 1.06) | |||
| ∑all phth.metab | ||||||
| ≤17.39 | ref | ref | ref | |||
| >17.39 and ≤28.0 | 1.01 (0.87, 1.17) | 1.03 (0.97, 1.08) | 1.02 (0.95, 1.10) | |||
| >28.0 | 1.02 (0.87, 1.19) | 1.02 (0.96, 1.08) | 1.02 (0.95, 1.11) | |||
Publisher’s Note: MDPI stays neutral with regard to jurisdictional claims in published maps and institutional affiliations. |
© 2021 by the authors. Licensee MDPI, Basel, Switzerland. This article is an open access article distributed under the terms and conditions of the Creative Commons Attribution (CC BY) license (https://creativecommons.org/licenses/by/4.0/).
Share and Cite
Berman, Y.E.; Doherty, D.A.; Main, K.M.; Frederiksen, H.; Hickey, M.; Keelan, J.A.; Newnham, J.P.; Hart, R.J. Associations between Prenatal Exposure to Phthalates and Timing of Menarche and Growth and Adiposity into Adulthood: A Twenty-Years Birth Cohort Study. Int. J. Environ. Res. Public Health 2021, 18, 4725. https://0-doi-org.brum.beds.ac.uk/10.3390/ijerph18094725
Berman YE, Doherty DA, Main KM, Frederiksen H, Hickey M, Keelan JA, Newnham JP, Hart RJ. Associations between Prenatal Exposure to Phthalates and Timing of Menarche and Growth and Adiposity into Adulthood: A Twenty-Years Birth Cohort Study. International Journal of Environmental Research and Public Health. 2021; 18(9):4725. https://0-doi-org.brum.beds.ac.uk/10.3390/ijerph18094725
Chicago/Turabian StyleBerman, Ye’elah E., Dorota A. Doherty, Katharina M. Main, Hanne Frederiksen, Martha Hickey, Jeffrey A. Keelan, John P. Newnham, and Roger J. Hart. 2021. "Associations between Prenatal Exposure to Phthalates and Timing of Menarche and Growth and Adiposity into Adulthood: A Twenty-Years Birth Cohort Study" International Journal of Environmental Research and Public Health 18, no. 9: 4725. https://0-doi-org.brum.beds.ac.uk/10.3390/ijerph18094725