
Energy Absorption in Actual Tractor Rollovers with Different Tire Configurations


Abstract
:1. Introduction
2. Materials and Methods
2.1. Experiment Design
2.2. Data Acquisition
2.3. Trilateration of Load Cell Trajectory
2.4. Silent-Block Support System
3. Results
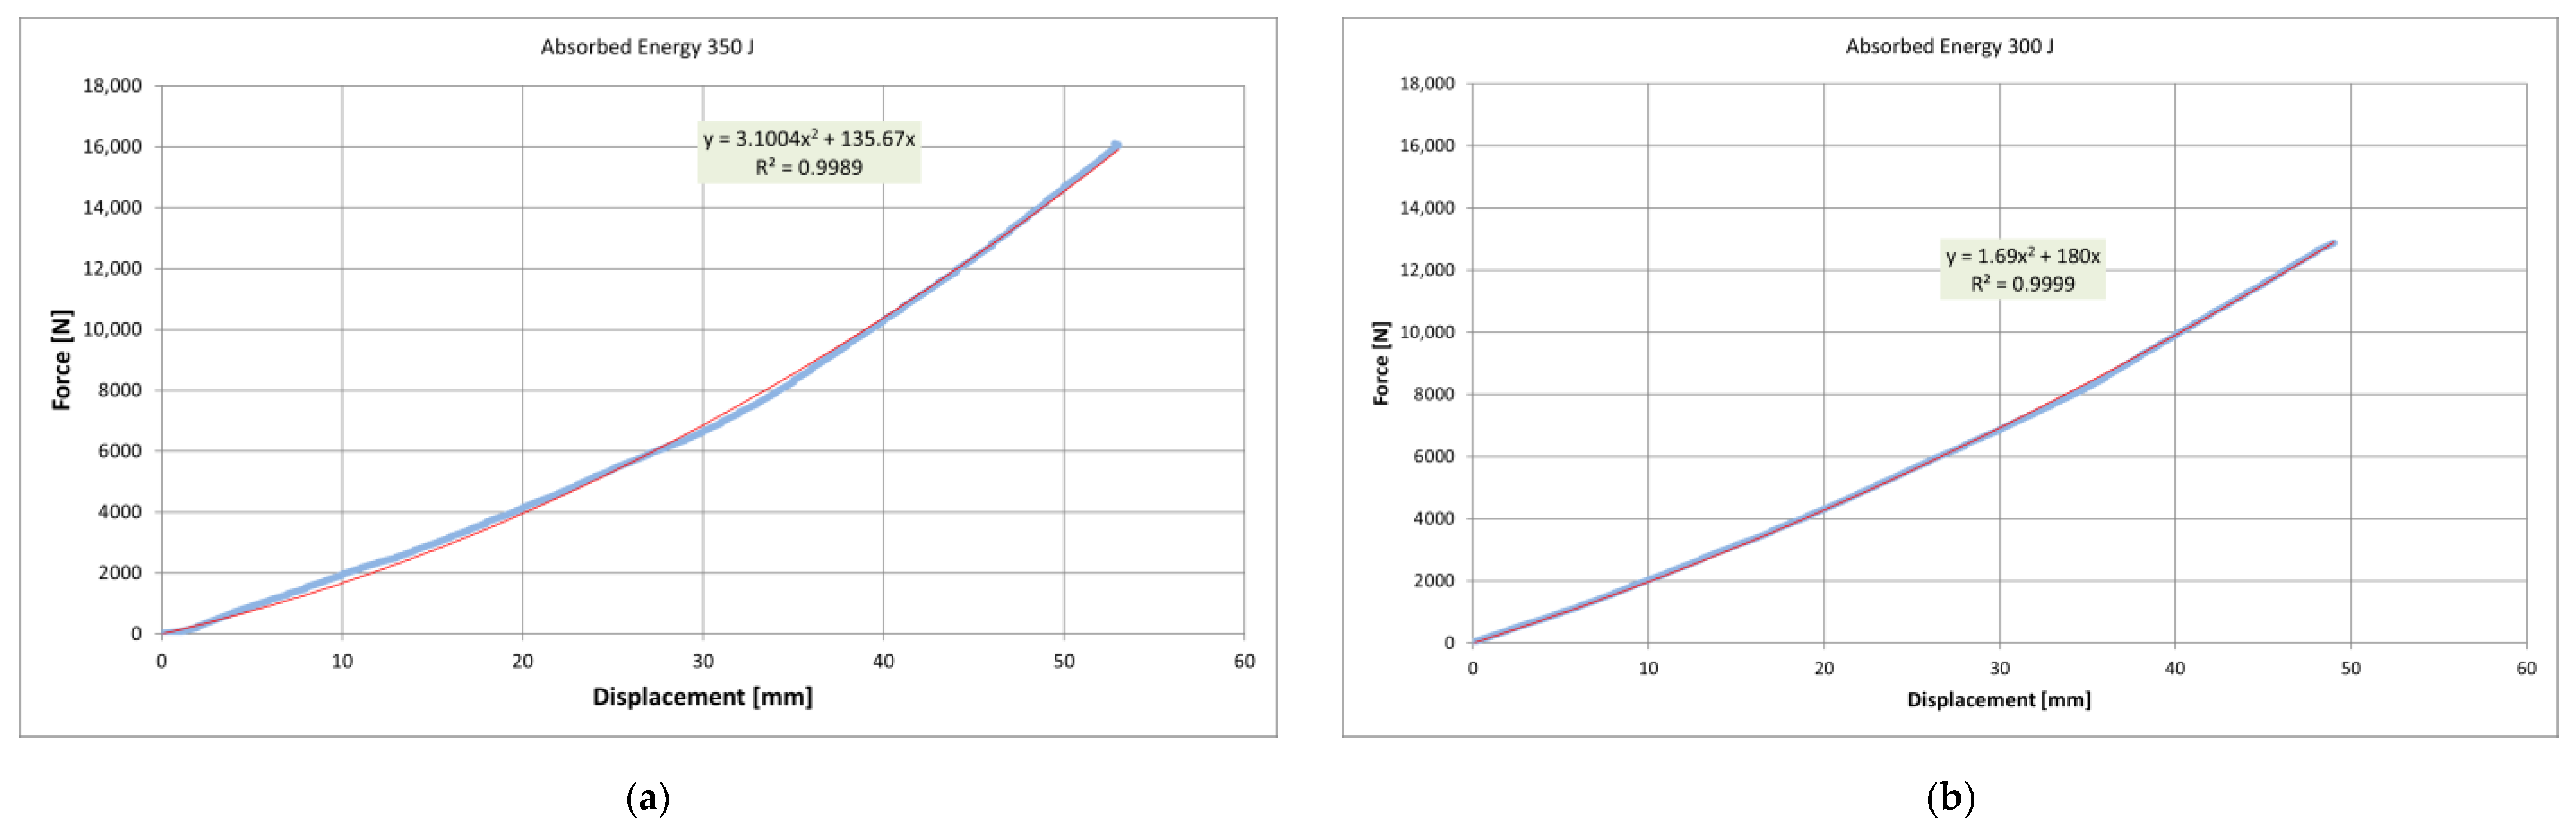
3.1. ROPS Energy Absorption
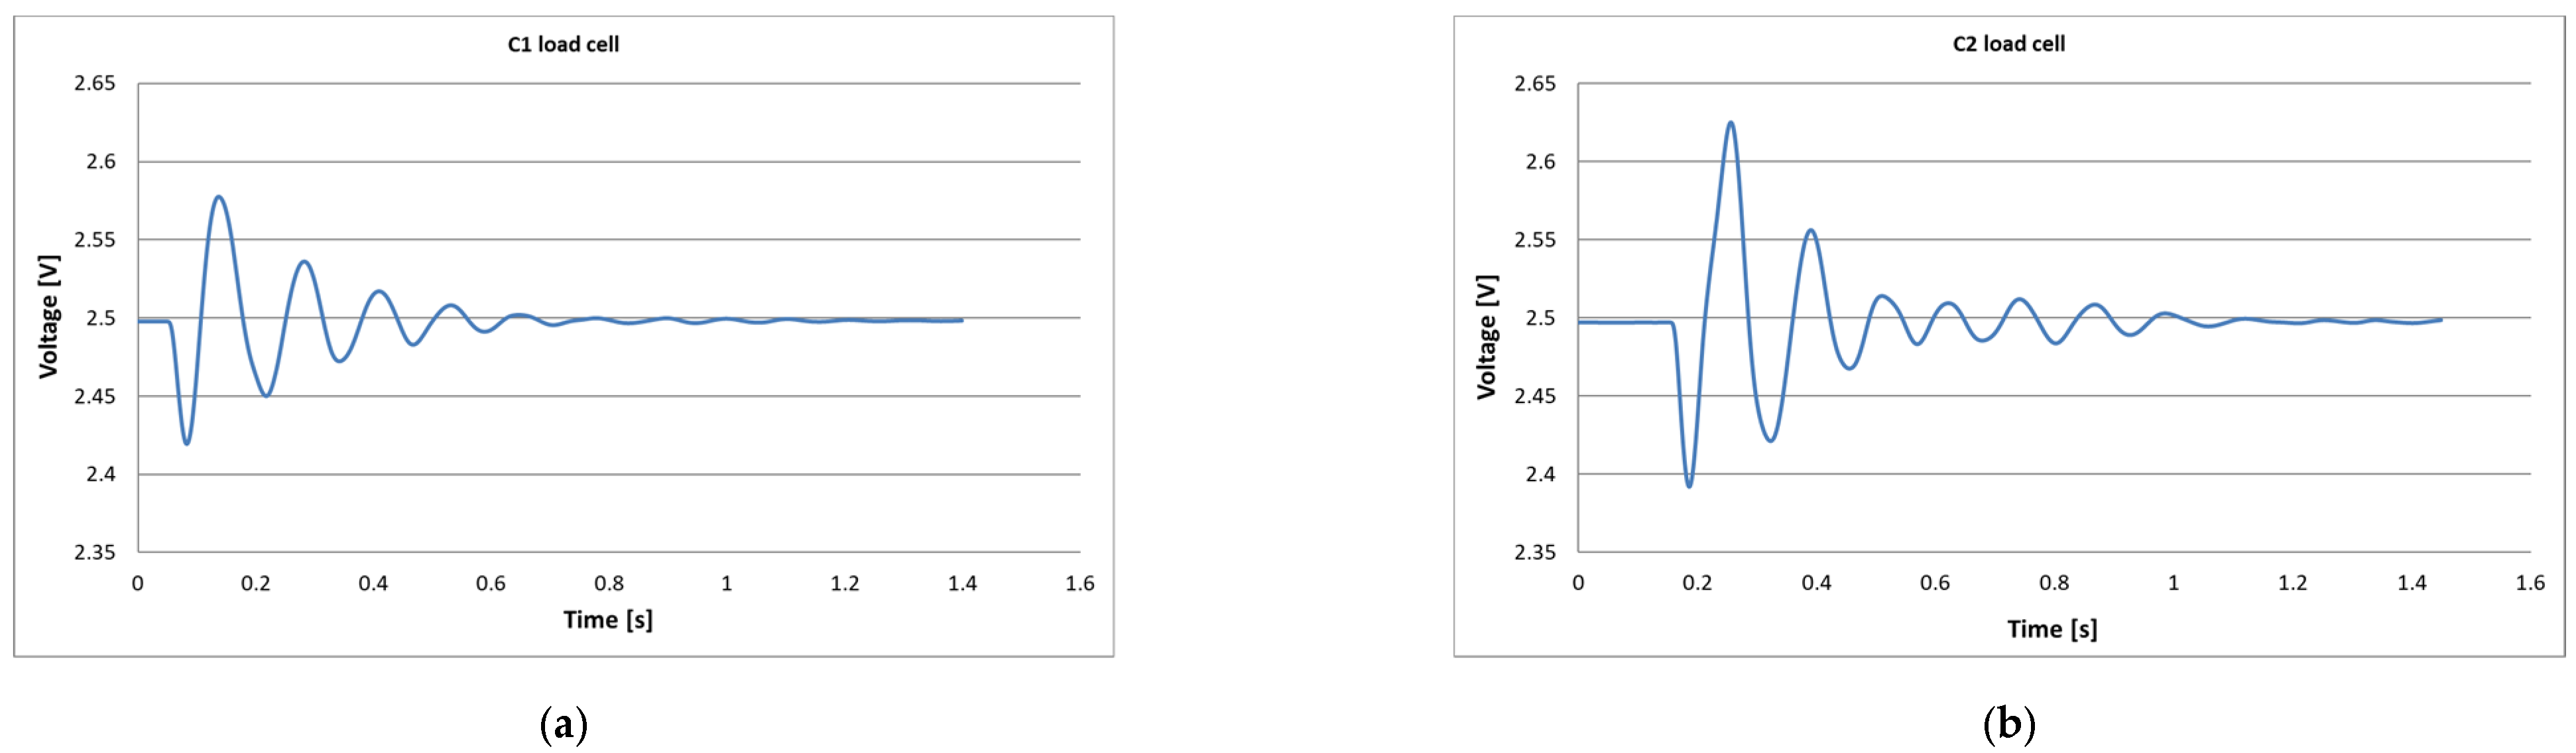
3.2. Silent-Blocks’ Energy Absorption
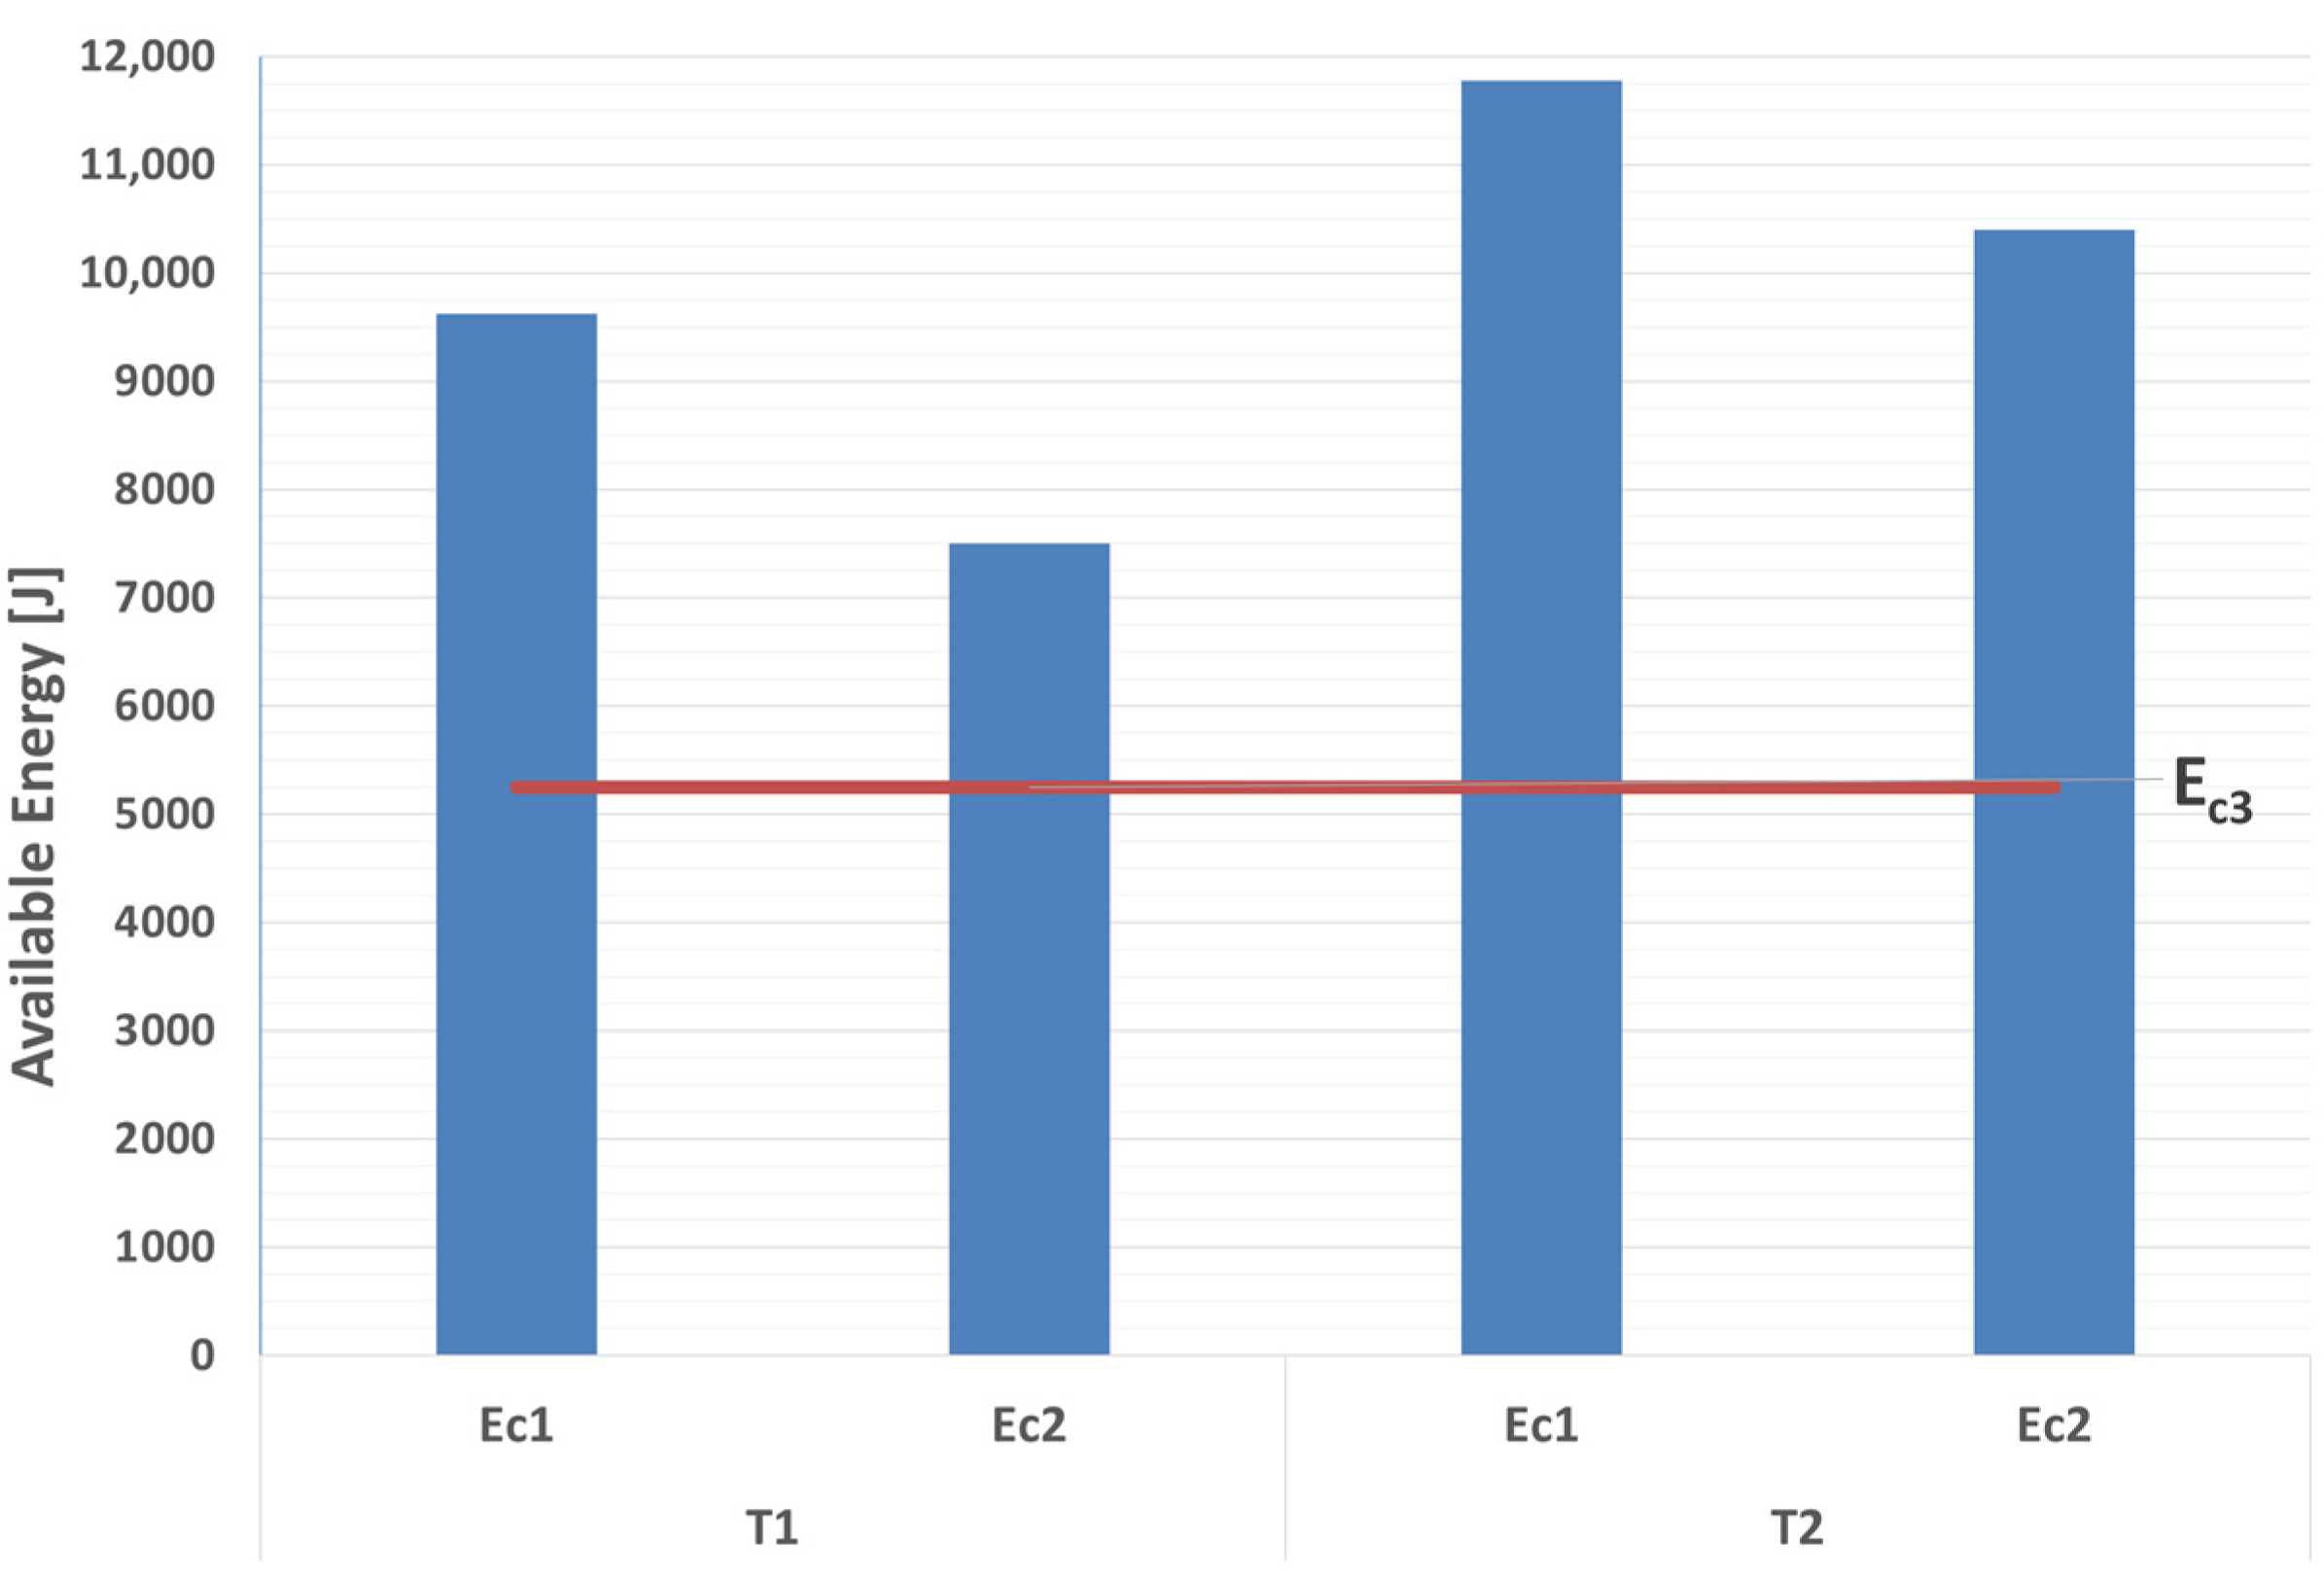
3.3. Tractor Available Energy
4. Discussion
5. Conclusions
Author Contributions
Funding
Acknowledgments
Conflicts of Interest
References
- Harris, J.R.; McKenzie, E.A., Jr.; Etherton, J.R.; Cantis, D.M.; Ronaghi, M. ROPS Performance during Field Upset and Static Testing. J. Agric. Saf. Health 2010, 16, 5–18. [Google Scholar] [CrossRef] [PubMed]
- Arana, I.; Mangado, J.; Arnal, P.; Arazuri, S.; Alfaro, J.R.; Jaren, C. Evaluation of risk factors in fatal accidents in agriculture. Span. J. Agric. Res. 2010, 8, 592. [Google Scholar] [CrossRef] [Green Version]
- Pessina, D.; Facchinetti, D. A survey on Fatal Accidents for Overturning of Agricultural Tractors in Italy. Chem. Eng. Trans. 2017, 58, 79–84. [Google Scholar] [CrossRef]
- Rondelli, V.; Casazza, C.; Martelli, R. Tractor rollover fatalities, analyzing accident scenario. J. Saf. Res. 2018, 67, 99–106. [Google Scholar] [CrossRef] [PubMed]
- Moberg, H.A. Dynamic Testing of Tractor Protection Cabs—Development of Method, Practical Experiences. In Proceedings of the National Combined Farm Construction and Industrial Machinery and Fuels and Lubricants Meetings, New York, NY, USA, 13 September 1973. [Google Scholar]
- Chisholm, C.J. A mathematical model of tractor overturning and impact behaviour. J. Agric. Eng. Res. 1979, 24, 375–394. [Google Scholar] [CrossRef]
- Chisholm, C.J. Experimental validation of a tractor overturning simulation. J. Agric. Eng. Res. 1979, 24, 395–415. [Google Scholar] [CrossRef]
- Chisholm, C.J. Analysis of rigid-body motion from cine film measurements. J. Agric. Eng. Res. 1979, 24, 441–446. [Google Scholar] [CrossRef]
- Chisholm, C.J. The effect of parameter variation on tractor overturning and impact behaviour. J. Agric. Eng. Res. 1979, 24, 417–440. [Google Scholar] [CrossRef]
- Schwanghart, H. Berechnungsmethode fur das unsturzverhalten eines achrschleppers am hang (Method for Calculating the Overturning Behaviour of Tractors on Slopes). Grundl. Landtech. 1973, 23, 170–176. [Google Scholar]
- Schwanghart, H. Umsturzverhalten von Traktoren und Auswirkungen auf die Schutzvorrichtungen und die Sicherheit (Rollover Tractor Behaviour, Impact on the Protective Devices and Safety); Lehrstuhl für Landmaschinen: Munich, Germany, 1982. [Google Scholar]
- OECD Standard Codes for the Official Testing of Roll-Over Protective Structures on Agricultural and Forestry Tractors. Organisation for the Economic Co-Operation and Development, Paris, France. Available online: www.oecd.org/agriculture/tractor/codes (accessed on 1 March 2021).
- Guzzomi, A.L.; Rondelli, V.; Capacci, E. Operator protection in rollover events of articulated narrow track tractors. Biosyst. Eng. 2019, 185, 103–115. [Google Scholar] [CrossRef]
- OECD AGR/CA/T(2007)7. Progress report of the scientific working group on maximum laden masses of agricultural tractors in relation with protective structure tests. In Proceedings of the OECD, Organisation for the Economic Co-Operation and Development, Paris, France, 27–28 February 2007. [Google Scholar]
- Rondelli, V.; Guzzomi, A.L. Selecting ROPS safety margins for wheeled agricultural tractors based on tractor mass. Biosyst. Eng. 2010, 105, 402–410. [Google Scholar] [CrossRef]
- Guzzomi, A.; Rondelli, V. Narrow-Track Wheeled Agricultural Tractor Parameter Variation. J. Agric. Saf. Health 2013, 19, 237–260. [Google Scholar] [CrossRef]
- Franceschetti, B.; Capacci, E.; Rondelli, V. Effects of Rubber Tracks on Narrow-Track Tractors on the Non-Continuous Rolling Prediction Model. J. Agric. Saf. Health 2016, 22, 262–273. [Google Scholar] [CrossRef] [Green Version]
- Franceschetti, B.; Lenain, R.; Rondelli, V. Comparison between a rollover tractor dynamic model and actual lateral tests. Biosyst. Eng. 2014, 127, 79–91. [Google Scholar] [CrossRef]
- Franceschetti, B.; Rondelli, V.; Ciuffoli, A. Comparing the influence of Roll-Over Protective Structure type on tractor lateral stability. Saf. Sci. 2019, 115, 42–50. [Google Scholar] [CrossRef]
- Pessina, D.; Facchinetti, D.; Giordano, D.M. Narrow-Track Agricultural Tractors: A Survey on the Load of the Hand-Operated Foldable Rollbar. J. Agric. Saf. Health 2016, 22, 275–284. [Google Scholar] [CrossRef] [PubMed] [Green Version]
- Khorsandi, F.; Ayers, P.D.; Jackson, D.L.; Wilkerson, J. The Effect of Speed on Foldable ROPS Actuation Forces. J. Agric. Saf. Health 2016, 22, 285–298. [Google Scholar] [CrossRef] [PubMed] [Green Version]
- Ayers, P.; Khorsandi, F.; Wang, X.; Araujo, G. ROPS designs to protect operators during agricultural tractor rollovers. J. Terramechanics 2018, 75, 49–55. [Google Scholar] [CrossRef] [PubMed]
- Franceschetti, B.; Rondelli, V. Models to predict the force to operate front foldable rollover protective structures for narrow-track tractors. Biosyst. Eng. 2019, 185, 126–134. [Google Scholar] [CrossRef]
- Caffaro, F.; Micheletti Cremasco, M.; Giustetto, A.; Vigoroso, L.; Paletto, G.; Cavallo, E. Ergonomics in Agriculture: Critical Postures, Gestures, and Perceived Effort in Handling Foldable Roll-Over Protective Structures (ROPS) Fitted on Tractors. In Proceedings of the 20th Congress of the International Ergonomics Association (IEA 2018); Bagnara, S., Tartaglia, R., Albolino, S., Alexander, T., Fujita, Y., Eds.; Springer: Cham, Switzerland; Volume 819. [CrossRef]
- Micheletti Cremasco, M.; Caffaro, F.; Giustetto, A.; Vigoroso, L.; Paletto, G.; Cavallo, E. Tractor Rollover Protection: Is the Incorrect Use of Foldable Rollover Protective Structures Due to Human or to Technical Issues? Hum. Factors 2020, 62, 64–76. [Google Scholar] [CrossRef]
- OECD TAD/CA/T/RD (2009)5. Progress report and outlook of the scientific working group on improvement of standard for Roll-over protective structures. In Proceedings of the OECD Organisation for the Economic Co-Operation and Development, Paris, France, 24–25 February 2009. [Google Scholar]
- Guzzomi, A.L.; Rondelli, V.; Guarnieri, A.; Molari, G.; Molari, P.G. Available energy during the rollover of narrow-track wheeled agricultural tractors. Biosyst. Eng. 2009, 104, 318–323. [Google Scholar] [CrossRef]
- Guzzomi, A.L.; Rondelli, V.; Capacci, E.; Guarnieri, A.; Molari, G. Modern Tractor Rollover Test: Instrumentation Set-up and Preliminary Experimental Results. In Proceedings of the XXXIII CIOSTA CIGR V Conference, Reggio Calabria, Italy, 17–19 June 2009; Volume 2, pp. 993–997. [Google Scholar]
- OECD Code 7. OECD Standard Code for the Official Testing of Rear Mounted Roll-Over Protective Structures on Narrow-Track Wheeled Agricultural and Forestry Tractors, Organisation for the Economic Co-Operation and Development. Available online: www.oecd.org/agriculture/tractor/codes (accessed on 1 March 2021).
- Casini-Ropa, G. Attrezzatura e metodo per il rilievo da terra dell’altezza del baricentro delle machine agricole (Equipment and Methods for the Measurement of the Height from the Ground of the Center of Gravity on Agricultural Machinery). Riv. Ing. Agrar. 1976, 2, 81–85. [Google Scholar]
- Graff, K.F. Wave Motion in Elastic Solids; Oxford University Press: Oxford, UK, 1975. [Google Scholar]
- O’Neil, P.V. Advanced Engineering Mathematics, 7th ed.; Cengace Learning: Stamford, CT, USA, 2011. [Google Scholar]
- Meirovitch, L. Elements of Vibration Analysis, 2nd ed.; McGraw-Hill: New York, NY, USA, 1986. [Google Scholar]
- Guzzomi, A.L.; Sharman, A.; Stone, B.J. Some torsional stiffness and damping characteristics of a small pneumatic tyre and the implications for powertrain dynamics. Proc. Inst. Mech. Eng. Part D J. Automob. Eng. 2010, 224, 229–244. [Google Scholar] [CrossRef]
- Norton, M.P. Fundamentals of Noise and Vibration Analysis for Engineers; Cambridge University Press: Cambridge, UK, 1989. [Google Scholar]


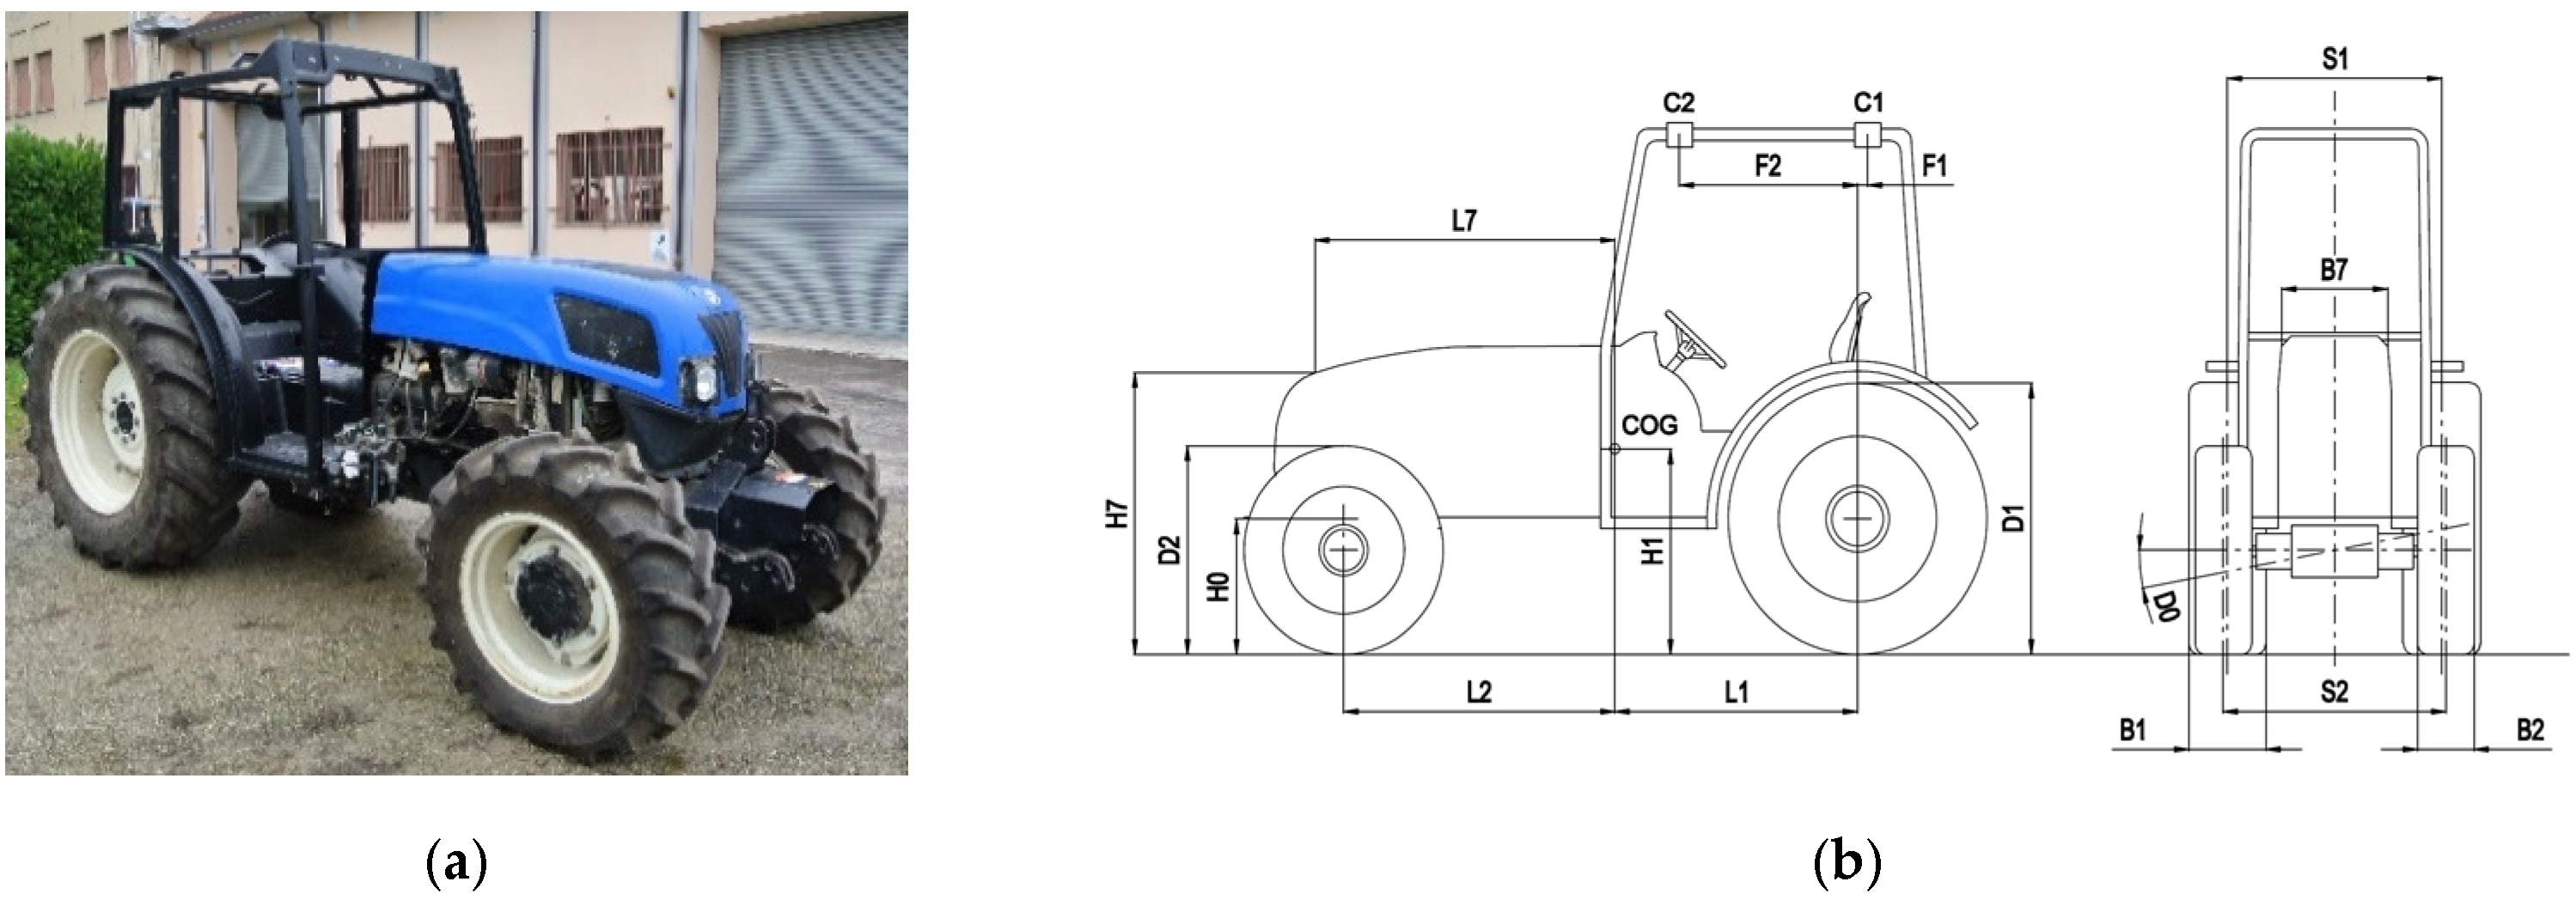
| Tractor Parameter | T1 Value | T2 Value | Unit |
|---|---|---|---|
| Rear tire size | 420/70R30 | 270/95R36 | |
| Front tire size | 320/70R20 | 11.2R24 | |
| Rear tire overall diameter (D1) | 1.398 | 1.428 | M |
| Front tire overall diameter (D2) | 0.982 | 1.095 | M |
| Rear external base (B1) | 1.620 | 1.290 | M |
| Front external base (B2) | 1.568 | 1.314 | M |
| Rear wheel track (S1) | 1.202 | 1.015 | M |
| Front wheel track (S2) | 1.249 | 1.030 | M |
| Wheelbase (L1 + L2) | 2.450 | 2.450 | M |
| Engine bonnet width (B7) | 0.450 | 0.450 | M |
| Engine bonnet height (H7) | 1.310 | 1.366 | M |
| Front-axle swing angle from zero position to end of travel (D0) | 0.140 | 0.140 | Rad |
| Height of front-axle pivot point (H0) | 0.600 | 0.656 | M |
| Height of COG (H1) | 0.795 | 0.828 | M |
| Horizontal distance COG—front-axle (L2) | 1.436 | 1.427 | M |
| Horizontal distance COG—rear-axle (L1) | 1.014 | 1.023 | M |
| Horizontal distance between the COG and the front corner of the engine bonnet (L7) | 1.520 | 1.520 | M |
| Moment of inertia about the longitudinal axis through the COG (I) | 673.6 | 608.7 | kg m2 |
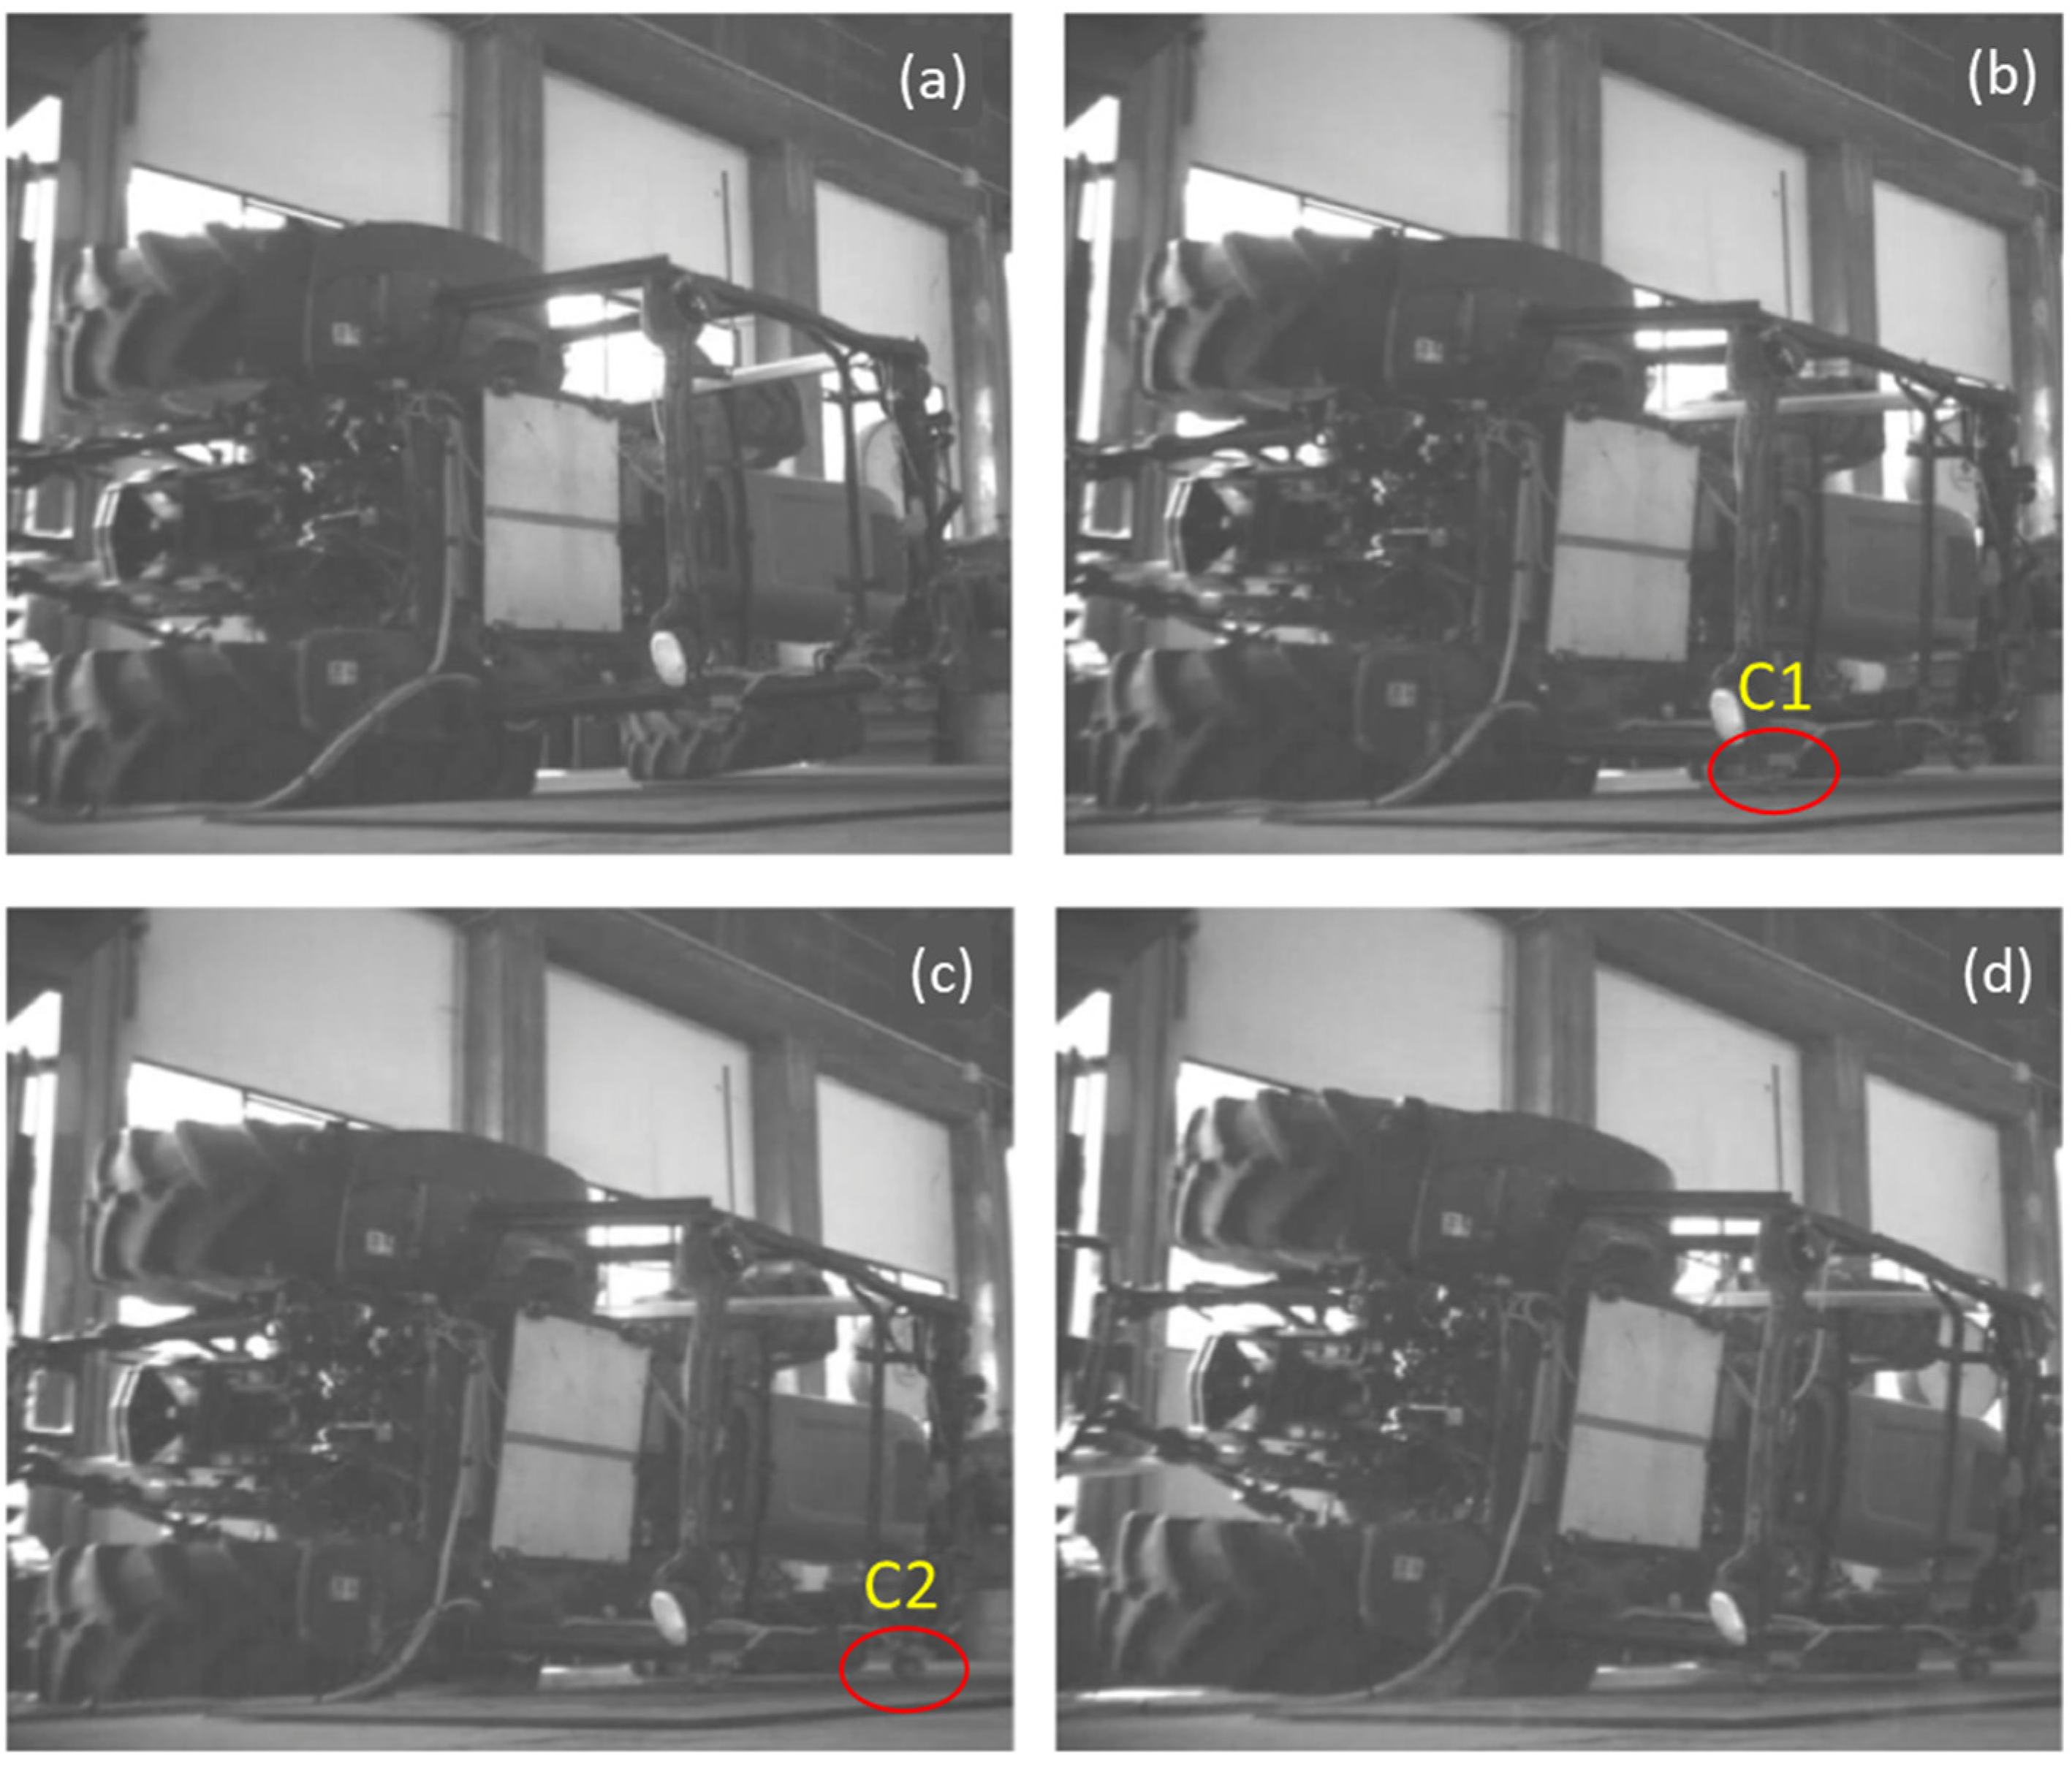
| ROPS height at the point of impact (C1 cell) | 2.119 | 2.123 | M |
| ROPS height at the point of impact (C2 cell) | 2.150 | 2.175 | M |
| Horizontal distance C1—rear-axle (F2) | 0.038 | 0.038 | M |
| Horizontal distance C2—rear-axle (F1) | 0.930 | 0.930 | M |
| Tractor mass (m) | 2990 | 2988 | Kg |
| REF | QTY | Instrument | Purpose | Specifications |
|---|---|---|---|---|
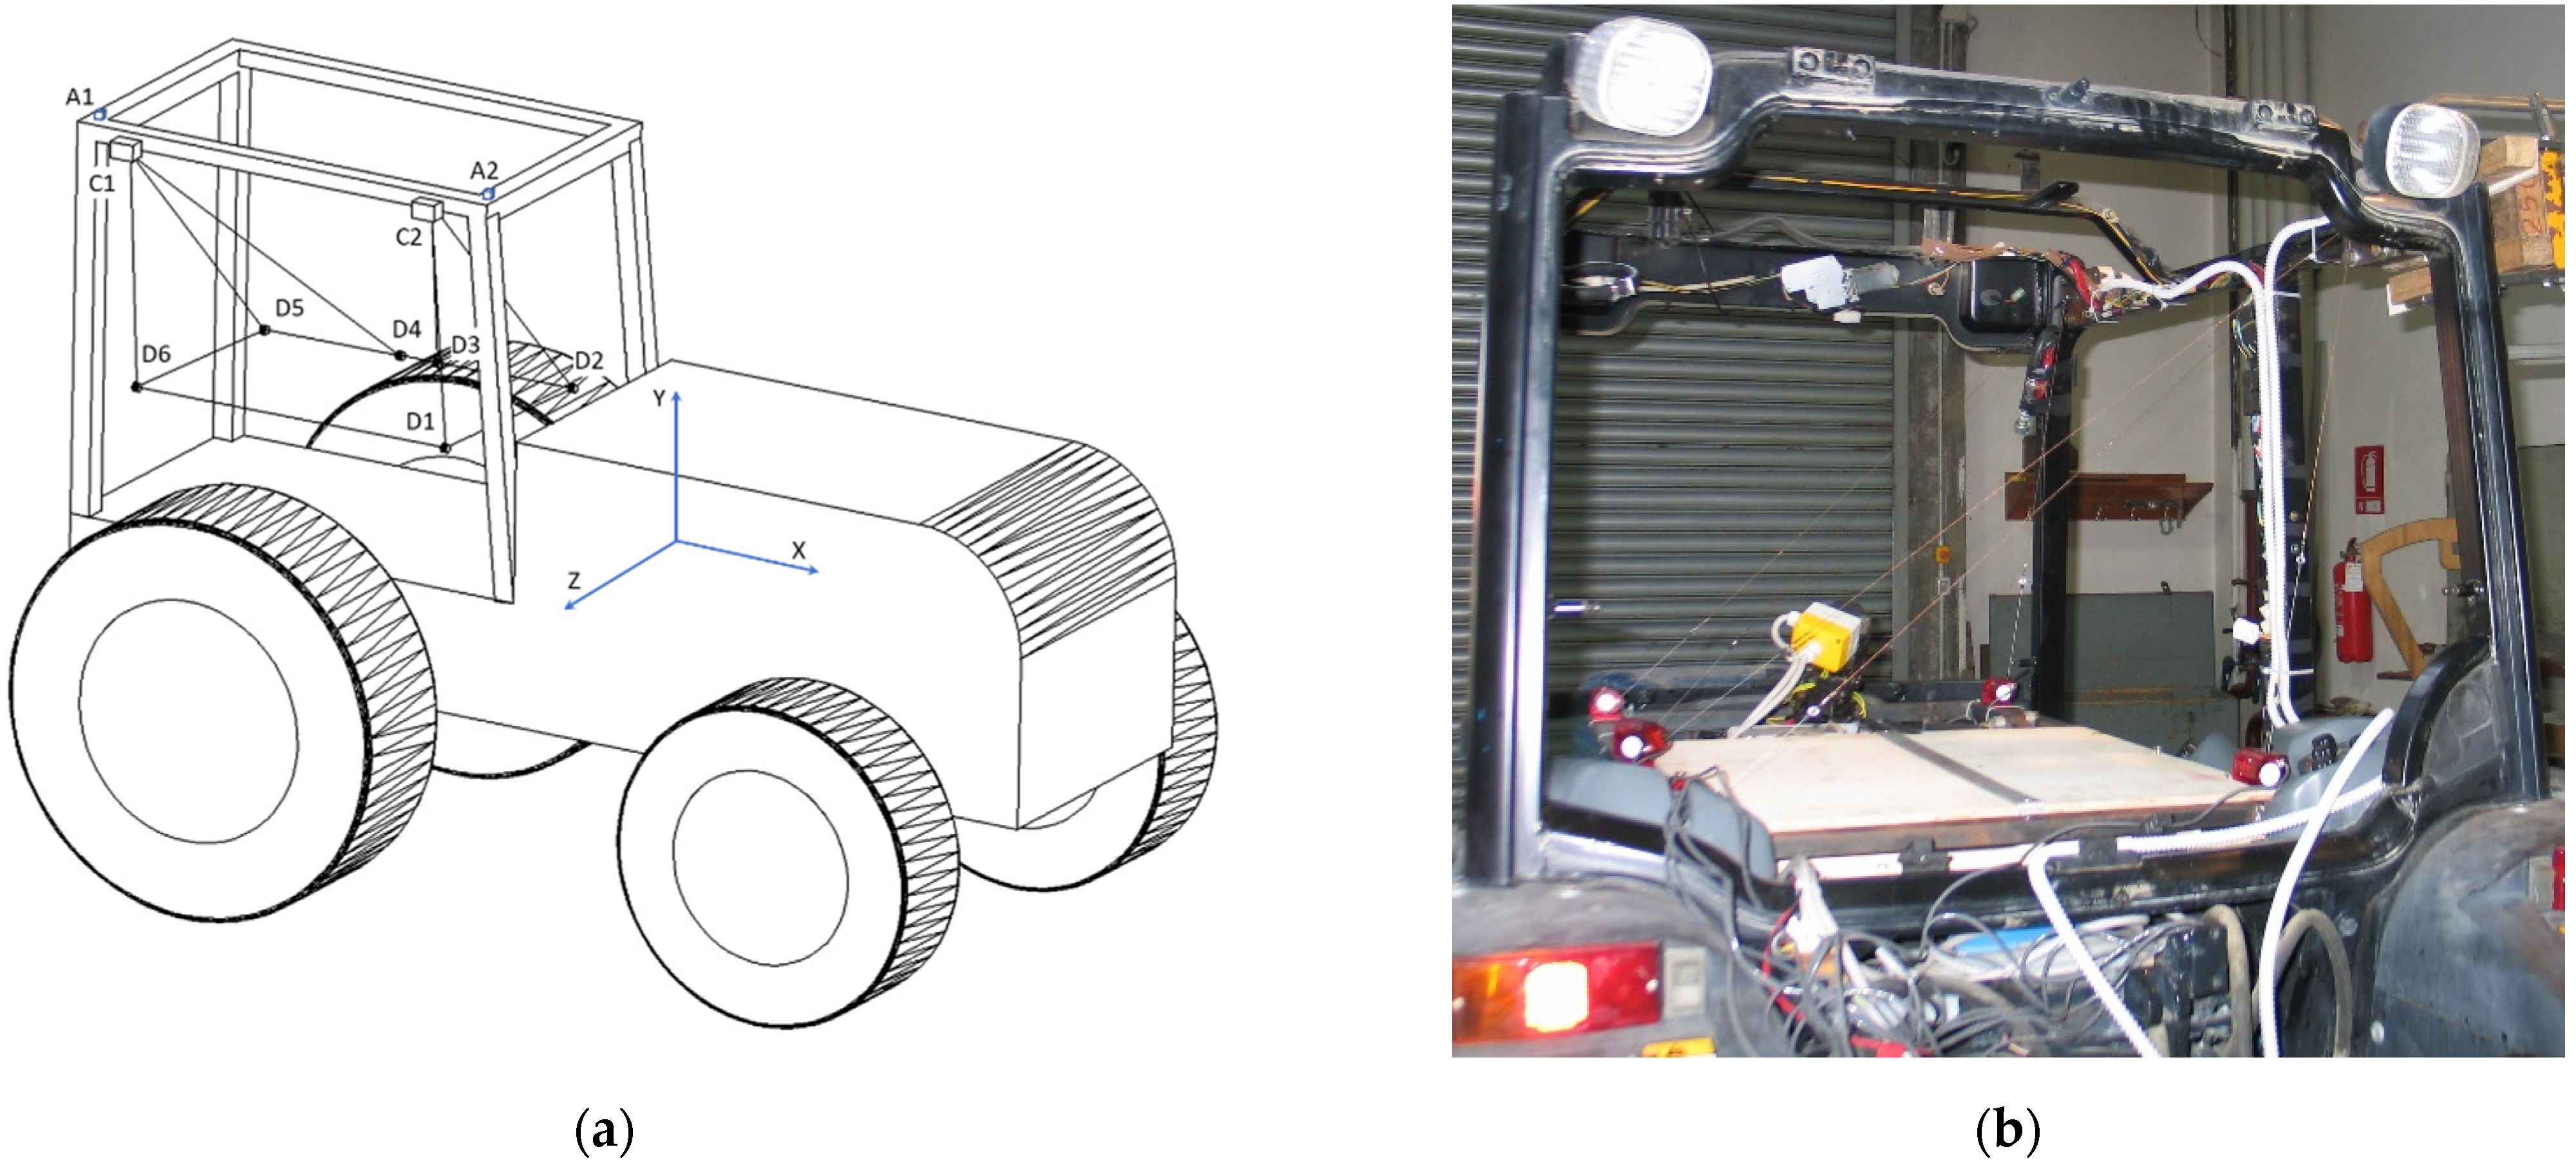
| A1, A2 | 2 | 3DOF piezoelectric accelerometers | measure components of acceleration in two locations | acc. range ± 500 g |
| C1, C2 | 2 | triaxial dynamic load cell | measure 3 perpendicular components of force | range Fx, Fy ± 20 kN, Fz ± 40 kN |
| D1-D6 | 6 | cable type linear dynamic 3 3 connected to each force transducer | measure displacement | range 228.6 mm max. cable acc. 136 g |
| - | 1 | onboard data acquisition unit | record accelerometer reading in the time domain | 65.536 kHz max. sampling rate |
Publisher’s Note: MDPI stays neutral with regard to jurisdictional claims in published maps and institutional affiliations. |
© 2021 by the authors. Licensee MDPI, Basel, Switzerland. This article is an open access article distributed under the terms and conditions of the Creative Commons Attribution (CC BY) license (https://creativecommons.org/licenses/by/4.0/).
Share and Cite
Capacci, E.; Franceschetti, B.; Guzzomi, A.; Rondelli, V. Energy Absorption in Actual Tractor Rollovers with Different Tire Configurations. Int. J. Environ. Res. Public Health 2021, 18, 6517. https://0-doi-org.brum.beds.ac.uk/10.3390/ijerph18126517
Capacci E, Franceschetti B, Guzzomi A, Rondelli V. Energy Absorption in Actual Tractor Rollovers with Different Tire Configurations. International Journal of Environmental Research and Public Health. 2021; 18(12):6517. https://0-doi-org.brum.beds.ac.uk/10.3390/ijerph18126517
Chicago/Turabian StyleCapacci, Enrico, Bruno Franceschetti, Andrew Guzzomi, and Valda Rondelli. 2021. "Energy Absorption in Actual Tractor Rollovers with Different Tire Configurations" International Journal of Environmental Research and Public Health 18, no. 12: 6517. https://0-doi-org.brum.beds.ac.uk/10.3390/ijerph18126517