
Helicopter Inside Cabin Acoustic Evaluation: A Case Study—IAR PUMA 330


Abstract
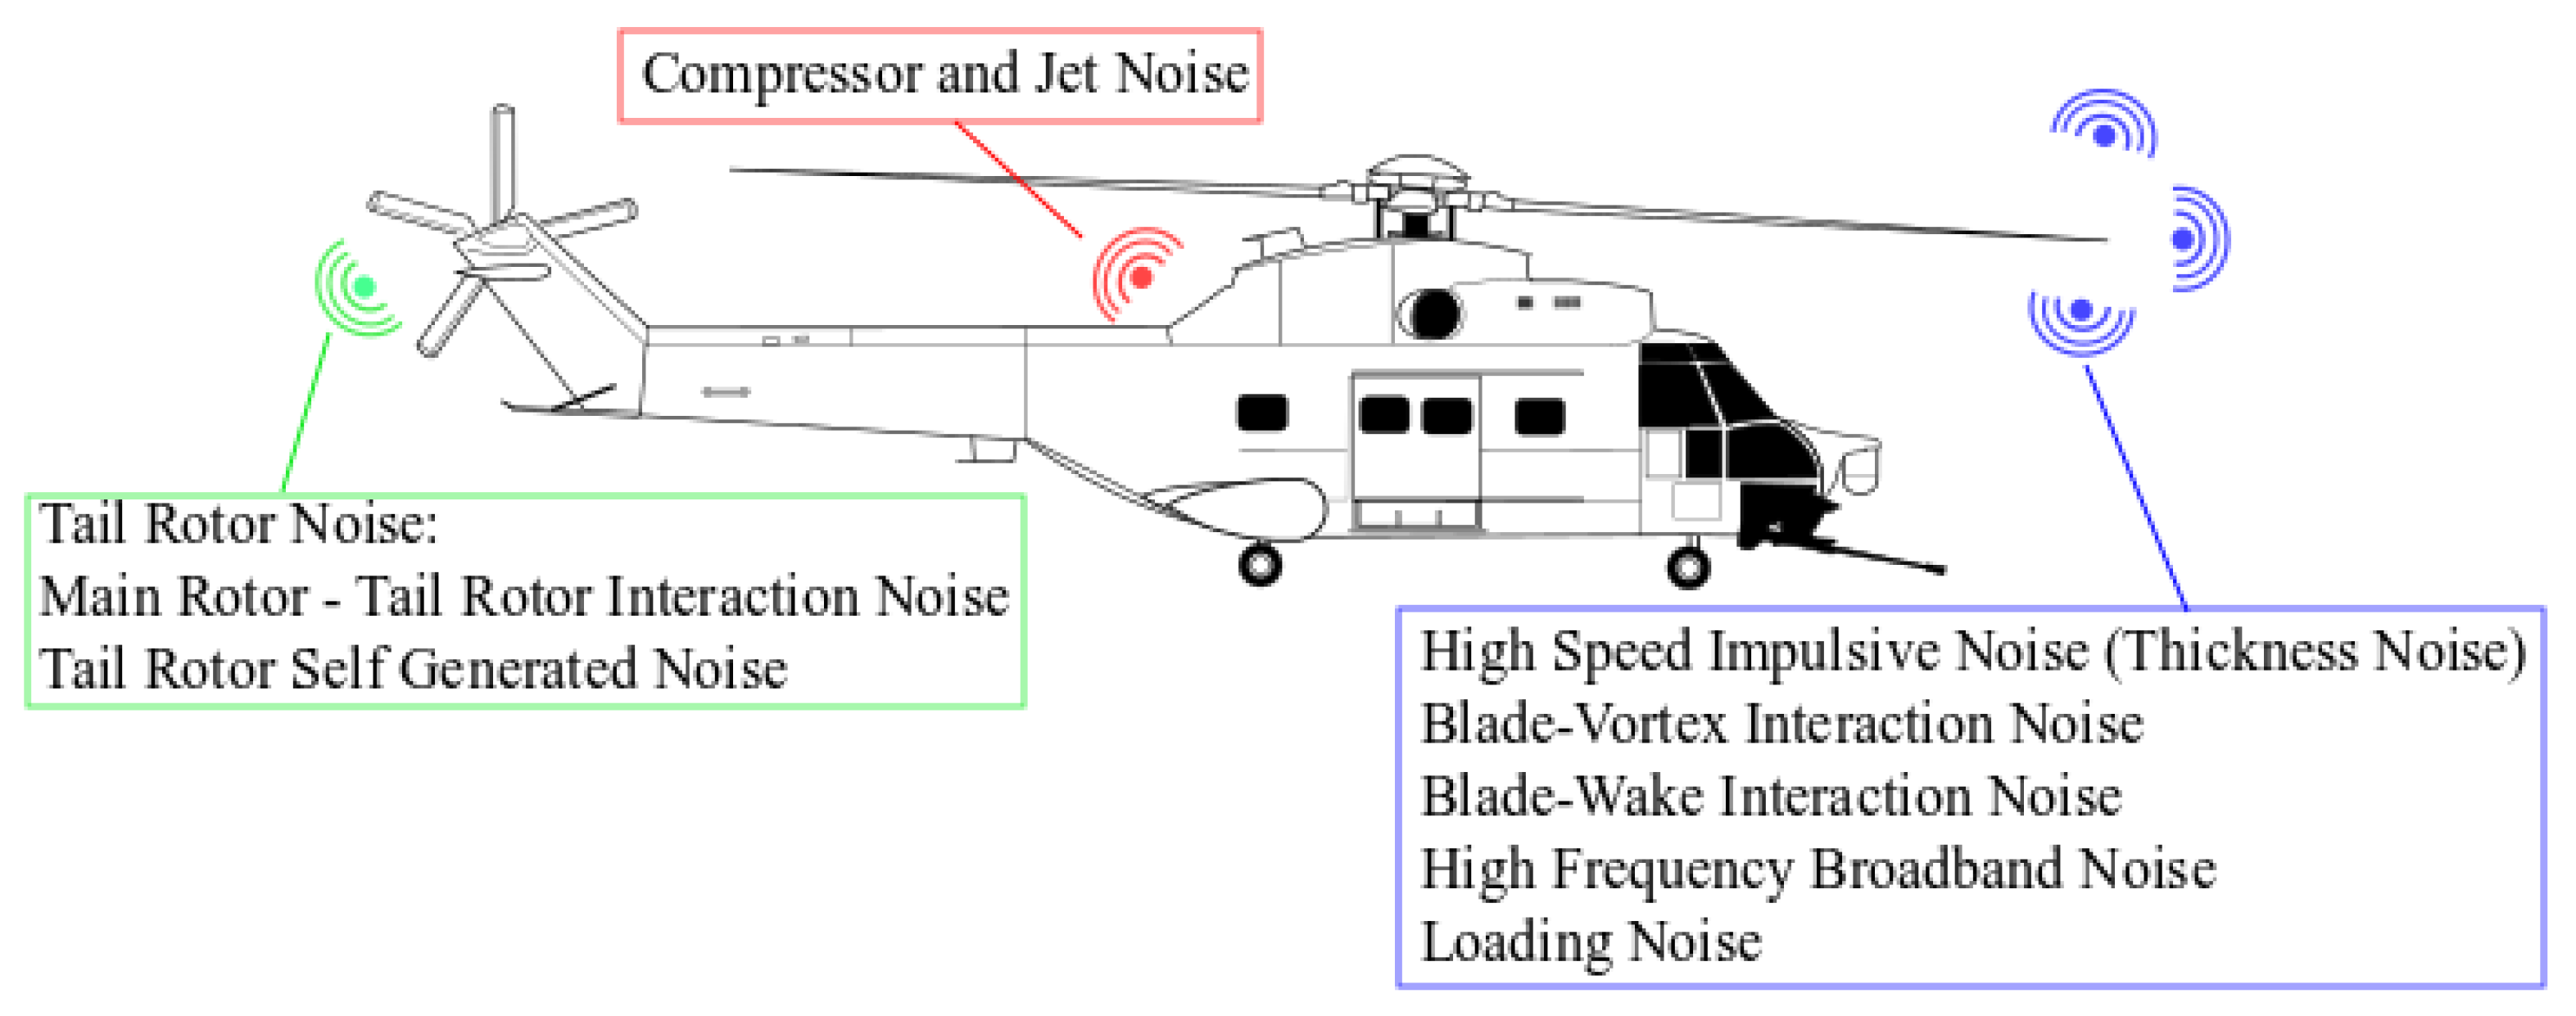
:1. Introduction
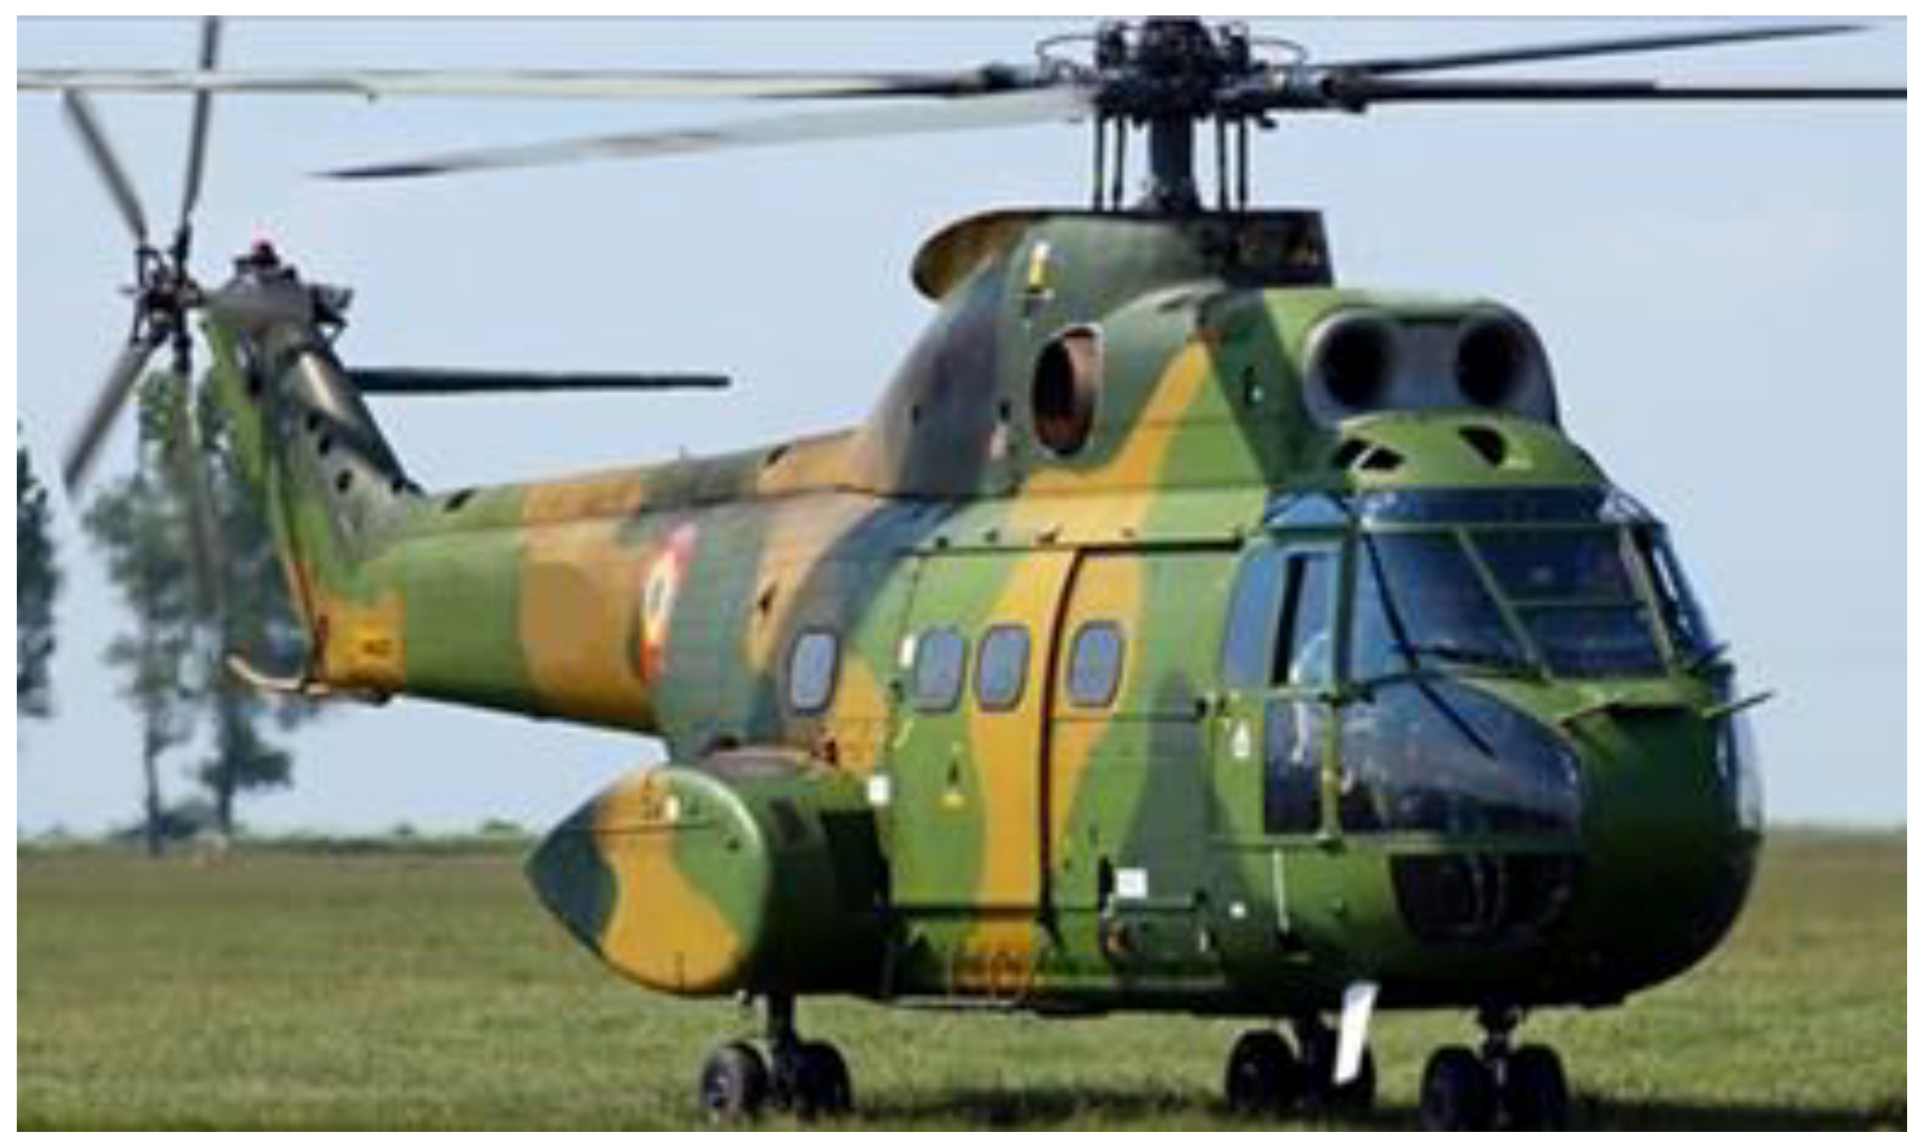
2. IAR PUMA 330 Helicopter Technical Description
3. Testing Procedures
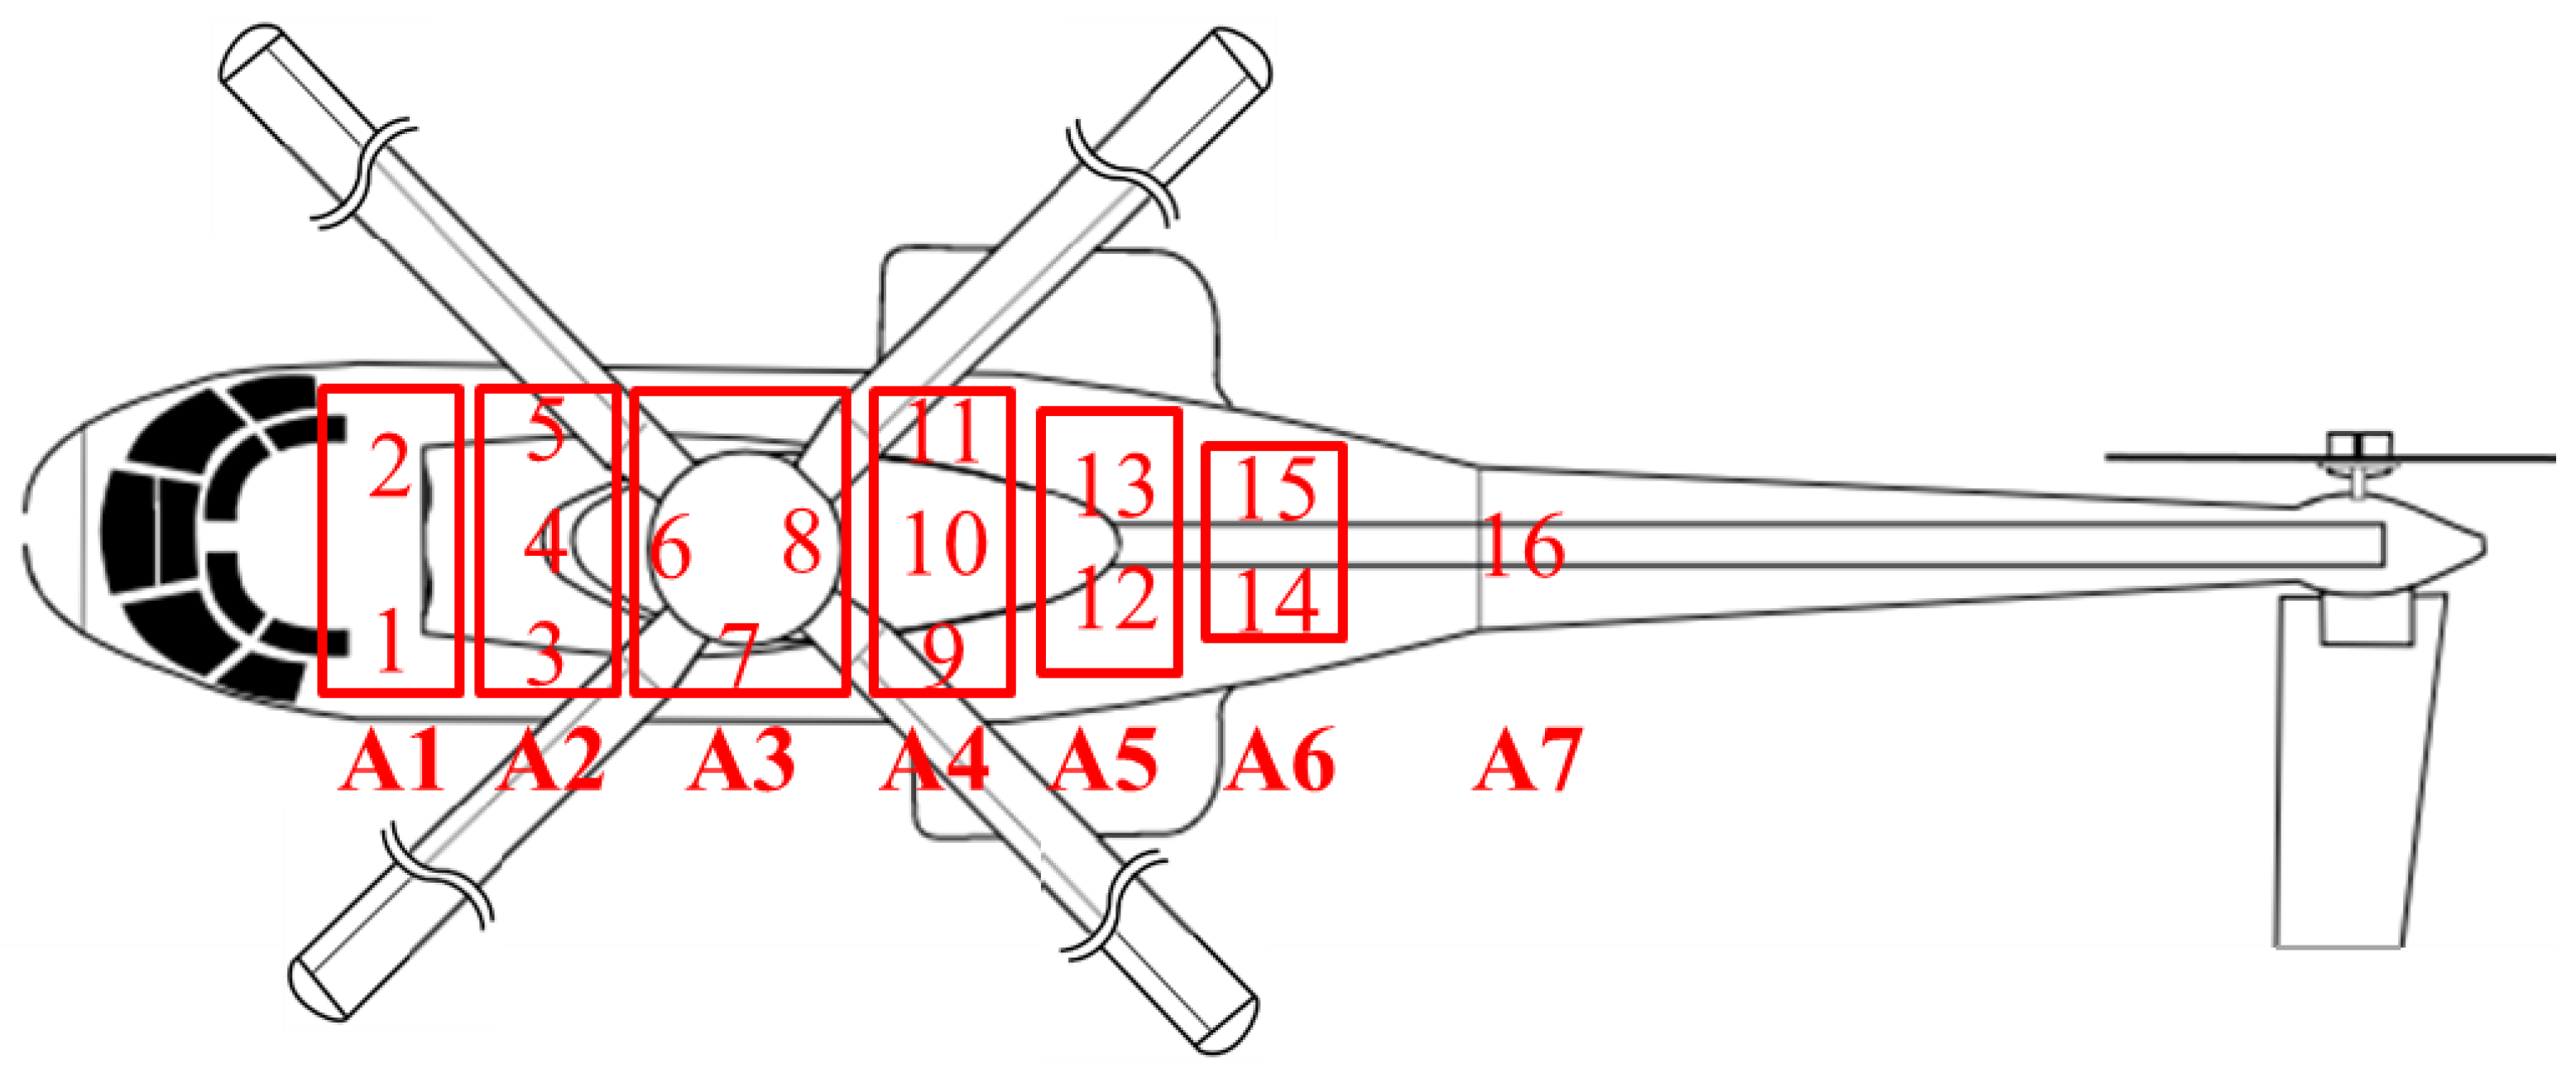
4. Measurement Campaign
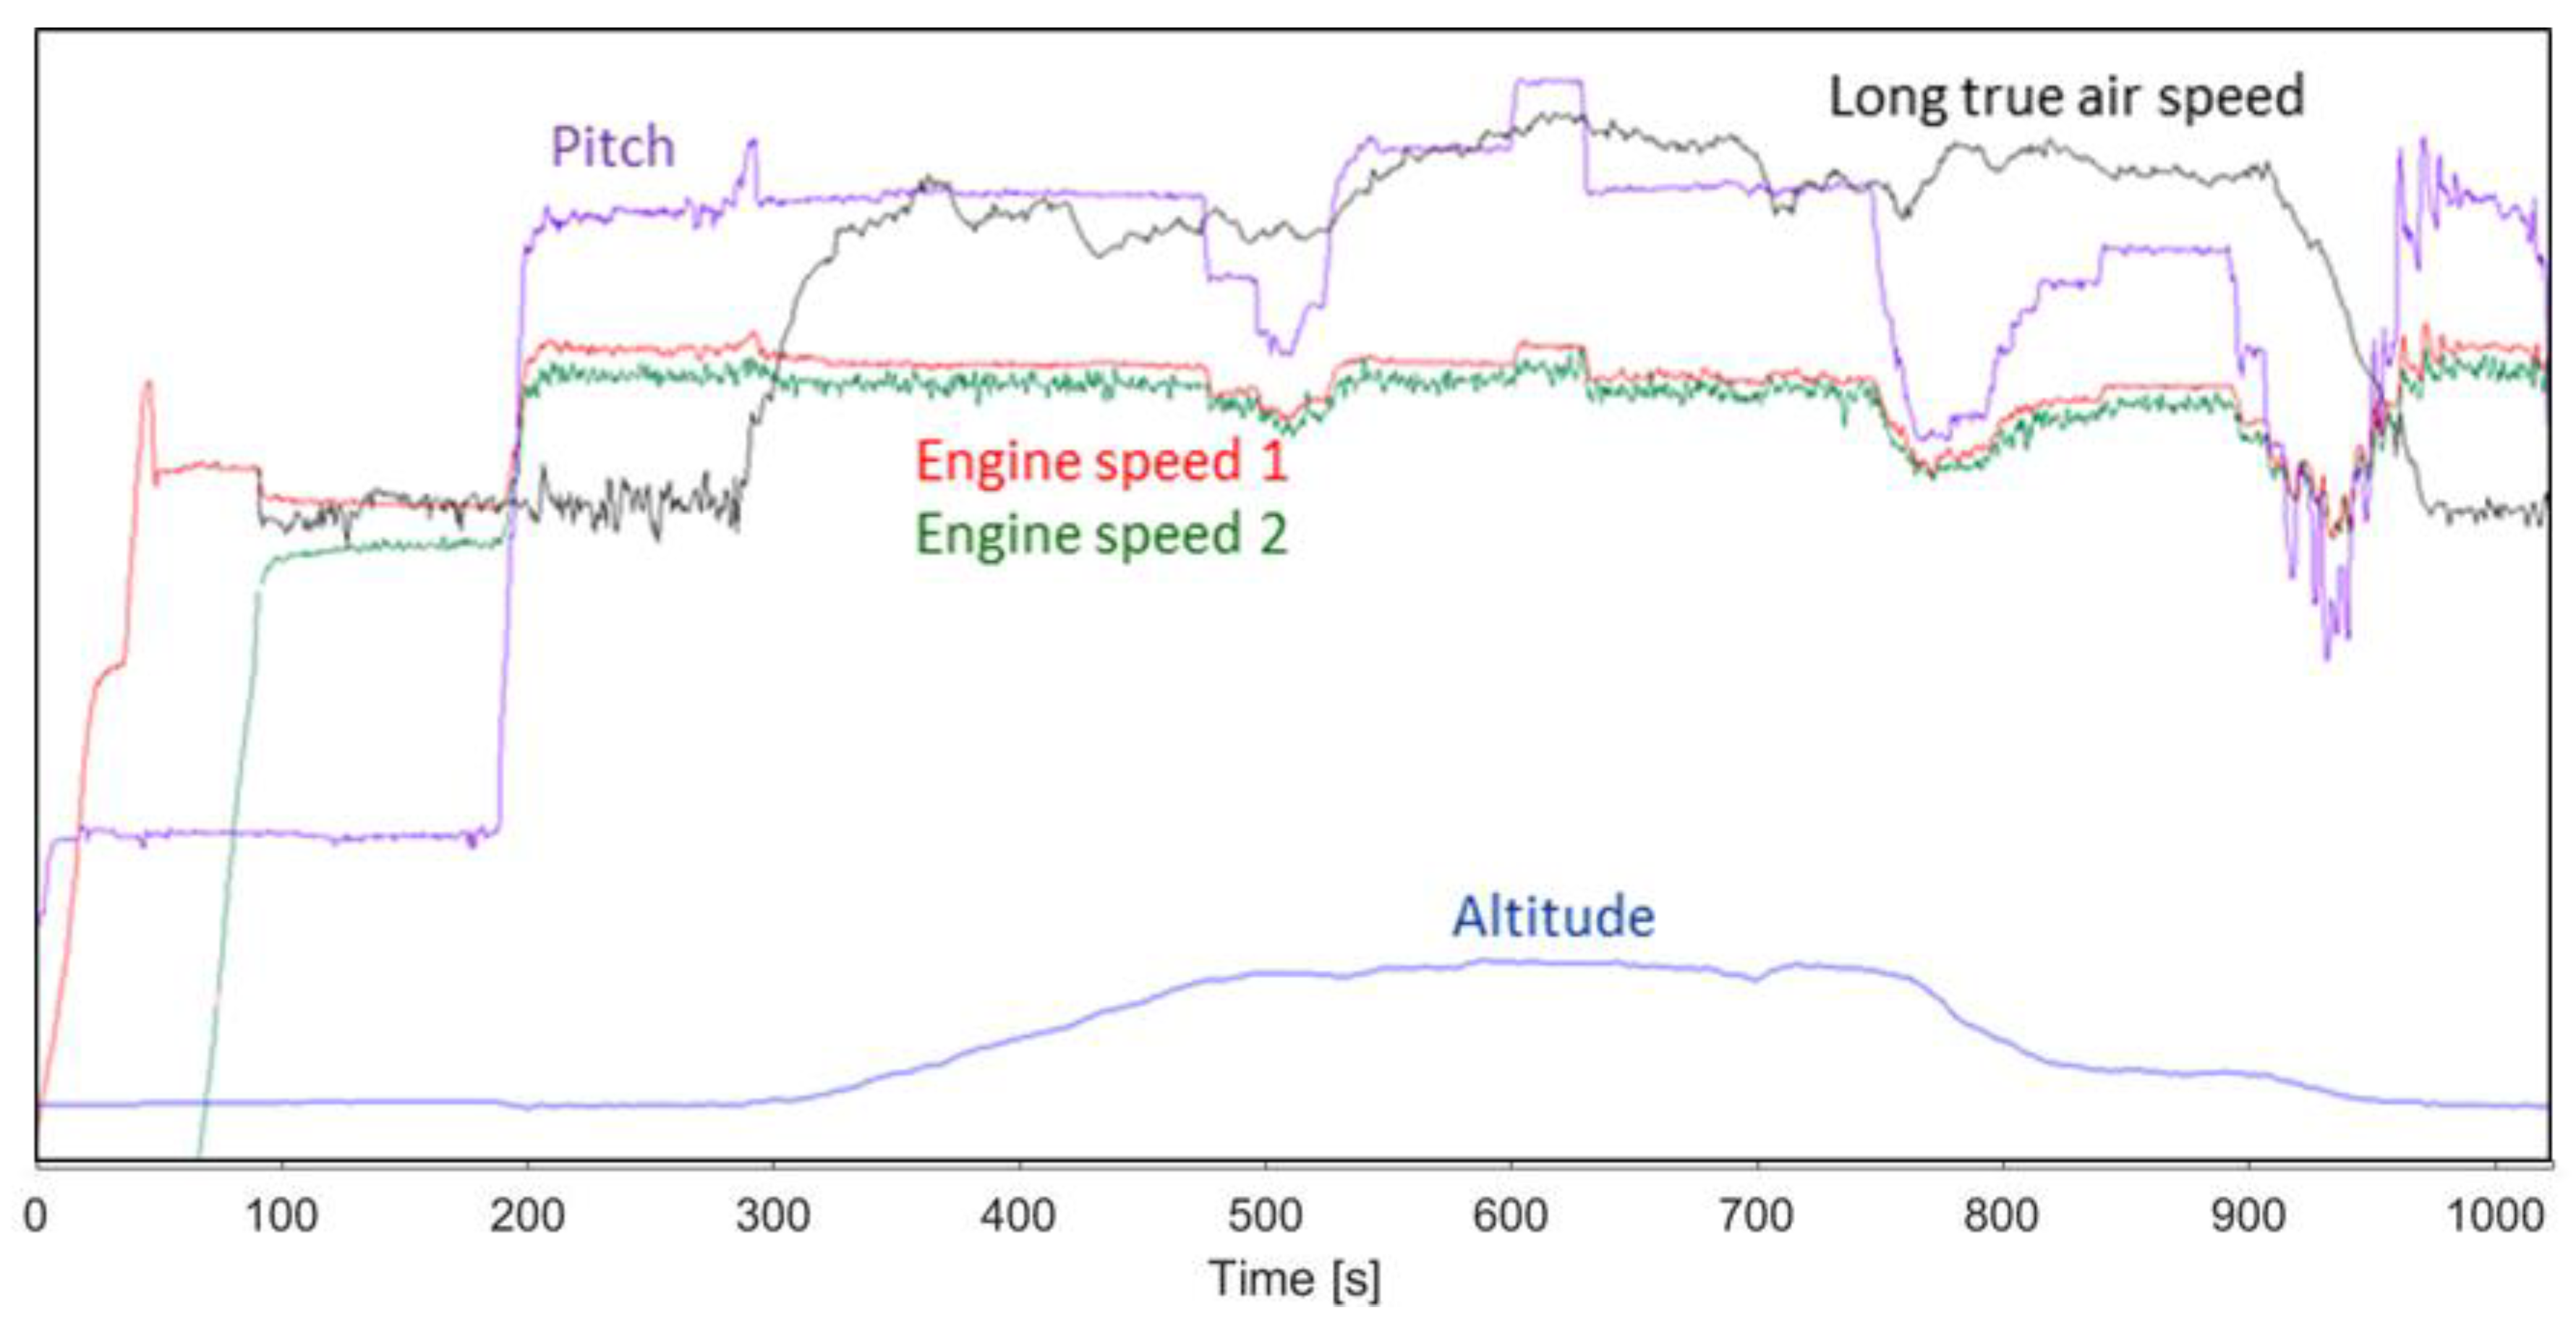
4.1. Flight Tests
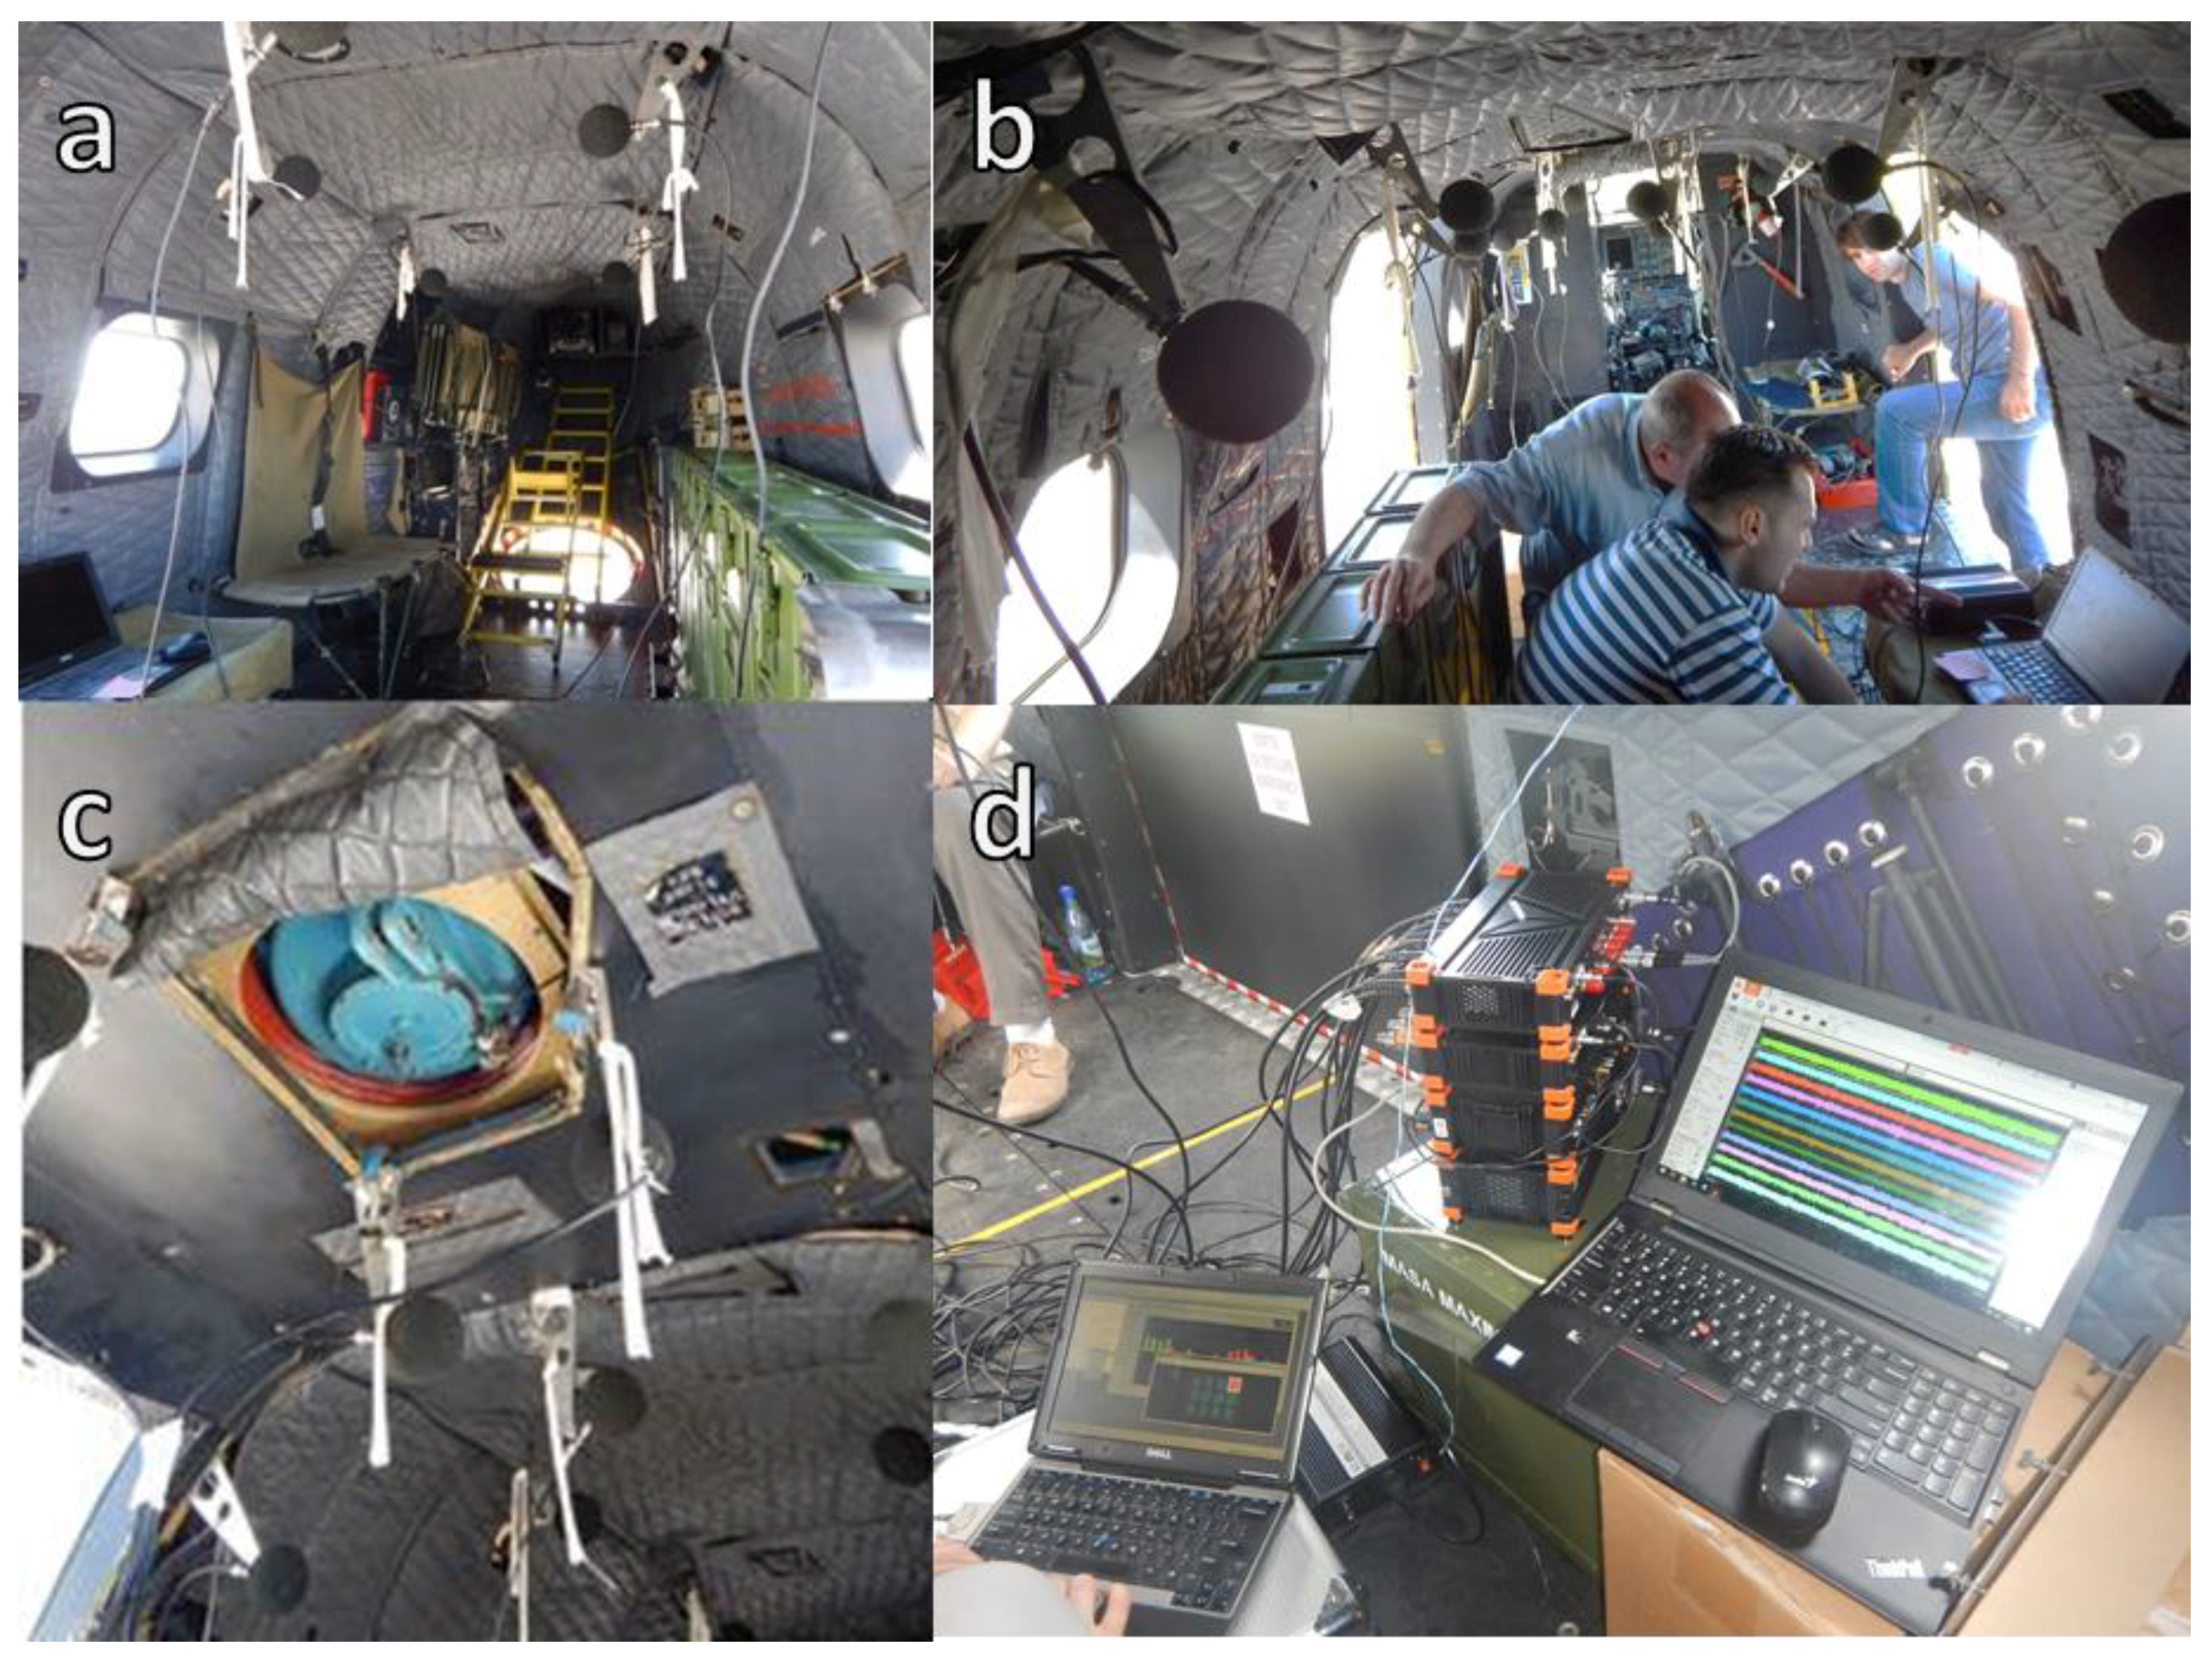
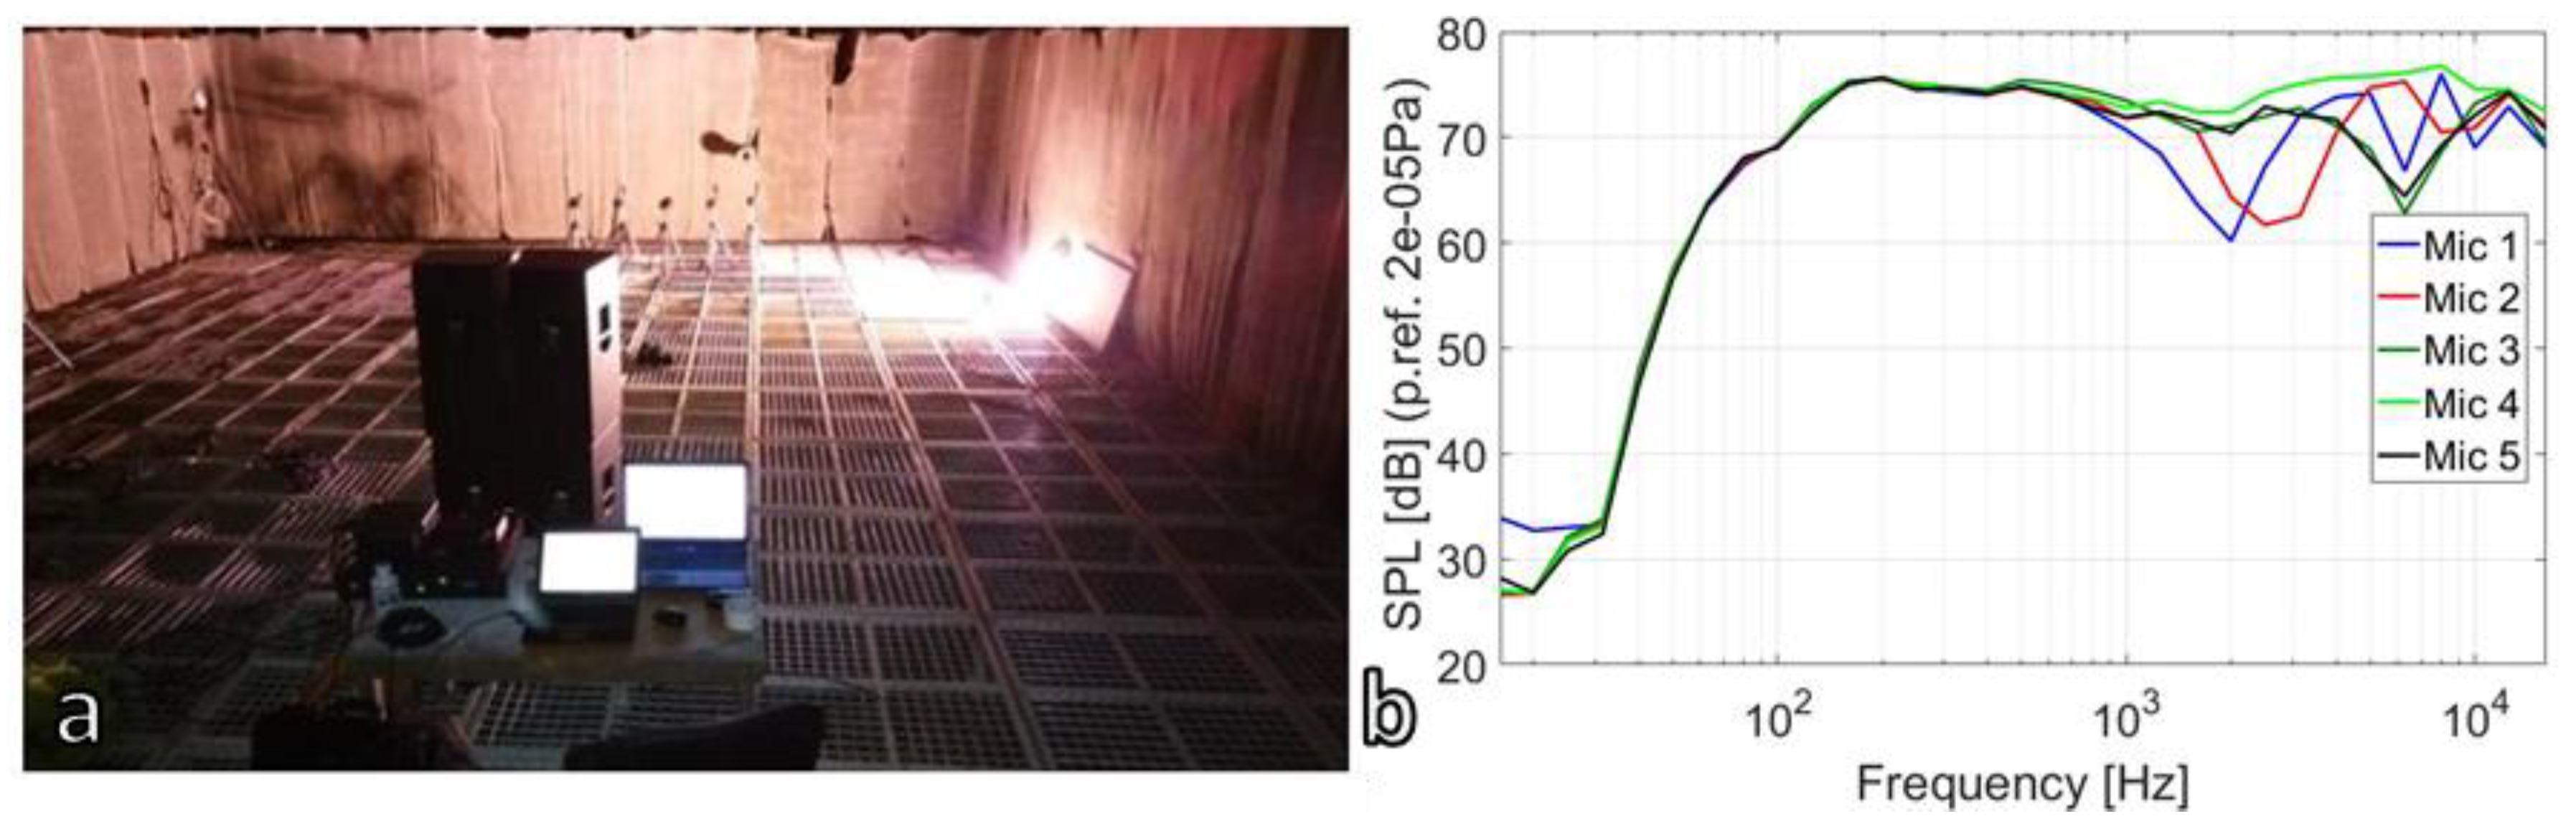
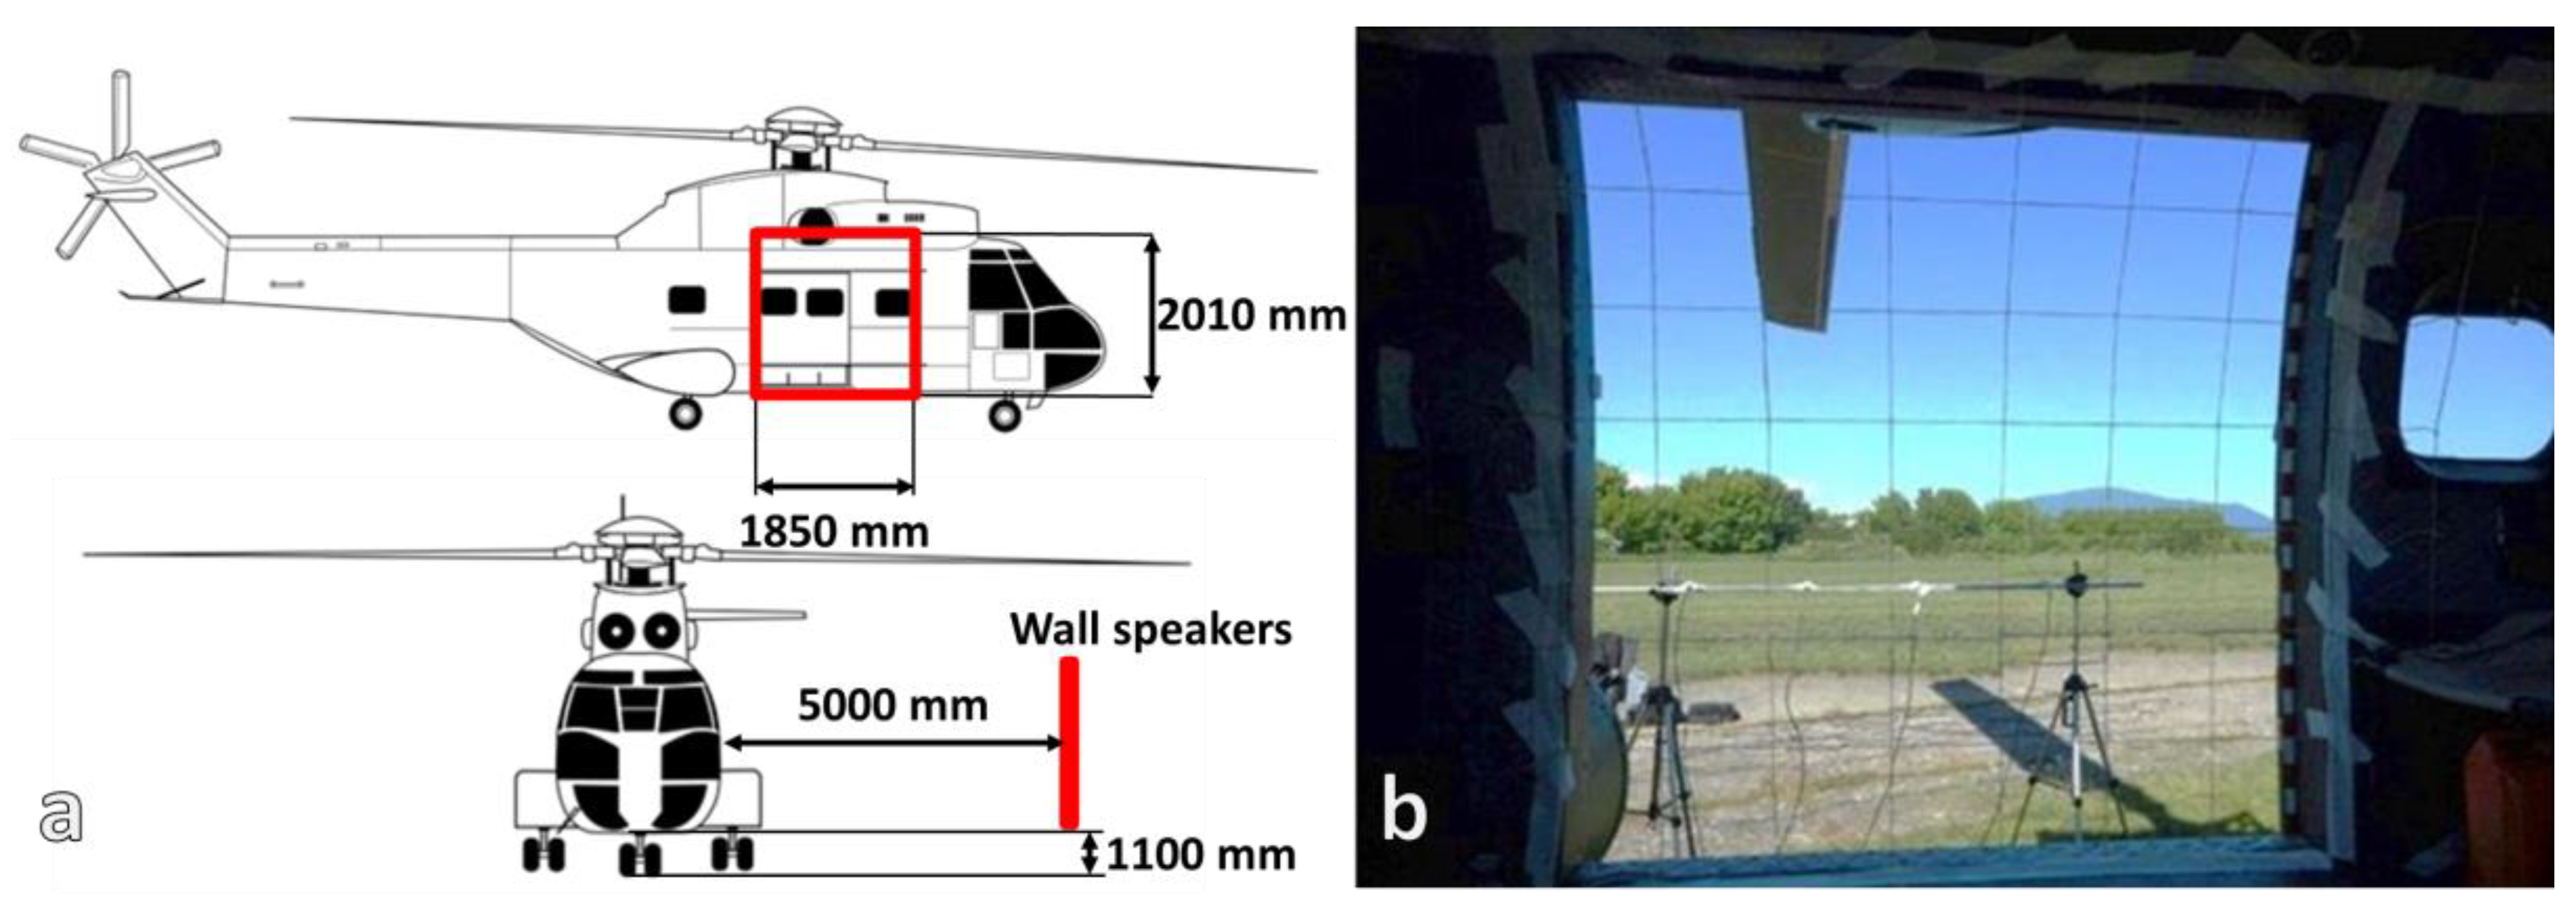
4.2. Ground Tests
5. Experimental Results
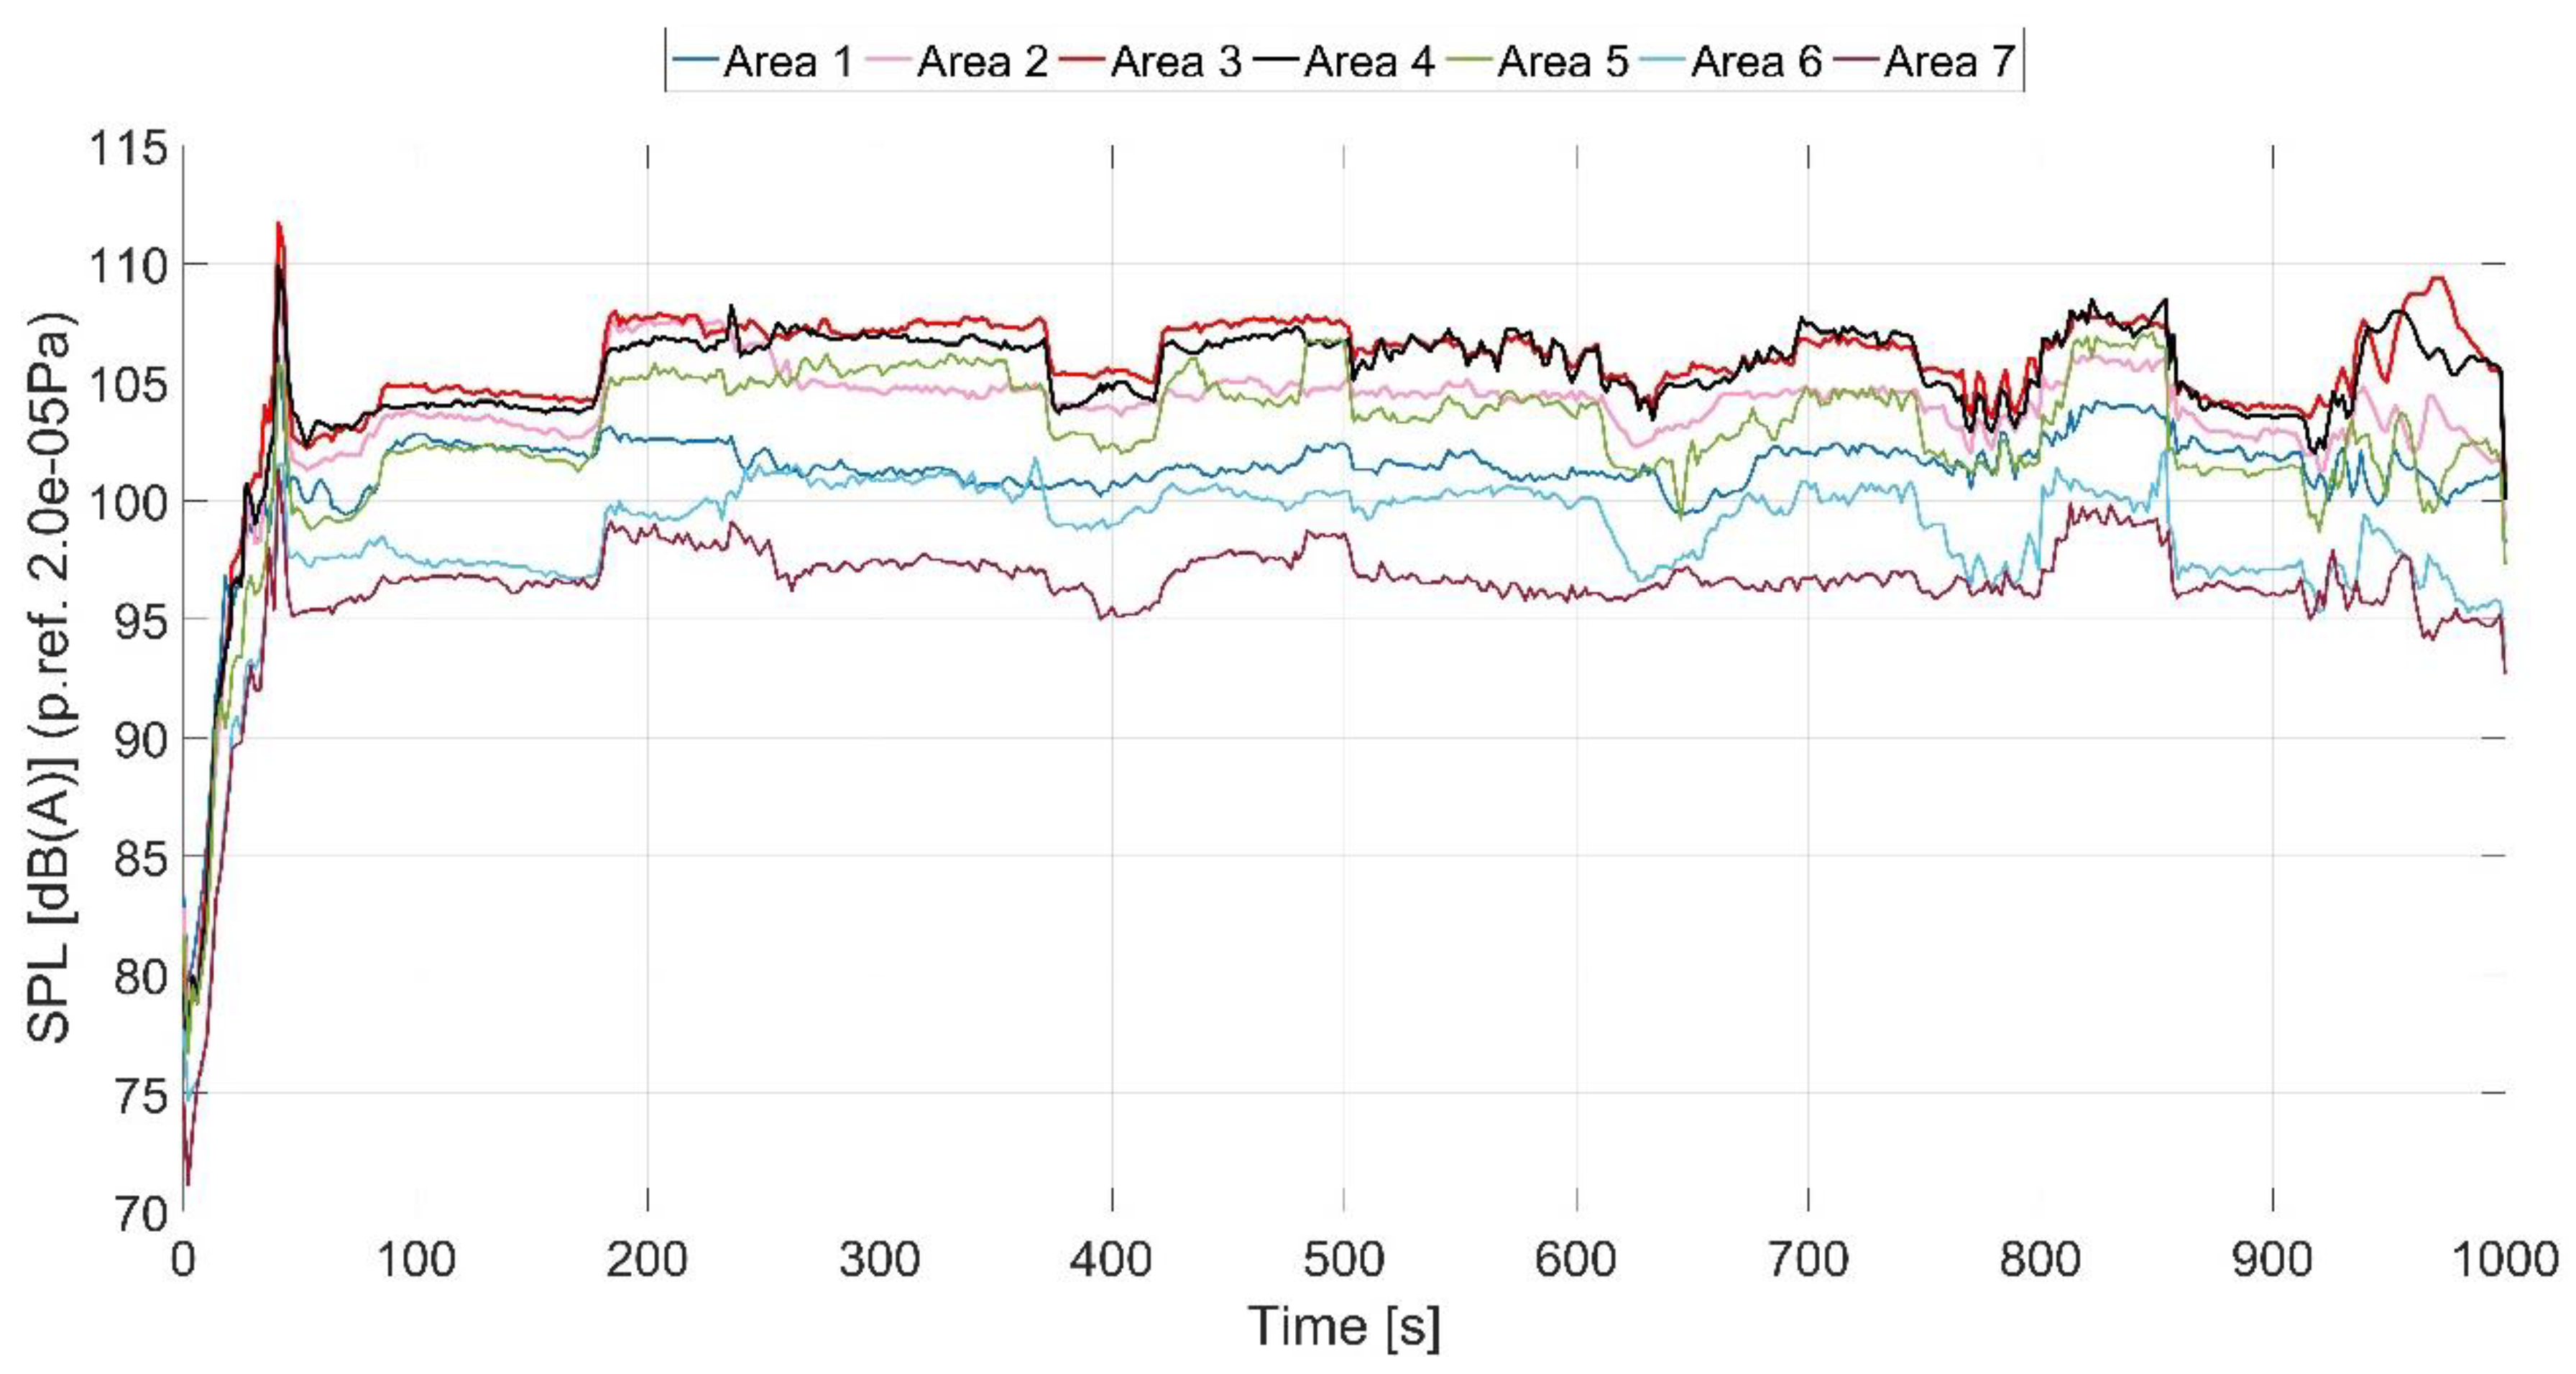
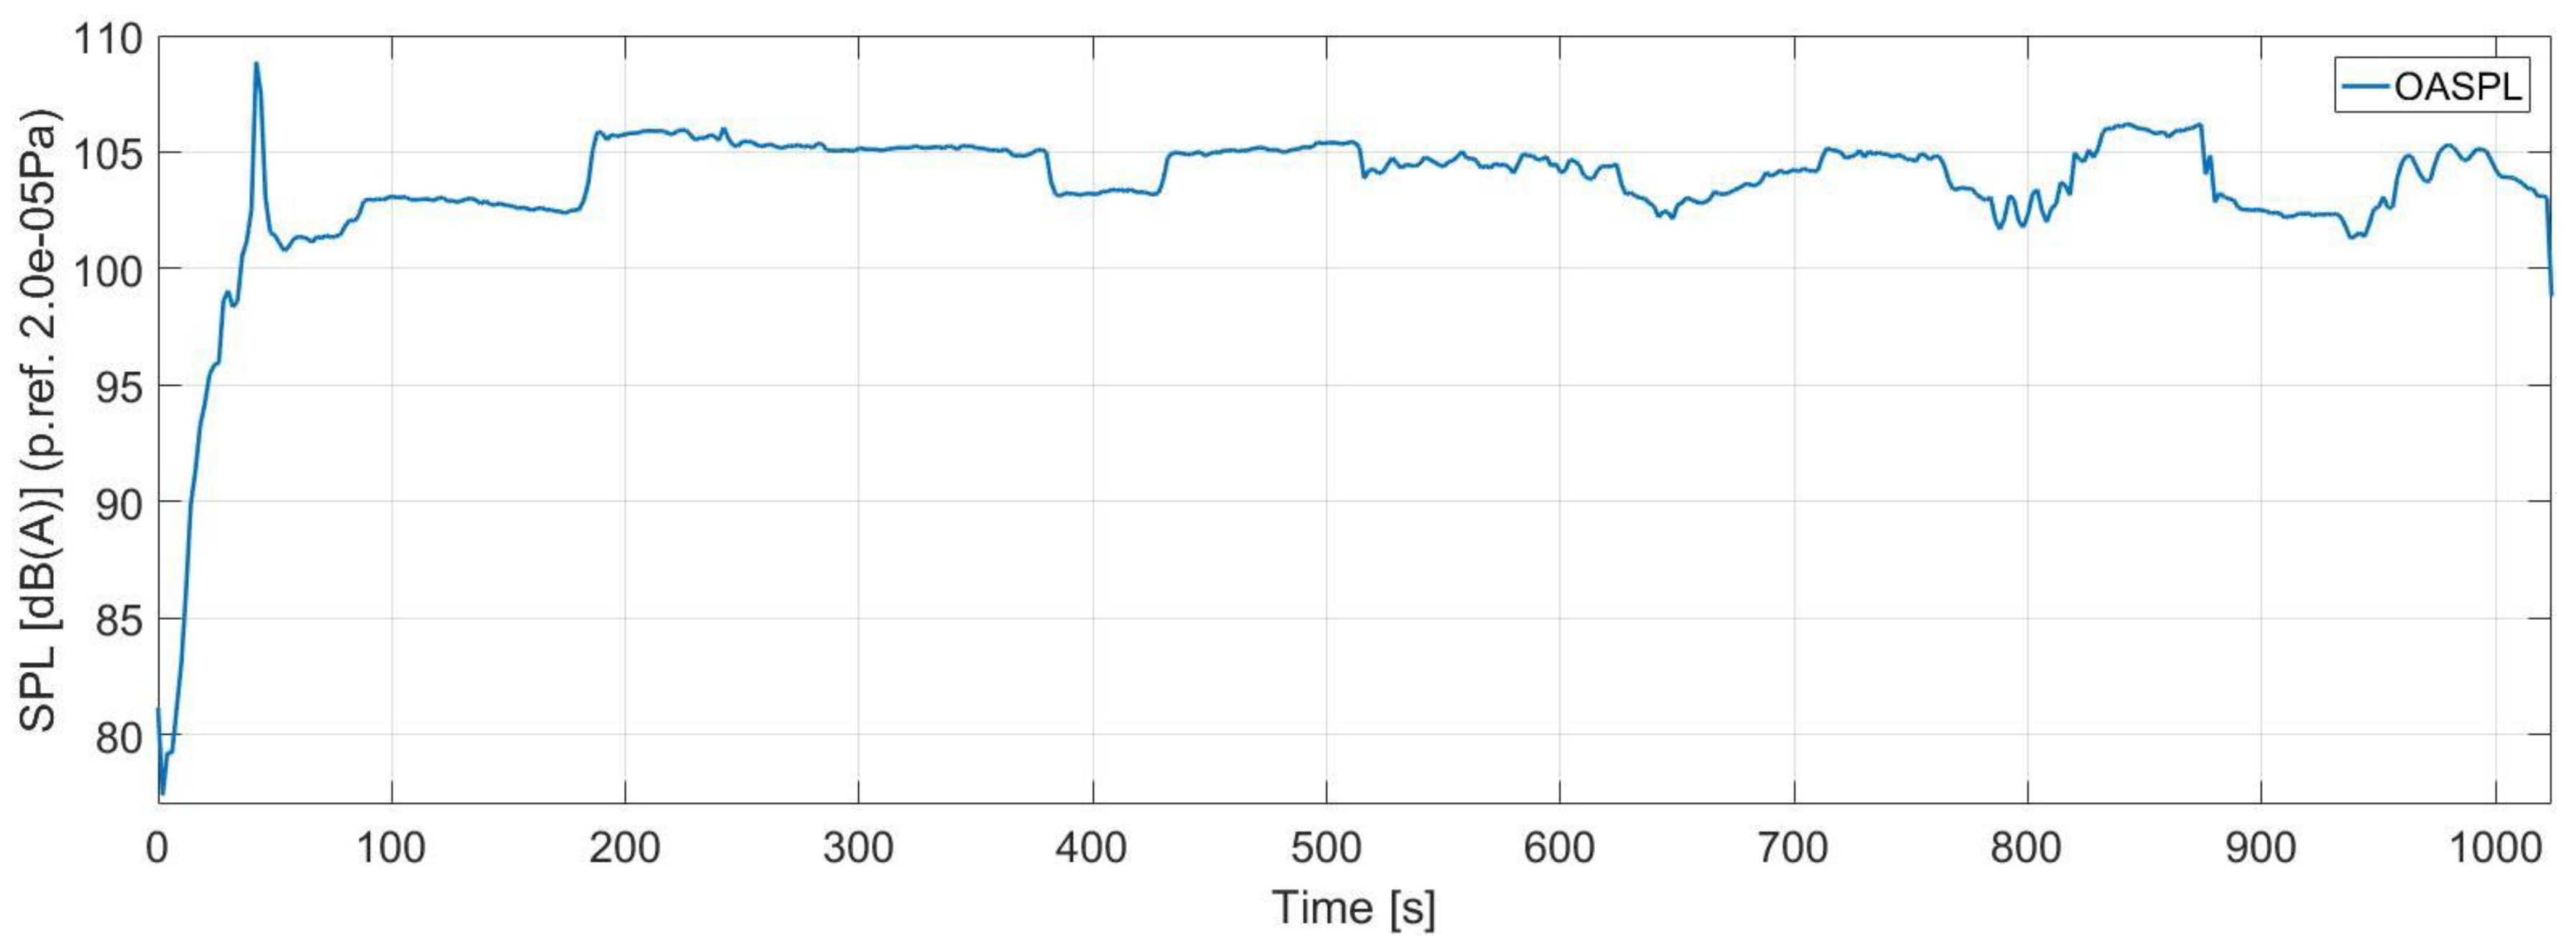
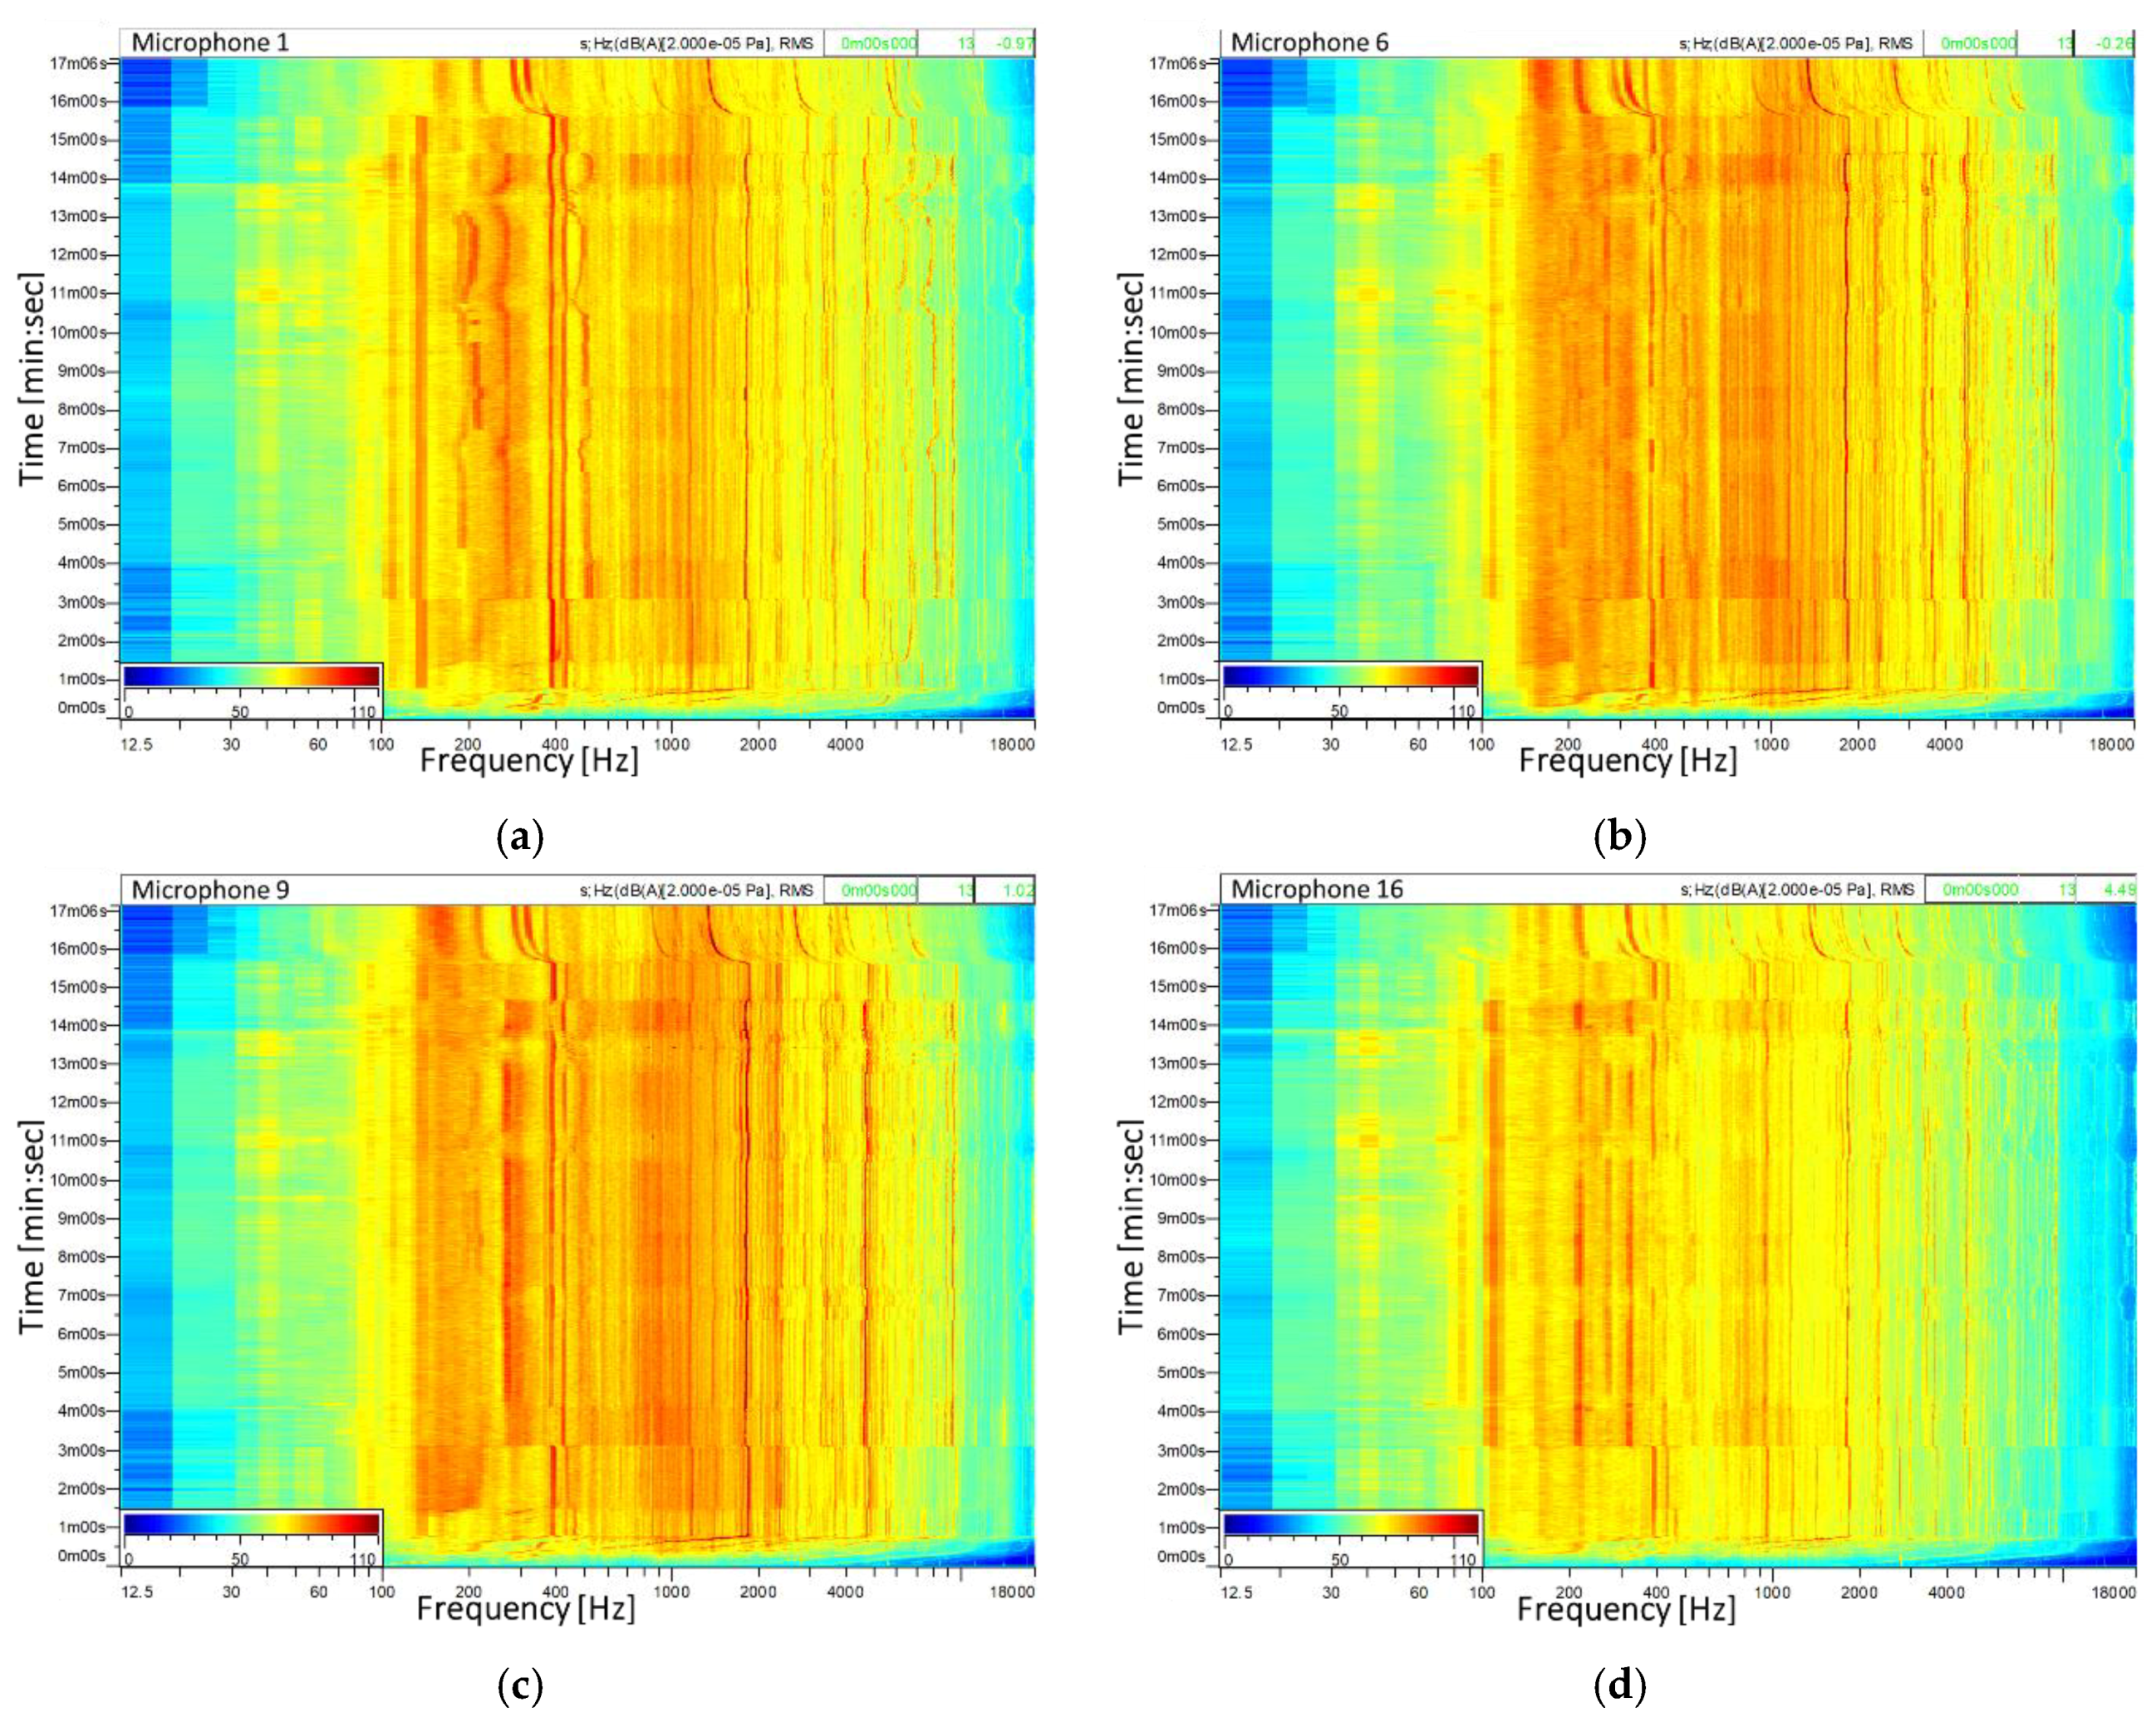
5.1. Flight Results
5.2. Ground Results
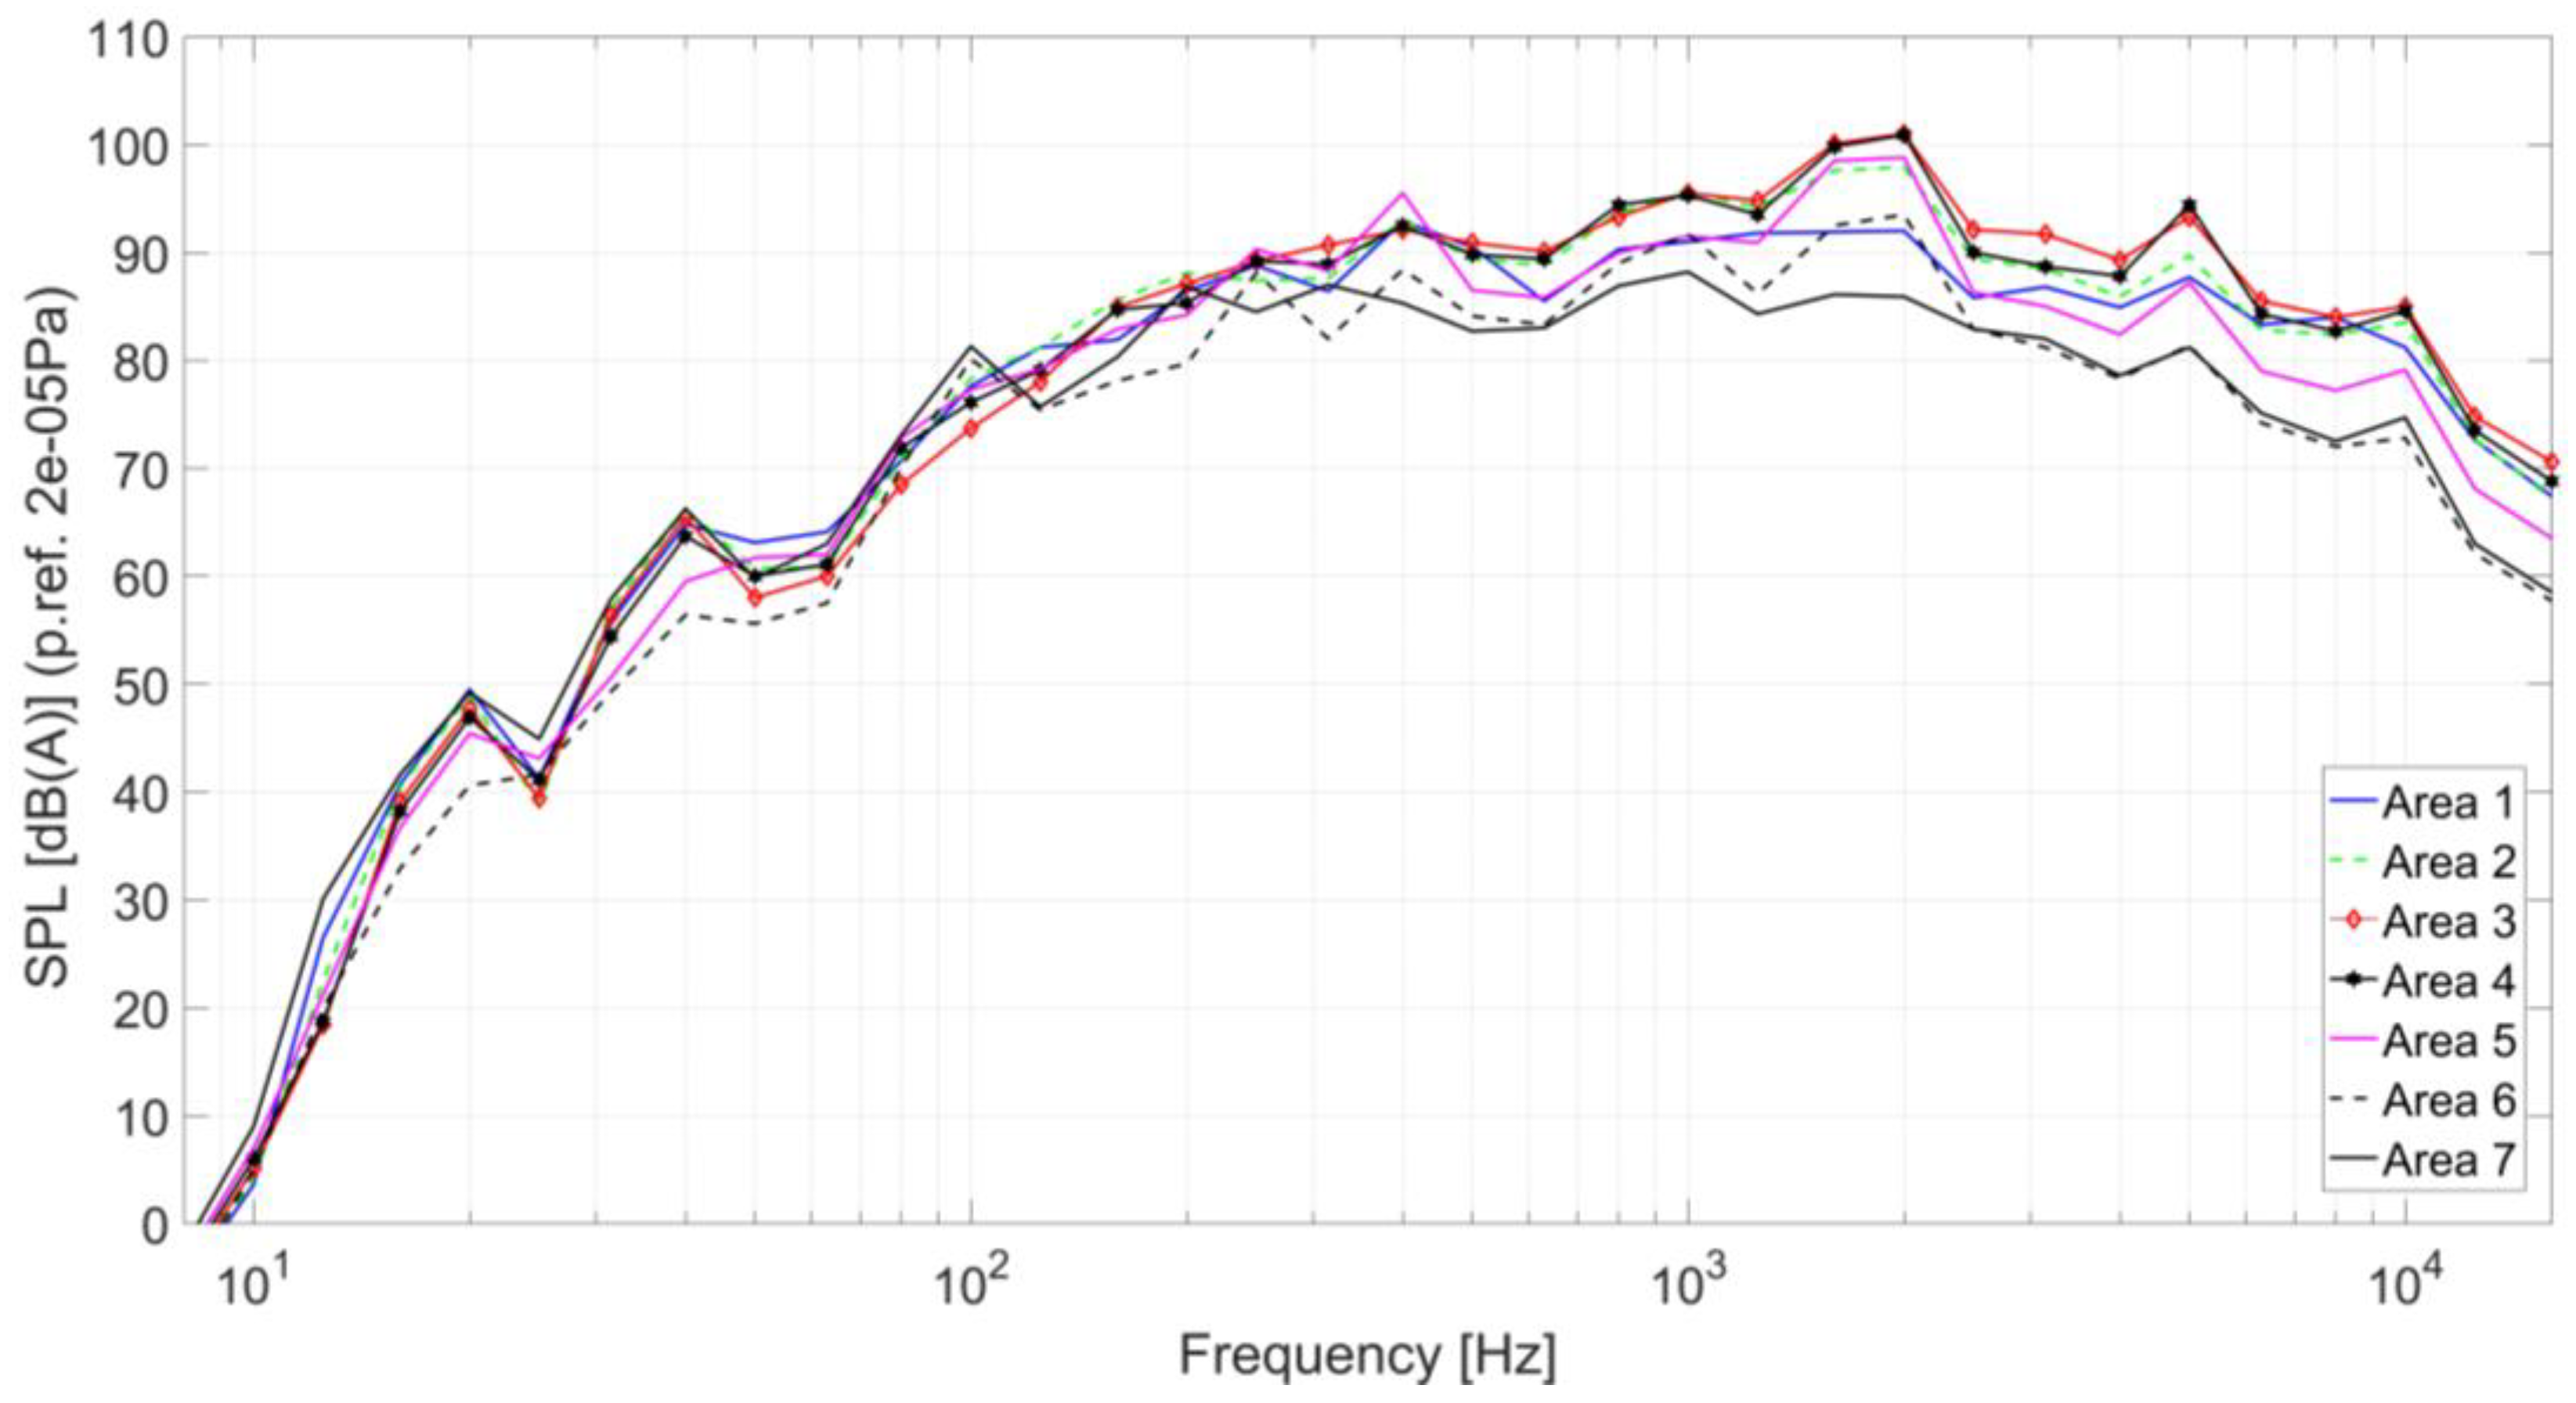
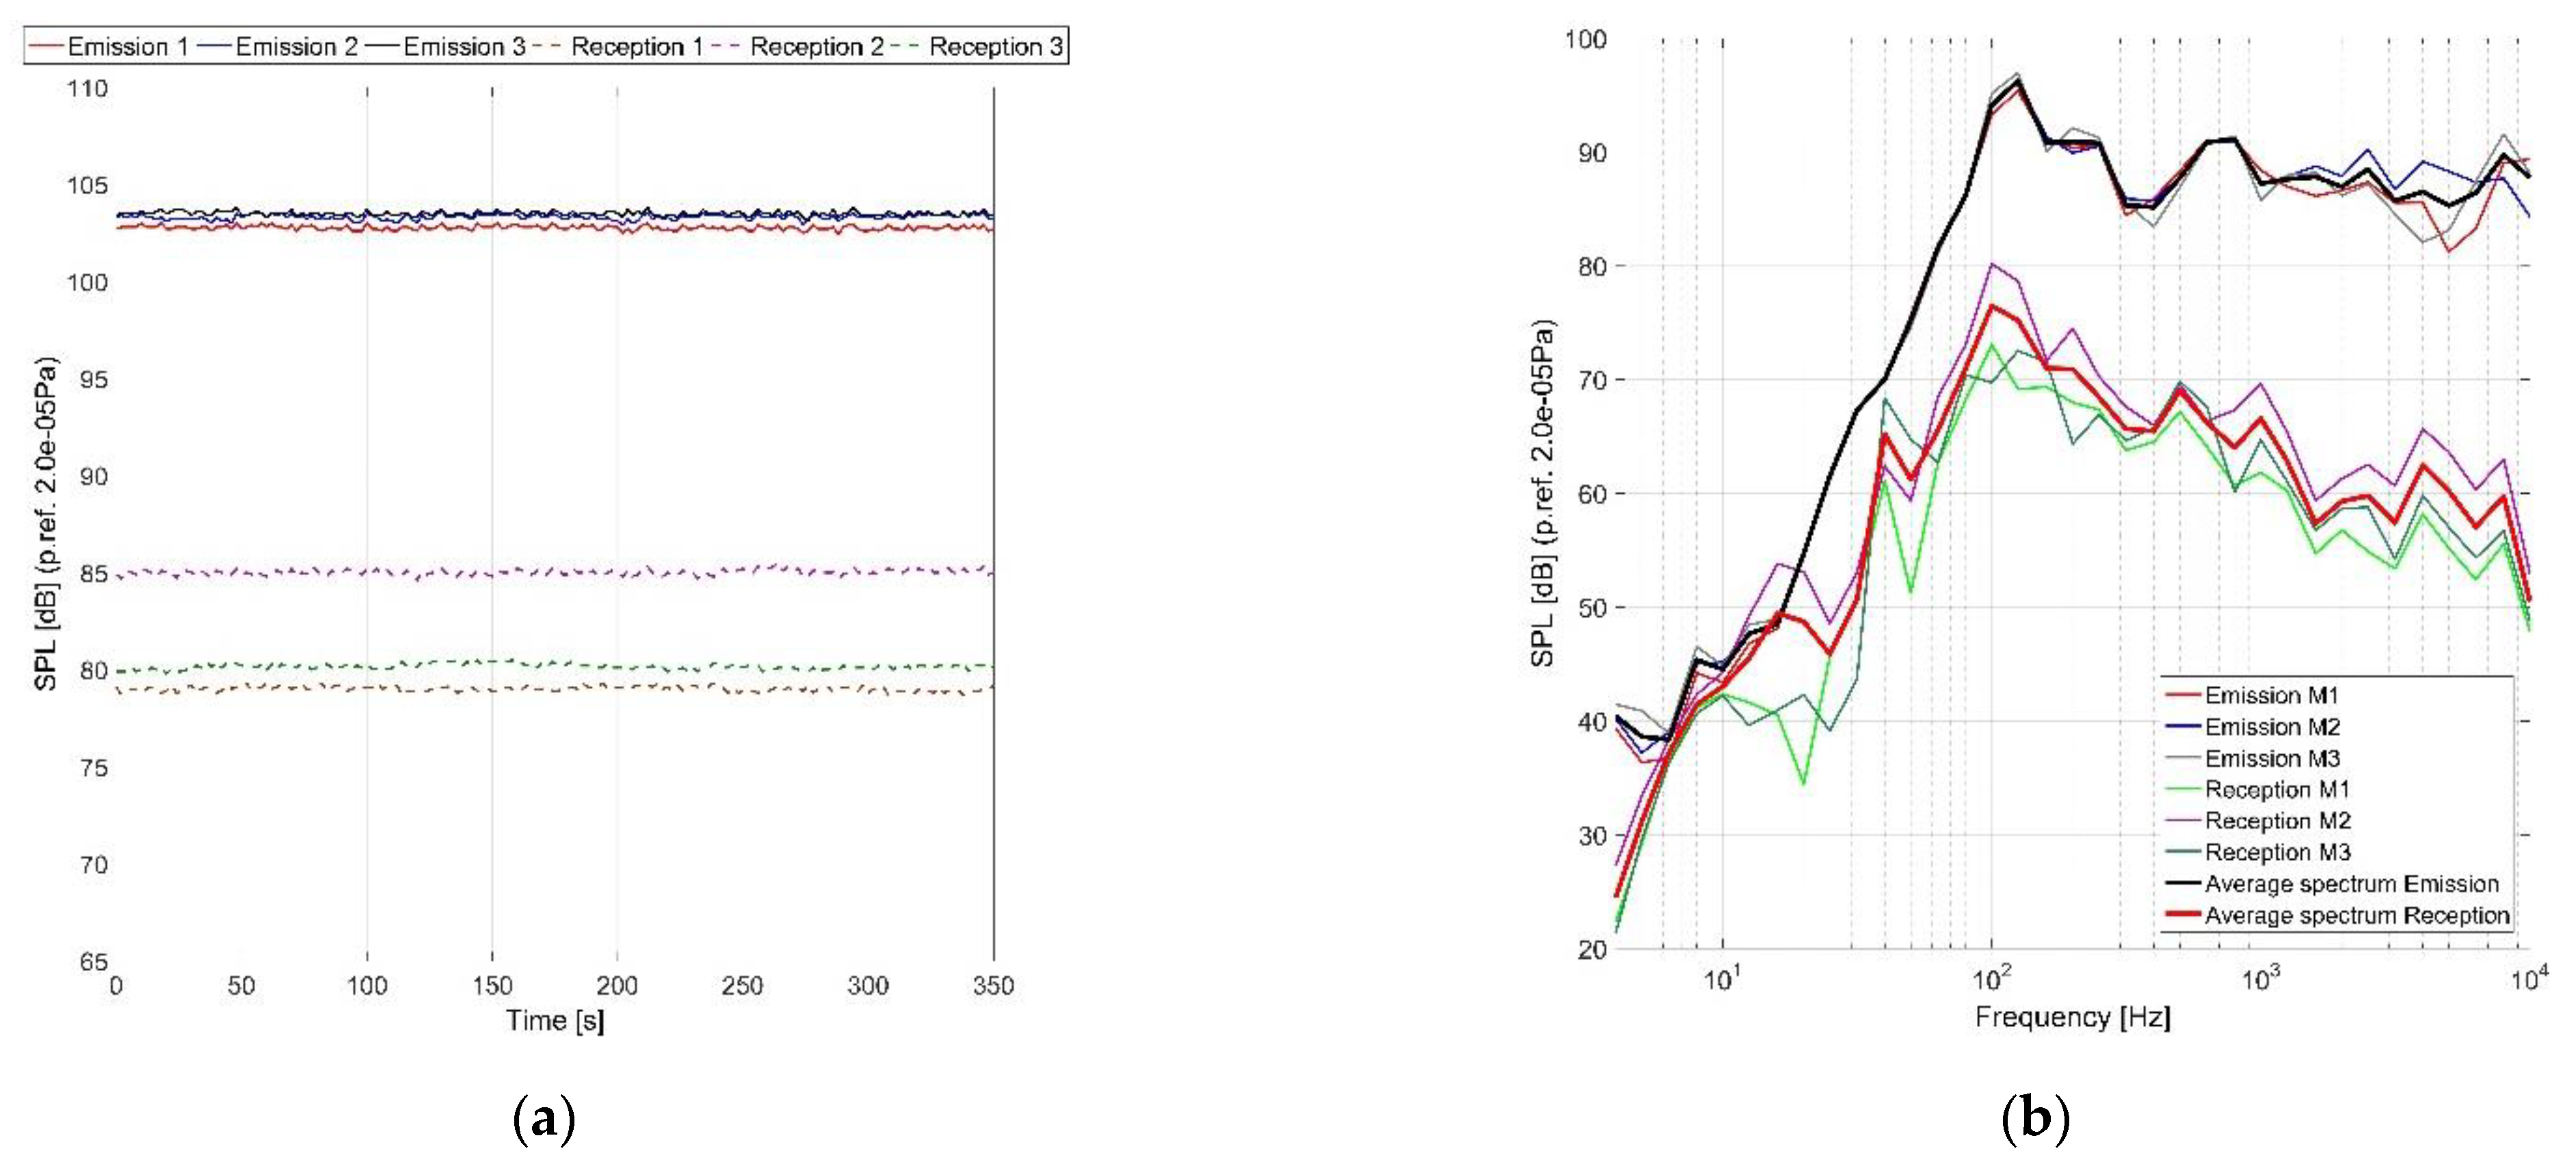
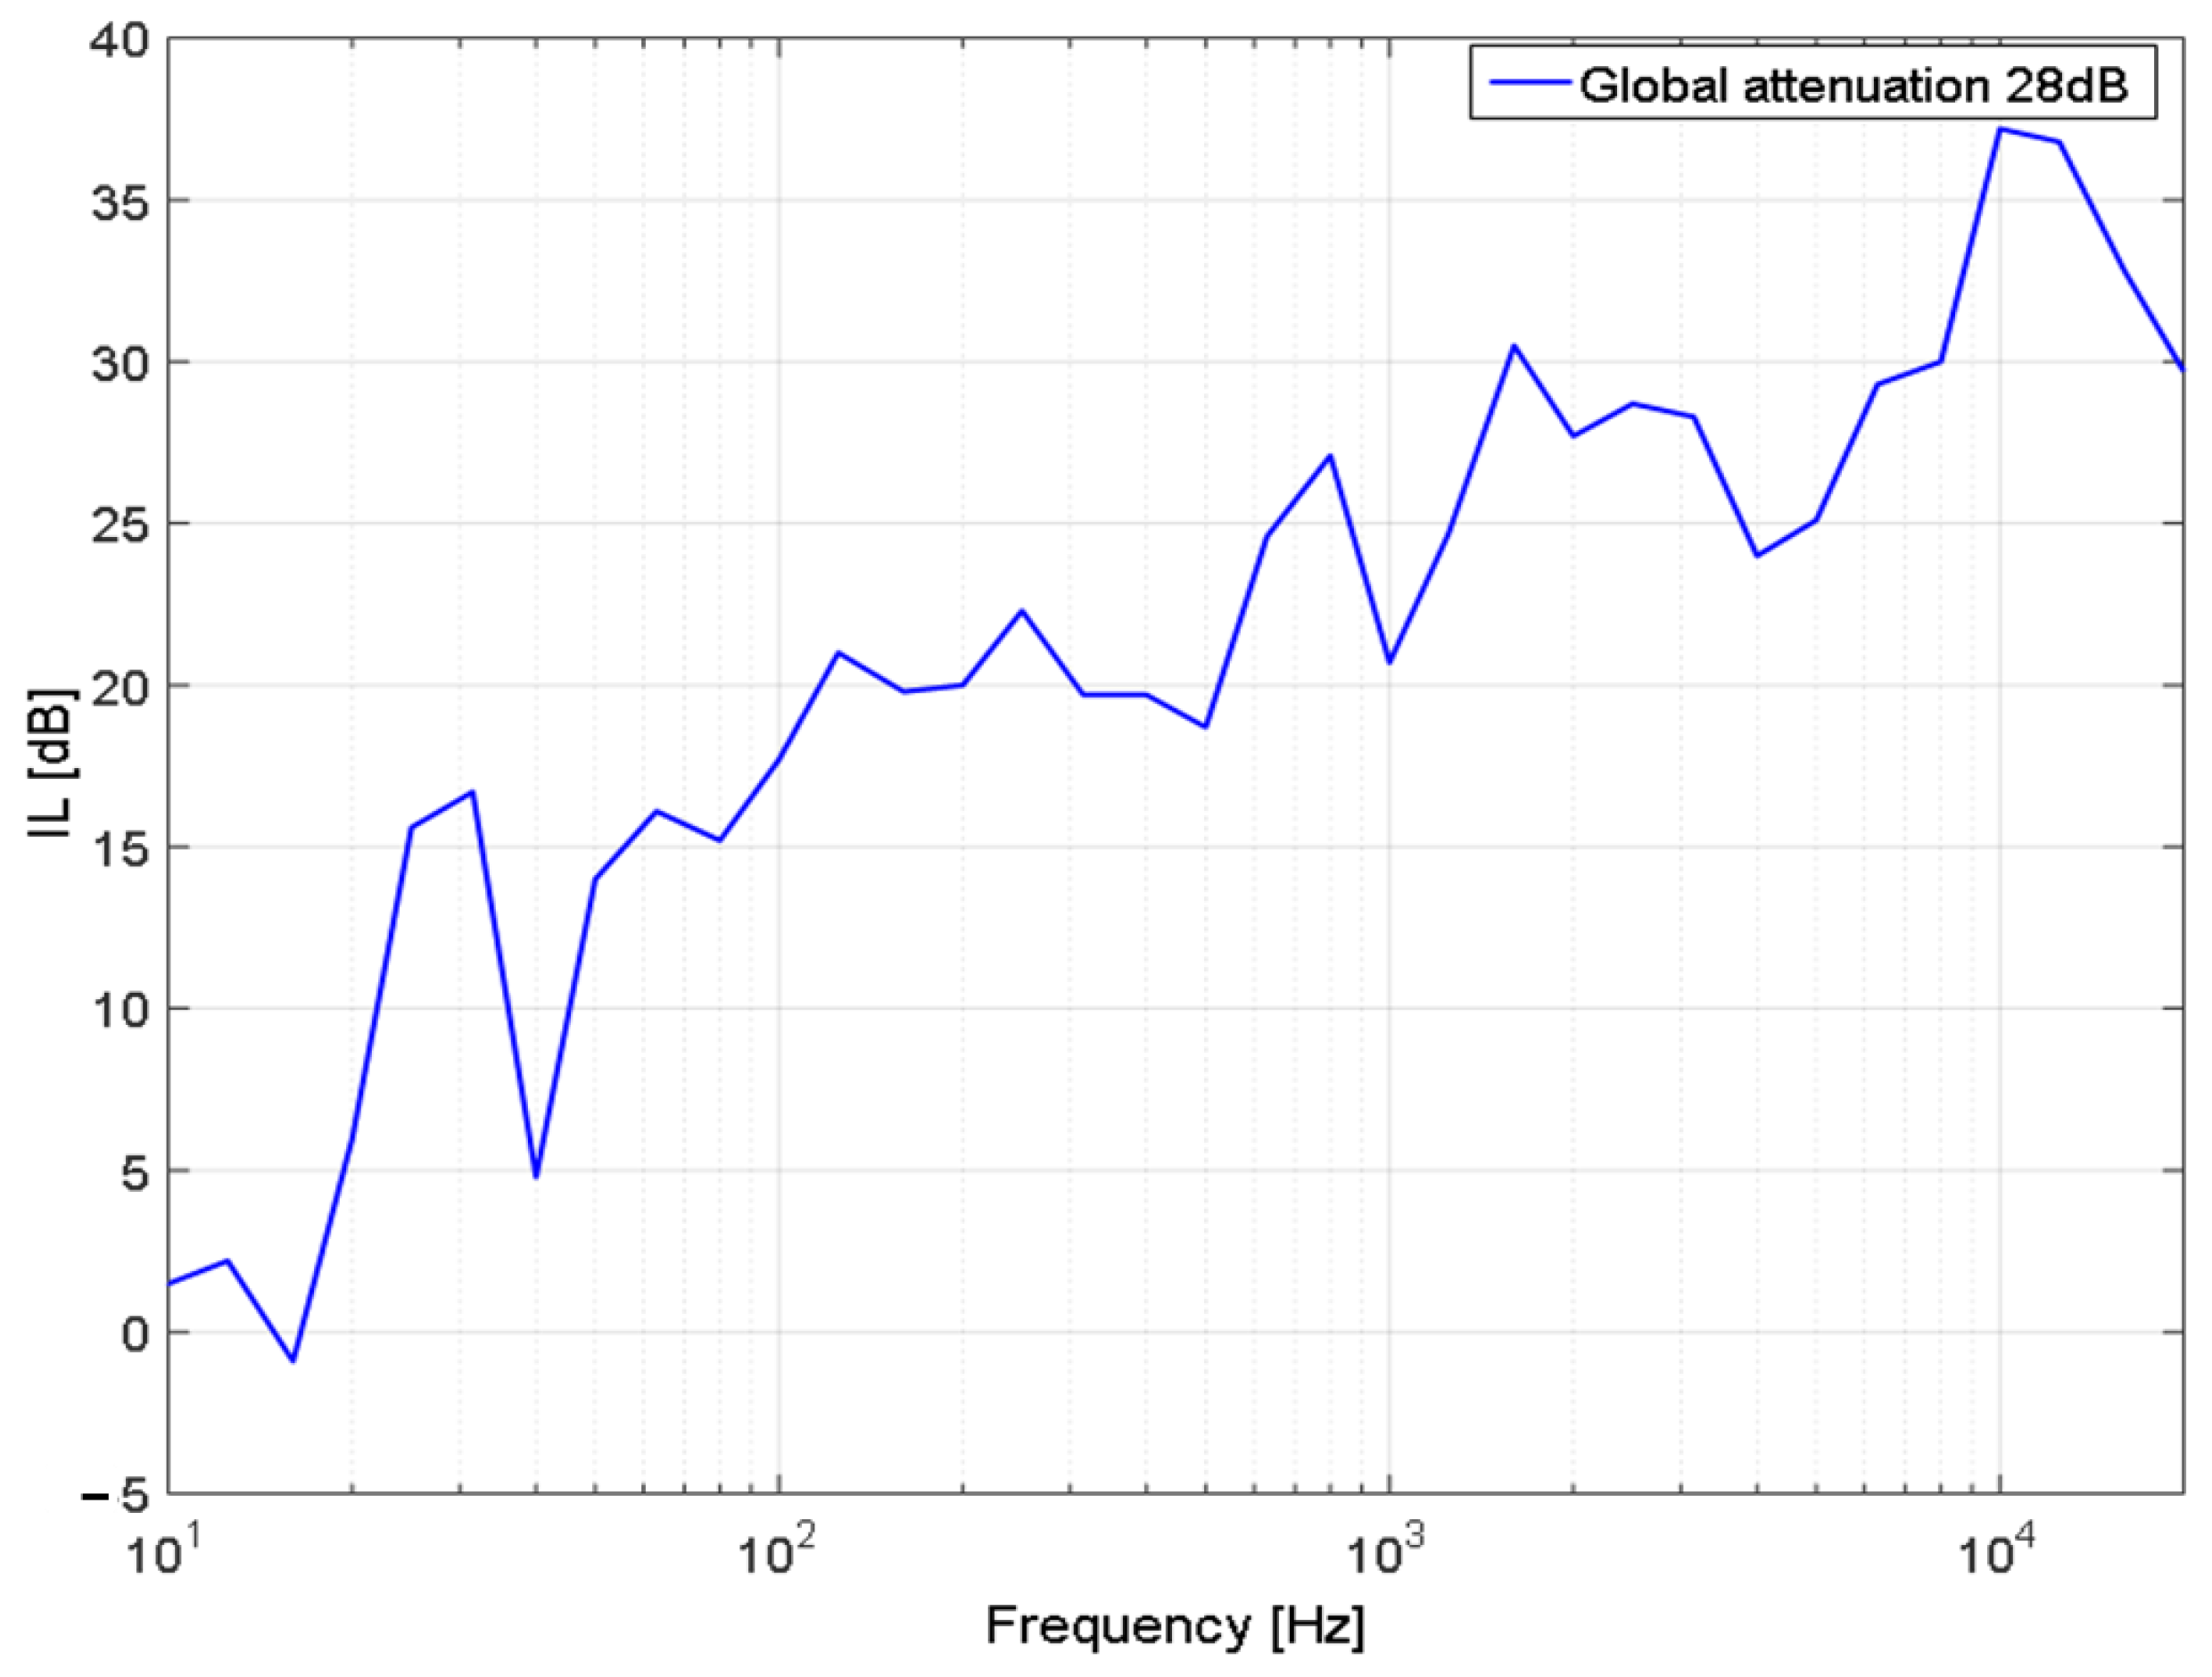
5.2.1. Part 1. Emission–Reception
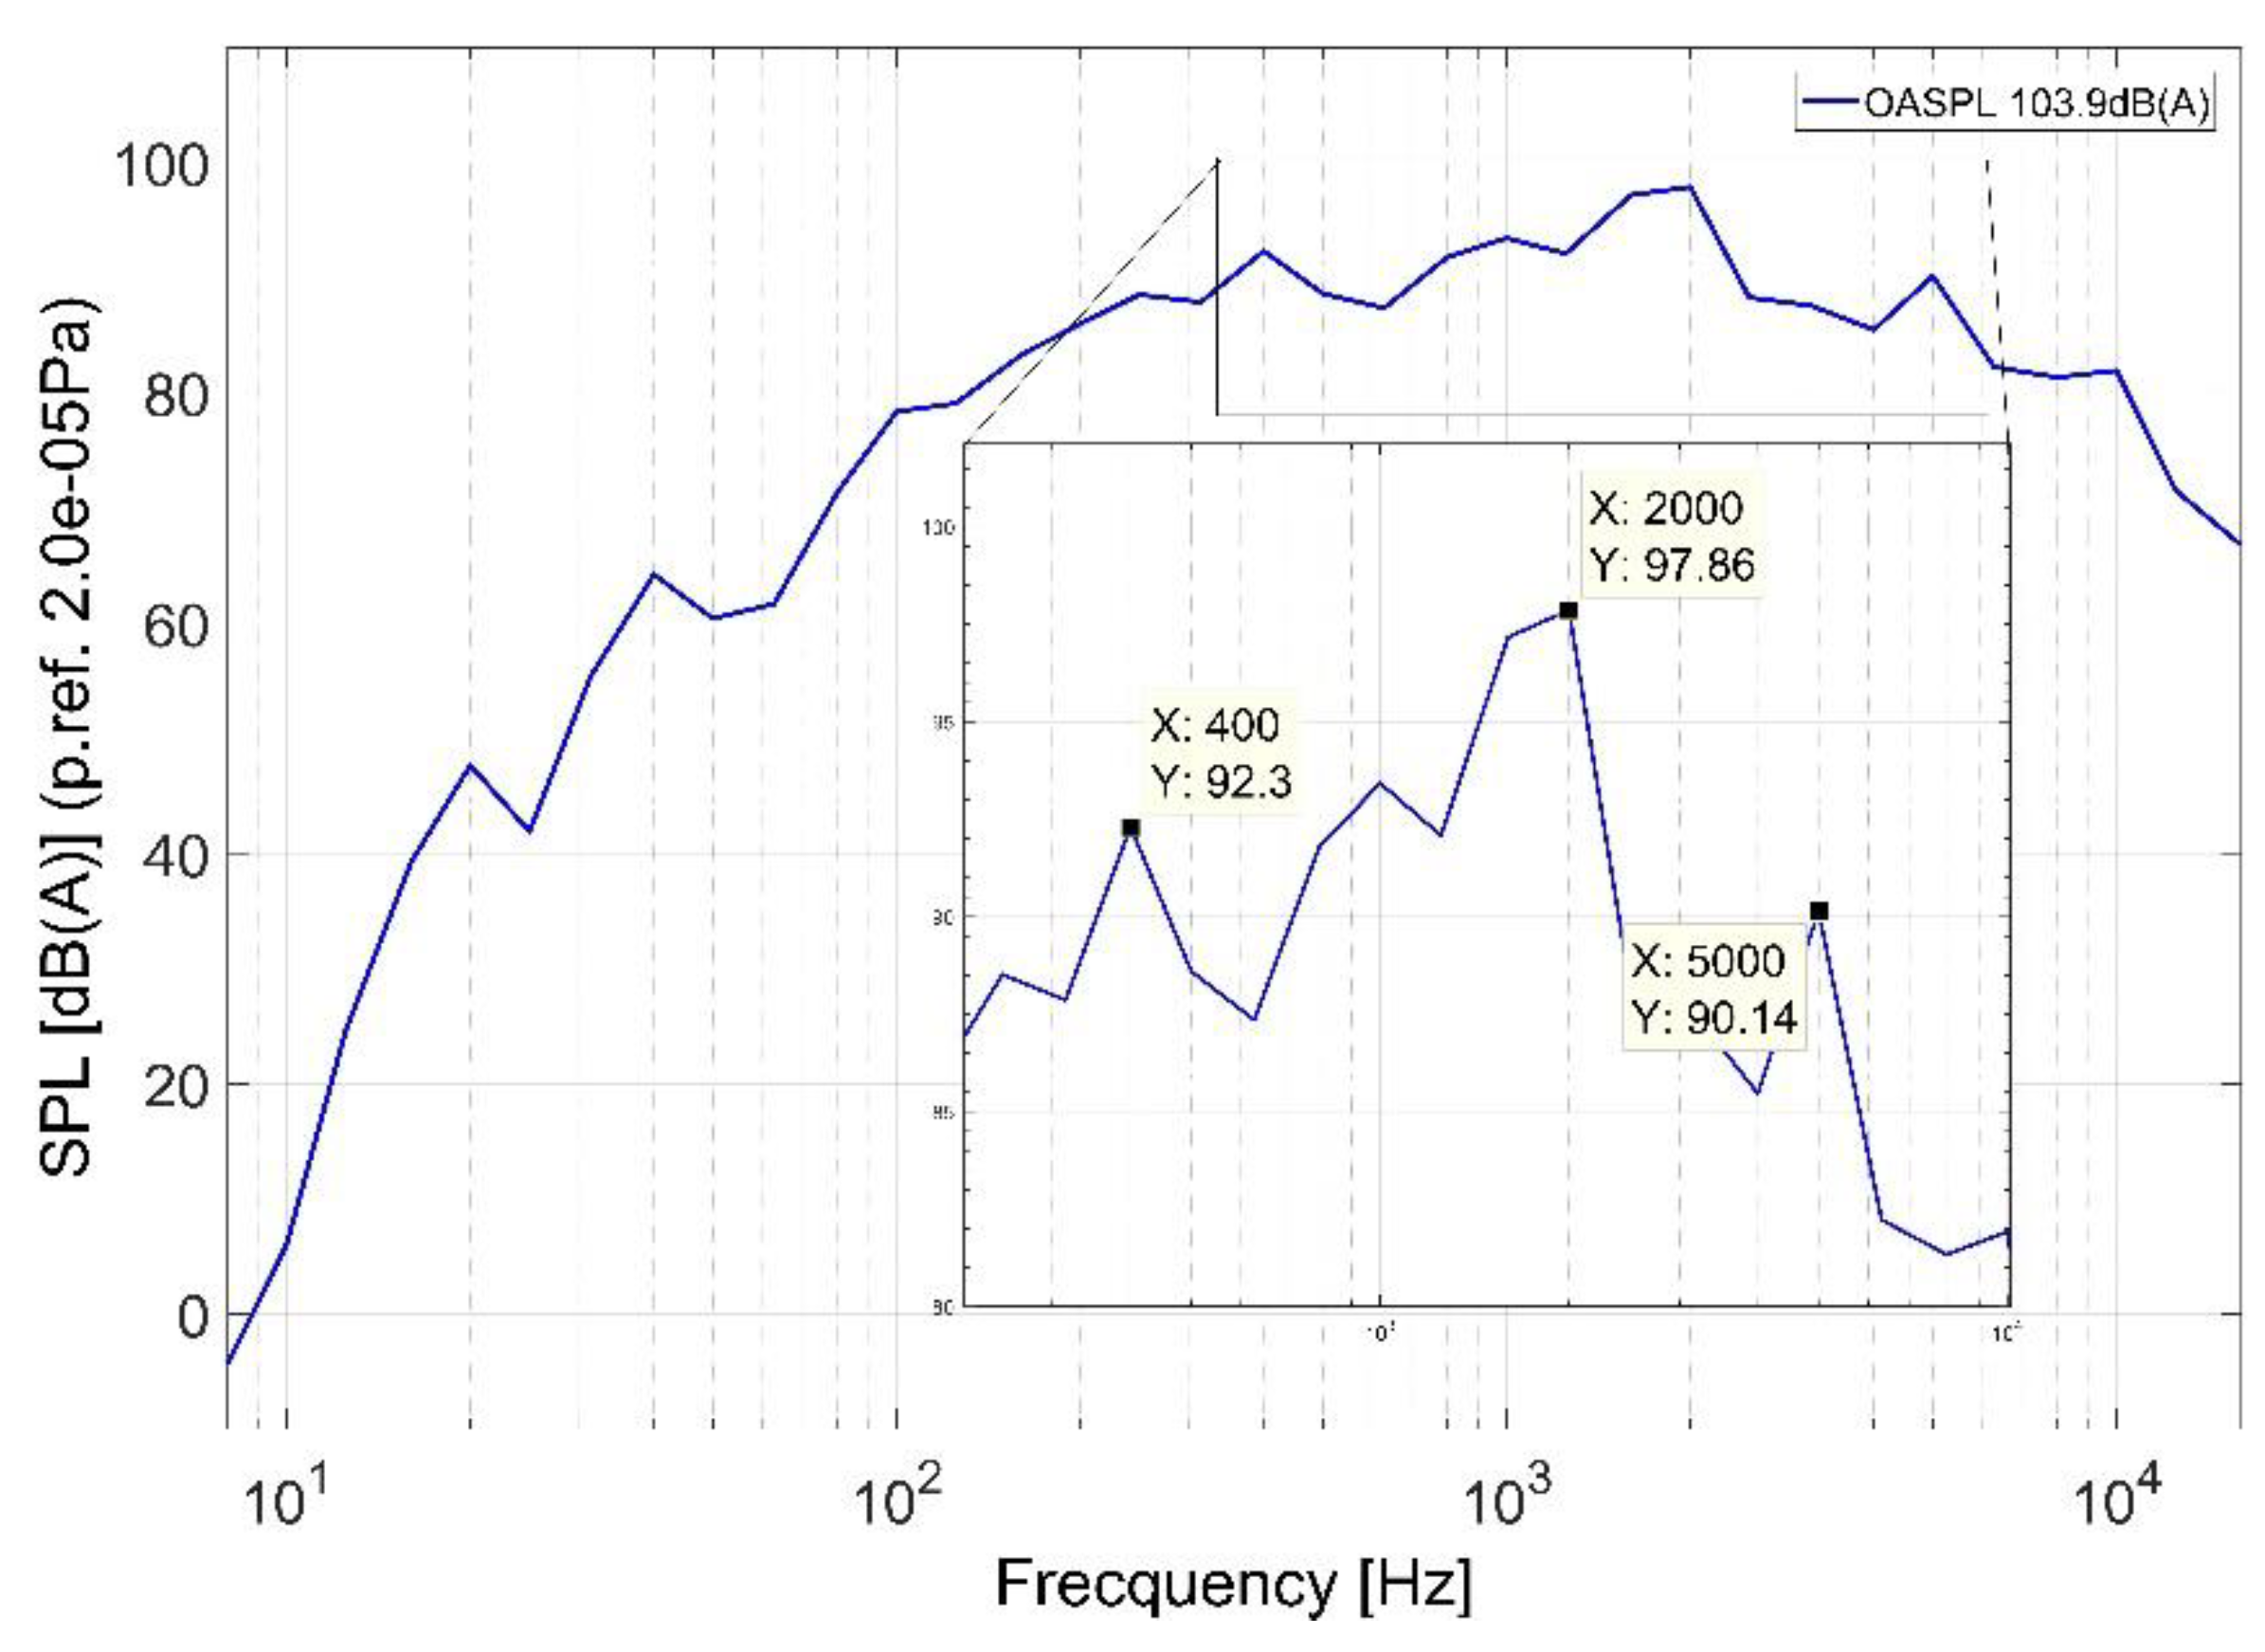
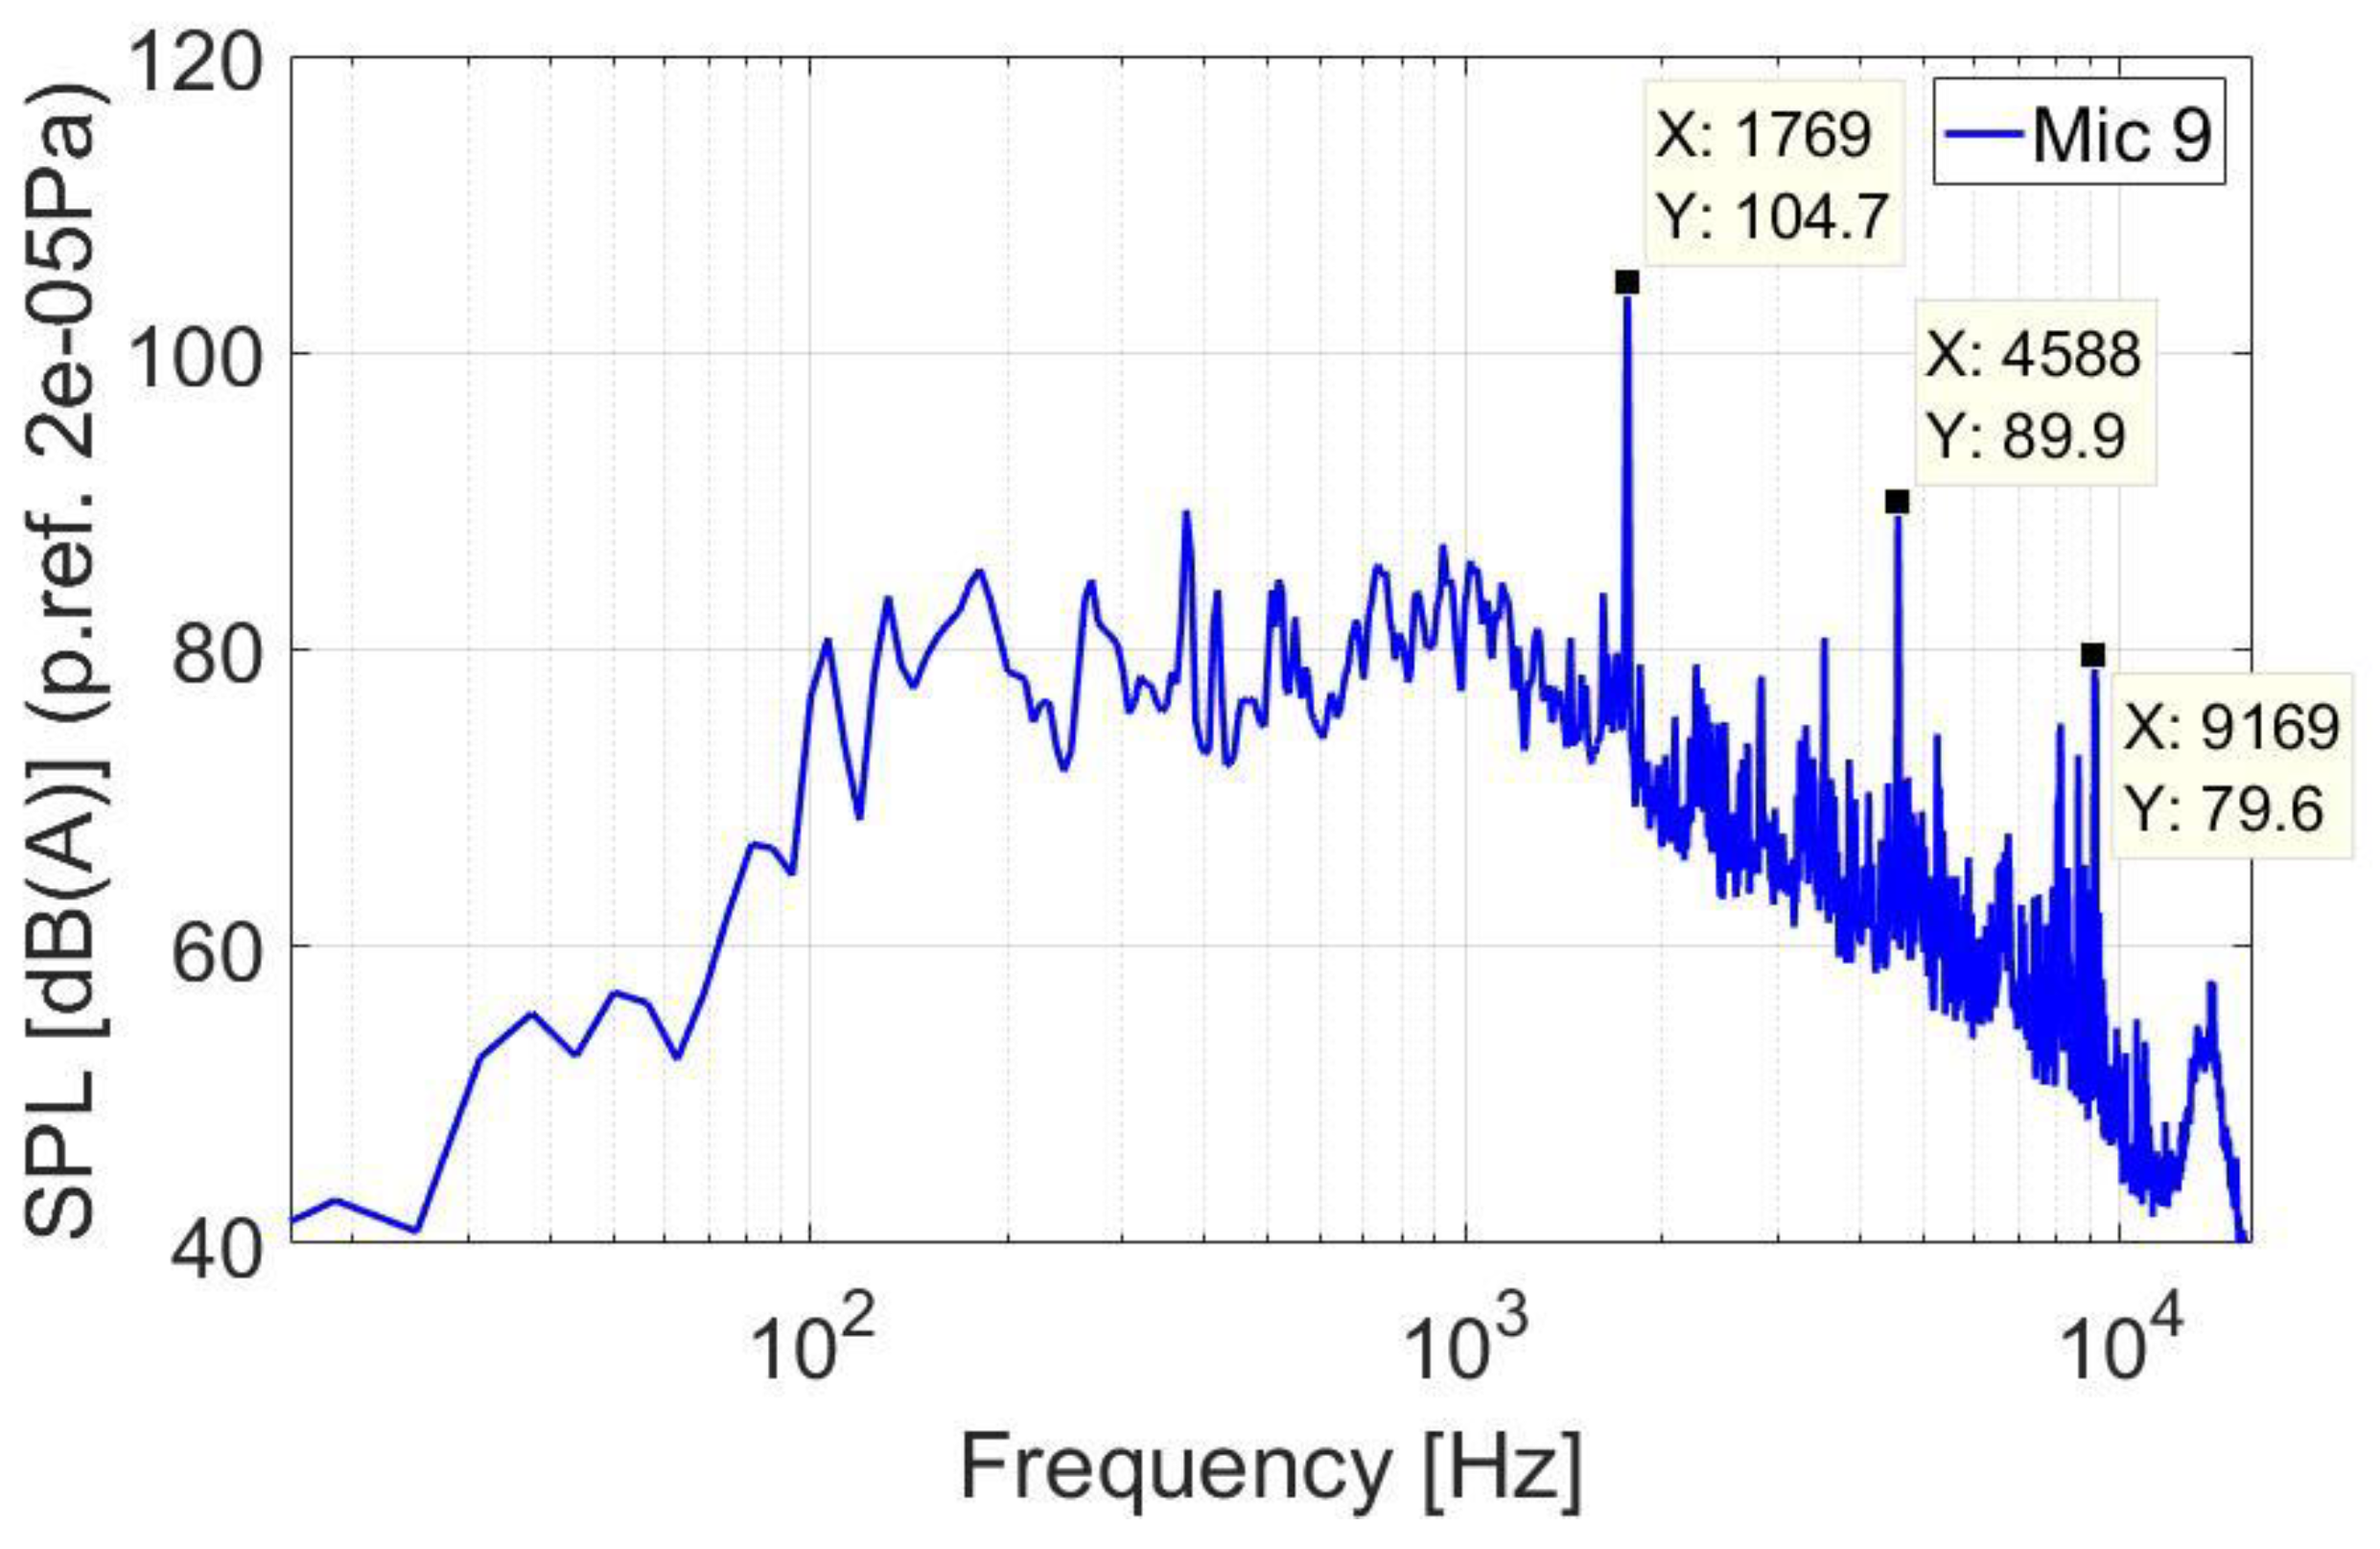
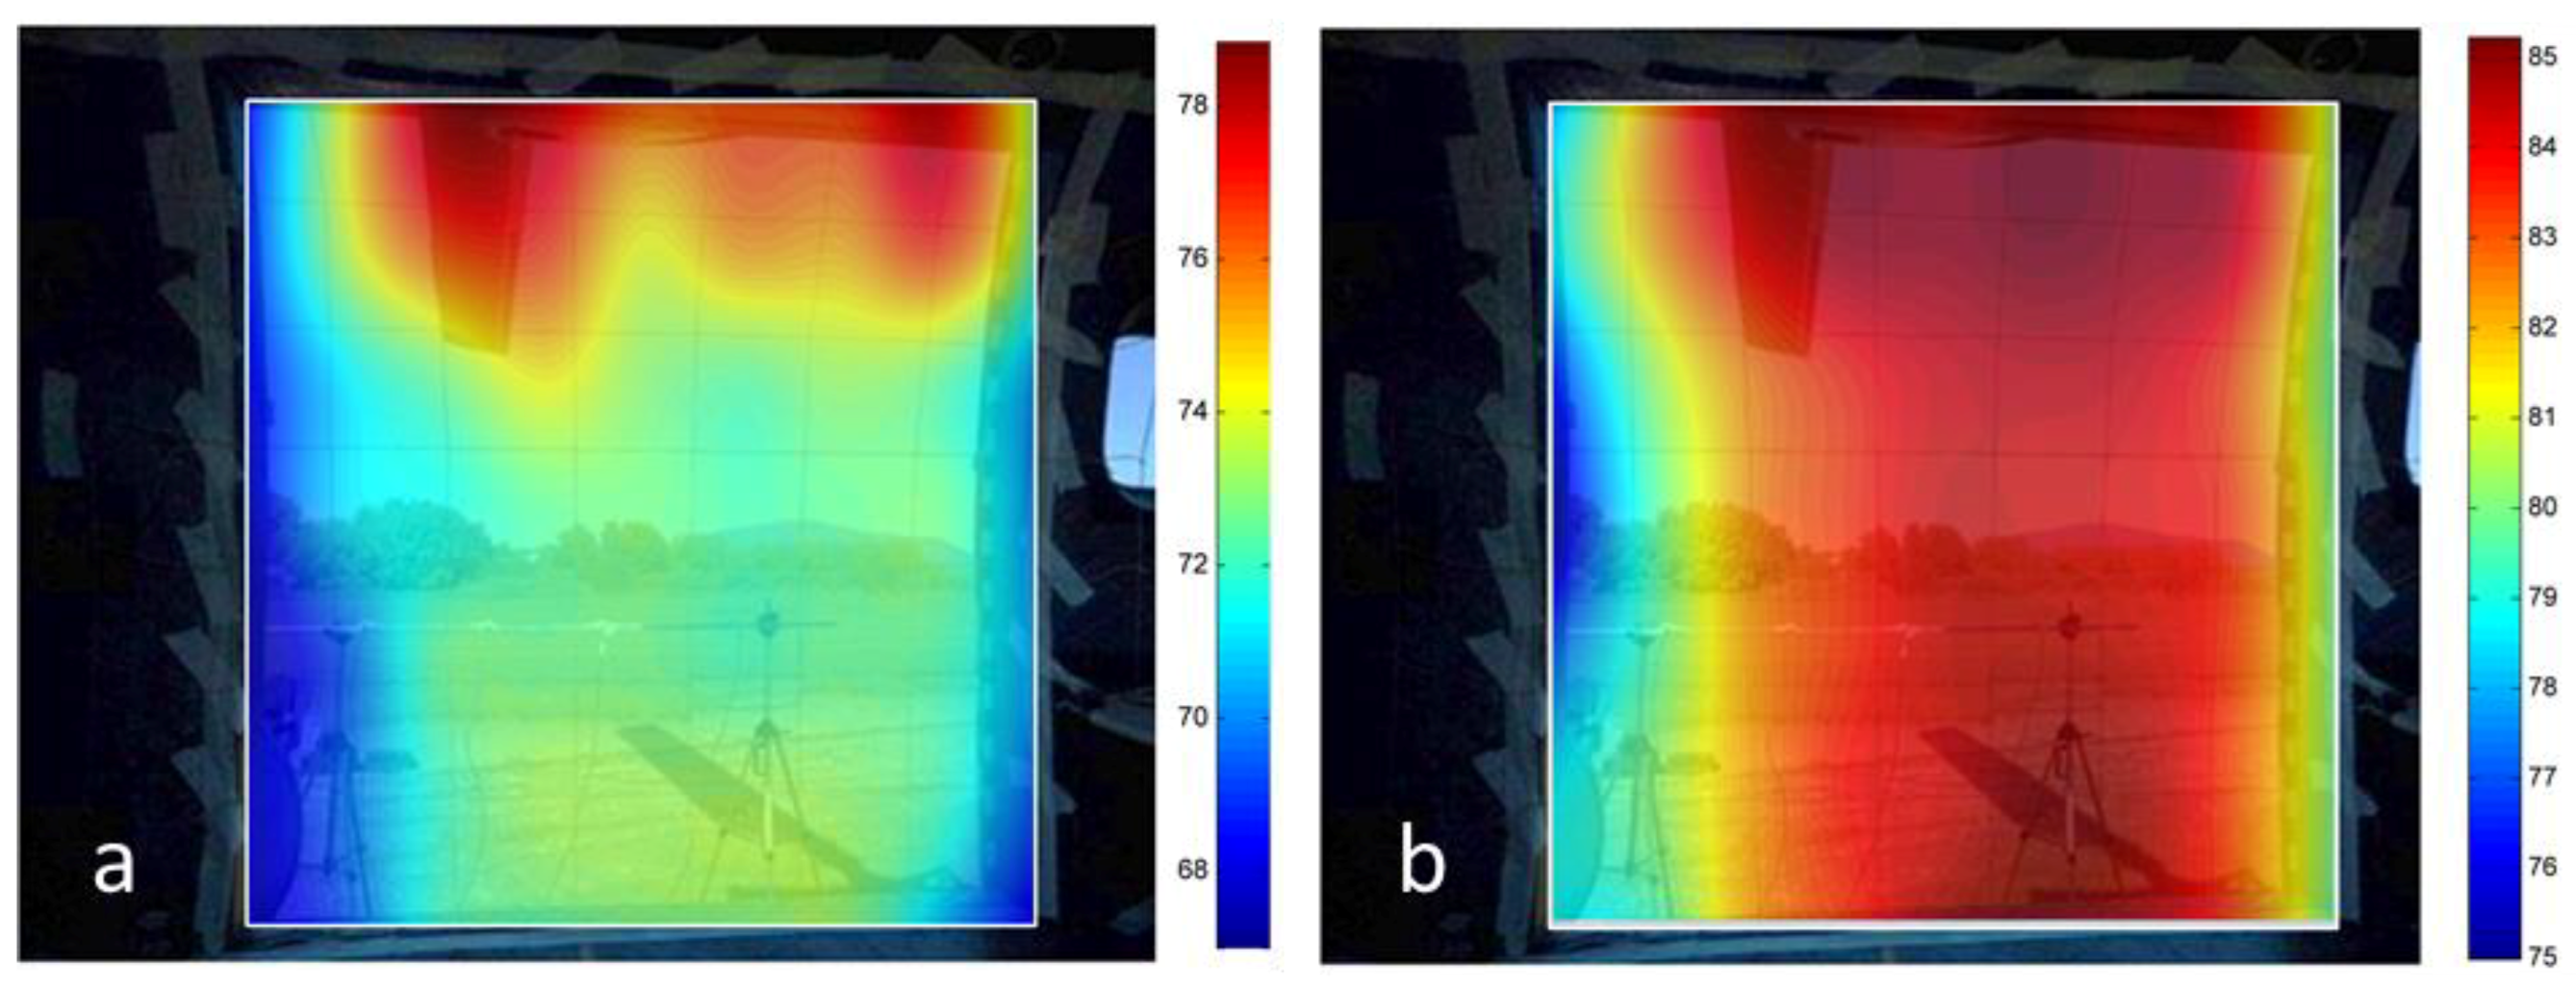
5.2.2. Part 2. Acoustic Intensity
6. Conclusions
Author Contributions
Funding
Institutional Review Board Statement
Informed Consent Statement
Data Availability Statement
Conflicts of Interest
References
- Eurpoean Commission. Aeronautics and Air Transport: Beyond Vision 2020 (Towards 2050) A Background Document from ACARE (The Advisory Council for Aeronautics Research in Europe); Eurpoean Commission: Brussels, Belgium, 2010.
- Pathak, K. Noise Level Monitoring. Environ. Monit. 2009, I, 247–250. [Google Scholar]
- Schmitz, F.H. Chapter 2: Rotor Noise. In Aeroacoustics of Flight Vehicles, Theory and Practice; Hubbard, H.H., Ed.; Acoustical Society of America through the American Institute of Physics: College Park, MD, USA, 1995; Volume 1. [Google Scholar]
- Schmiz, F.H.; Yu, Y.H. Helicopter impulsive noise: Theoretical and experimental status. J. Sound Vib. 1986, 109, 361–422. [Google Scholar] [CrossRef]
- Miller, R.H. Methods for rotor aerodynamic and dynamic analysis. Prog. Aerosp. Sci. 1985, 22, 13–160. [Google Scholar] [CrossRef]
- Edwards, B. Psychoacoustic Testing of Modulated Blade Spacing for Main Rotors. NASA/CR-2002-211651. Available online: https://www.cs.odu.edu/~mln/ltrs-pdfs/NASA-2002-cr211651.pdf (accessed on 6 August 2021).
- Leverton, J.W. Helicopter Noise: What is the Problem? Vertiflite 2014, 60, 12–15. [Google Scholar]
- Magliozzi, B.; Metzger, F.B.; Bausch, W.; King, R.J. A Comprehensive Review of Helicopter Noise Literature; Report No. FAA-RD-75-79; National Technical Information Service: Springfield, VA, USA, 1975; pp. 13–34.
- AgustaWestland, T.; Swisshelicopter, M. Helicopter Noise Reduction Technology (Status Report). Available online: https://www.icao.int/environmental-protection/Documents/Helicopter_Noise_Reduction_Technology_Status_Report_April_2015.pdf (accessed on 24 May 2021).
- Küpper, T.E.; Steffgen, J.; Jansing, P. Noise Exposure During Alpine Helicopter Rescue Operations. Annals Occup. Hyg. 2004, 48, 475–481. [Google Scholar] [CrossRef] [Green Version]
- Julien, C.; Franck, M.; Yannick, U.; Aubourg, P.A. Comprehensive approach for noise reduction in helicopter cabins. In Proceedings of the 35th European Rotorcraft Forum, Hamburg, Germany, 22–25 September 2009. [Google Scholar]
- Caillet, J.; Marrot, F.; Dupont, P.; Malburet, F.; Carmona, J.C. Nearfield Acoustical Holography measurement inside a helicopter cabine. In Proceedings of the European Test & Telemetry Conference, Toulouse, France, 7–9 June 2005. [Google Scholar]
- Marze, H.J.; Dambra, F.N. Helicopter internal noise treatment. Recent methodologies and practical applications. In Proceedings of the 11th European Rotorcraft Forum, London, UK, 10–13 September 1985. [Google Scholar]
- Schmitz, F.H.; Greenwood, E.; Sickenberger, R.D.; Gopalan, G.; Sim, B.W.C.; Conner, D.; Moralez, E., III; Decker, W.A. Measurement and Characterization of Helicopter Noise in Steady-State and Maneuvering Flight. In Proceedings of the American Helicopter Society Annual Forum, Virginia Beach, VA, USA, 1–3 May 2007. [Google Scholar]
- Novak, D.; Bucak, T.; Miljković, D. Comparative helicopter noise analysis in static and in-flight conditions. J. Acoust. Soc. Am. 2008, 123, 3537. [Google Scholar] [CrossRef]
- Tatić, B.; Bogojević, N.; Todosijević, S.; Šoškić, Z. Analysis of noise level generated by helicopters with various numbers of blades in the main rotor. In Proceedings of the 23th National Conference & 4th International Conference Noise and Vibration, Nis, Serbia, 17–19 October 2012. [Google Scholar]
- Nelson, G.; Rajamani, R.; Erdman, A. Noise control challenges for auscultation on medical evacuation helicopters. Appl. Acoust. 2014, 80, 68–78. [Google Scholar] [CrossRef]
- Caillet, J.; Marrot, F.; Unia, Y.; Aubourg, P.-A. Comprehensive approach for noise reduction in helicopter cabins. Aerosp. Sci. Technol. 2012, 23, 17–25. [Google Scholar] [CrossRef]
- Available online: www.iar.ro/en/ (accessed on 24 May 2021).
- Available online: www.easa.europa.eu (accessed on 24 May 2021).
- ISO 5129 Acoustics—Measurement of Sound Pressure Levels in the Interior of Aircraft During Flight. Available online: https://www.iso.org/standard/32344.html (accessed on 24 May 2021).
- SR EN ISO 9614-2/2000 Acoustics—Determination of Sound Power Levels of Noise Sources Using Sound Intensity. Available online: https://www.iso.org/standard/21247.html (accessed on 24 May 2021).
- Available online: http://www.comoti.ro/en/laboratoare_experimentari_4_2.htm (accessed on 24 May 2021).
- ISO 3746 Acoustics—Determination of Sound Power Levels and Sound Energy Levels of Noise Sources Using Sound Pressure —Survey Method Using an Enveloping Measurement Surface Over a Reflecting Plane. Available online: https://www.iso.org/standard/52056.html (accessed on 24 May 2021).
- IEC61672: 2014 Standard: Electroacoustics—Sound Level Meters. Available online: https://standards.iteh.ai/catalog/standards/sist/152936bc-bdc1-486a-93fb-fe9b8fb6526f/sist-en-61672-1-2014 (accessed on 24 May 2021).


| Parameter | Min | Max |
|---|---|---|
| Altitude [m] | 464 | 1031 |
| Engine 1 speed [%] | 0 | 92.8 |
| Engine 2 speed [%] | 0 | 95.8 |
| Long true air speed [m/s] | 0 | 237 |
| Pitch [deg.] | −2.2 | 2.5 |
| Zone | 1 | 2 | 3 | 4 | 5 | 6 | 7 |
|---|---|---|---|---|---|---|---|
| LAeq dB(A) | 101.7 | 104.7 | 106.5 | 105.9 | 103.6 | 99.7 | 97.2 |
Publisher’s Note: MDPI stays neutral with regard to jurisdictional claims in published maps and institutional affiliations. |
© 2021 by the authors. Licensee MDPI, Basel, Switzerland. This article is an open access article distributed under the terms and conditions of the Creative Commons Attribution (CC BY) license (https://creativecommons.org/licenses/by/4.0/).
Share and Cite
Deaconu, M.; Cican, G.; Toma, A.-C.; Drăgășanu, L.I. Helicopter Inside Cabin Acoustic Evaluation: A Case Study—IAR PUMA 330. Int. J. Environ. Res. Public Health 2021, 18, 9716. https://0-doi-org.brum.beds.ac.uk/10.3390/ijerph18189716
Deaconu M, Cican G, Toma A-C, Drăgășanu LI. Helicopter Inside Cabin Acoustic Evaluation: A Case Study—IAR PUMA 330. International Journal of Environmental Research and Public Health. 2021; 18(18):9716. https://0-doi-org.brum.beds.ac.uk/10.3390/ijerph18189716
Chicago/Turabian StyleDeaconu, Marius, Grigore Cican, Adina-Cristina Toma, and Luminița Ioana Drăgășanu. 2021. "Helicopter Inside Cabin Acoustic Evaluation: A Case Study—IAR PUMA 330" International Journal of Environmental Research and Public Health 18, no. 18: 9716. https://0-doi-org.brum.beds.ac.uk/10.3390/ijerph18189716