Article

Air Pollution during Pregnancy and Childhood Autism Spectrum Disorder in Taiwan

1
Department of Environmental and Occupational Health, College of Medical, National Cheng Kung University, Tainan 704, Taiwan
2
Department of Environmental Health, Harvard University T.H. Chan School of Public Health, Boston, MA 02115, USA
3
Department of Occupational and Environmental Medicine, National Cheng Kung University Hospital, Tainan 704, Taiwan
4
Department of Tourism, Food, and Beverage Management, College of Management, Chang Jung Christian University, Tainan 711, Taiwan
*
Author to whom correspondence should be addressed.
Int. J. Environ. Res. Public Health 2021, 18(18), 9784; https://0-doi-org.brum.beds.ac.uk/10.3390/ijerph18189784
Submission received: 19 July 2021 / Revised: 3 September 2021 / Accepted: 13 September 2021 / Published: 17 September 2021

Abstract

:
Air pollutants have been linked to some diseases in humans, but their effects on the nervous system were less frequently evaluated. Autism spectrum disorder (ASD) is a group of neurondevelopmental disorders of which the etiology is still unknown. We conducted a study in Taiwan to evaluate the possible associations between prenatal exposure to air pollutants and ASD. From a random sample of one million people in the National Insurance Research Database, we identified all the infants born between 1996 and 2000. We followed them till the end of 2013 and identified cases of ASD. We traced back the mothers’ residence and assessed the exposure to air pollutants using the data obtained from the air quality monitoring database maintained by the government, which included ozone (O3), carbon monoxide (CO), nitrogen dioxide (NO2), sulfur dioxide (SO2), and particulate matters with diameter less than 10 µm (PM10). Cox proportional hazard models were constructed to evaluate the associations between childhood ASD and exposures to the pollutants in the three trimesters and the whole gestation. We identified a total of 63,376 newborns and included 62,919 as the study cohort. After adjusting for other risk factors, we observed trimester-specific associations between levels of CO, NO2, and PM10 and the risk of childhood ASD. An increase of 1 ppm of CO in the first, second, and third trimester was associated with a hazard ratio (HR) of 1.93 (95% confidence interval [CI]: 1.55–2.39), 1.77 (95%CI: 1.41–2.22), and 1.75 (95%CI: 1.39–2.21), respectively. An increase of 10 ppb in the level of NO2 in the first, second, and third trimester was associated with an HR of 1.39 (95%CI: 1.22–1.58), 1.25 (95%CI: 1.10–1.42), and 1.18 (95%CI: 1.03–1.34), respectively. In conclusion, we found that exposures to CO and NO2 in all three trimesters were associated with increased risks of developing ASD.

1. Introduction

Autism spectrum disorder (ASD) is a group of neurodevelopmental disorders that contains autistic disorder, Asperger’s disorder, and pervasive developmental disorder not otherwise specified (PDD-NOS) [1]. ASD was once regarded as a rare disease, and a study in the 1960s showed that the prevalence was 4.5 cases per 10,000 children [2]. However, the prevalence of ASD has been increasing dramatically since 1990s [3,4]. Reviews of the literature showed that it was 4.7 cases per 10,000 children in 1990–1993 but had rapidly increased to 12.7 cases per 10,000 children in 1994–2004 [5,6]. In the latest decade, the prevalence has reached 63.5 cases per 10,000 children [7]. There is also an increasing trend in Asia. Studies in Asia reported a prevalence of nearly 2 cases per 10,000 children in the 1970s [8,9,10,11], and the prevalence became over 10 cases per 10,000 children about four decades later [12]. A meta-analysis of studies in Asian countries found the prevalence elevated annually, from 8.5 cases per 10,000 children in 2000–2004 to 10.3 per 10,000 in 2005–2009, and then 16.4 per 10,000 children in 2011 [13]. Taiwan is no exception. An analysis of data from the national health insurance found the prevalence increased from 1.79 to 28.72 cases per 10,000 children between 1997 and 2005 [14], and an analysis of data from the national disability registry found disabling ASD increased from 3.7 to 22.1 cases per 10,000 children between 2004 and 2010 [15]. This increase might represent the changing in diagnostic tools, case definitions, awareness of the public, and health service accessibility [5,12,16]. However, a true increase in the incidence rate [17,18,19] might also contribute to the increasing prevalence [1,5,6,20,21].
The main characteristics of ASD are abnormal development or impairment in social interaction, impaired verbal and nonverbal communication, and markedly restricted activities and interests (American Psychiatric Association 2000). The cause of ASD is still unknown so far. It was once regarded as a genetic disease [3,22]. However, recent twin studies reported that both genetic and environmental factors contribute to the disease, and environmental factors might even contribute as high as 55% of the cause [23,24]. Air pollution during pregnancy has been known as an environmental factor for adverse pregnant health outcomes. High levels of air pollutants during pregnancy, including carbon monoxide (CO), ozone (O3), polycyclic organic matter, and particulate matters less than 10 μm in diameter (PM10), were found to be associated with low birth weight, preterm birth, and stillbirth [25,26,27]. Physical differences, including a reduction in biparietal diameter and head circumference, have also been observed in children born to mothers with exposure to air pollutants during pregnancy, including PM10, O3, nitrogen dioxide (NO2), and sulfur dioxide (SO2) [28]. Furthermore, exposure to air pollution was found to be associated with developmental outcomes. Infants with exposure to high levels of black carbon and NO2 were found to have decreased cognitive and intelligence performance [29,30]. Therefore, air pollution is a plausible environmental factor for ASD, and the rapidly increasing levels of air pollutants might contribute to the fast growing number of patients of ASD globally.
In fact, there is growing literature on the associations between ambient air pollution and ASD [31,32,33,34,35,36]. Many of the studies were case-control studies, which often suffer from information bias in the reporting of health outcomes. Although some studies found associations between air pollution and ASD, the exposure periods studied varied across studies, and findings on the critical exposure period were inconsistent. Besides, studies on Asian populations are still limited. Therefore, we used the Taiwan National Health Insurance Research Database and Taiwan air monitoring database to conduct a retrospective cohort study, which evaluated the associations between the ambient air pollution exposure in different gestation periods and the risk of ASD.

2. Materials and Methods
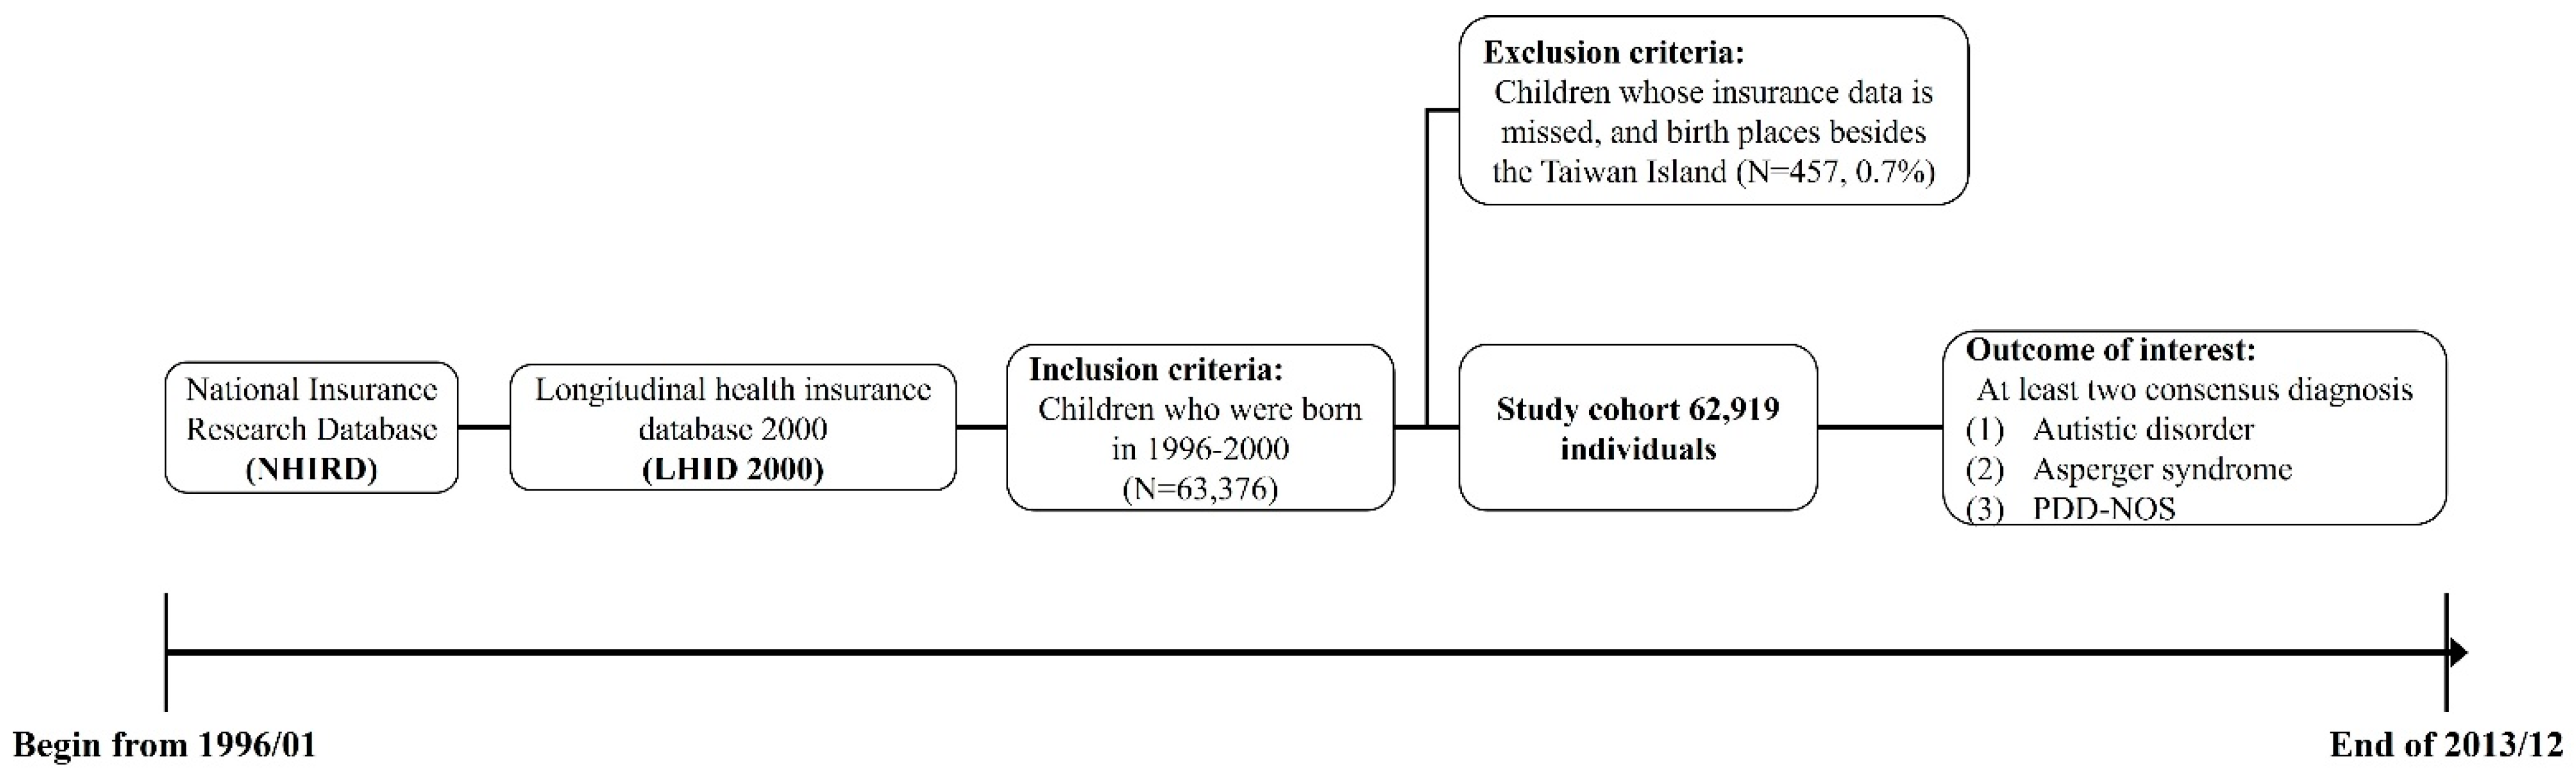
2.1. Study Cohort

This population-based cohort study included members from the Longitudinal Health Insurance Database 2000 (LHID2000), which randomly sampled one million individuals who were covered by the national health insurance in 2000 and has followed them up ever since. LHID2000 was constructed by the government to provide a resource for research and is based on a representative sample of the whole population in Taiwan. The national health insurance covers more than 99% of the residents in Taiwan and provides comprehensive health care with a very low premium [37]. LHID2000 contained all the claim records from the beginning of the insurance program.
We identified all the live births from 1996 to 2000 in the LHID2000 and excluded those who had missing data on the insurance enrollment date or lived outside the Taiwan main island. The follow-up time was calculated as the duration from the enrollment date to the date of the first diagnosis of ASD or the end of the study period (31 December 2013).

2.2. Identification of Cases

The LHID2000 coded diagnoses according to the International Classification of Diseases, Ninth Revision, Clinical Modification (ICD-9-CM). We included three diagnosis codes as ASD: autistic disorder (ICD-9-CM code: 299.0), Asperger syndrome (299.8), and PDD-NOS (299.9) [36]. Individuals who had at least two identical target diagnoses on different dates were identified as having ASD. Because the National Health Insurance allows putting a tentative diagnosis on the insurance claim at the first visit for the illness and visiting more than one medical facility on the same day for the same illness, this inclusion criterion can exclude patients who were later diagnosed as having some diseases other than ASD. The date that the diagnosis code first appeared on a claim was defined as the date of diagnosis.

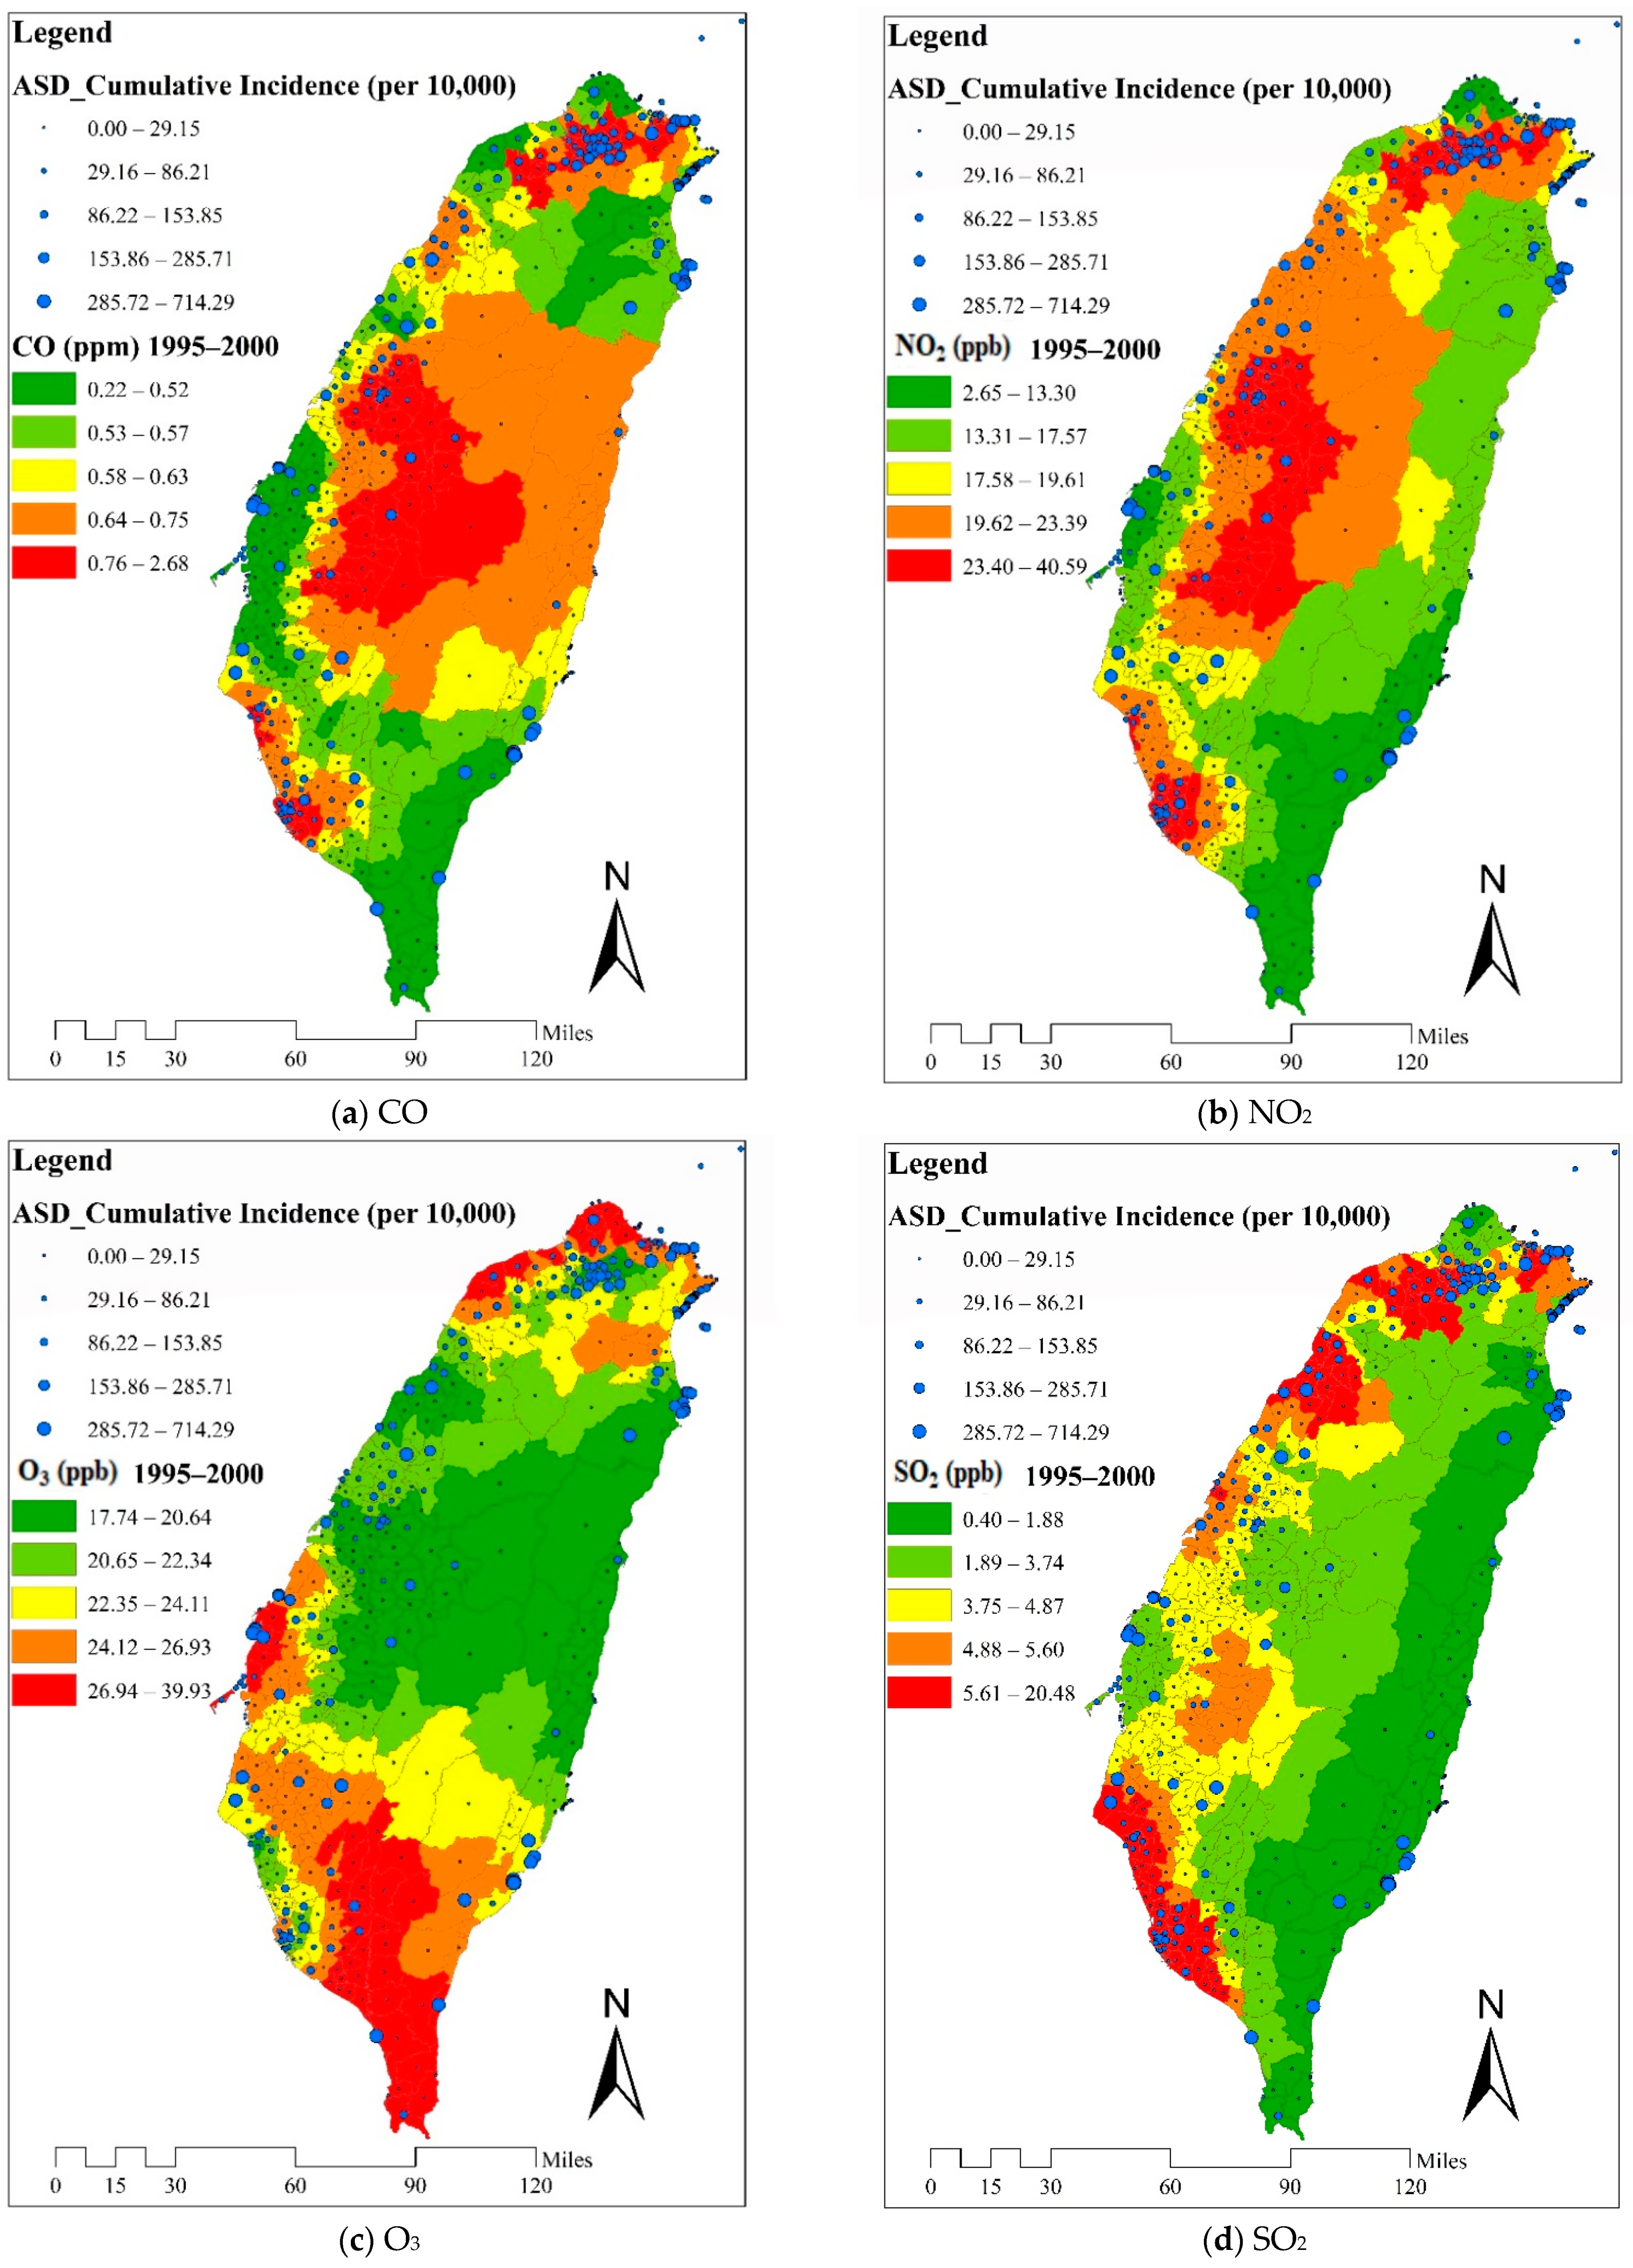
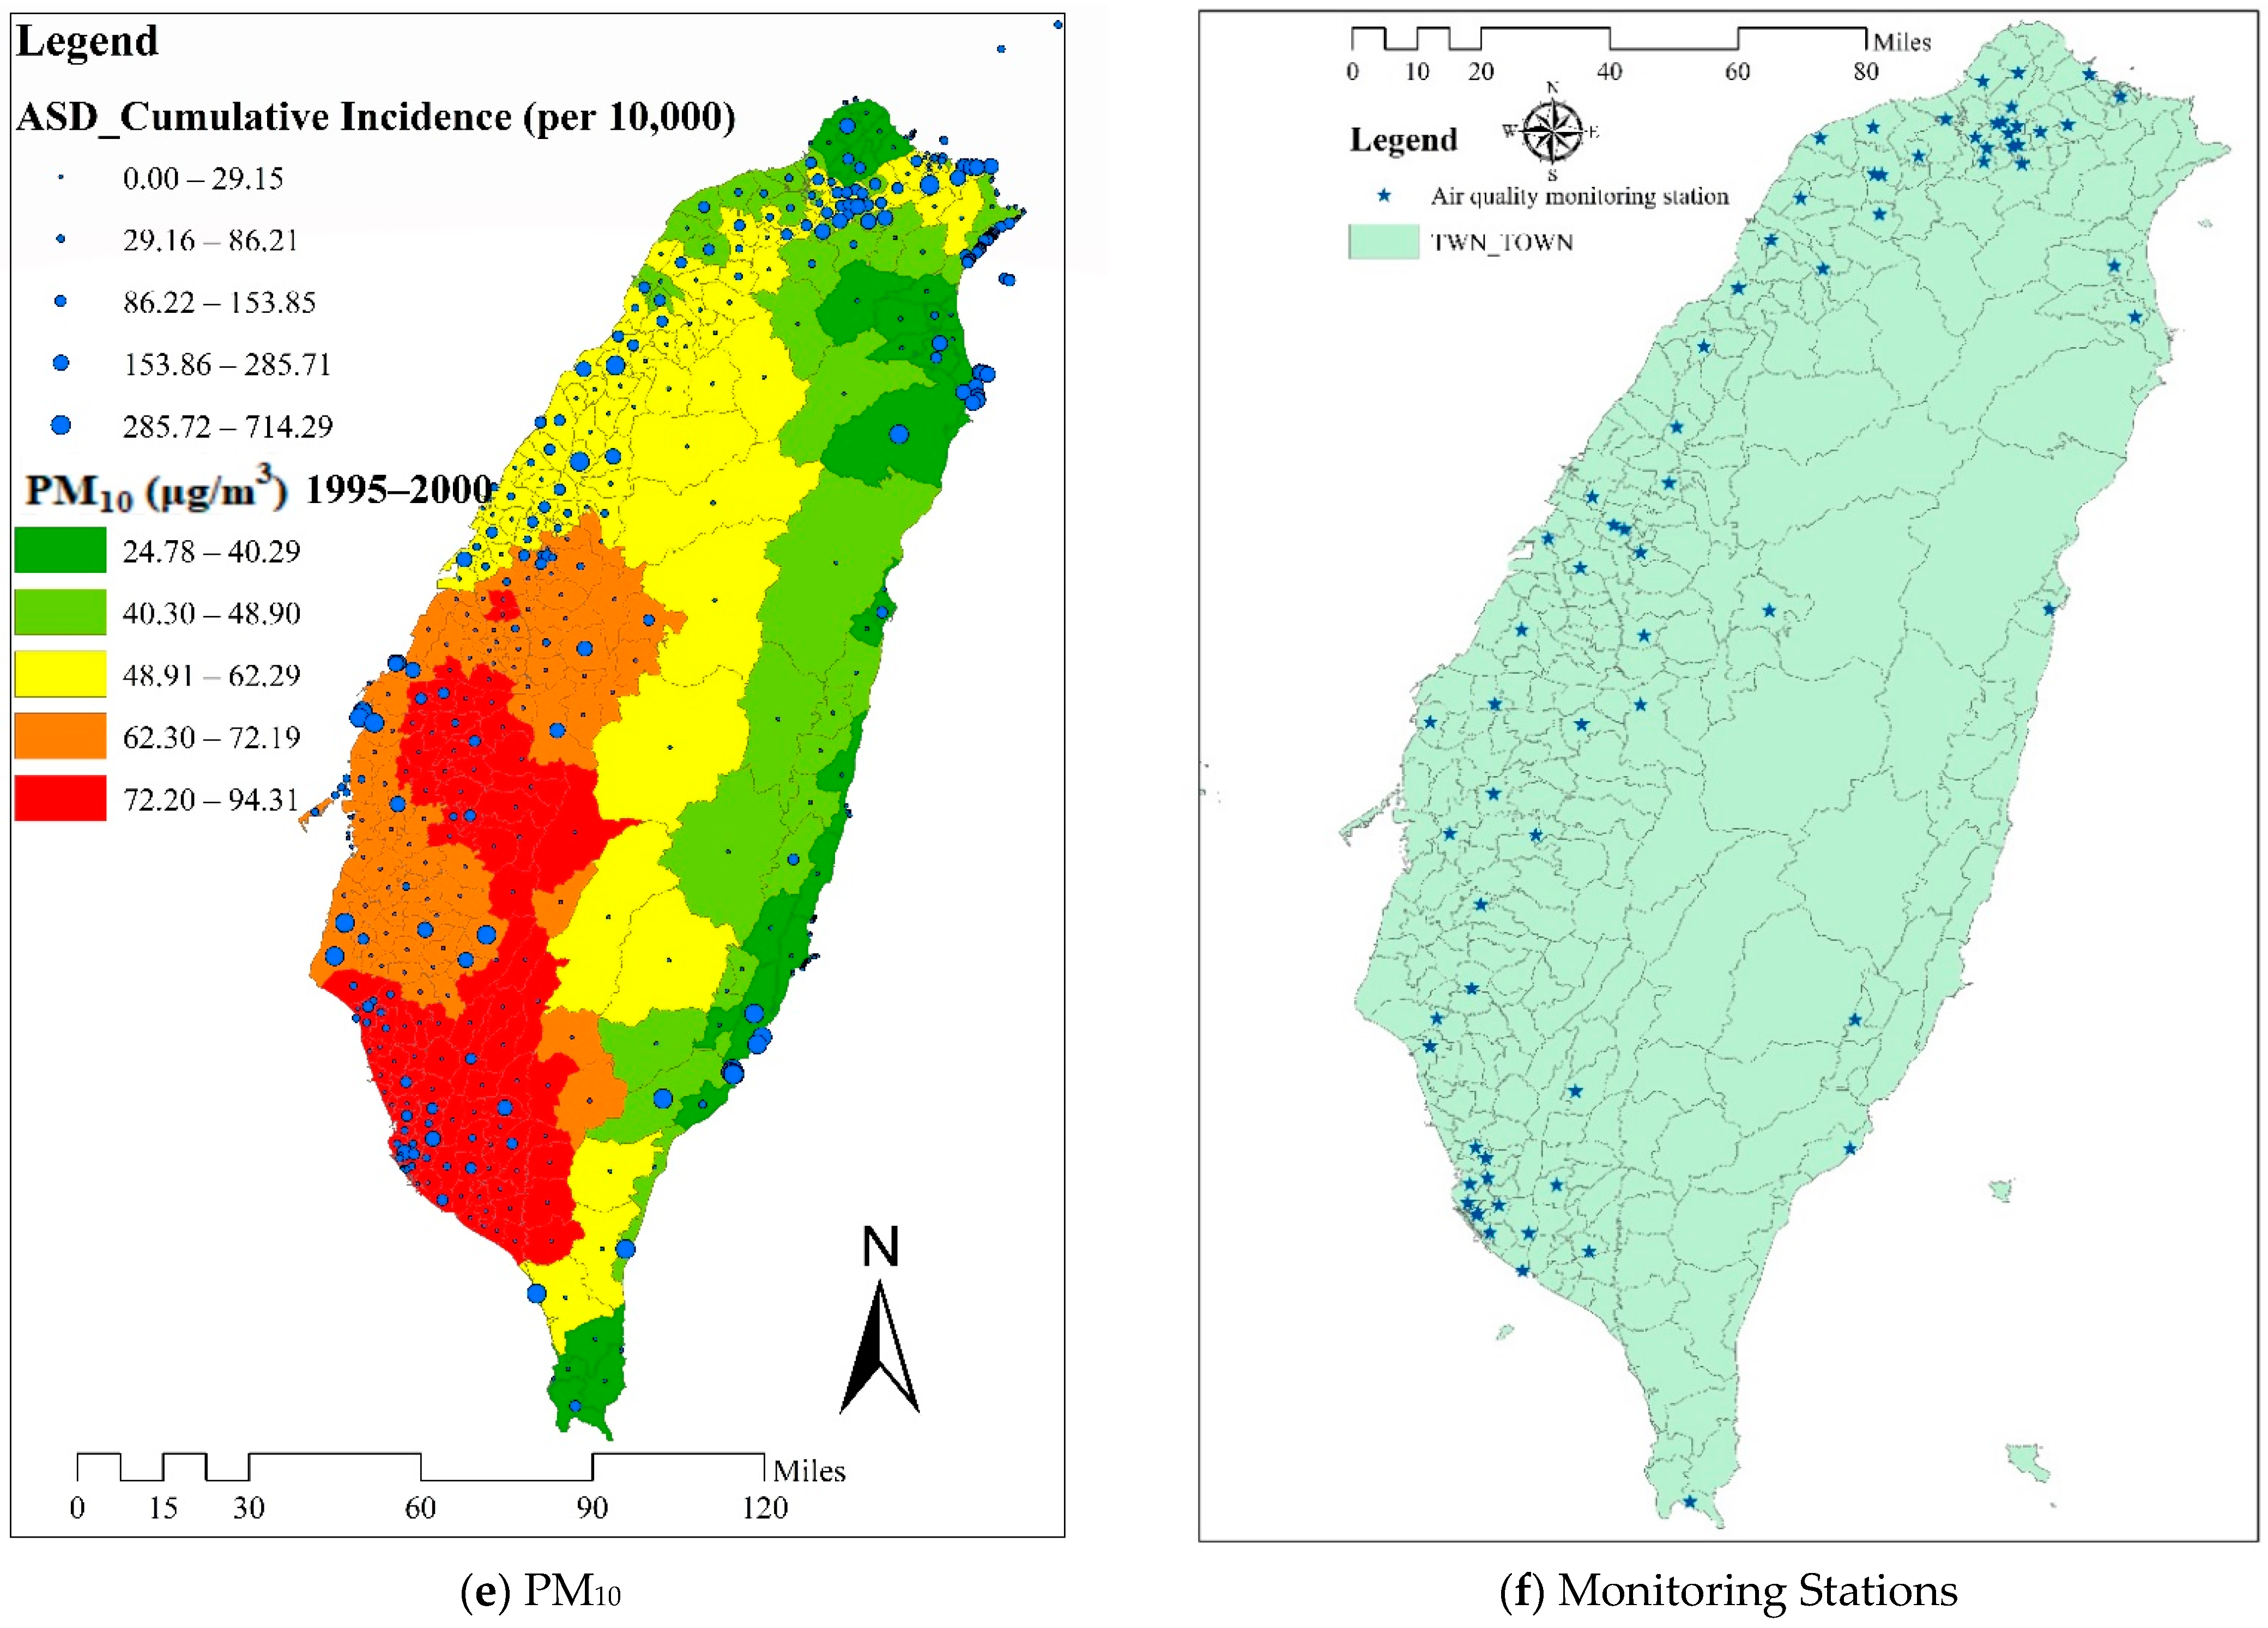
2.3. Exposure Assessment

The air pollutants studied included CO, NO2, O3, SO2, and PM10. We obtained the daily average value of each air pollutant from the hourly measurements made by the 69 automatic monitoring stations maintained by the Environmental Protection Administration on Taiwan Island from 1 January 1995 to 31 December 2000.
ArcMap GIS (Version 10.2.2, Environmental Systems Research Institute, Redlands, CA, USA) and its Geostatistical Analysts Extension were utilized to construct the estimates of ambient air pollution levels of each cohort member. The air pollution exposure gradients were computed by using the modified ordinary Kriging method [38], which can estimate the levels in unmeasured areas on the basis of data from the surrounding areas [39]. The adjusted spherical spatial model was used in this study to account for spatial autocorrelation [40]. The monitoring data were integrated into monthly data and interpolated to the township level.
The township level data were assigned to each cohort member by their postcodes in the database. In order to identify the critical prenatal exposure periods, we studied four exposure periods: the first trimester (preceding 7–9 month of birth), the second trimester (preceding 4–6 month of birth), the third trimester (preceding 1–3 month of birth), and gestation (the whole gestation period).

2.4. Covariates

According to the fact that males have a higher risk of developing ASD than females [15], we included sex in our analysis to evaluate and adjust for its effects. Likewise, because previous studies in Taiwan found an increasing trend in the occurrence of ASD [15], we included year of birth in our analysis to evaluate and adjust for the time trend. We also included comorbidities that are known to be related to ASD: anxiety (ICD-9-CM code: 300.0), bipolar disorder (296.4–296.8), depressive disorder (296.2, 296.3 and 311), intellectual disabilities (317–319), obsessive-compulsive disorder (300.3), phobic disorder (300.2), and preterm birth (765.xx).

2.5. Statistical Analysis

We used chi-square tests to evaluate differences in categorical variables and Student’s t tests to evaluate differences in continuous variables. We applied Cox proportional hazards models to evaluate associations between prenatal exposure to ambient air pollution and the risk of ASD. Multi-variate analyses were performed after univariate analyses. The air pollutants studied included CO, NO2, O3, SO2, and PM10. We used the mean level within the three-month period of each trimester as the indicator of the exposure in the analysis. For the whole gestation, we used the mean level during the whole gestation, estimated by taking the average of the mean levels of the three trimesters, as the indicator of the exposure. Due to confidentiality, the government did not provide data on the exact date of birth, just the year and month. The follow-up period ended on the date of the diagnosis, the date of leaving the insurance program (death or withdraw from the program), or the end of the study period, whichever came first.
In the multi-variate analyses, Cox proportional hazard models were used to adjust for the effect of other covariates. We first added sex and calendar year to the model (model 1), and then comorbidities were added (model 2). The effects of each pollutant on the risk of ASD were measured as an adjusted hazard ratio (HR) per ppm for CO, per 10 ppb for NO2, per 10 ppb for O3, per ppb for SO2, and per 10 μg/m3 for PM10, and the 95% confidence interval (95%CI) of each HR was constructed. The units were chosen using a previous study in Taiwan as the reference [36].
The two-tailed significance level (α level) was set at 0.05, and all the statistical analyses were performed using the SAS Enterprise Guide 6.1 for Windows (SAS Institute, Cary, NC, USA).

3. Results

3.1. Study Sample and Distribution of Patients

We included 63,376 individuals from the preliminary study cohort. After the exclusion of 52 individuals who had missing data on the insurance enrollment date and 405 who lived outside the Taiwan main island, the final study cohort included a total of 62,919 members (Figure 1). A total of 466 members were identified as having ASD (the ASD group) in the study cohort, yielding a cumulative incidence rate of 74.06 cases per 10,000 children in the study periods (Table 1). The median followed time of ASD patients was 5.66 years (mean = 6.77, standard deviation [SD] = 4.02 years), which means that 50% of the ASD patients were diagnosed at or before the age of 5.66 years old. Most members (82.83%) of the ASD group were males, and the ASD group had a higher male/female ratio than the non-ASD group (4.83 vs. 1.08, p < 0.001). The proportions of members with the comorbidities we studied were all higher in the ASD group than in the non-ASD group, and the most common comorbidity in the ASD group was intellectual disabilities (31.97%), followed by anxiety (14.16%).
The hot spots of children with ASD scattered around the main island of Taiwan without obvious geographical clustering (Figure 2). The distribution of hot areas of CO was similar to that of NO2 (Figure 2). A substantial proportion of the hot areas of O3 were in the southwest and northwest regions, but the distribution of hot areas of the SO2 was quite different from that of hot areas of O3. The hot areas of PM10 were clustered in the southwest region.
The text continues here (Figure 2 and Table 2).

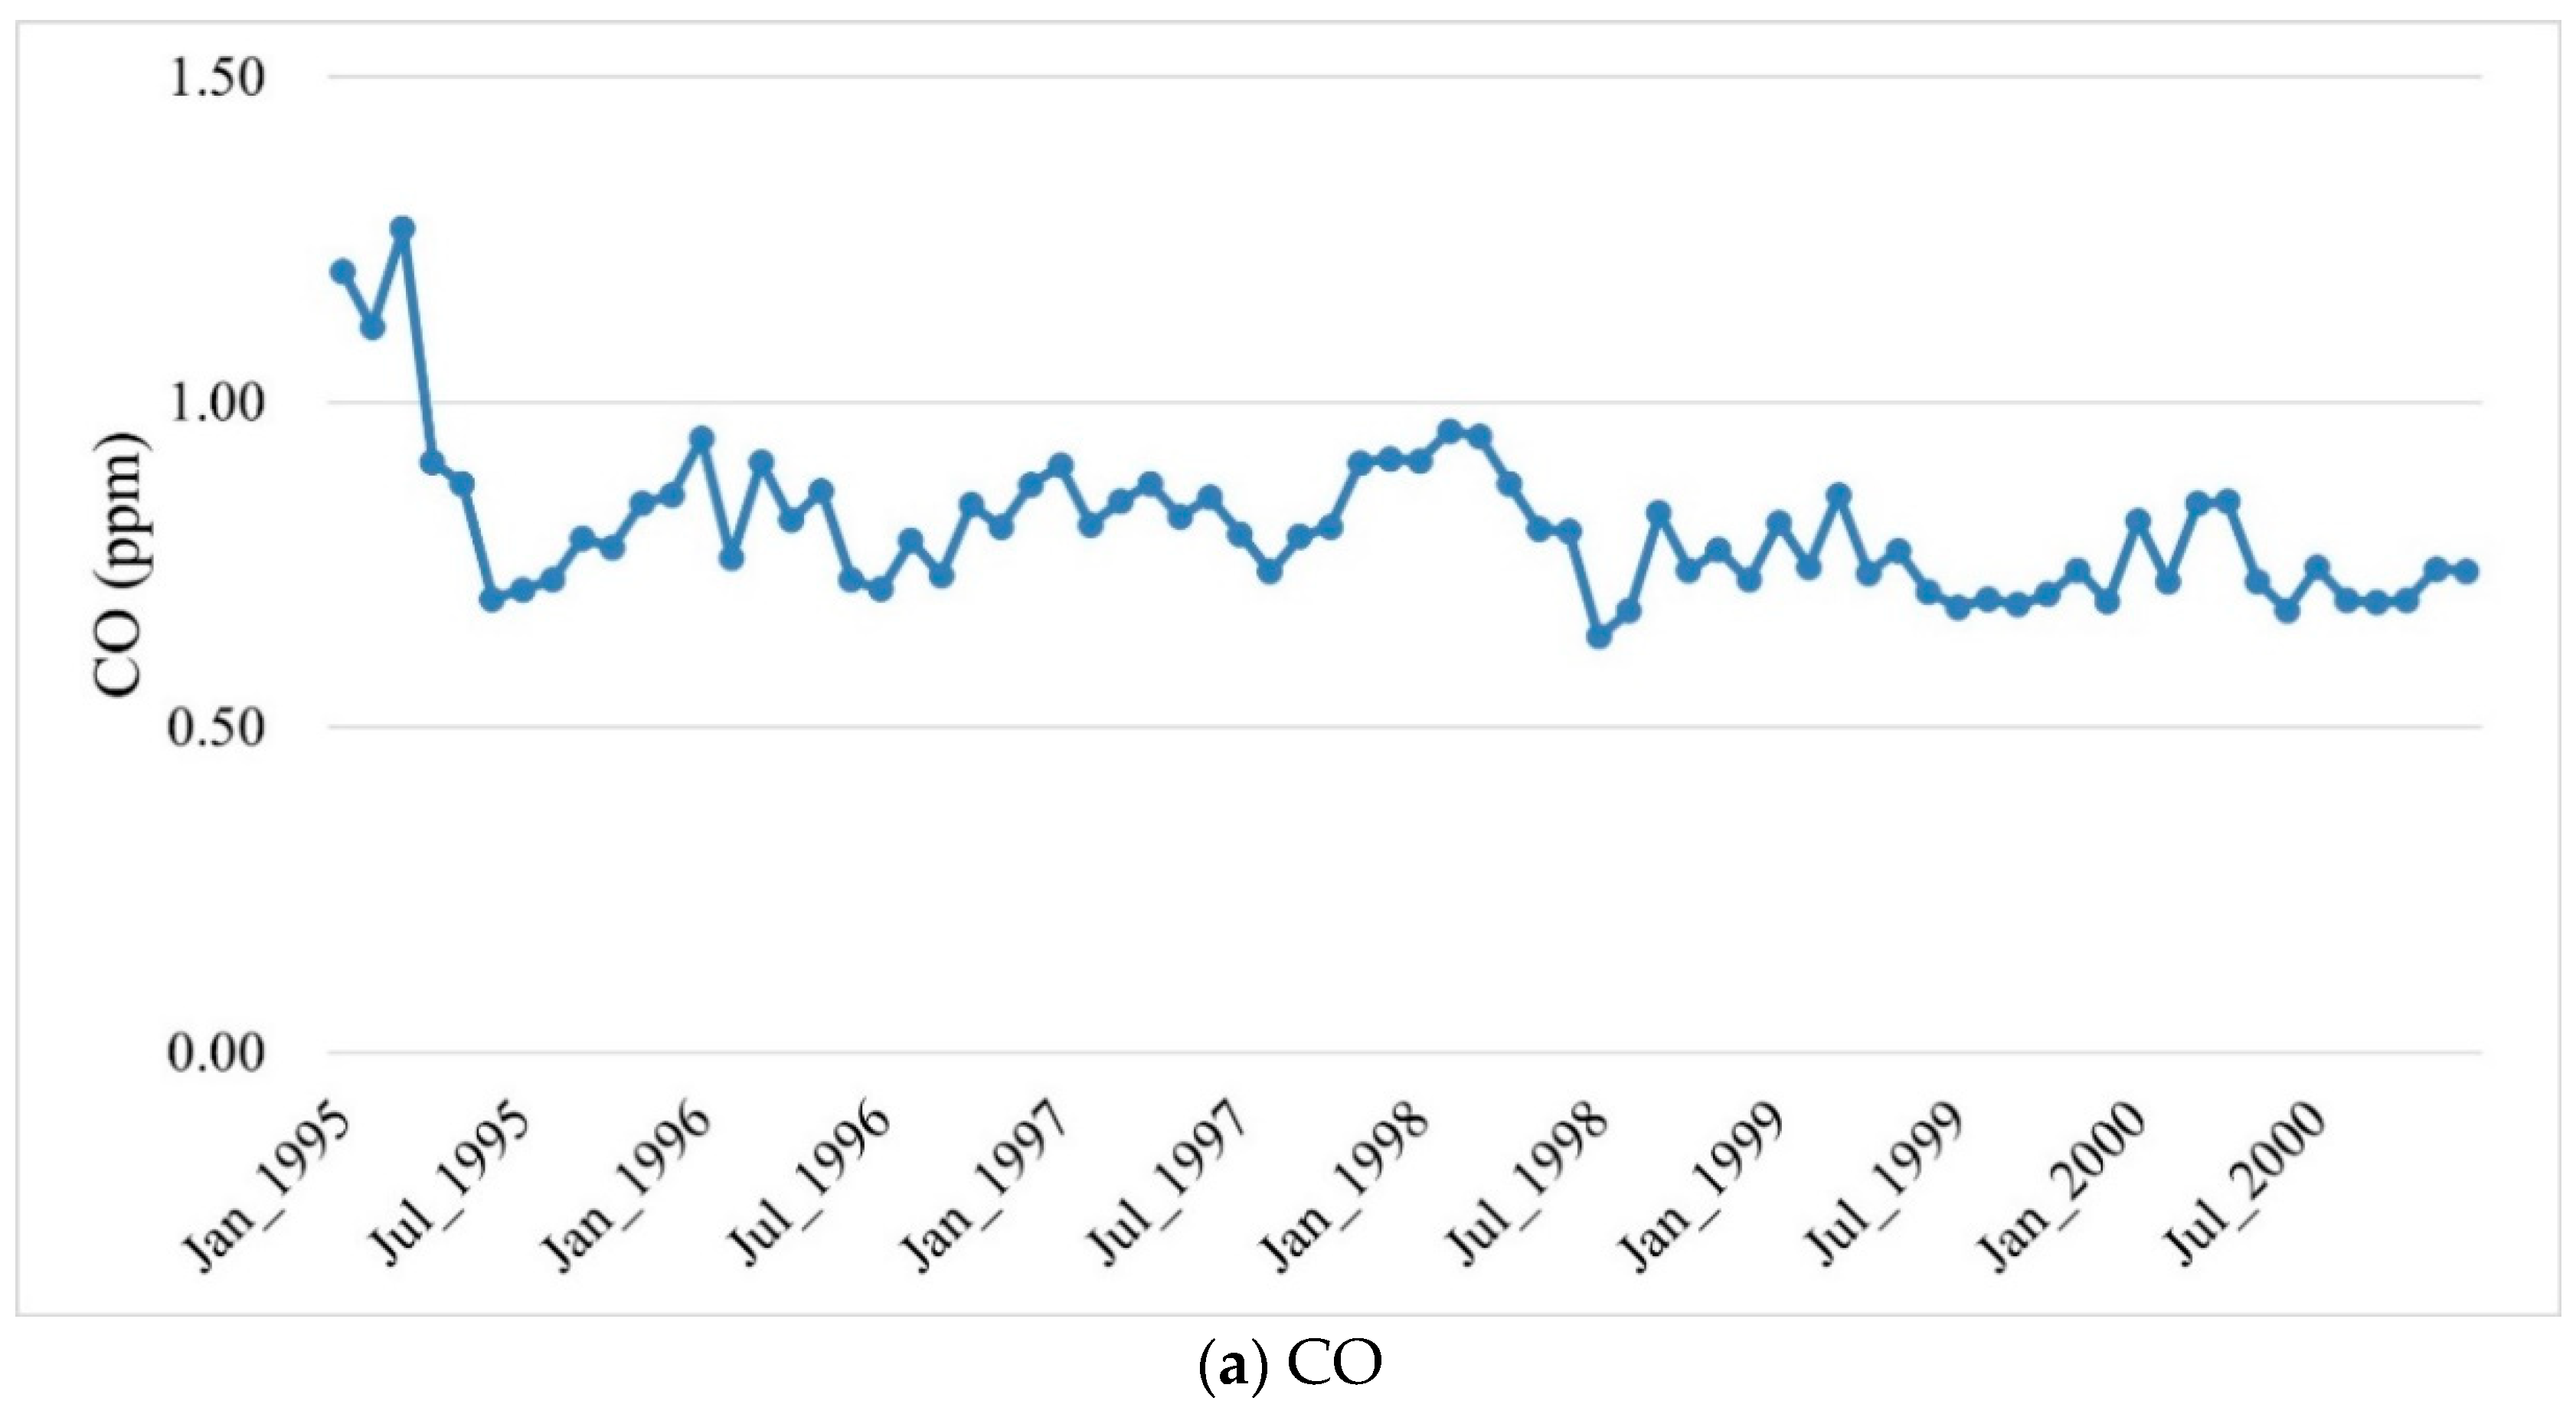
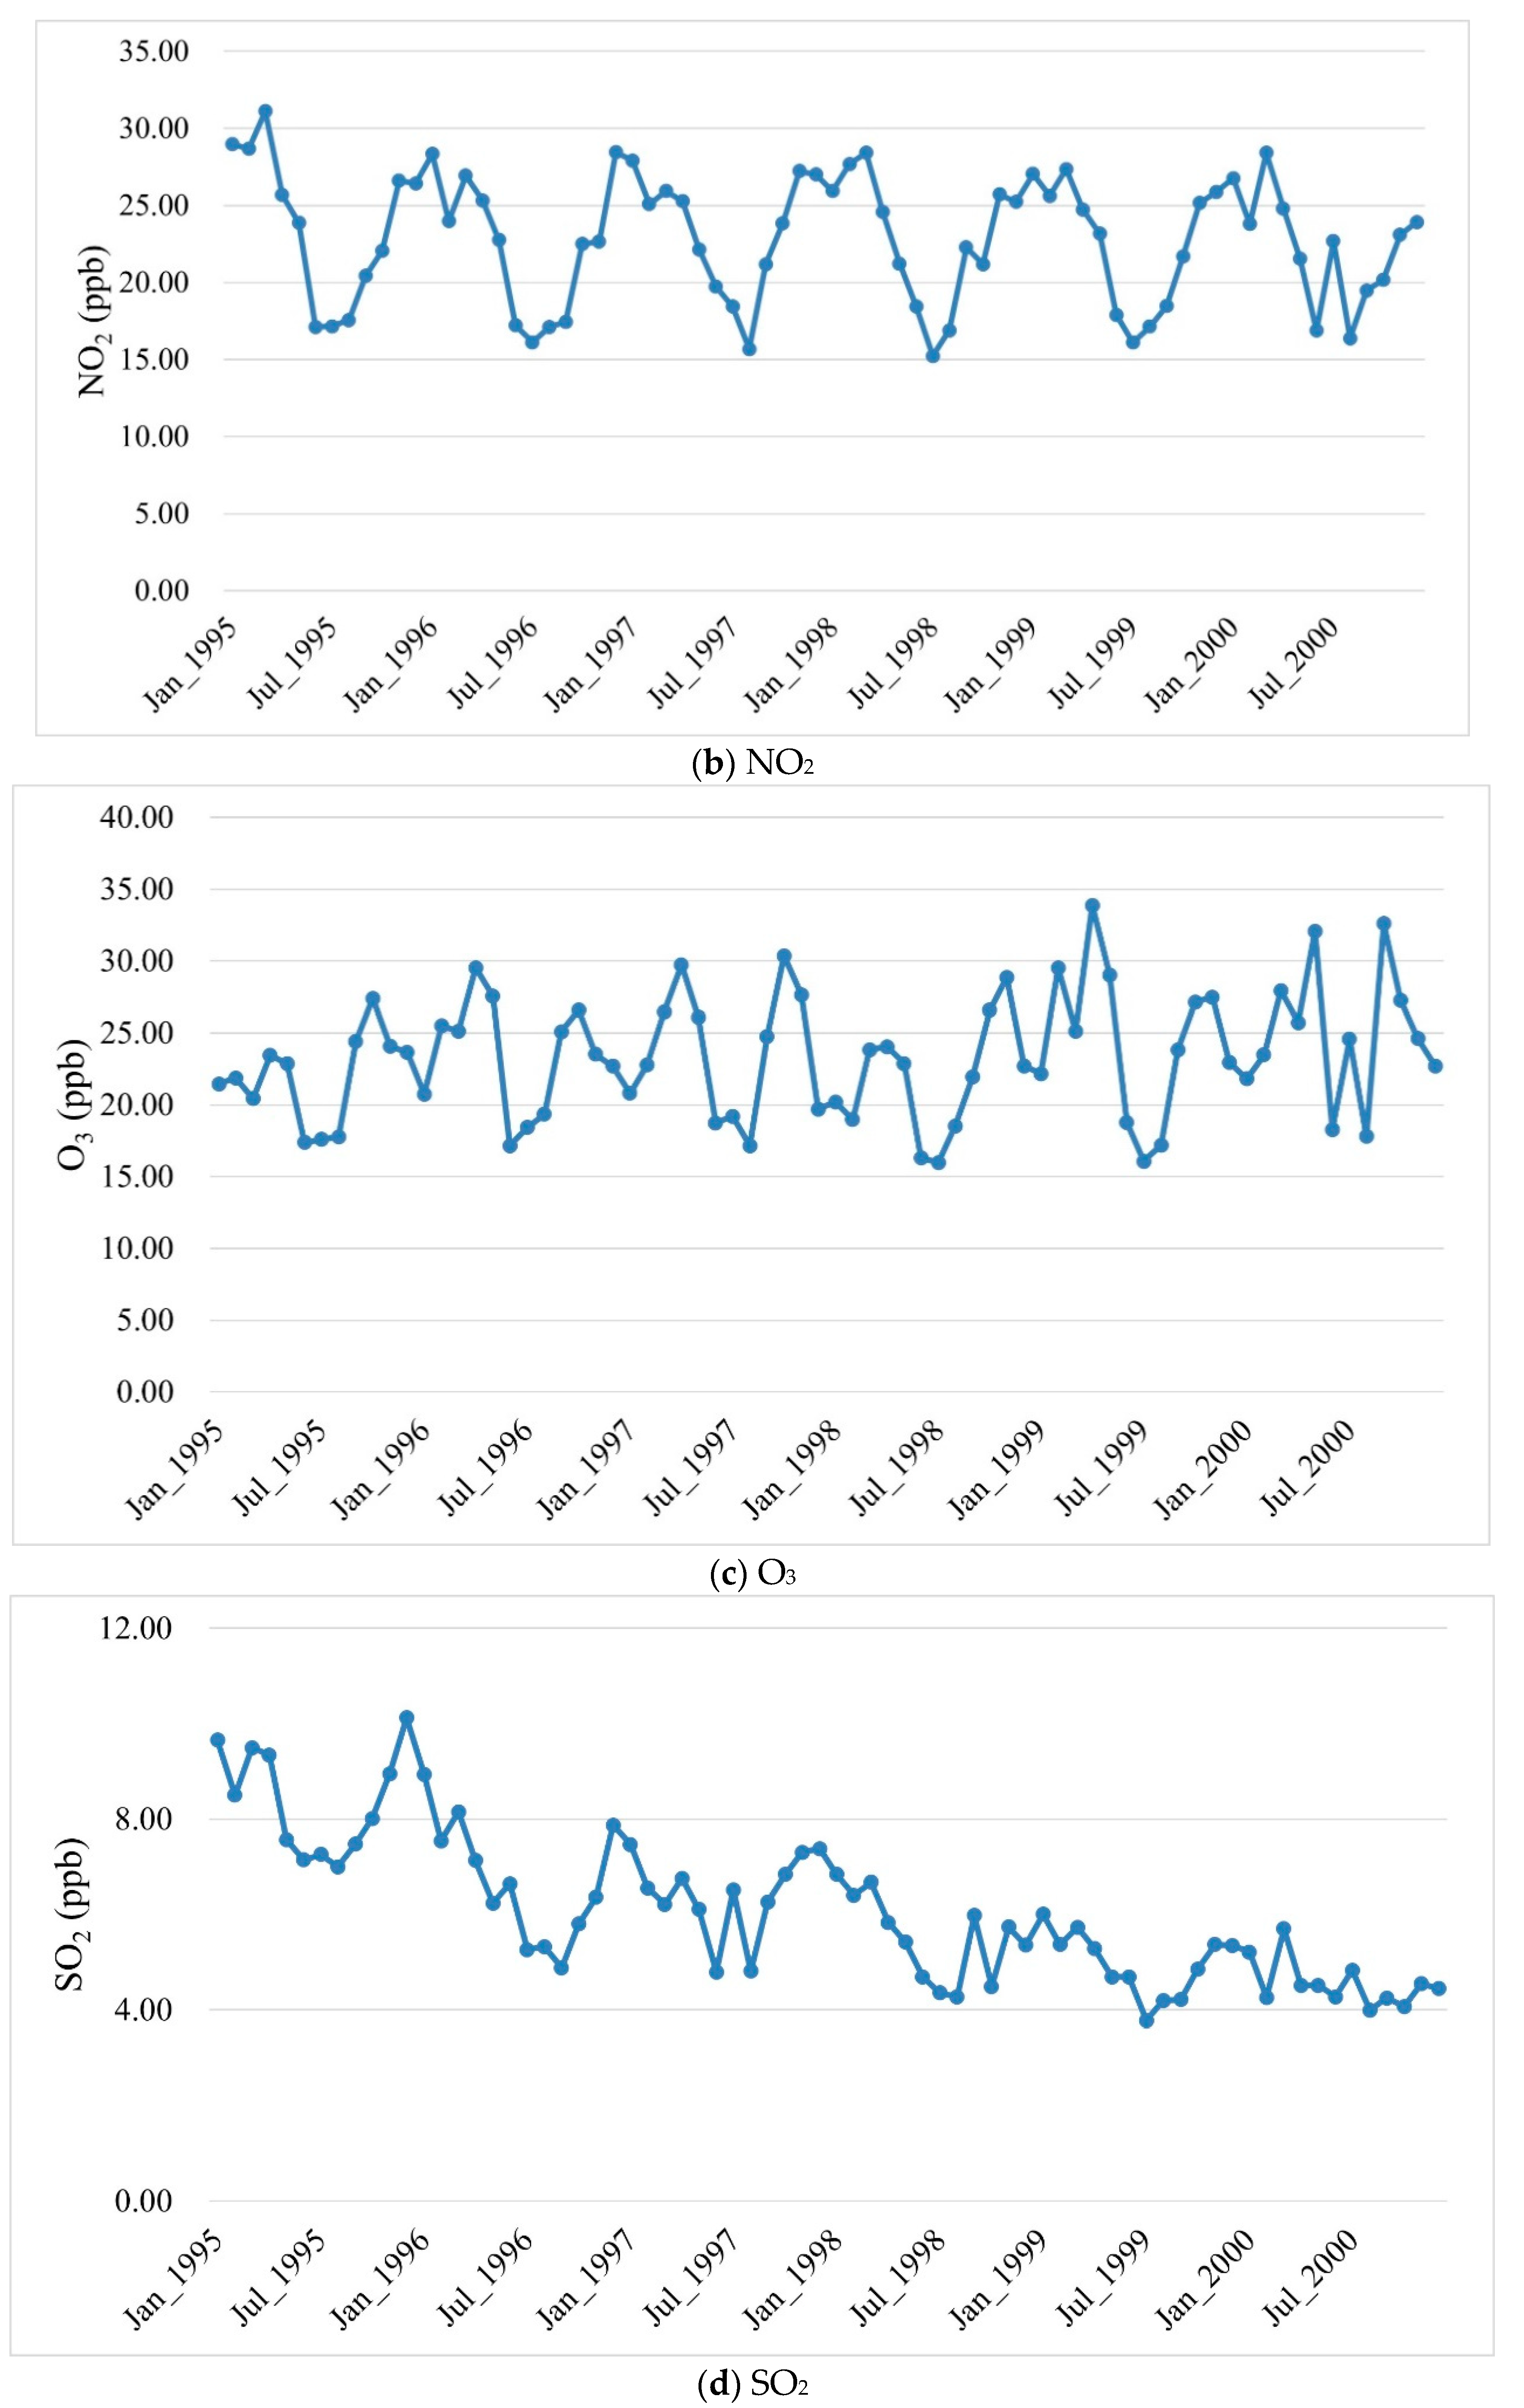
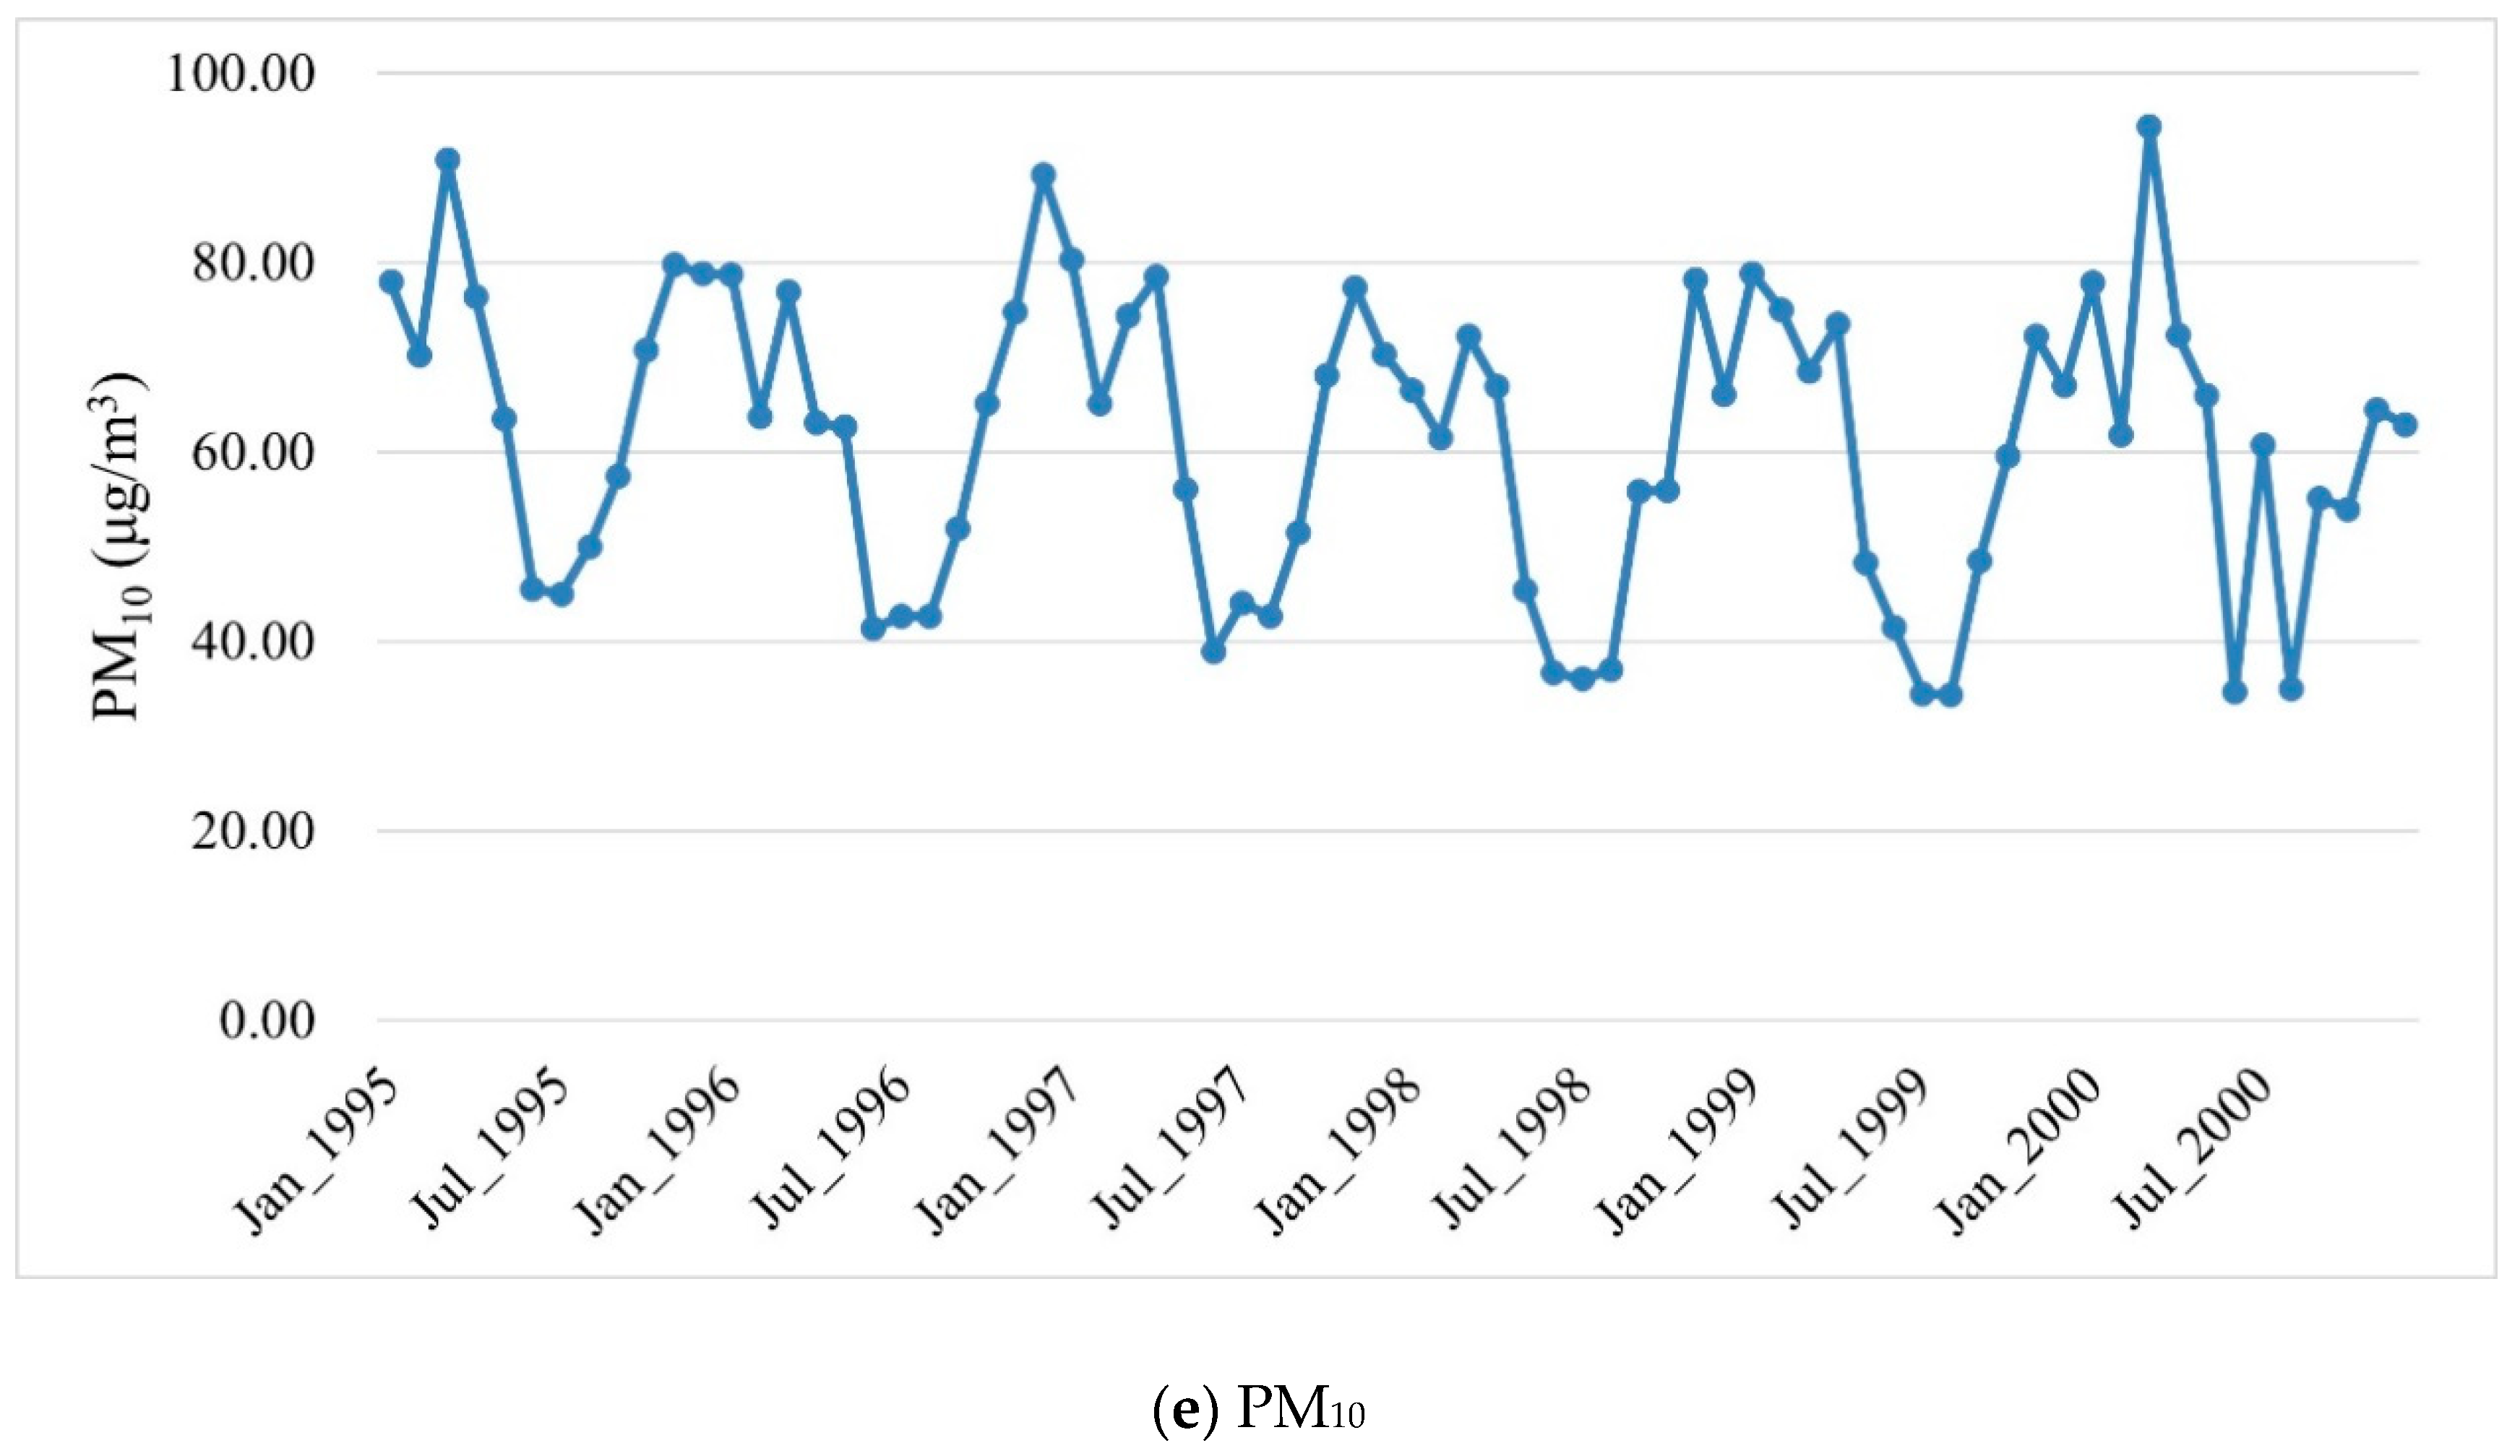
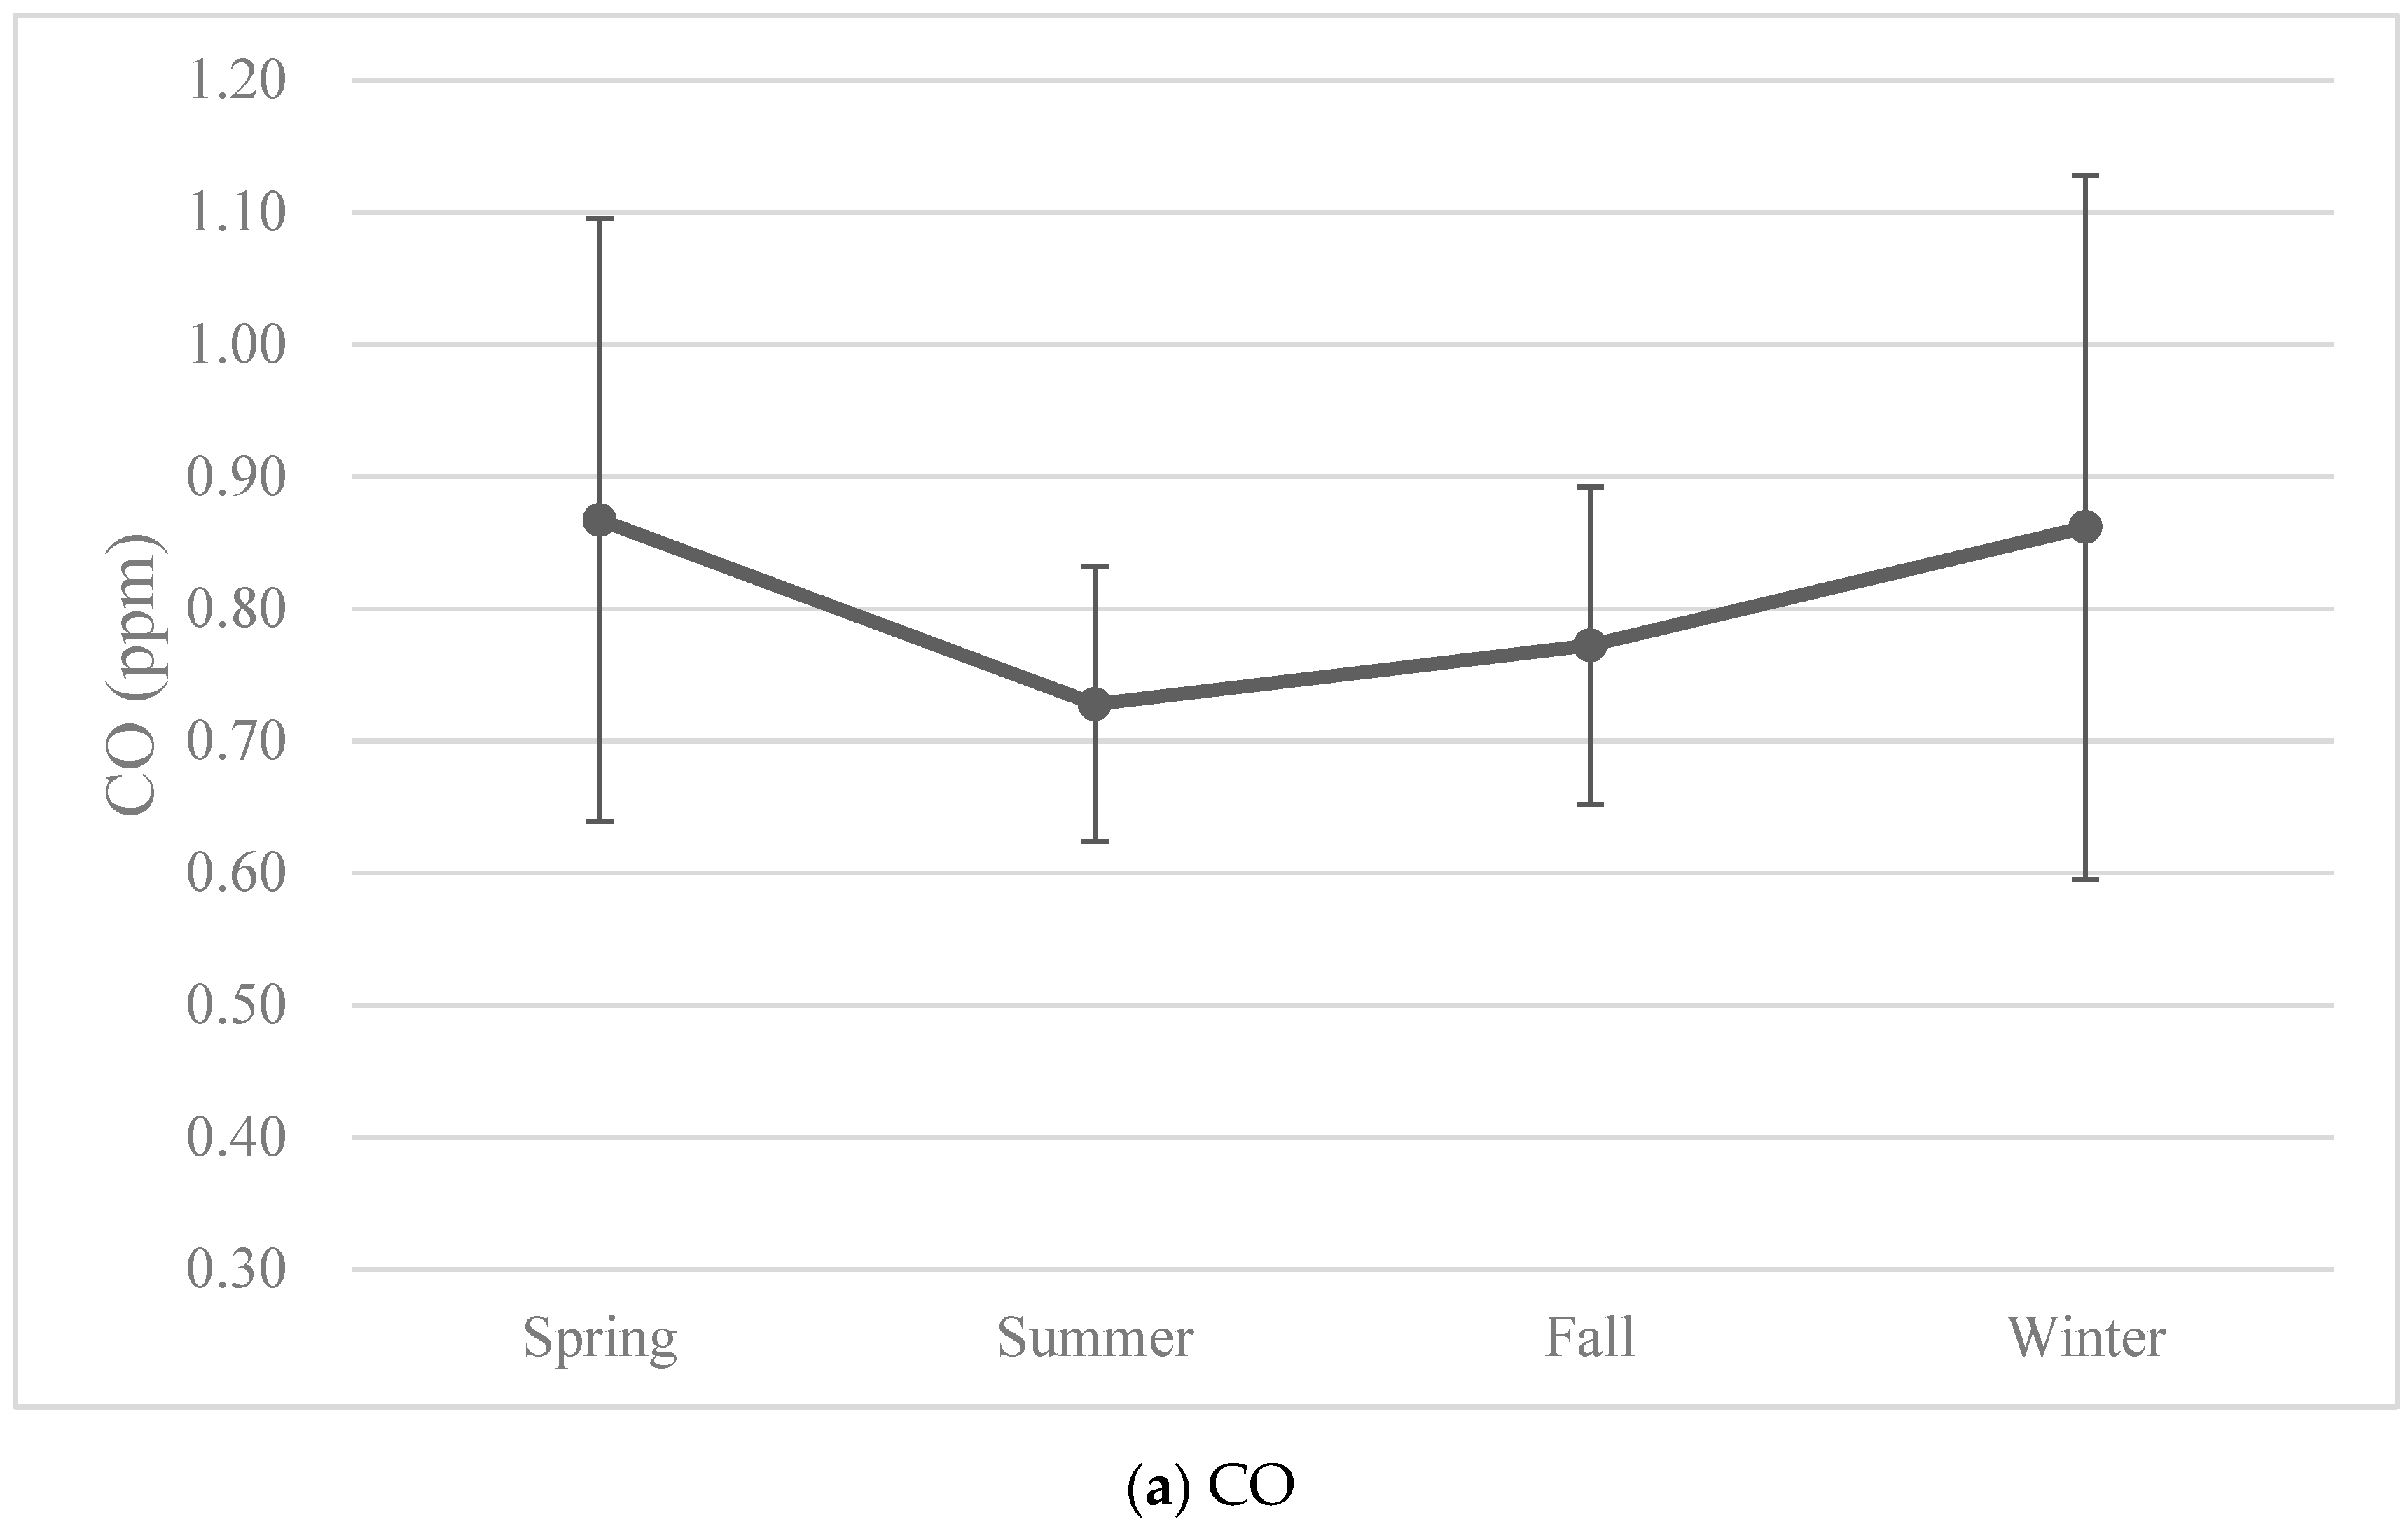
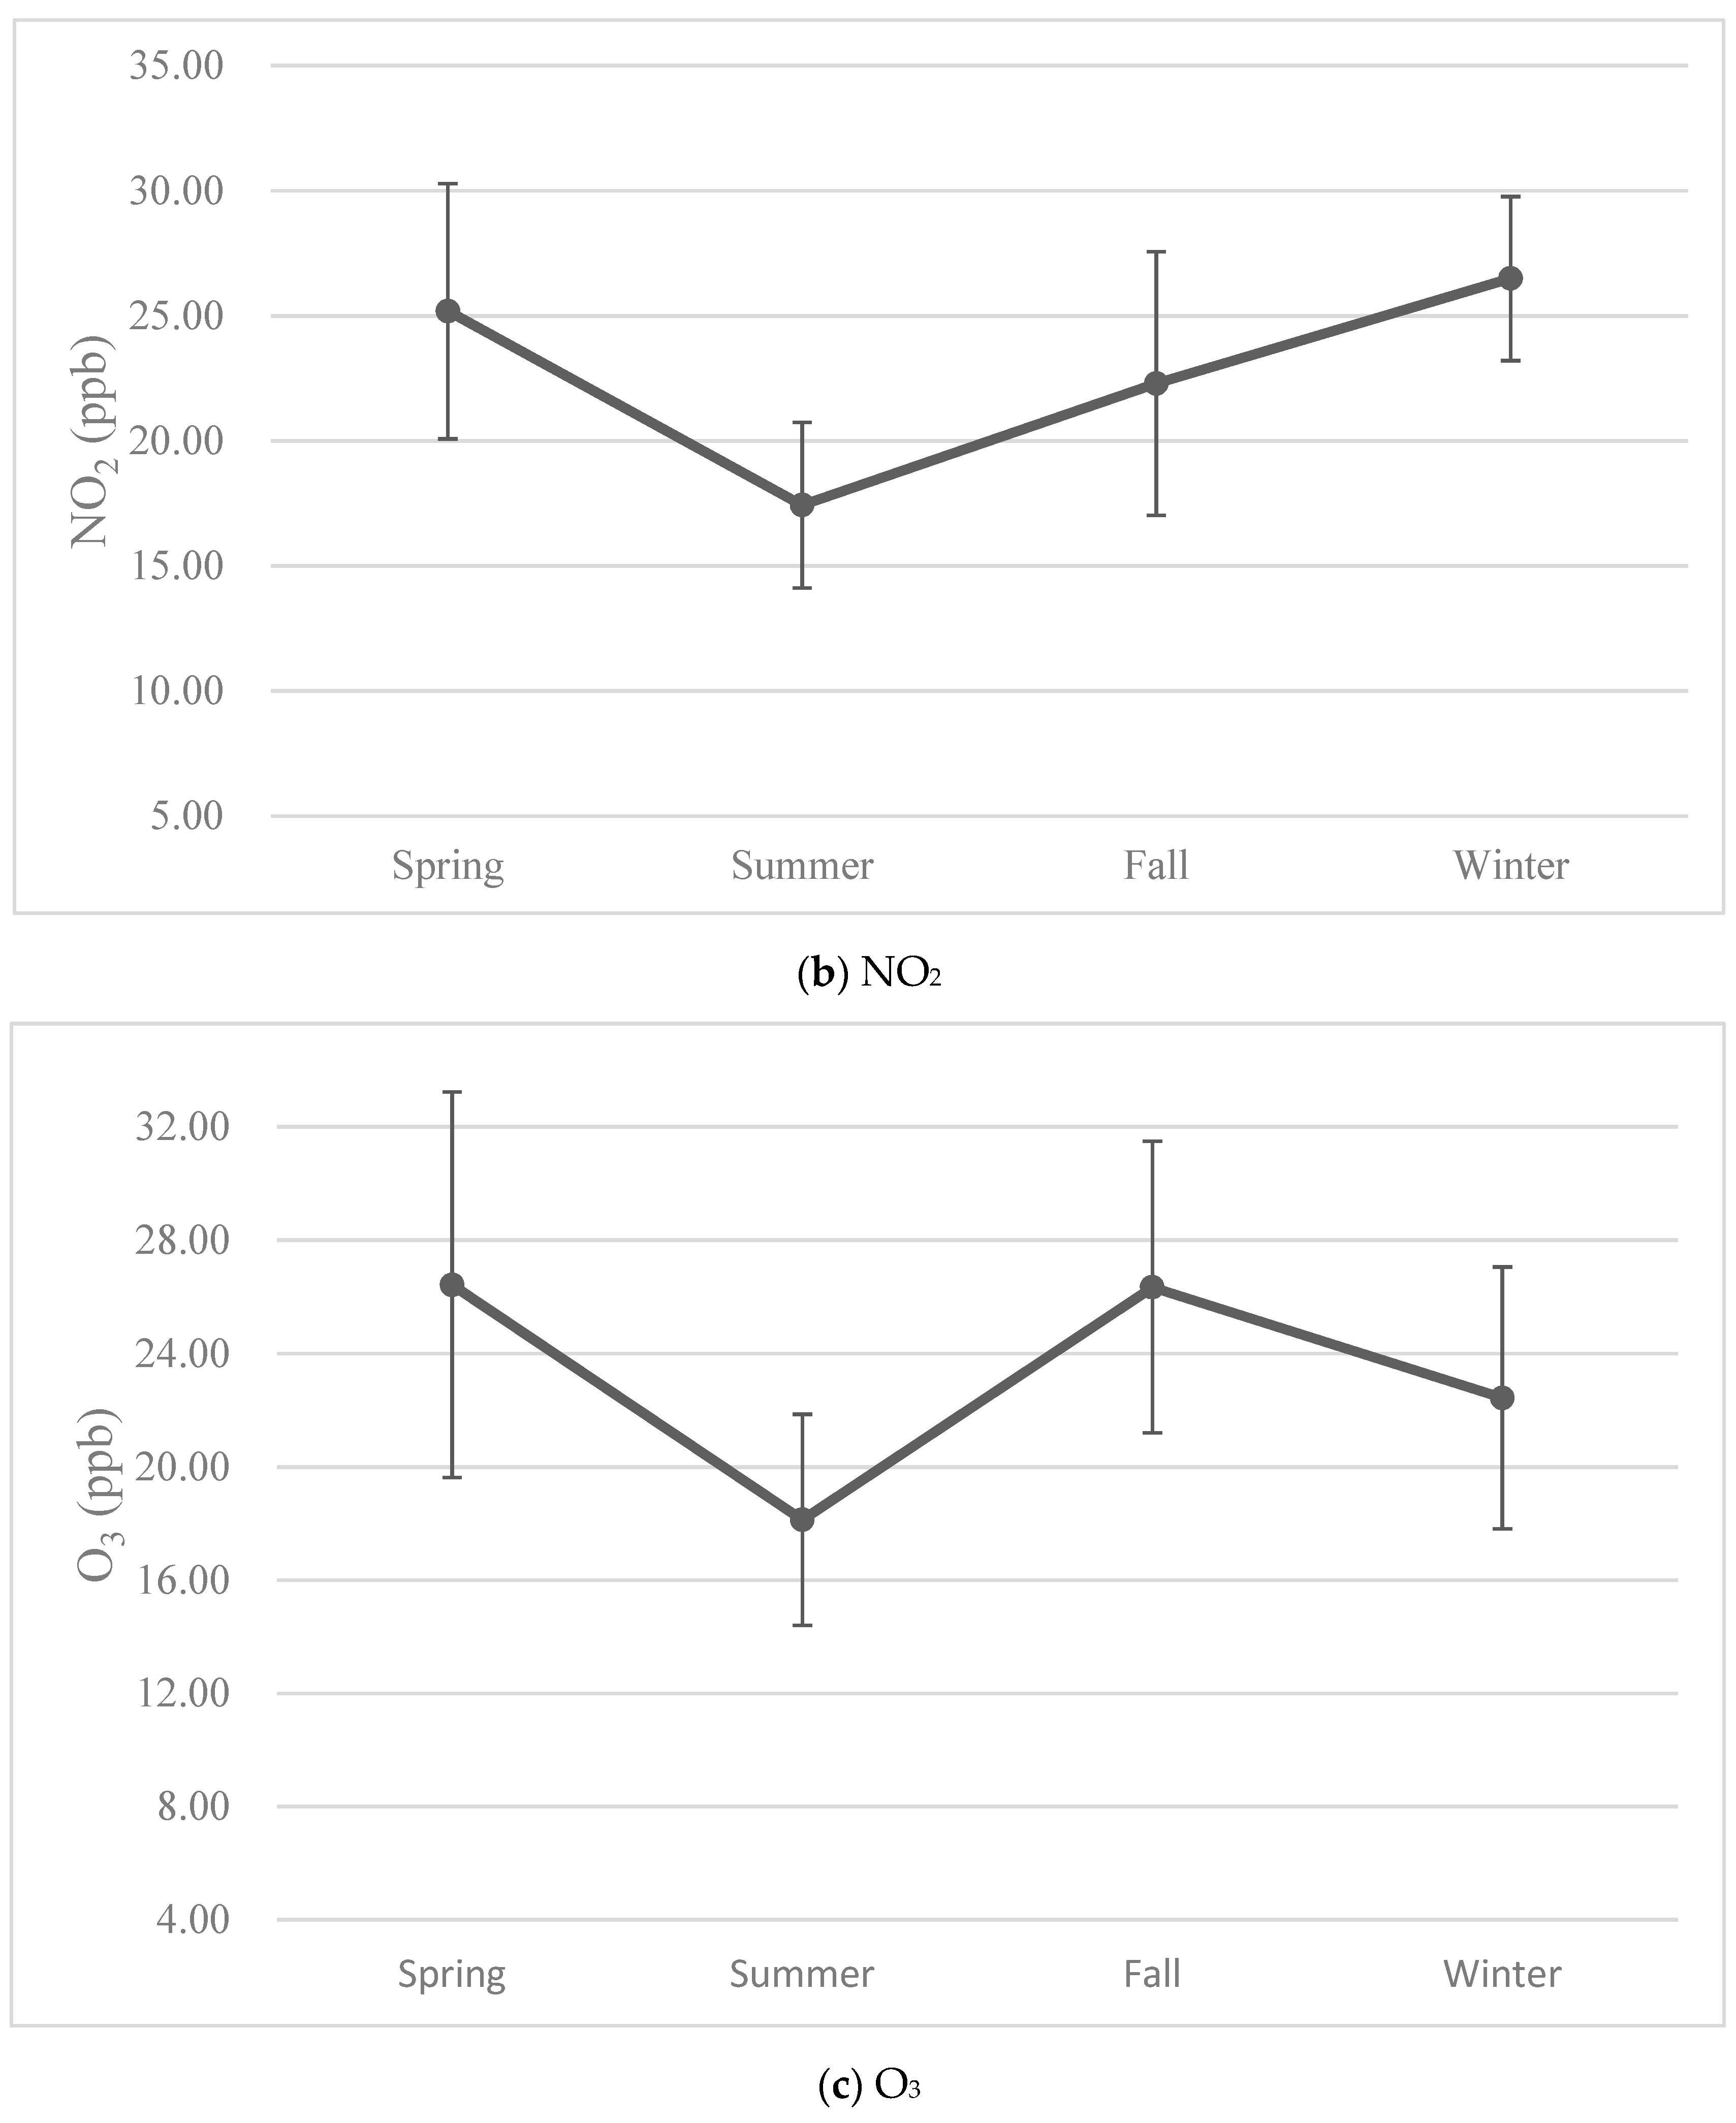
3.2. Levels of Air Pollutants

The monthly average levels of all air pollutants showed seasonal variations (Figure 3). In fact, most of the air pollutants had the same variation pattern, with the highest levels in winters and the lowest levels in summers, except for O3, which had the highest levels in falls (Figure 4).

3.3. Results from Univariate Analyses of Covariates

The risk of ASD was associated with several covariates we studied (Table 2). Males had a higher risk than females (hazard ratio [HR] = 4.45; 95%CI: 3.45–5.66). In addition, we observed an increasing trend with calendar year in the risk of ASD, with an HR of 1.12 (95%CI: 1.05–1.20) every year.
The proportions of members with the comorbidities we studied were all higher in the ASD group than in the non-ASD group. In particular, while there were 66 ASD patients having anxiety (14.16%), none of the members in the non-ASD group had the comorbidity. Other than that, intellectual disabilities were associated with the highest HR (34.26; 95%CI: 28.20–41.63), followed by obsessive compulsive disorder (HR = 25.98; 95%CI: 15.54–43.44).

3.4. Associations between Air Pollutants and Autism Spectrum Disorder

During gestation, the ASD group had significantly higher levels of CO and NO2 than the non-ASD group (Table 1). Yet, the levels of O3 and PM10 were significantly lower in the ASD group. The largest difference was observed in CO (more than 7% higher in the ASD group).
From Cox regression analyses, we found that the risk of ASD increased as the level of CO increased (Table 3). Specifically, the HR associated with 1 ppm increase in the gestation was 1.65 (95%CI: 1.32–2.07), and the association was also observed after adjusting for sex and calendar year (adjusted HR = 1.77; 95%CI: 1.41–2.22) and after further adjustment for comorbidities (adjusted HR = 1.88; 95%CI: 1.49–2.36). In all three trimesters, there was an association between CO levels and the risk of ASD. After adjusting for sex and calendar year, the associations were still statistically significant. With further adjustment for comorbidities, the adjusted HR associated with 1 ppm increase in the CO level decreased from 1.93 (95%CI: 1.55–2.39) in the first trimester to 1.75 (95%CI: 1.30–2.21) in the third trimester. We observed a similar pattern in the HRs associated with exposure to NO2. Specifically, the HR associated with each 10-ppb increase in the level of NO2 in gestation was 1.37 (95%CI: 1.18–1.60), and the association was also observed after adjusting for sex and calendar year (adjusted HR = 1.39; 95%CI: 1.19–1.62) and after further adjustment for comorbidities (adjusted HR = 1.42; 95%CI: 1.22–1.66) (Table 3). In all three trimesters, there was an association between NO2 levels and the risk of ASD. After adjusting for sex and calendar year, the associations were still statistically significant. With further adjustment for comorbidities, the adjusted HR associated with each 10-ppb increase in the level of NO2 decreased from 1.39 (95%CI: 1.22–1.58) in the first trimester to 1.18 (95%CI: 1.03–1.34) in the third trimester.
There were negative correlations of O3 and PM10 levels to the risk of ASD (Table 3). A 10-ppb increase in the level of O3 during gestation was associated with an HR of 0.73 (95%CI: 0.56–0.96). The association was also observed after adjusting for sex and calendar year (adjusted HR = 0.69; 95%CI: 0.52–0.91) and after further adjustment for comorbidities, and the adjusted HR was 0.74 (95%CI: 0.56–0.97) (Table 3). When the gestation was divided into trimesters, a negative correlation between the level of O3 and the risk of ASD was observed in all three trimesters, but none of the HRs reached statistical significance. After adjusting for sex and calendar year, the changes in the HRs were very small. With further adjustment for comorbidities, the adjusted HRs had very small changes and were very similar across the three trimesters, between 0.82 and 0.85 for each 10-ppb increase in the level of O3. The negative correlation between the level of PM10 and the risk of ASD was relatively stable. The HR associated with each 10 μg/m3 increase in PM10 during gestation was 0.86 (95%CI: 0.81–0.92), and the association was also observed after adjusting for sex and calendar year (adjusted HR = 0.87; 95%CI: 0.82–0.92) and after further adjustment for comorbidities (adjusted HR = 0.90; 95%CI: 0.85–0.96). After adjusting for sex and calendar year, the HRs generally decreased from the first to the third trimester, and an association was observed in all three trimesters, except that the HR associated with each 10 μg/m3 increase in the first trimester did not reach statistical significance (Table 3). After further adjustment for comorbidities, the adjusted HR in the first trimester was 0.98 (95%CI: 0.94–1.03), which decreased to 0.94 (95%CI: 0.90–0.99) in the second trimester and to 0.91 (95%CI: 0.87–0.96) in the third trimester.
No association between the level of SO2 and the risk of ASD was observed during gestation, or in any of the three trimesters (Table 3). The HRs associated with each 10-ppb increase in the level of SO2 were very close to the null value (differences no more than 0.02), before or after adjustment for other covariates.

4. Discussion

Previous studies on associations between prenatal exposures to air pollutants and childhood ASD are limited, especially those on specific exposure windows, and did not have consistent findings. Most of the studies were case-control studies conducted outside Asia. For example, a recent review of the literature retrieved 25 studies on this topic, and all but 3 were case-control studies, of which none were in Asia [41]. In this cohort study, we followed a representative sample of 62,919 newborns in Taiwan. We observed trimester-specific associations between levels of CO, NO2, and PM10 and the risk of childhood ASD after adjusting for other risk factors. In particular, levels of CO and NO2 in all three trimesters were associated with increased risks, and levels of PM10 in the second and third trimesters were associated with decreased risks.

4.1. Environmental Factors Contribute to Autism Spectrum Disorder

ASD was regarded as a genetic disease previously [3,22,42,43], but the concordance of monozygotic pairs was not fully explained by genetics [1]. Recent twin studies estimated that environmental factors contribute about as equally as genetic factors, and the reasons for this change may include the limitations in case numbers, inclusion criteria, and case definition in early studies [23,24].
The mechanisms through which environmental factors contribute to the development of ASD may include immune dysregulation, altered lipid metabolism, malnutrition, and higher oxidative stress. These conditions may influence the development of the brain in different stages, which include neuron cell differentiation, myelination, synaptogenesis, neural tube formation, and formation of the brain structure [44,45]. Air pollution might also affect neurodevelopment through indirect pathways, such as endocrine disruption, structural damage to brain tissues, and epigenetic changes [31,46,47,48,49]. Socioeconomic factors of the family may also contribute to the occurrence of ASD, but the findings in related studies were inconsistent [50,51]. Migration status has also been identified as a factor associated with ASD. A decreased risk of high-functioning autism was observed in children of migrant parents in Sweden [52], which is compatible to the finding of a lower incidence of developmental delays (including ASD) in children born to immigrant mothers in Taiwan [53]. Maternal factors may also affect the development of ASD, including age, nutritional status, health conditions, lifestyle, and breastfeeding [45,54,55,56,57,58,59,60,61].

4.2. Associations of Air Pollution and Autism Spectrum Disorder

There is growing literature on the association between ambient air pollution and ASD. However, the results of related studies were inconsistent, and even among studies that observed associations between ASD and air pollutants, the reported effect size varied across studies [31,33,36]. There was one study in Taiwan, but it was on postnatal exposure, not exposure during gestation [36]. Positive correlations of CO, O3, NO2, and SO2 with ASD were observed. Among studies that evaluated exposure in the prenatal period, a study found that ASD was associated with residential proximity to a freeway during all periods of gestation [31], and further analyses of the data indicated that exposure to traffic-related air pollution, such as NO2 and PM, during gestation was associated with ASD [33].
We observed positive correlations between the levels of CO and NO2 during gestation with the risk of ASD. The similar time trends observed in the HRs associated with CO and NO2 suggested that they associate with ASD through a similar mechanism. Studies have shown that exposures to CO and NO2 may introduce oxidative stress, which in turn may lead to immune dysregulation [62,63,64,65,66,67,68,69,70,71]. In addition, CO has higher affinity for binding hemoglobin than oxygen and leads to tissue hypoxia, which may generate partially reduced oxygen species in the brain after reoxygenation and thus damage neurons [72]. Likewise, exposure to NO2 may introduce reactive oxygen species (ROS) in the neuronal cells, which can mediate apoptosis of the cells [73]. Moreover, fetal hemoglobin binds to CO stronger than maternal hemoglobin, which leads to hypoxia and reoxygenation in fetal tissues [74,75,76,77]. NO2 can cause inflammation of the lung tissue after inhalation and may result in systemic inflammation, including inflammation in the placenta [78,79,80]. The inflammation may lead to the generation of ROS, which may damage neurons in the brain through the same mechanism as mentioned above. In addition to inducing systemic inflammation, air pollutants in maternal blood may pass through the placenta to the fetus in experimental animals and cause local inflammation in the brain [46], which may also lead to the generation of ROS and thus damage the brain. Animal studies have also shown that inhalation of NO2 may cause damages in the hippocampus and depletion of lipids in the cerebral hemispheres, cerebellum, and mid brain [81,82,83].
In many regions around the world, motor vehicle exhaust is the main source of CO and NO2, and it has been shown that exposure to traffic-related air pollution may lead to endothelial dysfunction, breakdown of the blood-brain-barrier, microglia activation, and effects on the dopaminergic system [84,85,86,87,88]. Nonetheless, some researchers believe that NO2 is just a surrogate of air pollution rather than a direct source of neuroinflammation [89]. For example, it might represent the neighborhood socioeconomic status [90], which is associated with ASD. Because the association can be positive or negative depending on the region under study, this could be a reason for inconsistent findings on the correlation between NO2 and ASD in different regions. In addition, there is also evidence that chronic exposure to noise may be associated with decreased cognitive function in children [91], and the main source of NO2 in many regions in the world is traffic, which is also a main source of noise.
We observed negative correlations between the O3 level during gestation and the risk of developing childhood ASD, which is compatible with a study in Taiwan that observed increases in neurodevelopment scores at 6 and 18 months of age associated with the O3 levels in both the second and the third trimesters [92]. A recent meta-analysis of four studies did not observe a significant association between prenatal exposure to O3 and the risk of ASD [41], but all the four studies were conducted in the U.S.A. More studies outside the U.S.A. are needed to clarify this issue. A possible reason for observing a negative association if there are in fact no effects is the occurrence of live birth bias, which is introduced when only live births are studied. In other words, if O3 decreased the survival of fetuses with ASD, less such fetuses could survive till birth and thus led to underestimation of the risk, and even a negative association. However, this is not likely to be the case in our study because it should also be observed in studies around the world, not just in Taiwan.
We also observed negative correlations between the PM10 level during gestation and the risk of developing childhood ASD. While this is inconsistent with findings in previous studies in California [32,33], it is compatible with a study in Denmark, which observed an adjusted odds ratio of 0.95 (95%CI: 0.91–1.00) for each interquartile range (IQR: 3.80 μg/m3) [93]. It is also in line with a collaborative study of four European population-based birth/child cohorts, which found a negative association between PM10 levels during gestation and autistic traits, and the adjusted odds ratio associated with each 10 μg/m3 increase of PM10 was very close to our finding (0.90 vs. 0.903) but did not reach statistical significance [94]. The strongest association was observed in the Spain cohort, with an odds ratio of 0.40 (95%CI: 0.04–3.91). In fact, a systematic review that identified 13 studies on the association between PM exposure and ASD found 4 of them did not observe an association while 8 observed positive associations restricted to specific exposure windows, which did not reach statistical significance [95]. Another systematic review that identified 14 studies found low external consistency in results among studies on PM and ASD, even among the 4 specifically on diesel PM and ASD [96]. Furthermore, a recent meta-analysis of nine studies did not observe a significant association between prenatal exposure to PM10 and the risk of ASD using three different methods, and considerable heterogeneity among the studies was found [41]. The inconsistency among studies may be due to several reasons. Most importantly, PM10 is a complex mixture simply classified by size, and the composition varies by place, and even varies by time in the same place, depending on the sources. While transportation is a main source in many places, such as in California, emission by coal-burning power plants is a relatively important source in Taiwan. This may explain why the effects of PM appear to be similar to NO2 in California but not in Taiwan. In addition, the PM10 level varies across studies. For example, the mean level of PM10 in the California study was 26–36 μg/m3, but it was 41–75 μg/m3 in our study. Furthermore, as in the case of NO2, transportation is the main source of PM10 in many regions in the world, and thus PM10 may represent the neighborhood socioeconomic status [90].

4.3. Trimester-Specific Associations

We observed trimester-specific associations of CO, NO2, and PM10 levels with the risk of childhood ASD. In addition, we found the positive correlations of CO and NO2 levels with ASD decreased with time while the negative correlation between the PM10 level and ASD increased with time. These findings are rarely reported in the literature. In a study in California, the adjusted odds ratios associated with an increase of 2 standard deviations from the mean value (14.1 ppb) in the level of NO2 were 1.44, 1.61, and 1.64, respectively, for the first, second, and third trimester, which is compatible with our observation, but CO was not included in the study [32,33]. In fact, using “carbon monoxide” and “autism” as keywords to search literature in PubMed, we failed to find any research articles on the association between prenatal exposure to CO and ASD.
The first trimester is a critical ontogenetic period in the brain, which is a major part of the neuronal cell formation, neuronal migration, and neuronal maturation [97,98,99,100,101]. From the 1st to the 20th gestational week, the neurogenesis of the brain occurs, and the neural tube starts to develop in the 5th gestational week and completes the development shortly [102]. Likewise, the greater part of the neuroblast is generated from the 5th week till the 25th gestational week [103]. The neuronal cells migrate once they are formed. The peak of the neuronal migration is between the 12th and 16th gestational week, and the migration stops around the 30th gestational week [104,105,106]. The neuronal cell maturation also ends in the early phase, which is around the 24th gestational week [97,100]. Therefore, the majority of the brain formation occurs during the first half of gestation [107,108]. In our study, exposures to the two air pollutants that were found to have positive correlations with ASD in the first trimester were associated with the largest HR, and the HR decreased with time, which indicated the associations are biologically plausible.

4.4. Strengths and Limitations of the Study

Studies on the association between prenatal exposure to air pollution and ASD outside the U.S.A. are limited, and such studies were rarely conducted in Asia. The current study is most likely the first one to report trimester-specific risk estimates between prenatal exposure to air pollutants and the risk of ASD in an Asian population.
Besides the features mentioned above, the current study has several strengths. First of all, we used a large population-based cohort to conduct the study. The size of the cohort allowed us to study conditions that are relatively rare and adjust for the effects of many potential confounders at the same time. In addition, the study cohort was a random sample of the enrollees of the National Health Insurance, which included over 99% of the residents in Taiwan, and the effects of selection bias were thus minimized. The diagnosis of ASD requires expertise and takes time and resources. In our study, the diagnosis was determined as confirmed when it was listed at least in two different dates, which reduced the misclassification of outcomes. Furthermore, we used the data from air quality monitoring stations operated by the government, and therefore the measurements were standardized and reliable.
A major limitation of our study is that the LHID2000 does not have information on the mother, and therefore we were unable to adjust for maternal factors, such as age, nutrition status, family history, medical condition, substance abuse, etc. In addition, we did not conduct actual personalized measurements of the air pollutants. Instead, we used the Kriging method to estimate the levels in unmeasured areas on the basis of data from the surrounding areas and construct the estimates of ambient air pollution levels of each cohort member, which would introduce errors. However, this approach has been used by all the previous large-scale studies, and even many studies that had much smaller samples. Besides, there are tradeoffs from using personal exposure measures vs. using proxy measures (Weisskopf and Webster, 2017). It is possible that some of the pregnant women did not live at the address they registered. However, because they did not know whether their children would develop ASD during the study period, the errors were most likely to occur randomly, and so misclassification bias is unlikely to be introduced in our study. There are other environmental factors that might contribute to the development of ASD, including other air pollutants, such as ultrafine particles, but we did not have the data to take them into account.
Using exposure data on the basis of residence, we assumed that exposure was mostly limited to the residence at the time and that the residence did not change during the given period. These are assumptions commonly used in most similar studies in the literature. For example, while no studies have been conducted on prenatal exposure in Taiwan, one study was conducted on postnatal exposure [36]. This study used exposure data on the residence and assumed the residence did not change over a period up to four years, but our study assumed that the residence did not change over a period of up to nine months only, which is more likely to hold.
In our study, levels of the pollutants were highly correlated, particularly the three pollutants found to be associated with ASD (CO, NO2, and PM10, with Spearman correlation coefficients of at least 0.82). Therefore, we were unable to adjust for other air pollutants using two-pollutant models as in the previous study by Jung et al. on postnatal exposure in Taiwan [36], because putting them in the same model would violate the main assumption of independence between the two pollutants. However, in the study by Jung et al., the risk estimates did not have differences between single-pollutant and two-pollutant models that were remarkable enough to change the conclusions, except that PM10 did not have a significant association with ASD in the single-pollutant model but had a significant negative association with ASD in the PM10+NO2 model, which was consistent with the finding in our study. They observed significant positive associations with CO and NO2 as in our study but also significant positive associations with O3 and SO2, suggesting that O3 and SO2 might have different effects before and after birth.

5. Conclusions

We found the levels of CO and NO2 in all three trimesters were associated with an increased risk of developing childhood ASD in Taiwan, but exposure to O3, SO2, or PM10 did not appear to be risk factors. The risks associated with CO and NO2 were most prominent in the first trimester and decreased with time. These findings indicate that prenatal exposure to environmental pollution may contribute to the development of ASD. Some of the findings are different from those observed in the U.S.A. and some European countries. As the mix of pollutants, and even the level of the same pollutant, may vary across geographic regions, it may not be unexpected that pollutants show different associations. In fact, a recent systematic review identified 25 studies and concluded that “patterns in associations over trimesters were inconsistent among studies and among air pollutants”. [41]. Nonetheless, further studies, particularly those using personal air sampling and those in the East Asia region, are warranted to confirm our findings. Different modeling approaches, such as distributed lag models, might help describe the time-specific effects in greater details. In addition, further studies should be conducted to evaluate the associations between CO and ASD, which are rarely reported in the literature.

Author Contributions

Conceptualization, H.-R.G. and Y.-C.T.; methodology, H.-R.G. and Y.-C.T.; software, S.-Y.W. and Y.-Y.C.; validation, Y.-Y.C.; formal analysis, S.-Y.W. and Y.-Y.C.; investigation, S.-Y.W., Y.-Y.C., H.-R.G. and Y.-C.T.; resources, H.-R.G. and Y.-C.T.; data curation, S.-Y.W. and Y.-Y.C.; writing—original draft preparation, S.-Y.W., H.-R.G. and Y.-C.T.; writing—review and editing, S.-Y.W., Y.-Y.C., H.-R.G. and Y.-C.T.; visualization, S.-Y.W. and Y.-Y.C.; supervision, Y.-C.T.; project administration, H.-R.G.; funding acquisition, H.-R.G. and Y.-C.T. S.-Y.W., Y.-Y.C. and H.-R.G. contributed equally to this work. All authors have read and agreed to the published version of the manuscript.

Funding

This research was funded by the Ministry of Science and Technology, Taiwan, R.O.C., grants number MOST 107-2635-B-309-001 and number MOST 108-2238-B-006-001-MY2.

Institutional Review Board Statement

The study was conducted according to the guidelines of the Declaration of Helsinki, and approved by the Institutional Review Board of the National Cheng Kung University Hospital (A-ER-105-061).

Informed Consent Statement

Patient consent was waived due to the fact that this is an analysis of secondary data (administrative database).

Data Availability Statement

All the data used in this study are publicly available from the Taiwanese government upon approval of application and payment of fees.

Conflicts of Interest

The authors declare no conflict of interest.

References

  1. Newschaffer, C.J.; Croen, L.A.; Daniels, J.; Giarelli, E.; Grether, J.K.; Levy, S.E.; Mandell, D.S.; Miller, L.A.; Pinto-Martin, J.; Reaven, J.; et al. The epidemiology of autism spectrum disorders. Annu. Rev. Public Health 2007, 28, 235–258. [Google Scholar] [CrossRef] [Green Version]
  2. Lotter, V. Epidemiology of autistic conditions in young children. Soc. Psychiatry 1966, 1, 124–135. [Google Scholar] [CrossRef]
  3. Folstein, S.; Rutter, M. Infantile autism a genetic study of 21 twin pairs. J. Child Psychol. Psychiatry 1977, 18, 297–321. [Google Scholar] [CrossRef]
  4. Matson, J.L.; Nebel-Schwalm, M.S. Comorbid psychopathology with autism spectrum disorder in children: An overview. Res. Dev. Disabil. 2007, 28, 341–352. [Google Scholar] [CrossRef] [Green Version]
  5. Fombonne, E. Epidemiological surveys of autism and other pervasive developmental disorders: An update. J. Autism Dev. Disord. 2003, 33, 365–382. [Google Scholar] [CrossRef] [PubMed]
  6. Fombonne, E. The changing epidemiology of autism. J. Appl. Res. Intellect. Disabil. 2005, 18, 281–294. [Google Scholar] [CrossRef]
  7. Rice, C. Prevalence of Autism Spectrum Disorders–Autism and Developmental Disabilities Monitoring Network, 14 Sites, United State, 2002; Morbidity and Mortality Weekly Report; Surveillance Summaries; MMWR: Washington, DC, USA, 2009; Volume 56, pp. 12–28. [Google Scholar]
  8. Haga, H.; Miyamoyo, Y. A survey on the actual state of so-called autistic children in Kyoto prefecture. Jpn. J. Child Psychiatry 1971, 12, 160–167. [Google Scholar]
  9. Nakai, M. Epidemiology of autistic children in Gifu-ken. Jpn. J. Child Psychiatry 1971, 12, 262–266. [Google Scholar]
  10. Tanino, Y. An investigation into infantile autism and autistic children in Toyama prefecture. Jpn. J. Child Psychiatry 1971, 12, 150–159. [Google Scholar]
  11. Yamazaki, K.; Yamashita, I.; Suwa, N.; Kuroda, T.; lwabuchi, J.; Imanmra, S.; Miyamoto, M.; Fujino, T.; lto, N.; Sugaya, K. Survey on the morbidity rate of “autistic children” in the Hokkaido district. Jpn. J. Child Psychiatry 1971, 12, 141–149. [Google Scholar]
  12. Sun, X.; Allison, C. A review of the prevalence of autism spectrum disorder in Asia. Res. Autism Spectr. Disord. 2010, 4, 156–167. [Google Scholar] [CrossRef]
  13. Sun, X.; Allison, C.; Matthews, F.E.; Sharp, S.J.; Auyeung, B.; Baron-Cohen, S.; Brayne, C. Prevalence of autism in mainland China, Hong Kong and Taiwan: A systematic review and meta-analysis. Mol. Autism 2013, 4, 7. [Google Scholar] [CrossRef] [Green Version]
  14. Chien, I.C.; Lin, C.H.; Chou, Y.J.; Chou, P. Prevalence and incidence of autism spectrum disorders among national health insurance enrollees in Taiwan from 1996 to 2005. J. Child Neurol. 2011, 26, 830–834. [Google Scholar] [CrossRef]
  15. Lai, D.C.; Tseng, Y.C.; Hou, Y.M.; Guo, H.R. Gender and geographic differences in the prevalence of autism spectrum disorders in children: Analysis of data from the national disability registry of Taiwan. Res. Dev. Disabil. 2012, 33, 909–915. [Google Scholar] [CrossRef]
  16. Croen, L.A.; Grether, J.K.; Hoogstrate, J.; Selvin, S. The changing prevalence of autism in California. J. Autism Dev. Disord. 2002, 32, 207–215. [Google Scholar] [CrossRef] [PubMed]
  17. Powell, J.; Edwards, A.; Edwards, M.; Pandit, B.; Sungum-Paliwal, S.; Whitehouse, W. Changes in the incidence of childhood autism and other autistic spectrum disorders in preschool children from two areas of the West Midlands, UK. Dev. Med. Child Neurol. 2000, 42, 624–628. [Google Scholar] [CrossRef]
  18. Smeeth, L.; Cook, C.; Fombonne, P.E.; Heavey, L.; Rodrigues, L.C.; Smith, P.G.; Hall, A.J. Rate of first recorded diagnosis of autism and other pervasive developmental disorders in United Kingdom general practice, 1988 to 2001. BMC Med. 2004, 2, 39. [Google Scholar] [CrossRef] [Green Version]
  19. Kaye, J.A.; del Mar Melero-Montes, M.; Jick, H. Mumps, measles, and rubella vaccine and the incidence of autism recorded by general practitioners: A time trend analysis. BMJ 2001, 302, 460. [Google Scholar] [CrossRef] [Green Version]
  20. Fombonne, E. Epidemiology of pervasive developmental disorders. Pediatr. Res. 2009, 65, 591–598. [Google Scholar] [CrossRef] [PubMed]
  21. Folstein, S.; Rutter, M. Genetic influences and infantile autism. Nature 1977, 265, 726–728. [Google Scholar] [CrossRef] [PubMed]
  22. Steffenburg, S.; Gillberg, C.; Hellgren, L.; Andersson, L.; Gillberg, I.C.; Jakobsson, G.; Bohman, M. A twin study of autism in Denmark, Finland, Iceland, Norway and Sweden. J. Child Psychol. Psychiatry 1989, 30, 405–416. [Google Scholar] [CrossRef] [PubMed]
  23. Hallmayer, J.; Cleveland, S.; Torres, A.; Phillips, J.; Cohen, B.; Torigoe, T.; Miller, J.; Fedele, A.; Collins, J.; Smith, K.; et al. Genetic heritability and shared environmental factors among twin pairs with autism. Arch. Gen. Psychiatry 2011, 68, 1095–1102. [Google Scholar] [CrossRef]
  24. Sandin, S.; Lichtenstein, P.; Kuja-Halkola, R.; Larsson, H.; Hultman, C.M.; Reichenberg, A. The familial risk of autism. JAMA 2014, 311, 1770–1777. [Google Scholar] [CrossRef]
  25. Vassilev, Z.P.; Robson, M.G.; Klotz, J.B. Outdoor exposure to airborne polycyclic organic matter and adverse reproductive outcomes: A pilot study. Am. J. Ind. Med. 2001, 40, 255–262. [Google Scholar] [CrossRef] [PubMed]
  26. Ritz, B.; Yu, F. The effect of ambient carbon monoxide on low birth weight among children born in southern California between 1989 and 1993. Environ. Health Perspect. 1999, 107, 17–25. [Google Scholar] [CrossRef]
  27. Currie, J.; Neidell, M.; Schmieder, J.F. Air pollution and infant health: Lessons from New Jersey. J. Health Econ. 2009, 28, 688–703. [Google Scholar] [CrossRef] [Green Version]
  28. Hansen, C.A.; Barnett, A.G.; Pritchard, G. The effect of ambient air pollution during early pregnancy on fetal ultrasonic measurements during mid-pregnancy. Environ. Health Perspect. 2008, 116, 362–369. [Google Scholar] [CrossRef]
  29. Suglia, S.F.; Gryparis, A.; Wright, R.O.; Schwartz, J.; Wright, R.J. Association of black carbon with cognition among children in a prospective birth cohort study. Am. J. Epidemiol. 2008, 167, 280–286. [Google Scholar] [CrossRef]
  30. Morales, E.; Julvez, J.; Torrent, M.; de Cid, R.; Guxens, M.; Bustamante, M.; Kunzli, N.; Sunyer, J. Association of early-life exposure to household gas appliances and indoor nitrogen dioxide with cognition and attention behavior in preschoolers. Am. J. Epidemiol. 2009, 169, 1327–1336. [Google Scholar] [CrossRef] [Green Version]
  31. Volk, H.E.; Hertz-Picciotto, I.; Delwiche, L.; Lurmann, F.; McConnell, R. Residential proximity to freeways and autism in the CHARGE study. Environ. Health Perspect. 2011, 119, 873–877. [Google Scholar] [CrossRef]
  32. Becerra, T.A.; Wilhelm, M.; Olsen, J.; Cockburn, M.; Ritz, B. Ambient air pollution and autism in Los Angeles County, California. Environ. Health Perspect. 2013, 121, 380–386. [Google Scholar] [CrossRef] [PubMed]
  33. Volk, H.E.; Lurmann, F.; Penfold, B.; Hertz-Picciotto, I.; McConnell, R. Traffic-related air pollution, particulate matter, and autism. JAMA Psychiatry 2013, 70, 71–77. [Google Scholar] [CrossRef]
  34. Kalkbrenner, A.E.; Windham, G.C.; Serre, M.L.; Akita, Y.; Wang, X.; Hoffman, K.; Thayer, B.P.; Daniels, J.L. Particulate matter exposure, prenatal and postnatal windows of susceptibility, and autism spectrum disorders. Epidemiology 2015, 26, 30–42. [Google Scholar] [CrossRef]
  35. Raz, R.; Roberts, A.L.; Lyall, K.; Hart, J.E.; Just, A.C.; Laden, F.; Weisskopf, M.G. Autism spectrum disorder and particulate matter air pollution before, during, and after pregnancy: A nested case-control analysis within the Nurses’ Health Study II Cohort. Environ. Health Perspect. 2015, 123, 264–270. [Google Scholar] [CrossRef]
  36. Jung, C.R.; Lin, Y.T.; Hwang, B.F. Air pollution and newly diagnostic autism spectrum disorders: A population-based cohort study in Taiwan. PLoS ONE 2013, 8, e0202996. [Google Scholar] [CrossRef] [Green Version]
  37. National Health Insurance Research Database, Taiwan. Available online: http://nhird.nhri.org.tw/en/index.htm (accessed on 11 February 2020).
  38. Liao, D.; Peuquet, D.J.; Duan, Y.; Whitsel, E.A.; Dou, J.; Smith, R.L.; Lin, H.-M.; Chen, J.-C.; Heiss, G. GIS Approaches for the estimation of residential-Level ambient PM concentrations. Environ. Health Perspect. 2006, 114, 1374–1380. [Google Scholar] [CrossRef] [PubMed]
  39. Environmental Systems Research Institute. How Kriging Works—Help ArcGIS for Desktop. Available online: http://desktop.arcgis.com/en/arcmap/10.3/tools/3d-analyst-toolbox/how-kriging-works.htm#GUID-94A34A70-DBCF-4B23-A198-BB50FB955DC0 (accessed on 11 February 2020).
  40. Pan, W.C.; Wu, C.D.; Chen, M.J.; Huang, Y.T.; Chen, C.J.; Su, H.J.; Yang, H.I. Fine particle pollution, alanine transaminase, and liver cancer: A Taiwanese prospective cohort study (REVEAL-HBV). J. Natl. Cancer Inst. 2016, 108, djv341. [Google Scholar] [CrossRef] [PubMed] [Green Version]
  41. Chun, H.; Leung, C.; Wen, S.W.; McDonald, J.; Shin, H.H. Maternal exposure to air pollution and risk of autism in children: A systematic review and meta-analysis. Environ. Pollut. 2020, 256, 113307. [Google Scholar] [CrossRef]
  42. Piven, J.; Palmer, P.; Jacobi, D.; Childress, D.; Arndt, S. Broader autism phenotype: Evidence from a family history study of multiple-incidence autism families. Am. J. Psychiatry 1997, 154, 185–190. [Google Scholar]
  43. Bailey, A.; Palferman, S.; Heavey, L.; Couteur, A.L. Autism: The phenotype in relatives. J. Autism Dev. Disord. 1998, 28, 369–392. [Google Scholar] [CrossRef]
  44. Geschwind, D.H.; Levitt, P. Autism spectrum disorders: Developmental disconnection syndromes. Curr. Opin. Neurobiol. 2007, 17, 103–111. [Google Scholar] [CrossRef]
  45. Lyall, K.; Schmidt, R.J.; Hertz-Picciotto, I. Maternal lifestyle and environmental risk factors for autism spectrum disorders. Int. J. Epidemiol. 2014, 43, 443–464. [Google Scholar] [CrossRef]
  46. Calderon-Garciduenas, L.; Solt, A.C.; Henriquez-Roldan, C.; Torres-Jardon, R.; Nuse, B.; Herritt, L.; Villarreal-Calderon, R.; Osnaya, N.; Stone, I.; Garcia, R.; et al. Long-term air pollution exposure is associated with neuroinflammation, an altered innate immune response, disruption of the blood-brain barrier, ultrafine particulate deposition, and accumulation of amyloid beta-42 and alpha-Synuclein in children and young Adults. Toxicol. Pathol. 2008, 36, 289–310. [Google Scholar] [PubMed]
  47. Calderon-Garciduenas, L.; Mora-Tiscareno, A.; Ontiveros, E.; Gomez-Garza, G.; Barragan-Mejia, G.; Broadway, J.; Chapman, S.; Valencia-Salazar, G.; Jewells, V.; Maronpot, R.R.; et al. Air pollution, cognitive deficits and brain abnormalities: A pilot study with children and dogs. Brain Cogn. 2008, 68, 117–127. [Google Scholar] [CrossRef] [PubMed]
  48. Edwards, T.M.; Myers, J.P. Environmental exposures and gene regulation in disease etiology. Environ. Health Perspect. 2007, 115, 1264–1270. [Google Scholar] [CrossRef] [PubMed] [Green Version]
  49. Perera, F.P.; Rauh, V.; Whyatt, R.M.; Tsai, W.Y.; Tang, D.L.; Diaz, D.; Hoepner, L.; Barr, D.; Tu, Y.H.; Camann, D.; et al. Effect of prenatal exposure to airborne polycyclic aromatic hydrocarbons on neurodevelopment in the first 3 years of life among inner-city children. Environ. Health Perspect. 2006, 114, 1287–1292. [Google Scholar] [CrossRef] [PubMed] [Green Version]
  50. Thomas, P.; Zahorodny, W.; Peng, B.; Kim, S.; Jani, N.; Halperin, W.; Brimacombe, M. The association of autism diagnosis with socioeconomic status. Autism 2012, 16, 201–213. [Google Scholar] [CrossRef]
  51. Rai, D.; Lewis, G.; Lundberg, M.; Araya, R.; Svensson, A.; Dalman, C.; Carpenter, P.; Magnusson, C. Parental socioeconomic status and risk of offspring autism spectrum disorders in a Swedish population-based study. J. Am. Acad. Child Adolesc. Psychiatry 2012, 51, 467–476. [Google Scholar] [CrossRef]
  52. Magnusson, C.; Rai, D.; Goodman, A.; Lundberg, M.; Idring, S.; Svensson, A.; Koupil, I.; Serlachius, E.; Dalman, C. Migration and autism spectrum disorder: Population-based study. Br. J. Psychiatry 2012, 201, 109–115. [Google Scholar] [CrossRef] [PubMed] [Green Version]
  53. Tseng, Y.C.; Guo, H.R.; Lai, D.C. Maternal nationality and developmental delays in young children: Analysis of the data from the national registry in Taiwan. Res. Dev. Disabil. 2016, 53–54, 127–134. [Google Scholar] [CrossRef] [PubMed]
  54. Fang, S.Y.; Wang, S.; Huang, N.; Yeh, H.H.; Chen, C.Y. Prenatal infection and autism spectrum disorders in childhood: A population-based case-control study in Taiwan. Paediatr. Perinat. Epidemiol. 2015, 29, 307–316. [Google Scholar] [CrossRef] [PubMed]
  55. Huang, Y.R.; Iosif, A.M.; Hansen, R.L.; Schmidt, R.J. Maternal polyunsaturated fatty acids and risk for autism spectrum disorder in the MARBLES high-risk study. Autism 2020, 24, 1191–1200. [Google Scholar] [CrossRef] [PubMed]
  56. Mandy, W.; Lai, M.C. Annual Research Review: The role of the environment in the developmental psychopathology of autism spectrum condition. J. Child Psychol. Psychiatry 2016, 57, 271–292. [Google Scholar] [CrossRef]
  57. Pinborough-Zimmerman, J.; Bilder, D.; Bakian, A.; Satterfield, R.; Carbone, P.S.; Nangle, B.E.; Randall, H.; McMahon, W.M. Sociodemographic risk factors associated with autism spectrum disorders and intellectual disability. Autism Res. 2011, 4, 438–448. [Google Scholar] [CrossRef] [PubMed]
  58. Rubenstein, E.; Durkin, M.S.; Harrington, R.A.; Kirby, R.S.; Schieve, L.A.; Daniels, J. Relationship between advanced maternal age and timing of first developmental evaluation in children with autism. J. Dev. Behav. Pediatr. 2018, 39, 601–609. [Google Scholar] [CrossRef] [PubMed]
  59. Tan, M.; Yang, T.; Zhu, J.; Li, Q.; Lai, X.; Li, Y.Y.; Tang, T.; Chen, J.; Li, T.Y. Maternal folic acid and micronutrient supplementation is associated with vitamin levels and symptoms in children with autism spectrum disorders. Reprod. Toxicol. 2020, 91, 109–115. [Google Scholar] [CrossRef]
  60. Tseng, P.T.; Chen, Y.W.; Stubbs, B.; Carvalho, A.F.; Whiteley, P.; Tang, C.H.; Yang, W.C.; Chen, T.Y.; Li, D.J.; Chu, C.S.; et al. Maternal breastfeeding and autism spectrum disorder in children: A systematic review and meta-analysis. Nutr. Neurosci. 2019, 22, 354–362. [Google Scholar] [CrossRef]
  61. Veldkamp, S.A.M.; Zondervan-Zwijnenburg, M.A.J.; van Bergen, E.; Barzeva, S.A.; Tamayo-Martinez, N.; Becht, A.I.; van Beijsterveldt, C.E.M.; Meeus, W.; Branje, S.; Hillegers, M.H.J.; et al. Parental age in relation to offspring’s neurodevelopment. J. Clin. Child Adolesc. Psychol. 2020, 18, 1–13. [Google Scholar] [CrossRef]
  62. Kelly, F.J. Oxidative stress: Its role in air pollution and adverse health effects. Occup. Environ. Med. 2003, 60, 612–616. [Google Scholar] [CrossRef] [Green Version]
  63. Kalkbrenner, A.E.; Schmidt, R.J.; Penlesky, A.C. Environmental chemical exposures and autism spectrum disorders: A review of the epidemiological evidence. Curr. Probl. Pediatr. Adolesc. Health Care 2014, 44, 277–318. [Google Scholar] [CrossRef] [Green Version]
  64. Croonenberghs, J.; Wauters, A.; Devreese, K.; Verkerk, R.; Scharpe, S.; Bosmans, E.; Egyed, B.; Deboutte, D.; Maes, M. Increased serum albumin, γ globulin, immunoglobulin IgG, and IgG2 and IgG4 in autism. Psychol. Med. 2002, 32, 1457–1463. [Google Scholar] [CrossRef] [PubMed]
  65. Molloy, C.A.; Morrow, A.L.; Meinzen-Derr, J.; Schleifer, K.; Dienger, K.; Manning-Courtney, P.; Altaye, M.; Wills-Karp, M. Elevated cytokine levels in children with autism spectrum disorder. J. Neuroimmunol. 2006, 172, 198–205. [Google Scholar] [CrossRef] [PubMed]
  66. Li, X.; Chauhan, A.; Sheikh, A.M.; Patil, S.; Chauhan, V.; Li, X.M.; Ji, L.; Brown, T.; Malik, M. Elevated immune response in the brain of autistic patients. J. Neuroimmunol. 2009, 207, 111–116. [Google Scholar] [CrossRef] [PubMed] [Green Version]
  67. Zerbo, O.; Yoshida, C.; Grether, J.K.; Van de Water, J.; Ashwood, P.; Delorenze, G.N.; Hansen, R.L.; Kharrazi, M.; Croen, L.A. Neonatal cytokines and chemokines and risk of autism spectrum disorder: The early markers for autism (EMA) study: A case-control study. J. Neuroinflamm. 2014, 11, 113. [Google Scholar] [CrossRef] [PubMed] [Green Version]
  68. Krakowiak, P.; Goines, P.E.; Tancredi, D.J.; Ashwood, P.; Hansen, R.L.; Hertz-Picciotto, I.; Van de Water, J. Neonatal cytokine profiles associated with autism spectrum disorder. Biol. Psychiatry 2015, 81, 442–451. [Google Scholar] [CrossRef] [PubMed] [Green Version]
  69. Abdallah, M.W.; Larsen, N.; Grove, J.; Norgaard-Pedersen, B.; Thorsen, P.; Mortensen, E.L.; Hougaard, D.M. Amniotic fluid inflammatory cytokines: Potential markers of immunologic dysfunction in autism spectrum disorders. World J. Biol. Psychiatry 2013, 14, 528–538. [Google Scholar] [CrossRef] [PubMed]
  70. Jones, K.L.; Croen, L.A.; Yoshida, C.K.; Heuer, L.; Hansen, R.; Zerbo, O.; DeLorenze, G.N.; Kharrazi, M.; Yolken, R.; Ashwood, P.; et al. Autism with intellectual disability is associated with increased levels of maternal cytokines and chemokines during gestation. Mol. Psychiatry 2017, 22, 273–279. [Google Scholar] [CrossRef] [PubMed] [Green Version]
  71. Lucchina, L.; Depino, A.M. Altered peripheral and central inflammatory responses in a mouse model of autism. Autism Res. 2014, 7, 273–289. [Google Scholar] [CrossRef]
  72. Zhang, J.; Piantadosi, C.A. Mitochondrial oxidative stress after carbon monoxide hypoxia in the rat brain. J. Clin. Investig. 1992, 90, 1193–1199. [Google Scholar] [CrossRef]
  73. Wei, T.; Chen, C.; Hou, J.; Xin, W.; Mori, A. Nitric oxide induces oxidative stress and apoptosis in neuronal cells. Biochim. Biophys. Acta (BBA) Mol. Cell Res. 2000, 1498, 72–79. [Google Scholar] [CrossRef] [Green Version]
  74. Longo, L.D. The biological effects of carbon monoxide on the pregnant woman, fetus, and newborn infant. Am. J. Obstet. Gynecol. 1977, 129, 69–103. [Google Scholar] [CrossRef]
  75. Di Cera, E.; Doyle, M.L.; Morgan, M.S.; De Cristofaro, R.; Landolfi, R.; Bizzi, B.; Castagnola, M.; Gill, S.J. Carbon monoxide and oxygen binding to human hemoglobin F0. Biochemistry 1989, 28, 2631–2638. [Google Scholar] [CrossRef] [PubMed]
  76. Sangalli, M.R.; McLean, A.J.; Peek, M.J.; Rivory, L.P.; Le Couteur, D.G. Carbon monoxide disposition and permeability-surface area product in the foetal circulation of the perfused term human placenta. Placenta 2003, 24, 8–11. [Google Scholar] [CrossRef] [PubMed]
  77. Longo, L.D. Carbon monoxide: Effects on oxygenation of the fetus in utero. Science 1976, 194, 523–525. [Google Scholar] [CrossRef] [PubMed]
  78. Walters, D.M.; Breysse, P.N.; Wills-Karp, M. Ambient urban Baltimore particulate-induced airway hyperresponsiveness and inflammation in mice. Am. J. Respir. Crit. Care Med. 2001, 164, 1438–1443. [Google Scholar] [CrossRef] [PubMed]
  79. Dexter, S.C.; Pinar, H.; Malee, M.P.; Hogan, J.; Carpenter, M.W.; Vohr, B.R. Outcome of very low birth weight infants with histopathologic chorioamnionitis. Obstet. Gynecol. 2000, 96, 172–177. [Google Scholar] [PubMed]
  80. Nemmar, A.; Hoet, P.H.M.; Vanquickenborne, B.; Dinsdale, D.; Thomeer, M.; Hoylaerts, M.F.; Vanbilloen, H.; Mortelmans, L.; Nemery, B. Passage of inhaled particles into the blood circulation in humans. Circulation 2002, 105, 411–414. [Google Scholar] [CrossRef] [Green Version]
  81. Farahani, H.; Hasan, M. Nitrogen-Dioxide Induced Changes in Level of Free Fatty-Acids, Triglyceride, Esterified fatty-acid, ganglioside and lipase activity in the Guinea-Pig Brain. J. Environ. Sci. Health Part B Pestic. Food Contam. Agric. Wastes 1992, 27, 53–71. [Google Scholar] [CrossRef] [PubMed]
  82. Farahani, H.; Hasan, M. Effect of NO2 on Lipids and lipid-peroxidation in the CNS of the guinea-pig. Pharmacol. Toxicol. 1990, 66, 146–149. [Google Scholar] [CrossRef]
  83. Li, H.Y.; Xin, X.Y. Nitrogen dioxide (NO2) pollution as a potential risk factor for developing vascular dementia and its synaptic mechanisms. Chemosphere 2013, 92, 52–58. [Google Scholar] [CrossRef]
  84. Calderon-Garciduenas, L.; Torres-Jardon, R.; Kulesza, R.J.; Park, S.B.; D’Angiulli, A. Air pollution and detrimental effects on children’s brain. The need for a multidisciplinary approach to the issue complexity and challenges. Front. Hum. Neurosci. 2014, 8, 613. [Google Scholar] [PubMed] [Green Version]
  85. Levesque, S.; Taetzsch, T.; Lull, M.E.; Kodavanti, U.; Stadler, K.; Wagner, A.; Johnson, J.A.; Duke, L.; Kodavanti, P.; Surace, M.J.; et al. Diesel exhaust activates and primes microglia: Air pollution, neuroinflammation, and regulation of dopaminergic neurotoxicity. Environ. Health Perspect. 2011, 119, 1149–1155. [Google Scholar] [CrossRef] [Green Version]
  86. Suzuki, T.; Oshio, S.; Iwata, M.; Saburi, H.; Odagiri, T.; Udagawa, T.; Sugawara, I.; Umezawa, M.; Takeda, K. In utero exposure to a low concentration of diesel exhaust affects spontaneous locomotor activity and monoaminergic system in male mice. Part. Fibre Toxicol. 2010, 7, 7. [Google Scholar] [CrossRef] [PubMed] [Green Version]
  87. Woodward, N.C.; Haghani, A.; Johnson, R.G.; Hsu, T.M.; Saffari, A.; Sioutas, C.; Kanoski, S.E.; Finch, C.E.; Morgan, T.E. Prenatal and early life exposure to air pollution induced hippocampal vascular leakage and impaired neurogenesis in association with behavioral deficits. Transl. Psychiatry 2018, 8, 261. [Google Scholar] [CrossRef] [PubMed]
  88. Yokota, S.; Mizuo, K.; Moriya, N.; Oshio, S.; Sugawara, I.; Takeda, K. Effect of prenatal exposure to diesel exhaust on dopaminergic system in mice. Neurosci. Lett. 2009, 449, 38–41. [Google Scholar] [CrossRef] [PubMed]
  89. Kim, E.; Park, H.; Hong, Y.C.; Ha, M.; Kim, Y.; Kim, B.N.; Kim, Y.; Roh, Y.M.; Lee, B.E.; Ryu, J.M.; et al. Prenatal exposure to PM10 and NO2 and children’s neurodevelopment from birth to 24 months of age: Mothers and Children’s Environmental Health (MOCEH) study. Sci. Total Environ. 2014, 481, 439–445. [Google Scholar] [CrossRef]
  90. Hajat, A.; Diez-Roux, A.V.; Adar, S.D.; Auchincloss, A.H.; Lovasi, G.S.; O’Neill, M.S.; Sheppard, L.; Kaufman, J.D. Air pollution and individual and neighborhood socioeconomic status: Evidence from the Multi-Ethnic Study of Atherosclerosis (MESA). Environ. Health Perspect. 2013, 121, 1325–1333. [Google Scholar] [CrossRef] [Green Version]
  91. Stansfeld, S.A.; Berglund, B.; Clark, C.; Lopez-Barrio, I.; Fischer, P.; Ohrstrom, E.; Haines, M.M.; Head, J.; Hygge, S.; van Kamp, I.; et al. Aircraft and road traffic noise and children’s cognition and health: A cross-national study. Lancet 2005, 365, 1942–1949. [Google Scholar] [CrossRef]
  92. Lin, C.C.; Yang, S.K.; Lin, K.C.; Ho, W.C.; Hsieh, W.S.; Shu, B.C.; Chen, P.C. Multilevel analysis of air pollution and early childhood neurobehavioral development. Int. J. Environ. Res. Public Health 2014, 11, 6827–6841. [Google Scholar] [CrossRef] [Green Version]
  93. Ritz, B.; Liew, Z.; Yan, Q.; Cui, X.; Virk, J.; Ketzel, M.; Raaschou-Nielsen, O. Air pollution and autism in Denmark. Environ. Epidemiol. 2018, 2, e028. [Google Scholar] [CrossRef]
  94. Guxens, M.; Ghassabian, A.; Gong, T.; Garcia-Esteban, R.; Porta, D.; Giorgis-Allemand, L.; Almqvist, C.; Aranbarri, A.; Beelen, R.; Badaloni, C.; et al. Air pollution exposure during pregnancy and childhood autistic traits in four European population-based cohort studies: The ESCAPE Project. Environ. Health Perspect. 2016, 124, 133–140. [Google Scholar] [CrossRef] [PubMed] [Green Version]
  95. Morales-Suarez-Varela, M.; Peraita-Costa, I.; Llopis-Gonzalez, A. Systematic review of the association between particulate matter exposure and autism spectrum disorders. Environ. Res. 2017, 153, 150–160. [Google Scholar] [CrossRef] [PubMed]
  96. Fordyce, T.A.; Leonhard, M.J.; Chang, E.T. A critical review of developmental exposure to particulate matter, autism spectrum disorder, and attention deficit hyperactivity disorder. J. Environ. Sci. Health Part A Toxic/Hazard. Subst. Environ. Eng. 2018, 53, 174–204. [Google Scholar] [CrossRef]
  97. Wegiel, J.; Kuchna, I.; Nowicki, K.; Imaki, H.; Wegiel, J.; Marchi, E.; Ma, S.Y.; Chauhan, A.; Chauhan, V.; Bobrowicz, T.W.; et al. The neuropathology of autism: Defects of neurogenesis and neuronal migration, and dysplastic changes. Acta Neuropathol. 2010, 119, 755–770. [Google Scholar] [CrossRef] [PubMed] [Green Version]
  98. Sidman, R.L.; Rakic, P. Neuronal migration, with special reference to developing human brain: A review. Brain Res. 1973, 62, 1–35. [Google Scholar] [CrossRef]
  99. De Graaf-Peters, V.B.; Hadders-Algra, M. Ontogeny of the human central nervous system: What is happening when? Early Hum. Dev. 2006, 82, 257–266. [Google Scholar] [CrossRef]
  100. Sarnat, H.B.; Nochlin, D.; Born, D.E. Neuronal nuclear antigen (NeuN): A marker of neuronal maturation in the early human fetal nervous system1. Brain Dev. 1998, 20, 88–94. [Google Scholar] [CrossRef]
  101. Samuelsen, G.B.; Larsen, K.B.; Bogdanovic, N.; Laursen, H.; Græm, N.; Larsen, J.F.; Pakkenberg, B. The changing number of cells in the human fetal forebrain and its subdivisions: A stereological analysis. Cereb. Cortex 2003, 13, 115–122. [Google Scholar] [CrossRef]
  102. Sarnat, H.B.; Flores-Sarnat, L. Integrative classification of morphology and molecular genetics in central nervous system malformations. Am. J. Med. Genet. Part A 2004, 126A, 386–392. [Google Scholar] [CrossRef]
  103. Mrzljak, L.; Uylings, H.B.M.; Kostovic, I.; van Eden, C.G. Prenatal development of neurons in the human prefrontal cortex. II. A quantitative Golgi study. J. Comp. Neurol. 1992, 316, 485–496. [Google Scholar] [CrossRef]
  104. Rakic, P.; Cameron, R.S.; Komuro, H. Recognition, adhesion, transmembrane signaling and cell motility in guided neuronal migration. Curr. Opin. Neurobiol. 1994, 4, 63–69. [Google Scholar] [CrossRef]
  105. Gupta, R.K.; Hasan, K.M.; Trivedi, R.; Pradhan, M.; Das, V.; Parikh, N.A.; Narayana, P.A. Diffusion tensor imaging of the developing human cerebrum. J. Neurosci. Res. 2005, 81, 172–178. [Google Scholar] [CrossRef] [PubMed]
  106. Gressens, P. Mechanisms and disturbances of neuronal migration. Pediatr. Res. 2000, 48, 725–730. [Google Scholar] [CrossRef] [PubMed] [Green Version]
  107. Rakic, P. Pre- and post-developmental neurogenesis in primates. Clin. Neurosci. Res. 2002, 2, 29–39. [Google Scholar] [CrossRef]
  108. Dobbing, J.; Sands, J. Timing of neuroblast multiplication in developing human brain. Nature 1970, 226, 639–640. [Google Scholar] [CrossRef] [PubMed]
Figure 1. Flow chart of the study.
Ijerph 18 09784 g001
Figure 2. Cumulative incidence rates (per 10,000 children) of autism spectrum disorder and mean levels of air pollutants in Taiwanese townships during the study period.
Ijerph 18 09784 g002aIjerph 18 09784 g002b
Figure 3. The monthly averages of air pollutant levels over the years of birth of the study cohort.
Ijerph 18 09784 g003aIjerph 18 09784 g003bIjerph 18 09784 g003c
Figure 4. The seasonal variations of air pollutant levels over the years of birth of the study cohort. The data were presented as means with error bars indicating the range of ±1 standard deviation.
Ijerph 18 09784 g004aIjerph 18 09784 g004bIjerph 18 09784 g004c
Table 1. Comparison between cohort members with (ASD) and without (non-ASD) autism spectrum disorder.
N (%) 1
VariablesASD
(N = 466)
Non-ASD
(N = 62,453)
p-Value
Sex (male/female ratio)4.831.08<0.001
 Male386 (82.83)32,427 (51.92)
 Female80 (17.17)30,016 (47.72)
Birth year 0.026
 199678 (16.74)13,377 (21.42)
 199790 (19.31)13,538 (21.68)
 1998101 (21.67)11,343 (18.16)
 1999101 (21.67)11,809 (18.91)
 200096 (20.60)12,386 (19.83)
Followed year (mean ± SD 1)6.76 ± 4.0215.30 ± 2.20
Comorbidity
 Bipolar disorder9 (1.93)61 (0.10)<0.001
 Depressive disorder15 (3.22)195 (0.31)<0.001
 Anxiety66 (14.16)0 (0.00)<0.001
 Phobic disorder3 (0.64)60 (0.10)0.012
 Obsessive compulsive disorder15 (3.22)70 (0.11)<0.001
 Intellectual disabilities149 (31.97)777 (1.24)<0.001
 Preterm birth10 (2.15)514 (0.82)0.006
Air pollutant level (mean ± SD)
 CO (ppm)0.89 ± 0.360.83 ± 0.32<0.001
 NO2 (ppb)25.47 ± 6.1224.34 ± 6.01<0.001
 O3 (ppb)21.60 ± 3.6121.99 ± 3.540.019
 SO2 (ppb)5.76 ± 3.295.80 ± 3.470.783
 PM10 (μg/m3)56.83 ± 15.2460.27 ± 16.20<0.001
1 Column percentage, including members with missing data. Abbreviations: SD = standard deviation.
Table 2. The hazard ratio and its 95% confidence interval (95%CI) associated with each covariate for autism spectrum disorder.
CovariateHazard Ratio(95% CI)
Male4.45(3.50–5.66) *
Calendar year1.12(1.05–1.20) *
Comorbidity
 Bipolar disorder17.66(9.13–34.14) *
 Depressive disorder9.68(5.79–16.18) *
 Phobic disorder6.43(2.07–20.03) *
 Obsessive compulsive disorder25.98(15.54–43.44) *
 Intellectual disabilities34.26(28.20–41.63) *
 Preterm2.77(1.48–5.19) *
* p value < 0.05.
Table 3. Crude and adjusted hazard ratios for autism spectrum disorder associated with air pollutants.
Crude Hazard Ratio (95%CI)Adjusted Hazard Ratio (95%CI)
Model 1 1Model 2 2
CO (ppm)
 Gestation1.65 (1.32–2.07) *1.77 (1.41–2.22) *1.88 (1.49–2.36) *
 1st Trimester1.68 (1.36–2.09) *1.79 (1.44–2.23) *1.93 (1.55–2.39) *
 2nd Trimester1.56 (1.25–1.96) *1.66 (1.33–2.09) *1.77 (1.41–2.22) *
 3rd Trimester1.57 (1.25–1.97) *1.68 (1.34–2.11) *1.75 (1.39–2.21) *
NO2 (10 ppb)
 Gestation1.37 (1.18–1.60) *1.39 (1.19–1.62) *1.42 (1.22–1.66) *
 1st Trimester1.32 (1.17–1.50) *1.34 (1.19–1.52) *1.39 (1.22–1.58) *
 2nd Trimester1.22 (1.07–1.38) *1.22 (1.07–1.38) *1.25 (1.10–1.42) *
 3rd Trimester1.17 (1.04–1.33) *1.18 (1.04–1.34) *1.18 (1.03–1.34) *
O3 (10 ppb)
 Gestation0.73 (0.56–0.96) *0.69 (0.52–0.91) *0.74 (0.56–0.97) *
 1st Trimester0.83 (0.68–1.02)0.81 (0.66–0.99) *0.85 (0.69–1.04)
 2nd Trimester0.82 (0.67–1.00)0.79 (0.64–0.97) *0.82 (0.67–1.02)
 3rd Trimester0.86 (0.70–1.05)0.83 (0.67–1.01)0.84 (0.68–1.03)
SO2 (ppb)
 Gestation0.99 (0.97–1.02)1.00 (0.98–1.03)1.01 (0.99–1.04)
 1st Trimester1.00 (0.98–1.02)1.01 (0.99–1.03)1.02 (1.00–1.04)
 2nd Trimester0.99 (0.97–1.02)1.00 (0.98–1.03)1.01 (0.98–1.03)
 3rd Trimester0.99 (0.96–1.01)1.00 (0.97–1.02)1.00 (0.98–1.03)
PM10 (10 μg/m3)
 Gestation0.86 (0.81–0.92) *0.87 (0.82–0.92) *0.90 (0.85–0.96) *
 1st Trimester0.95 (0.91–0.99) *0.96 (0.92–1.00)0.98 (0.94–1.03)
 2nd Trimester0.92 (0.89–0.96) *0.92 (0.88–0.96) *0.94 (0.90–0.99) *
 3rd Trimester0.90 (0.86–0.94) *0.90 (0.86–0.95) *0.91 (0.87–0.96) *
1 Adjusted for sex and calendar year. 2 Adjusted for sex, calendar year, and comorbidities. Abbreviation: CI = confidence interval. * p value < 0.05.
Publisher’s Note: MDPI stays neutral with regard to jurisdictional claims in published maps and institutional affiliations.

