
Machine Learning to Identify Interaction of Single-Nucleotide Polymorphisms as a Risk Factor for Chronic Drug-Induced Liver Injury


Abstract
:1. Introduction
2. Materials and Methods
2.1. DILI Chronicity Cohort
2.2. Machine Learning Approaches to Identify SNP–SNP Interactions
2.2.1. MARS Approach
2.2.2. MDR Approach
2.2.3. Logistic Regression Approach
2.3. Data Analysis
3. Results
3.1. Simulation Analysis
3.2. Chronic DILI Data Analysis
4. Discussion
5. Conclusions
Author Contributions
Funding
Institutional Review Board Statement
Informed Consent Statement
Data Availability Statement
Acknowledgments
Conflicts of Interest
References
- Andrade, R.J.; Chalasani, N.; Björnsson, E.S.; Suzuki, A.; Kullak-Ublick, G.A.; Watkins, P.B.; Devarbhavi, H.; Merz, M.; Lucena, M.I.; Kaplowitz, N.; et al. Drug-induced liver injury. Nat. Rev. Dis. Primers 2019, 5, 1–22. [Google Scholar] [CrossRef] [Green Version]
- Hoofnagle, J.H.; Björnsson, E.S. Drug-induced liver injury—Types and phenotypes. N. Engl. J. Med. 2019, 381, 264–273. [Google Scholar] [CrossRef]
- Kaplowitz, N. Idiosyncratic drug hepatotoxicity. Nat. Rev. Drug Discov. 2005, 4, 489–499. [Google Scholar] [CrossRef]
- Chen, M.; Vijay, V.; Shi, Q.; Liu, Z.; Fang, H.; Tong, W. FDA-approved drug labeling for the study of drug-induced liver injury. Drug Discov. Today 2011, 16, 697–703. [Google Scholar] [CrossRef]
- Chen, M.; Suzuki, A.; Thakkar, S.; Yu, K.; Hu, C.; Tong, W. DILIrank: The largest reference drug list ranked by the risk for developing drug-induced liver injury in humans. Drug Discov. Today 2016, 21, 648–653. [Google Scholar] [CrossRef] [PubMed]
- Chalasani, N.; Björnsson, E. Risk factors for idiosyncratic drug-induced liver injury. Gastroenterology 2010, 138, 2246–2259. [Google Scholar] [CrossRef] [PubMed] [Green Version]
- European Association for the Study of the Liver. Electronic address: [email protected]; Clinical Practice Guideline Panel: Chair; Panel members; EASL Governing Board representative. EASL clinical practice guidelines: Drug-induced liver injury. J. Hepatol. 2019, 70, 1222–1261. [Google Scholar] [CrossRef] [PubMed] [Green Version]
- Kaplowitz, N. Drug-induced liver injury. Clin. Infect. Dis. 2004, 38 (Suppl. 2), S44–S48. [Google Scholar] [CrossRef] [PubMed]
- Chen, M.; Suzuki, A.; Borlak, J.; Andrade, R.J.; Lucena, M.I. Drug-induced liver injury: Interactions between drug properties and host factors. J. Hepatol. 2015, 63, 503–514. [Google Scholar] [CrossRef] [PubMed] [Green Version]
- Amacher, D.E. The primary role of hepatic metabolism in idiosyncratic drug-induced liver injury. Expert Opin. Drug Metab. Toxicol. 2012, 8, 335–347. [Google Scholar] [CrossRef]
- Stephens, C.; Andrade, R.J. Genetic predisposition to drug-induced liver injury. Clin. Liver Dis. 2020, 24, 11–23. [Google Scholar] [CrossRef]
- Hoofnagle, J.H.; Bonkovsky, H.L.; Phillips, E.J.; Li, Y.J.; Ahmad, J.; Barnhart, H.; Durazo, F.; Fontana, R.J.; Gu, J.; Khan, I.; et al. HLA-B*35:01 and Green Tea–Induced Liver Injury. Hepatology 2021, 73, 2484–2493. [Google Scholar] [CrossRef]
- Kaliyaperumal, K.; Grove, J.I.; Delahay, R.M.; Griffiths, W.J.H.; Duckworth, A.; Aithal, G.P. Pharmacogenomics of drug-induced liver injury (DILI): Molecular biology to clinical applications. J. Hepatol. 2018, 69, 948–957. [Google Scholar] [CrossRef] [Green Version]
- Li, Y.J.; Phillips, E.J.; Dellinger, A.; Nicoletti, P.; Schutte, R.; Li, D.; Ostrov, D.A.; Fontana, R.J.; Watkins, P.B.; Stolz, A.; et al. Human leukocyte antigen B*14:01 and B*35:01 are associated with trimethoprim-sulfamethoxazole induced liver injury. Hepatology 2021, 73, 268–281. [Google Scholar] [CrossRef]
- Fontana, R.J.; Cirulli, E.T.; Gu, J.; Kleiner, D.; Ostrov, D.; Phillips, E.; Schutte, R.; Barnhart, H.; Chalasani, N.; Watkins, P.B.; et al. The role of HLA-A*33:01 in patients with cholestatic hepatitis attributed to terbinafine. J. Hepatol. 2018, 69, 1317–1325. [Google Scholar] [CrossRef] [PubMed]
- Urban, T.J.; Nicoletti, P.; Chalasani, N.; Serrano, J.; Stolz, A.; Daly, A.K.; Aithal, G.P.; Dillon, J.; Navarro, V.; Odin, J.; et al. Minocycline hepatotoxicity: Clinical characterization and identification of HLA-B∗35:02 as a risk factor. J. Hepatol. 2017, 67, 137–144. [Google Scholar] [CrossRef] [PubMed] [Green Version]
- Daly, A.K.; Donaldson, P.T.; Bhatnagar, P.; Shen, Y.; Pe’er, I.; Floratos, A.; Daly, M.J.; Goldstein, D.B.; John, S.; Nelson, M.R.; et al. HLA-B*5701 genotype is a major determinant of drug-induced liver injury due to flucloxacillin. Nat. Genet. 2009, 41, 816–819. [Google Scholar] [CrossRef] [PubMed]
- Nicoletti, P.; Aithal, G.P.; Bjornsson, E.S.; Andrade, R.J.; Sawle, A.; Arrese, M.; Barnhart, H.X.; Bondon-Guitton, E.; Hayashi, P.H.; Bessone, F.; et al. Association of liver injury from specific drugs, or groups of drugs, with polymorphisms in HLA and other genes in a genome-wide association study. Gastroenterology 2017, 152, 1078–1089. [Google Scholar] [CrossRef] [Green Version]
- Cirulli, E.T.; Nicoletti, P.; Abramson, K.; Andrade, R.J.; Bjornsson, E.S.; Chalasani, N.; Fontana, R.J.; Hallberg, P.; Li, Y.J.; Lucena, M.I.; et al. A missense variant in PTPN22 is a risk factor for drug-induced liver injury. Gastroenterology 2019, 156, 1707–1716.e2. [Google Scholar] [CrossRef] [Green Version]
- Urban, T.J.; Shen, Y.; Stolz, A.; Chalasani, N.; Fontana, R.J.; Rochon, J.; Ge, D.; Shianna, K.V.; Daly, A.K.; Lucena, M.I.; et al. Limited contribution of common genetic variants to risk for liver injury due to a variety of drugs. Pharm. Genom. 2012, 22, 784. [Google Scholar] [CrossRef] [Green Version]
- Overby, C.L.; Hripcsak, G.; Shen, Y. Estimating heritability of drug-induced liver injury from common variants and implications for future study designs. Sci. Rep. 2014, 4, 1–3. [Google Scholar] [CrossRef] [PubMed] [Green Version]
- Carlborg, Ö.; Haley, C.S. Epistasis: Too often neglected in complex trait studies? Nat. Rev. Genet. 2004, 5, 618–625. [Google Scholar] [CrossRef] [PubMed]
- Yi, N. Statistical analysis of genetic interactions. Genet. Res. 2010, 92, 443–459. [Google Scholar] [CrossRef] [Green Version]
- Wei, W.-H.; Hemani, G.; Haley, C.S. Detecting epistasis in human complex traits. Nat. Rev. Genet. 2014, 15, 722–733. [Google Scholar] [CrossRef]
- Cook, N.R.; Zee, R.Y.; Ridker, P.M. Tree and spline based association analysis of gene-gene interaction models for ischemic stroke. Stat. Med. 2004, 23, 1439–1453. [Google Scholar] [CrossRef]
- Moore, J.H.; Williams, S.M. New strategies for identifying gene-gene interactions in hypertension. Ann. Med. 2002, 34, 88–95. [Google Scholar] [CrossRef]
- Bansal, A.; Pepe, M.S. When does combining markers improve classification performance and what are implications for practice? Stat. Med. 2013, 32, 1877–1892. [Google Scholar] [CrossRef] [Green Version]
- Aithal, G.P.; Watkins, P.B.; Andrade, R.J.; Larrey, D.; Molokhia, M.; Takikawa, H.; Hunt, C.M.; Wilke, R.A.; Avigan, M.; Kaplowitz, N.; et al. Case definition and phenotype standardization in drug-induced liver injury. Clin. Pharmacol. Ther. 2011, 89, 806–815. [Google Scholar] [CrossRef]
- Lucena, M.I.; Molokhia, M.; Shen, Y.; Urban, T.J.; Aithal, G.P.; Andrade, R.J.; Day, C.P.; Ruiz-Cabello, F.; Donaldson, P.T.; Stephens, C.; et al. Susceptibility to amoxicillin-clavulanate-induced liver injury is influenced by multiple HLA class I and II alleles. Gastroenterology 2011, 141, 338–347. [Google Scholar] [CrossRef]
- Marees, A.T.; de Kluiver, H.; Stringer, S.; Vorspan, F.; Curis, E.; Marie-Claire, C.; Derks, E.M. A tutorial on conducting genome-wide association studies: Quality control and statistical analysis. Int. J. Methods Psychiatr. Res. 2018, 27, e1608. [Google Scholar] [CrossRef] [PubMed]
- Liberzon, A.; Subramanian, A.; Pinchback, R.; Thorvaldsdóttir, H.; Tamayo, P.; Mesirov, J.P. Molecular signatures database (MSigDB) 3.0. Bioinformatics 2011, 27, 1739–1740. [Google Scholar] [CrossRef] [PubMed]
- Barron, A.R.; Xiao, X. Discussion: Multivariate adaptive regression splines. Ann. Stat. 1991, 19, 67–82. [Google Scholar] [CrossRef]
- Ritchie, M.D.; Hahn, L.W.; Roodi, N.; Bailey, L.R.; Dupont, W.D.; Parl, F.F.; Moore, J.H. Multifactor-dimensionality reduction reveals high-order interactions among estrogen-metabolism genes in sporadic breast cancer. Am. J. Hum. Genet. 2001, 69, 138–147. [Google Scholar] [CrossRef] [PubMed] [Green Version]
- Ritchie, M.D.; Motsinger, A.A. Multifactor dimensionality reduction for detecting gene–gene and gene–environment interactions in pharmacogenomics studies. Pharmacogenomics 2005, 6, 823–834. [Google Scholar] [CrossRef] [Green Version]
- Breiman, L. Random forests. Mach. Learn. 2001, 45, 5–32. [Google Scholar] [CrossRef] [Green Version]
- Cho, Y.M.; Ritchie, M.D.; Moore, J.H.; Park, J.Y.; Lee, K.U.; Shin, H.D.; Lee, H.K.; Park, K.S. Multifactor-dimensionality reduction shows a two-locus interaction associated with Type 2 diabetes mellitus. Diabetologia 2004, 47, 549–554. [Google Scholar] [CrossRef] [Green Version]
- Lin, H.Y.; Wang, W.; Liu, Y.H.; Soong, S.J.; York, T.P.; Myers, L.; Hu, J.J. Comparison of multivariate adaptive regression splines and logistic regression in detecting SNP–SNP interactions and their application in prostate cancer. J. Hum. Genet. 2008, 53, 802–811. [Google Scholar] [CrossRef]
- Goldstein, B.A.; Polley, E.C.; Briggs, F.B. Random forests for genetic association studies. Stat. Appl. Genet. Mol. Biol. 2011, 10, 32. [Google Scholar] [CrossRef]
- R Core Team. R: A Language and Environment for Statistical Computing; R Foundation for Statistical Computing: Vienna, Austria, 2013; Available online: http://www.R-project.org/ (accessed on 5 October 2021).
- Winham, S.J.; Motsinger-Reif, A.A. An R package implementation of multifactor dimensionality reduction. BioData Min. 2011, 4, 24. [Google Scholar] [CrossRef] [PubMed] [Green Version]
- Breiman, L.; Cutler, A. Breiman and Cutler’s Random Forests for Classification and Regression. Package ‘randomForest’ Published on CRAN. 2018. Available online: https://www.stat.berkeley.edu/~breiman/RandomForests/ (accessed on 5 October 2021).
- Therneau, T.; Atkinson, B.; Ripley, B. Rpart: Recursive Partitioning. R Package Version 4.1-3. 2019. Available online: http://CRAN.R-project.org/package=rpart (accessed on 5 October 2021).
- Minitab 17 Statistical Software. Minitab, Inc.: State College, PA, USA, 2010. Available online: https://www.minitab.com (accessed on 5 October 2021).
- García, V.; Mollineda, R.A.; Sánchez, J.S. Index of balanced accuracy: A performance measure for skewed class distributions. In Proceedings of the 4th Iberian Conference on Pattern Recognition and Image Analysis (IbPRIA 2009), Póvoa de Varzim, Portugal, 10–12 June 2009; Springer: Berlin/Heidelberg, Germany, 2009; pp. 441–448. [Google Scholar]
- Gui, J.; Moore, J.H.; Williams, S.M.; Andrews, P.; Hillege, H.L.; van der Harst, P.; Navis, G.; Van Gilst, W.H.; Asselbergs, F.W.; Gilbert-Diamond, D. A simple and computationally efficient approach to multifactor dimensionality reduction analysis of gene-gene interactions for quantitative traits. PLoS ONE 2013, 8, e66545. [Google Scholar] [CrossRef] [Green Version]
- Fontana, R.J.; Hayashi, P.H.; Barnhart, H.; Kleiner, D.E.; Reddy, K.R.; Chalasani, N.; Lee, W.M.; Stolz, A.; Phillips, T.; Serrano, J.; et al. Persistent liver biochemistry abnormalities are more common in older patients and those with cholestatic drug induced liver injury. Am. J. Gastroenterol. 2015, 110, 1450. [Google Scholar] [CrossRef] [PubMed] [Green Version]
- Medina-Caliz, I.; Robles-Diaz, M.; Garcia-Muñoz, B.; Stephens, C.; Ortega-Alonso, A.; Garcia-Cortes, M.; González-Jimenez, A.; Sanabria-Cabrera, J.A.; Moreno, I.; Fernandez, M.C.; et al. Definition and risk factors for chronicity following acute idiosyncratic drug-induced liver injury. J. Hepatol. 2016, 65, 532–542. [Google Scholar] [CrossRef] [PubMed]
- Johnson, A.D.; Kavousi, M.; Smith, A.V.; Chen, M.H.; Dehghan, A.; Aspelund, T.; Lin, J.P.; van Duijn, C.M.; Harris, T.B.; Cupples, L.A.; et al. Genome-wide association meta-analysis for total serum bilirubin levels. Hum. Mol. Genet. 2009, 18, 2700–2710. [Google Scholar] [CrossRef] [PubMed] [Green Version]
- Yang, L.; Yang, L.; Wu, H.; Gelder, T.V.; Matic, M.; Ruan, J.S.; Han, Y.; Xie, R.X. SLCO1B1 rs4149056 genetic polymorphism predicting methotrexate toxicity in Chinese patients with non-Hodgkin lymphoma. Pharmacogenomics 2017, 18, 1557–1562. [Google Scholar] [CrossRef] [PubMed]
- Jin, S.; Li, X.; Fan, Y.; Fan, X.; Dai, Y.; Lin, H.; Cai, W.; Yang, J.; Xiang, X. Association between genetic polymorphisms of SLCO1B1 and susceptibility to methimazole-induced liver injury. Basic Clin. Pharmacol. Toxicol. 2019, 125, 508–517. [Google Scholar] [CrossRef] [Green Version]
- Shu, N.; Hu, M.; Ling, Z.; Liu, P.; Wang, F.; Xu, P.; Zhong, Z.; Sun, B.; Zhang, M.; Li, F.; et al. The enhanced atorvastatin hepatotoxicity in diabetic rats was partly attributed to the upregulated hepatic Cyp3a and SLCO1B1. Sci. Rep. 2016, 6, 33072. [Google Scholar] [CrossRef] [Green Version]
- Chen, R.; Wang, J.; Tang, S.; Zhang, Y.; Lv, X.; Wu, S.; Xia, Y.; Deng, P.; Ma, Y.; Tu, D.; et al. Association of polymorphisms in drug transporter genes (SLCO1B1 and SLC10A1) and anti-tuberculosis drug-induced hepatotoxicity in a Chinese cohort. Tuberculosis 2015, 95, 68–74. [Google Scholar] [CrossRef]
- Li, L.M.; Chen, L.; Deng, G.H.; Tan, W.T.; Dan, Y.J.; Wang, R.Q.; Chen, W.S. SLCO1B1 *15 haplotype is associated with rifampin-induced liver injury. Mol. Med. Rep. 2012, 6, 75–82. [Google Scholar]
- Weiss, H.J.; Angiari, S. Metabolite Transporters as Regulators of Immunity. Metabolites 2020, 10, 418. [Google Scholar] [CrossRef]
- Long, Y.; Gao, Z.; Hu, X.; Xiang, F.; Wu, Z.; Zhang, J.; Han, X.; Yin, L.; Qin, J.; Lan, L.; et al. Downregulation of MCT4 for lactate exchange promotes the cytotoxicity of NK cells in breast carcinoma. Cancer Med. 2018, 7, 4690–4700. [Google Scholar] [CrossRef] [Green Version]


| Recovery Rate of the Known SNPs Interaction | |||
|---|---|---|---|
| MARS * | MDR * | RF-LR * | |
| Original simulation dataset | 100% | 100% | 100% |
| Permutation test 1 (2 of 250 observations permutated) | 100% (100/100) | 100% (100/100) | 100% (100/100) |
| Permutation test 2 (10 of 250 observations permutated) | 100% (100/100) | 97% (97/100) | 100% (100/100) |
| Individual SNP Analysis | ||||
|---|---|---|---|---|
| Individual SNPs or SNP–SNP Interaction | Genotypes | Acute N (%) | Chronicity N (%) | Odds Ratio (95% Confidence Intervals, p Value) |
| rs6487213 | CC | 76 (79.2) | 20 (20.8) | 3.28 (1.57–7.09, p = 0.002) |
| CT or TT | 162 (92.6) | 13 (7.4) | ||
| rs5417 | AA | 74 (79.6) | 19 (20.4) | 3.01 (1.44–6.43, p = 0.004) |
| CA or CC | 164 (92.1) | 14 (7.9) | ||
| rs7658048 | AG | 113 (86.3) | 18 (13.7) | 1.33 (0.64–2.79, p = 0.448) |
| AA or GG | 125 (89.3) | 15 (10.7) | ||
| rs12453290 | AA | 105 (84.7) | 19 (15.3) | 1.72 (0.83–3.65, p = 0.149) |
| GA or GG | 133 (90.5) | 14 (9.5) | ||
| rs3785157 | CC | 106 (85.5) | 18 (14.5) | 1.49 (0.72–3.14, p = 0.282) |
| TC or TT | 132 (89.8) | 15 (10.2) | ||
| SNP–SNP interaction analysis | ||||
| MARS analysis | ||||
| rs6487213 + rs3785157 | CC and CC | 32 (69.6) | 14 (30.4) | 4.74 (2.14–10.39, p < 0.001) |
| Others | 206 (91.6) | 19 (8.4) | ||
| MDR analysis | ||||
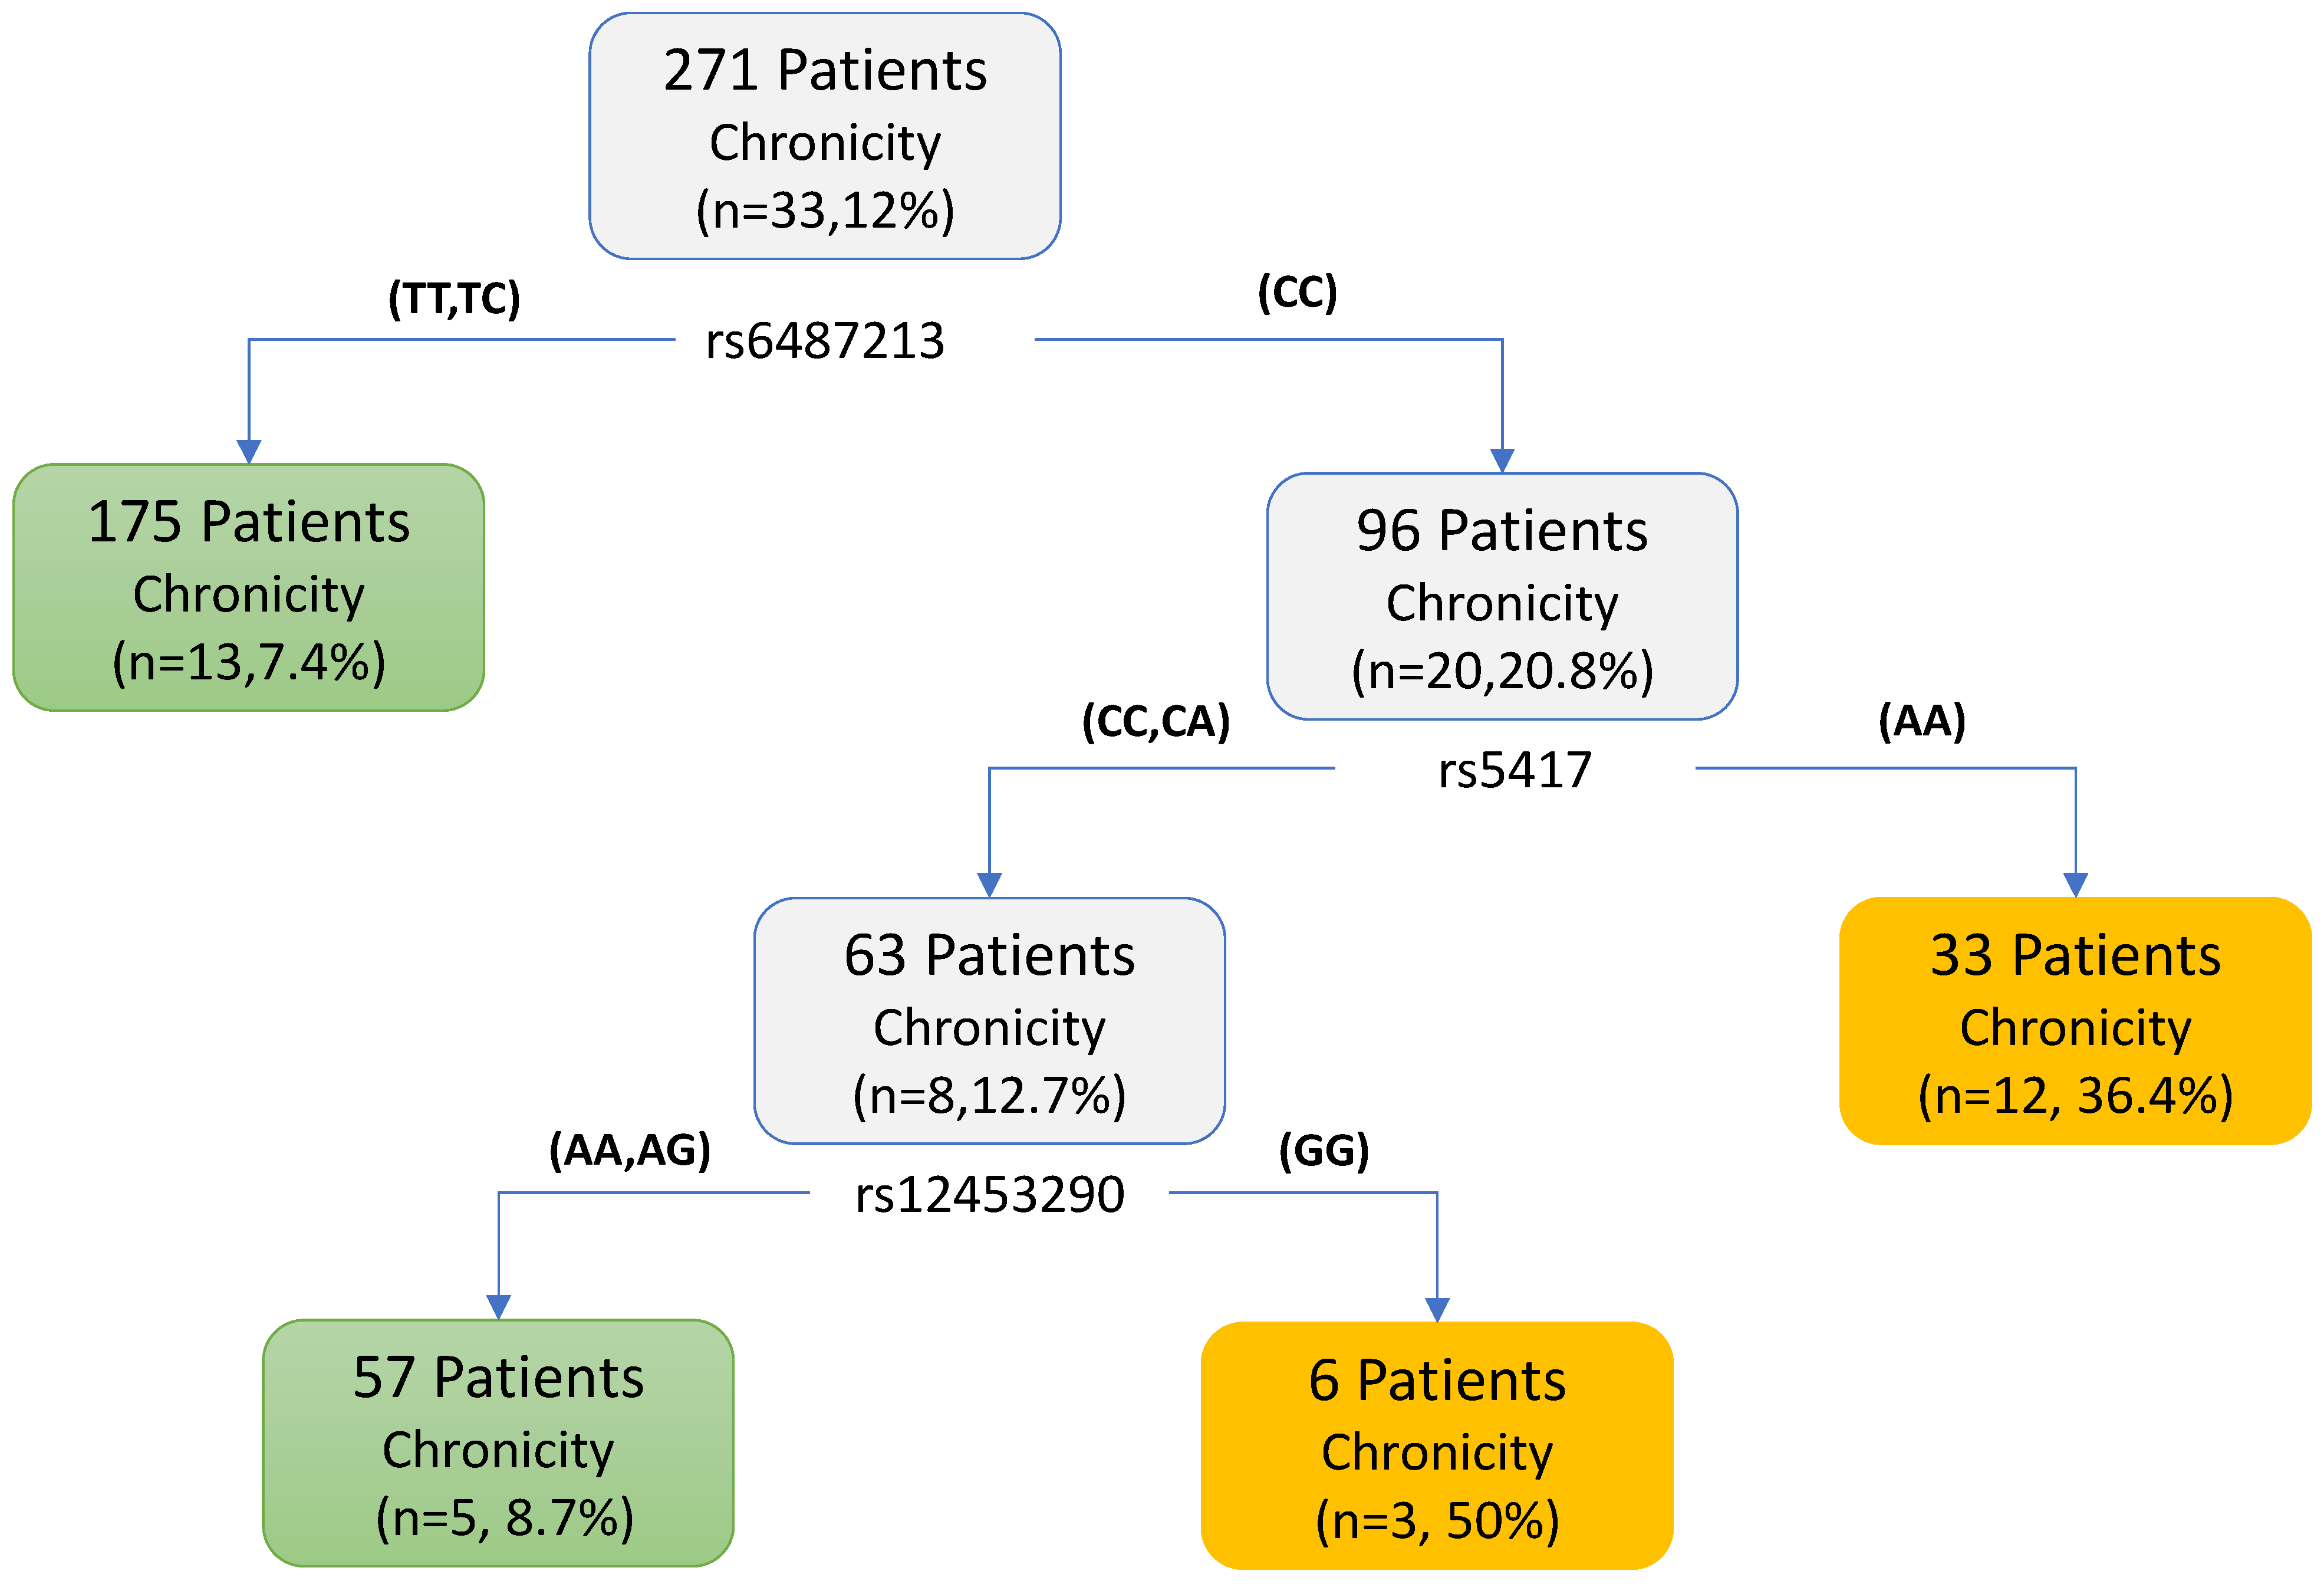
| rs5417 + rs7658048 + rs12453290 | AA and AG and AA | 12 (66.7) | 6 (33.3) | 4.19 (1.36–11.74, p = 0.008) |
| Others | 226 (89.3) | 27 (10.7) | ||
| Random Forest plus logistic regression | ||||
| rs5417 + rs3785157 | AA and CC | 36 (78.3) | 10 (21.7) | 2.44 (1.03–5.45, p = 0.034) |
| Others | 202 (89.8) | 23 (10.2) | ||
Publisher’s Note: MDPI stays neutral with regard to jurisdictional claims in published maps and institutional affiliations. |
© 2021 by the authors. Licensee MDPI, Basel, Switzerland. This article is an open access article distributed under the terms and conditions of the Creative Commons Attribution (CC BY) license (https://creativecommons.org/licenses/by/4.0/).
Share and Cite
Moore, R.; Ashby, K.; Liao, T.-J.; Chen, M. Machine Learning to Identify Interaction of Single-Nucleotide Polymorphisms as a Risk Factor for Chronic Drug-Induced Liver Injury. Int. J. Environ. Res. Public Health 2021, 18, 10603. https://0-doi-org.brum.beds.ac.uk/10.3390/ijerph182010603
Moore R, Ashby K, Liao T-J, Chen M. Machine Learning to Identify Interaction of Single-Nucleotide Polymorphisms as a Risk Factor for Chronic Drug-Induced Liver Injury. International Journal of Environmental Research and Public Health. 2021; 18(20):10603. https://0-doi-org.brum.beds.ac.uk/10.3390/ijerph182010603
Chicago/Turabian StyleMoore, Roland, Kristin Ashby, Tsung-Jen Liao, and Minjun Chen. 2021. "Machine Learning to Identify Interaction of Single-Nucleotide Polymorphisms as a Risk Factor for Chronic Drug-Induced Liver Injury" International Journal of Environmental Research and Public Health 18, no. 20: 10603. https://0-doi-org.brum.beds.ac.uk/10.3390/ijerph182010603