Article

Automatic Diagnosis of Mental Healthcare Information Actionability: Developing Binary Classifiers

1
School of Languages and Cultures, University of Sydney, Sydney 2006, Australia
2
Department of Computer Science, City University of Hong Kong, Hong Kong 999077, China
3
School of Computer Science, South China Normal University, Guangzhou 510631, China
*
Author to whom correspondence should be addressed.
Int. J. Environ. Res. Public Health 2021, 18(20), 10743; https://0-doi-org.brum.beds.ac.uk/10.3390/ijerph182010743
Submission received: 16 August 2021 / Revised: 11 October 2021 / Accepted: 12 October 2021 / Published: 13 October 2021
(This article belongs to the Special Issue Machine Learning Applications in Public Health)

Abstract

:
We aimed to develop a quantitative instrument to assist with the automatic evaluation of the actionability of mental healthcare information. We collected and classified two large sets of mental health information from certified mental health websites: generic and patient-specific mental healthcare information. We compared the performance of the optimised classifier with popular readability tools and non-optimised classifiers in predicting mental health information of high actionability for people with mental disorders. sensitivity of the classifier using both semantic and structural features as variables achieved statistically higher than that of the binary classifier using either semantic (p < 0.001) or structural features (p = 0.0010). The specificity of the optimized classifier was statistically higher than that of the classifier using structural variables (p = 0.002) and the classifier using semantic variables (p = 0.001). Differences in specificity between the full-variable classifier and the optimised classifier were statistically insignificant (p = 0.687). These findings suggest the optimised classifier using as few as 19 semantic-structural variables was the best-performing classifier. By combining insights of linguistics and statistical analyses, we effectively increased the interpretability and the diagnostic utility of the binary classifiers to guide the development, evaluation of the actionability and usability of mental healthcare information.

1. Introduction

Information readability and actionability form two key factors of the effectiveness of patient-oriented healthcare information [1,2,3,4,5]. Many current online healthcare information quality evaluations focus on readability assessment. This benefits from the long tradition of quantitative readability evaluation in medical and health education using readability instruments [6,7,8,9,10]. Even though the two concepts are distinct from each other in both research and clinical practice, many current studies still confuse and conflate the two distinct concepts into a single dimension of health information quality assessment. Actionable content means information that can automatically prompt the best decisions about care at the point in time when clinical decisions need to be made [11,12,13]. This requires the design of health information that is based on the real-life circumstances of the intended information users and best reflects their practical needs, varying health literacy levels, cognitive abilities, socioeconomic circumstances, and other determinants [14,15,16,17]. Actionability assessment thus requires a distinct approach to readability or understandability assessment. Actionability can have an important impact on the acceptability and practical usability of the information for target readers [18,19]. Existing approaches to the evaluation of health information actionability are often qualitative. Patient Education Materials Assessment Tool (PEMAT) is widely used by health and medical professionals to evaluate the practical usability of printed or audio-visual materials [20,21]. However, there is a lack of quantitative tools to assist health professionals with the evaluation of the actionability of mental health resources.
Our study aimed to offer an automatic quantitative assessment of mental health information actionability. This was based on two major types of online mental healthcare information: generic and patient-specific. Generic mental health information is written for the general public, with an accessible, understandable language, but without specifying the intended patients or information users. This represents the mainstream health information in many medical and health domains. Another major type of mental healthcare information is patient-specific, using a similarly easy, plain, and understandable language but with a focus on well-defined patients and reader groups. General mental health information focuses on the explanation of symptoms, signs of prevalent mental disorder, wide-ranging causes, and determinants, as well as generic treatment plans and interventions. By contrast, patient-specific mental health information often adopts a narrative communication style, discussing the diverse, complex yet recurrent practical needs of the intended readers, recognising their potential for achieving better mental health and wellbeing, adapting general treatment plans and interventions to suit their needs, and taking into consideration likely barriers to external resources. An increasing number of not-for-profit organisations in English-speaking countries are actively engaged in the development of patient-specific mental health information for vulnerable people [22,23,24]. This increasing direction towards personalised mental healthcare support through patient-tailored mental health information provides valuable resources to the development of automatic assessment instruments, which, in turn, will further advance research and improve clinical practice in patient-centred mental healthcare.

2. Methods

2.1. Information Sources, and Search Strategies

We started the search for generic and patient-specific mental health resources on Google. We limited the search to the 100 top websites on mental healthcare up to 1 July 2021. We used the label of HON.Net as a measure of health and medical content quality control [25]. With the collection of generic mental healthcare information, 36 websites were excluded for not having been certified by HON.Net, 22 websites were excluded for not addressing general readers, and 6 were excluded for not being suitable for the automatic statistical analysis based on natural language features, such as too short paragraphs, sentences, or passages. With patient-specific mental healthcare information, 36 websites were excluded for not having been certified by HON.Net, 42 websites were excluded for not addressing general readers, and 4 were excluded for not being suitable for natural language mining and subsequent quantitative assessments. In the final screened texts, we randomly selected 70% from each text group to develop the training and testing dataset. The final dataset of patient-specific information included mental health selfcare resources for 4 population groups: teenagers (aged 11–18) (8.9%), young adults (aged 18–35) (87.5%), people over 65 years (1.67%), women (1.17%), and men (0.76%).
The two sets of mental healthcare information collected, that is, generic (GEN) and patient-specific (PAS), were fully annotated with two sets of natural language features using Readability Studio (Oleander Software) [26,27] and the English semantic annotation system (USAS) developed by the University of Lancaster, United Kingdom [28,29,30]. Readability Studio annotated the health information with rich structural features to help us measure the lexical, morphological, and syntactic complexity of the texts. Some of these features were studied extensively in the field of readability assessment, such as the average number of characters, average number of syllables, number of monosyllabic words, average number of sentences per paragraph, average sentence length, whereas others were less studied. Structural features added by Readability Studio were collectively labelled with TOF in the training and testing of machine learning classifiers. The automatic semantic annotation with USAS added rich semantic information of the mental healthcare resources.

2.2. Semantic Feature Labelling Strategy

Semantic features were well studied in medical document classification and clinically significant information retrieval. In our study, semantic features (labelled as SOF) refer to health information contents. The semantic classification of USAS was loosely based on Tom McArthur’s Longman Lexicon of Contemporary English, which broadly divided the English lexicon into 22 large categories (Table 2) [31,32,33]. Semantic annotation has wide applications in medical and health informatics, such as document classification and information retrieval. In the clinic, the semantic annotation has been explored to organise unstructured clinical information or data to support medical research or clinical trials. It can aid in the automatic extraction of critical information from clinical texts such as temporal information, symptoms, diseases to facilitate clinical decision making. Compared to structural features, semantic features can help with more contextualised analyses of health information, for example, in our study, this means how the use of certain semantic classes (Table 2) such as medical and health terms (B), emotions (E), sports (K), movement M), measurements (N), temporal expressions (T), psychological actions, states and processes (X), science and technology (Y), and proper names (Z), may affect the levels of the actionability of mental healthcare resources.
Since the USAS semantic annotation scheme was designed for general language studies, we adapted the descriptive labels of some semantic categories (notably B, K, Z) to reflect its application in the study of mental healthcare information. Subcategories of the original 22 large semantic categories that occurred rarely in mental healthcare information were trimmed. As a result, the adjusted descriptive labels indicated the largest and most frequent subcategory within each large semantic category. For example, the original USAS descriptive label for B was (Body and the Individual). In our study, it was found that most of the subclasses of B belonged to B1 (Anatomy and physiology); B2 (Health and disease); B3 (Medicines and medical treatment). There were large missing cases of B4 (Cleaning and personal care) and B5 (Clothes and personal belongings). We, therefore, adapted B to Medicine and Health terms in our study.
The original USAS descriptive label for K was Entertainment, which includes K1 (Entertainment generally), K2 (Music and related activities), K3 (Recorded sound), K4 (Drama, the theatre and show business), K5 (Sports and games generally) and K6 (Children’s games). Similarly, the original descriptive label of category I was (Money), including I1 (Money generally), I2 (Business), I3 (work and employment), and I4 (Industry). The most frequent subcategory of mental healthcare resources was I3 on employment, so we relabelled I as Work Employment. Most words of K belonged to K5 and K6; we, thus, adjusted the descriptive label to reflect the most relevant subcategories of K in our study on mental healthcare resources, especially for youth mental healthcare. Another example is the semantic category Z, whose original USA descriptive label was Names (Z1–Z3) and Grammar (Z4–Z9 plus Z99). To distinguish the effects of infrequent expressions, such as medical jargon, we separated Z99 (out-of-dictionary expressions) from other Z subclasses: Z1 (personal names); Z2 (geographical names); Z3 (other proper names), Z5 (grammatical bins), Z6 (negative expressions), Z7 (if), Z8 (pronouns), and Z9 (trash can).

2.3. Statistics

2.3.1. Readability Assessment

Table 1 shows the statistical analysis (Mann–Whitney U test of 2 independent samples) of the distribution of structural features (TOF) in general, non-specified and patient-specific mental healthcare information. First, we calculated the overall difficulty of written mental health information using validated readability assessment tools including Flesch Reading Ease Score, FORCAST, Gunning Fog Index, SMOG Index. The mean Flesch Ease Reading score of generic, non-specified mental healthcare information was 46.71 (SD = 11.92) and was statistically more difficult than that of patient-specific mental health information (mean = 66.74, SD = 12.27, Mann–Whitney U test, p = 0.000). This suggests that generic information with a mean of 46.61 was suitable for college students (Flesch Reading Ease range: 50–30); and patient-tailored mental health information could be easily understood by 13–15-year-old students or general readers with Year 9 education (Flesch Reading Ease range: 70–60). The average Gunning Fog score of the generic mental health information was 12.46 (SD = 2.03) and was statistically higher than that of patient-tailored mental health information (mean = 9.02, SD = 1.93, p = 0.000). The difficulty of generic mental health information measured by SMOG Index score was 12.50 (SD = 1.50) and was statistically higher than patient-tailored resources (mean = 10.12, SD = 1.6, p = 0.000). Both results of the Gunning Fog Index and the SMOG Index suggested that patient-tailored information was suitable for readers with Year 9–10 education, and generic mental healthcare resources required at least three more years of education. Both generic and patient-specific mental healthcare information was above the Year 6–8 reading levels recommended by the World Health Organisation.

2.3.2. Statistical Differences between Patient and Generic Health Information

Lexical complexity was measured by 10 structural features including medical jargons, number of unique words, repeated words, article mismatches, redundant phrases, overused words, wordy items, cliché, number of proper nouns and number of numerals. The mean of 3 lexical features of generic mental healthcare information was statistically similar to that of patient-specific information: repeated words (mean_GEN = 0.02, mean_ PAS = 0.02, p = 0.732), redundant phrases (mean_GEN = 0.16, mean_ PAS = 0.15, p = 0.945), and cliches (mean_GEN = 0.12, mean_ PAS = 0.12, p = 0.685). For the remaining 7 structural features measuring lexical complexity, the mean of non-specified mental healthcare information was statistically higher than that of patient-specific mental healthcare information: medical jargons (mean_GEN = 11.25, mean_ PAS = 5.14, p = 0.000), number of unique words (mean_GEN = 426.45, mean_ PAS = 329.19, p = 0.000), article mismatches (mean_GEN = 0.03, mean_ PAS = 0.03, p = 0.000), overused words (mean_GEN = 16.49, mean_ PAS = 9.97, p = 0.000), wordy items (mean_GEN = 42.24, mean_ PAS = 18.41, p = 0.000), number of proper nouns (mean_GEN = 26.05, mean_ PAS = 16.74, p = 0.000), and number of numerals (mean_GEN = 6.7, mean_ PAS = 6.05, p = 0.000).
In terms of morphological complexity, the mean of generic mental healthcare information was statistically higher than that of patient-specific information in 7 categories: average number of characters (mean_GEN = 5.16, mean_ PAS = 4.64, p = 0.000), average number of syllables (mean_GEN = 1.73, mean_ PAS = 1.50, p = 0.000), number of monosyllabic words (mean_GEN = 660.40, mean_ PAS = 620.35, p = 0.000), number of complex (3+ syllable) words (mean_GEN = 218.95, mean_ PAS = 114.68, p = 0.000), number of unique 3+ syllable words (mean_GEN = 127.2, mean_ PAS = 67.81, p = 0.000), number of long (6+ characters) words (mean_GEN = 434.95, mean_ PAS = 283.58, p = 0.000), and number of unique long words (mean_GEN = 245.87, mean_ PAS = 157.58, p = 0.000). The mean of the number of unique monosyllabic words between two sets of mental healthcare information was statistically similar (mean_GEN = 162.4, mean_ PAS = 157.86, p = 0.091).
Lastly, generic patient mental health information was syntactically more complex than patient-specific mental healthcare information: number of difficult sentences (more than 22 words) (mean_GEN = 14.69, mean_ PAS = 8.68, p = 0.000), average sentence length (mean_GEN = 13.8, mean_ PAS = 12.73, p = 0.000), and passive voice (mean_GEN = 5.22, mean_ PAS = 2.79, p = 0.000). Characteristics of syntactical structures of patient-specific mental healthcare information included the use of more lengthy, descriptive paragraphs compared to syntactic brevity of generic, non-specified mental health information: average number of sentences per paragraph (mean_GEN = 1.54, mean_ PAS = 2.58, p = 0.000); stronger emphasis on logical coherence: sentences that begin with conjunctions (and, but, though, while, even though, etc.) (mean_GEN = 1.11, mean_ PAS = 1.64, p = 0.000); and the use of more interactive sentence structures: number of interrogative sentences (questions) (mean_GEN = 2.81, mean_ PAS = 4.3, p = 0.000) and number of exclamatory sentences (mean_GEN = 0.08, mean_ PAS = 1.35, p = 0.000).
Table 2 shows that the mean of generic, non-specified mental healthcare information was statistically higher than that of patient-specific mental healthcare information in semantic categories of general and abstract terms (A) (mean_GEN = 236.46, mean_ PAS = 192.704, p = 0.000), medical and health expressions (B) (mean_GEN = 83.122, mean_ PAS = 36.17, p = 0.000), emotions (E) (mean_GEN = 40.559, mean_ PAS = 27.789, p = 0.000), food and beverage (F) (mean_GEN = 8.794, mean_ PAS = 6.583, p = 0.004), government and politics (G) (mean_GEN = 3.421, mean_ PAS = 3.313, p = 0.000), dwelling and housing (H) (mean_GEN = 3.479, mean_ PAS = 3.071, p = 0.004), work and employment (I) (mean_GEN = 9.363, mean_ PAS = 8.121, p = 0.000), sports and games (K) (mean_GEN = 4.9, mean_ PAS = 4.176, p = 0.002), living things (L) (mean_GEN = 5.711, mean_ PAS = 4.389, p = 0.000), measurements (N) (mean_GEN = 62.396, mean_ PAS = 44.089, p = 0.000), general substances (O) (mean_GEN = 16.960, mean_ PAS = 13.138, p = 0.000), education (P) (mean_GEN = 4.614, mean_ PAS = 4.290, p = 0.000), social actions, states and processes (S) (mean_GEN = 73.062, mean_ PAS = 72.781, p = 0.026), temporal expressions (T) (mean_GEN = 37.985, mean_ PAS = 34.453, p = 0.000), environment (W) (mean_GEN = 1.879, mean_ PAS = 1.268, p = 0.000), psychological actions, states and processes (X) (mean_GEN = 67.294, mean_ PAS = 62.999, p = 0.020), science and technology (Y) (mean_GEN = 2.69, mean_ PAS = 2.59, p = 0.001), proper names and grammar (Z) (mean_GEN = 389/823, mean_ PAS = 359.010, p = 0.000) and out-of-dictionary expressions (Z99) (mean_GEN = 33.909, mean_ PAS = 16.810, p = 0.000).

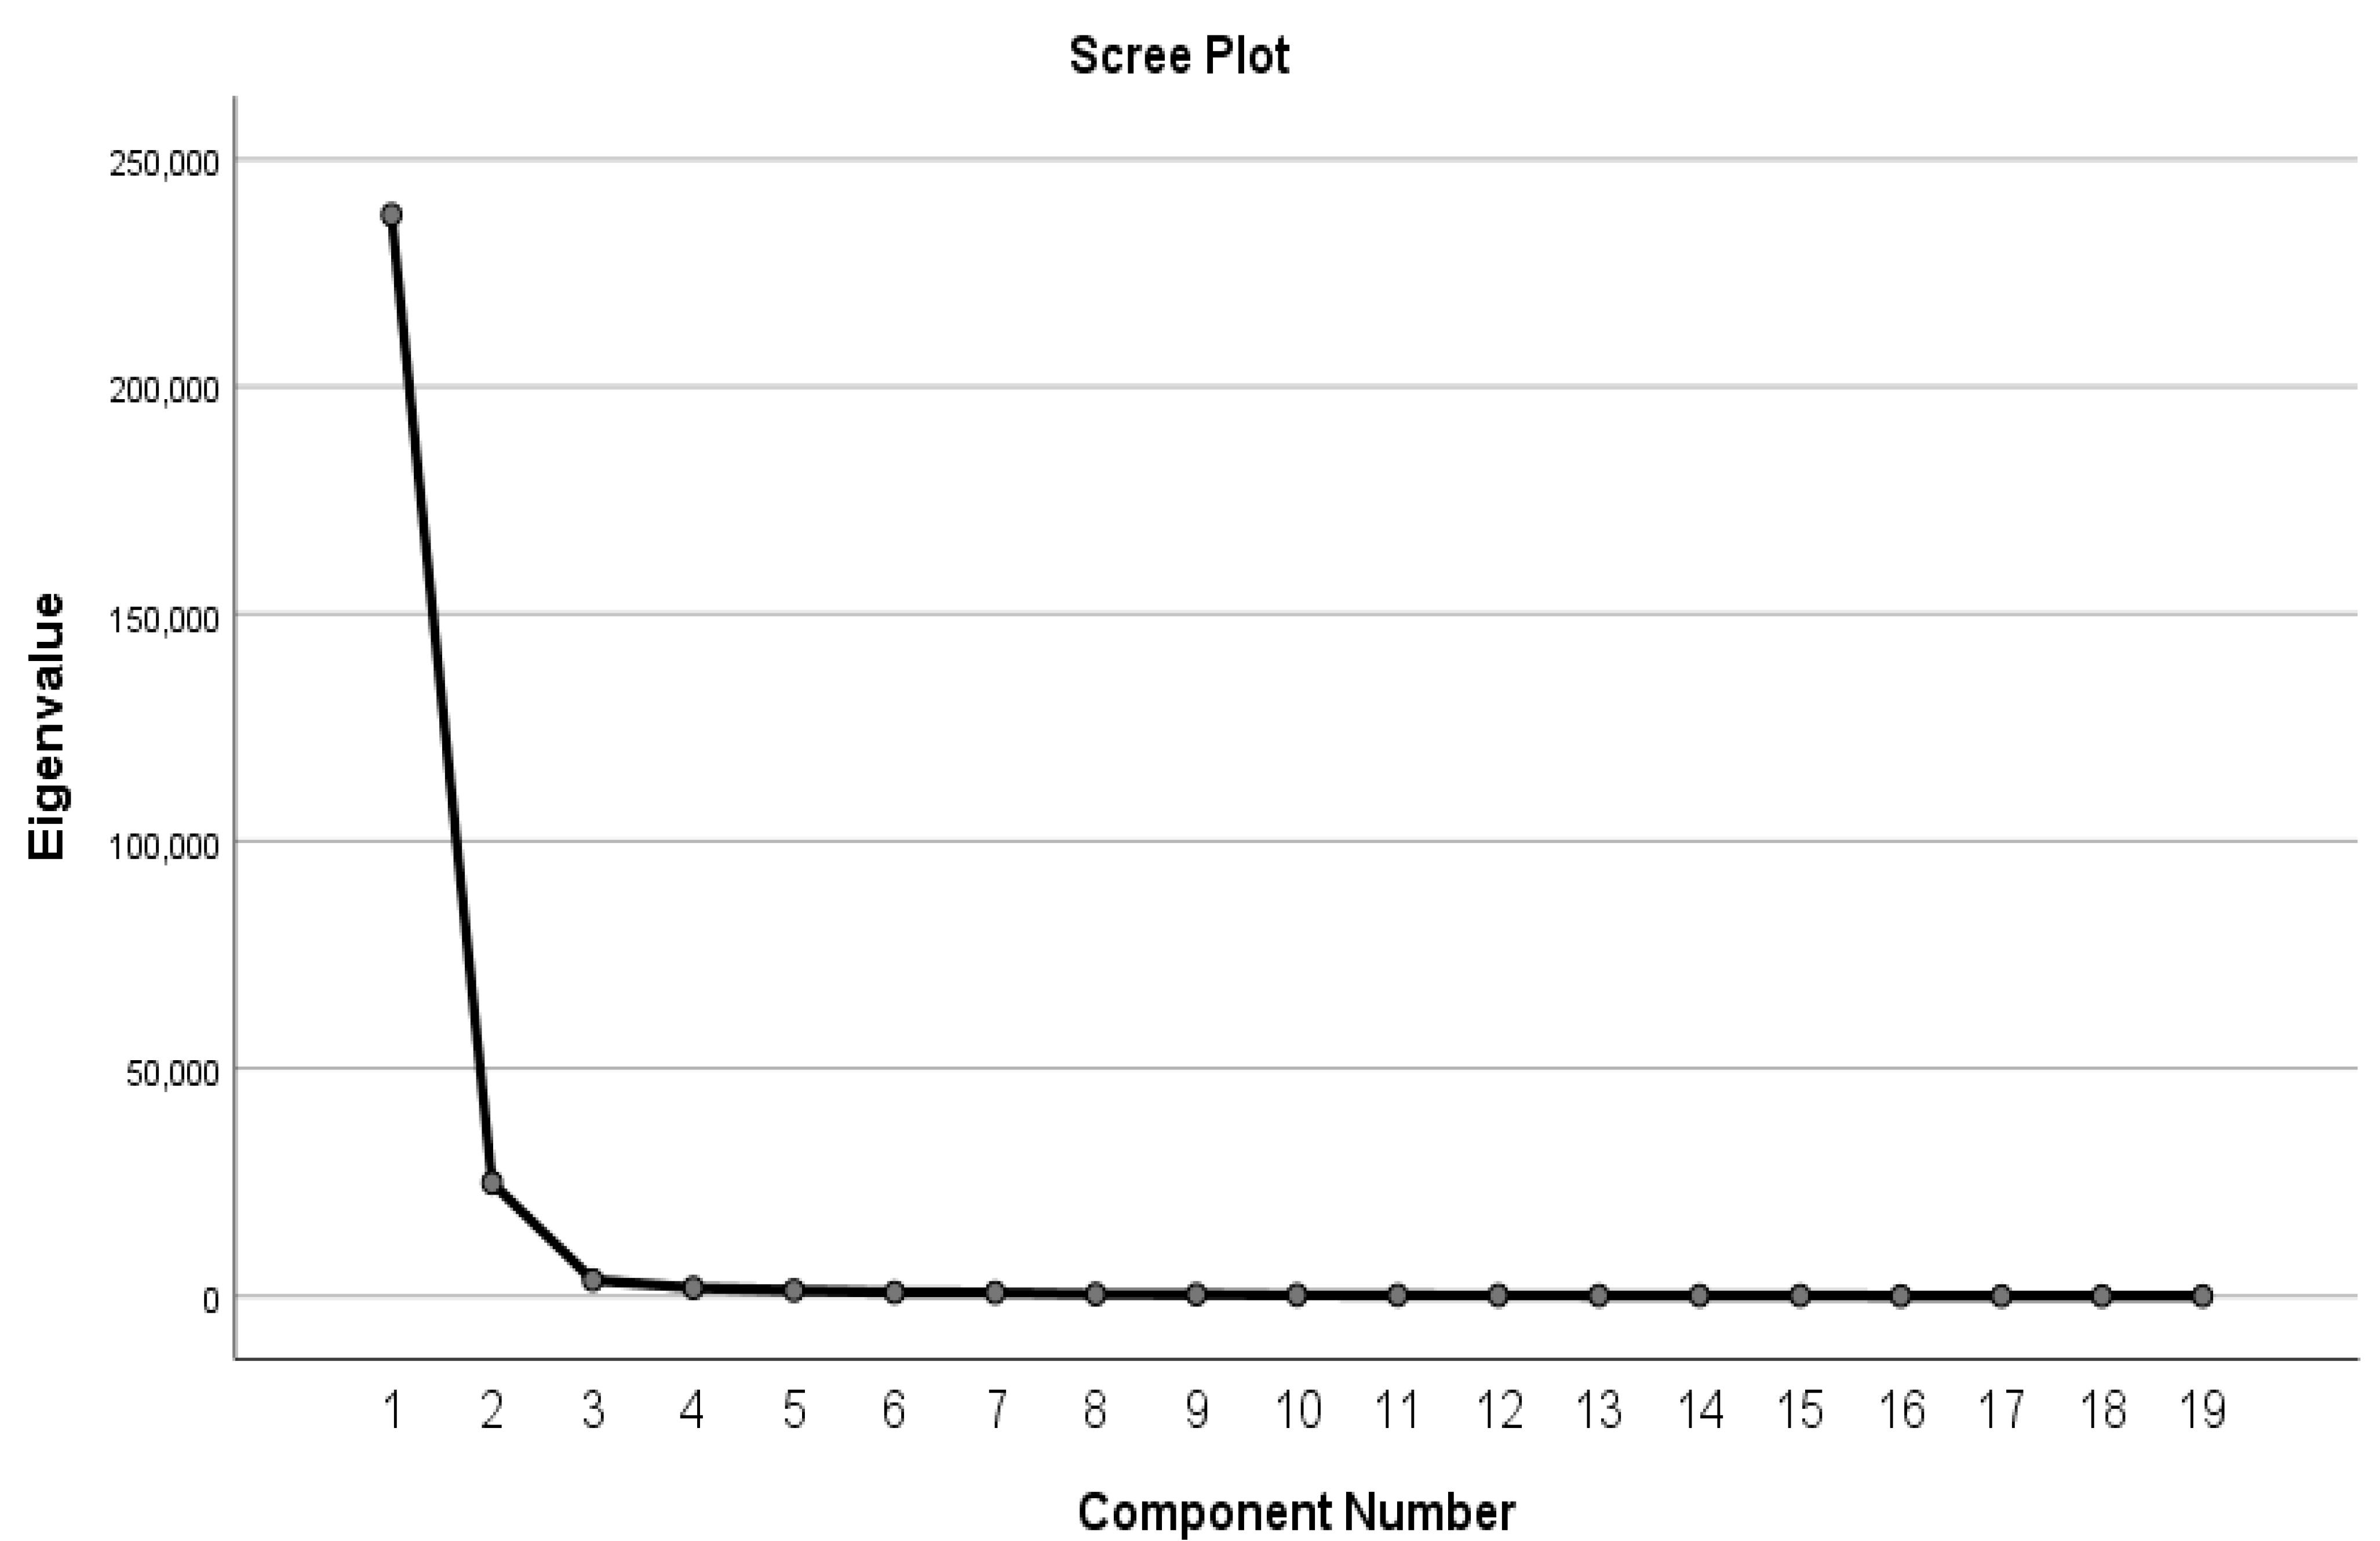
2.3.3. Feature Optimization Using Principal Component Analysis

We divided the entire dataset between 70% for constructing the binary classifier and 30% for validating the classifier. Table 3 shows the result of exploratory factor analysis (EFA) used to reduce the dimensions of observed variables, i.e., the total 49 natural language features. Within the two-dimensional instrument constructed, the first and second dimensions accounted for 42.361% and 36.396% of the total variance in the 70% training dataset, respectively. Figure 1 is the screen plot that visualised that increases in the amount of variance explained by the instrument started to flatten after the second dimension, again suggesting that the optimised dimension number be set at 2.
Table 4 exhibits the rotated loading (varimax rotation with Kaiser normalisation) of the observed variables on the first two large dimensions. The first dimension or component of the instrument encompassed 9 structural features and 1 semantic feature (B medicine/health terms). Seven variables had medium effect sizes (Hedges’g 0.5–0.8), which included: number of unique words (Hedges’g = 0.601, CLES = 0.665), overused words (Hedges’g = 0.548, CLES = 0.651), number of long (6+ characters) words (Hedges’g = 0.647, CLES = 0.676), number of difficult sentences (more than 22 words) (Hedges’g = 0.643, CLES = 0.675), passive voice (Hedges’g = 0.549, CLES = 0.651), medicine/health B (Hedges’g = 0.76, CLES = 0.704), and out of dictionary Z99 (Hedges’g = 0.669, CLES = 0.682). Four variables of large effect size (Hedges’g > 0.8) included: wordy items (Hedges’ g = 1.002, CLES = 0.761), number of complex (3+ syllable) words (Hedges’g = 0.879, CLES = 0.733), number of unique 3+ syllable words (Hedges’g = 0.97, CLES = 0.775), and number of unique long words (Hedges’g = 0.763, CLES = 0.729). The first dimension of variables summarised 10 variables measuring the morphological, lexical, syntactic complexity of mental healthcare resources, whereas the second dimension highlighted 9 out of the original 22 semantic variables, which were correlated with each other in the distribution in the 70% training data.

3. Results

After exploratory factor analysis on the 70% training data, we validated the logistic regression model on the remaining 30% dataset and compared the performance of the optimised binary classifier with that of popular readability tools and binary classifiers with original variables. The 4 binary classifiers were based on semantic variables (22), structural variables (27), both semantic and structural features (49), and the optimised variables (19) through exploratory factor analysis. Table 5 shows the paired-sample Wilcoxon signed-rank test, which assessed whether the difference between the AUC of each classifier or readability tool and the reference 0.5 was statistically significant or not. A p smaller than 0.05 was considered statistically significant. It shows the AUC of readability tools and binary classifiers using different variables was statistically higher than the reference AUC.
Table 6 shows the paired-sample t-test of the AUC of readability formula and binary classifiers using different variables, with the adjusted Bonferroni significance at 0.00179. p-values smaller than 0.00179 were considered statistically significant. It shows that among the 4 readability formula, Gunning Fog Index (AUC = 0.893) and Flesch Reading Index (p = 0.882) were the two top classifiers and the differences in their AUC was statistically insignificant (p = 0.009852 > 0.00179). Among the four binary classifiers, the two top classifiers were the one using all variables (49), including semantic and structural (AUC = 0.872) and the one based on optimised variables (19 variables) (AUC = 0.863), and the difference between the two was statistically insignificant (p = 0.2292). The AUC of Gunning Fog Index was statistically higher than the binary classifier using 49 variables (p = 0.000168) and the optimised binary classifier using 19 variables (p = 0.000462). The AUC of the Flesch Reading Ease Index was statistically similar to that of the binary classifier using 49 variables (p = 0.02513) and the optimised binary classifier using 19 variables (p = 0.1837).
Table 7 shows that despite the sensitivity and specificity pairs of the 2 top readability formula-based classifiers: Gunning Fog Index and the Flesch Reading Ease Index. It shows that under the different thresholds, sensitivity increases as specificity decreases. Table 8 shows the sensitivity and specificity of 4 binary classifiers using natural language features as variables. When setting the specificity at 0.85, the binary classifier with all variables (49) had the highest sensitivity (0.907), followed by the optimised classifier (19) using exploratory factor analysis (0.890), Gunning Fog (0.769), and Flesch Reading Ease (0.729). As a result, the two binary classifiers had achieved better sensitivity and specificity when compared to the readability formula-based classifiers, which had much lower specificity.
Table 9 shows the paired-sample t-test of differences in sensitivity between 4 binary classifiers using natural language features as independent variables. p-values are statistically significant when smaller than the Bonferroni correction (adjusted alpha = 0.00833). It shows that sensitivity of the classifier using both semantic and structural features (49) as variables achieved statistically higher than that of the binary classifier using either semantic (22) (p = 0.000) or structural features (27) (p = 0.0010). Similarly, the sensitivity of the binary classifier using optimised features (factor analysis) (19) was statistically higher than that of the binary classifier using either semantic (p = 0.000) or structural features (p = 0.0020). The difference in sensitivity between the binary classifier using full variable set (49) and the optimised classifier (19) was statistically insignificant (p = 0.0398 > 0.00833).
Table 10 shows the paired-sample t-test of differences in specificity between 4 binary classifiers. It shows that the specificity of the classifier using full variables (49) was statistically higher than that of the classifier based on structural variables (27) (p = 0.001) but statistically similar to that of the classifier based on semantic variables (22) (p = 0.011 > 0.00833). The specificity of the optimised classifier was statistically higher than that of the classifier using structural variables (27) (p = 0.002) and the classifier using semantic variables (22) (p = 0.001). Differences in specificity between the full-variable classifier and the optimised classifier were statistically insignificant (p = 0.687). These findings suggest that the optimised classifier using as few as 19 semantic-structural variables was the best-performing classifier.

4. Discussions

Improving the quality and usability of current mental healthcare necessitates the development of highly actionable and better-targeted resources for people with different mental disorders or at high risks of developing mental diseases. This requires a more personalised and patient-centred approach to mental health information evaluation. The increasing amount of high-quality mental health information on the internet provides valuable first-hand materials to develop new quantitative evaluation tools and systems. Our study has made a useful attempt in this direction. In the development of automatic tools for the evaluation of mental health information actionability, we found that semantic features had an important role in actionability on mental health resources. For example, there were three semantic categories in which the mean of patient-specific mental healthcare information was statistically higher than that of generic mental health information: arts and cultures (C) (mean_GEN = 33.909, mean_ PAS = 16.810, p = 0.000); locations (M) (mean_GEN = 33.909, mean_ PAS = 16.810, p = 0.000), and speech acts (Q) (mean_GEN = 33.909, mean_ PAS = 16.810, p = 0.000). These contrast findings suggested that generic information was richer and more varied compared to patient-specific mental healthcare information. Discussions in generic mental healthcare covered a broad range of risk factors causing mental disorders the public, such as social and political circumstances (G, S), environmental stressors (W), household and living environments (H), employment (I), nutrition (F), individual attributes (E), physical activities (K), science, technology, and medicine (B, Y), and education (P). The wide range of topics in general mental healthcare information, despite being more informative than patient-specific mental healthcare resources, could significantly reduce the actionability of the health information. By contrast, patient-specific mental healthcare information had stronger focuses on more concrete and tangible approaches to mental healthcare such as artistic and creative activities, as typical words in the semantic category C were artwork, caricature, carvings, crochet, D.I.Y. graphics, knit, paintbrush, photos, and paintings. Patient-specific mental health information also had a statistically higher (p = 0.045) use of speech acts expressions such as address, (have) conversation (about your mental health), tell (their stories), (your) point of contact, question, speak (with your communities), (peer) mentoring (programmes), talk (about your mental health openly), ask (what happened?), and talk (with a friend in need).
In our study, since most structural-semantic features had statistically significant differences (p = 0.000) in the two sets of mental healthcare information, we computed the adjusted effect size Hedges’g (for 2 independent samples of non-equal sizes) and common language effect sizes (CLES) measures. The general rules of thumb described by Cohen suggest that an effect size of 0.2 represents a “small” effect, an effect size of 0.5 represents a “medium” effect, and an effect size of 0.8 represents a “large” effect. CLES ranges between 0 and 1 and has a positive correlation with effect sizes. We found that an important shared property of structural features, which were retained in the variable reduction process, were those with medium or large effect sizes, suggesting that effect sizes can be a useful indicator of whether a certain observed variable is suitable to discriminate binary-dependent variables. Specifically, structural-semantic variables that had medium effect (Hedges’g 0.5–0.8) and eventually included in the optimised classifier included medical jargon (Hedges’ g = 0.585, CLES = 0.661), number of unique words (Hedges’g = 0.601, CLES = 0.665), overused words (Hedges’g = 0.548, CLES = 0.651), number of long (6+ characters) words (Hedges’g = 0.647, CLES = 0.676), number of difficult sentences (more than 22 words) (Hedges’g = 0.643, CLES = 0.675), passive voice (Hedges’g = 0.549, CLES = 0.651), Medicine/Health (B) (Hedges’g = 0.76, CLES = 0.704), Out of Dictionary (Z99) (Hedges’g = 0.669, CLES = 0.682). Variables of a large effect size (Hedges’g > 0.8) and included in the optimised classifier were wordy items (Hedges’ g = 1.002, CLES = 0.761), number of complex (3+ syllable) words (Hedges’g = 0.879, CLES = 0.733), number of unique 3+ syllable words (Hedges’g = 0.97, CLES = 0.775), and number of unique long words (Hedges’g = 0.763, CLES = 0.729). The linguistic meanings and the varying discriminating functionality of these structural and semantic features as measured by their statistical significance (p < 0.05) and effect sizes (Hedges’g > 0.5) were used to develop automatic binary classifiers to assess the actionability of mental healthcare information.
Study Limitation: Mental health is highly complex. Patients with different demographic profiles and mental disorders need well-designed resources to better support them. In our study, we divided mental health information into patient-oriented and generic mental health information. However, within patient-oriented health information, our newly developed quantitative tool could not assess whether a certain piece of mental health information is more suitable for a particular social group, such as young people, elderly people or adults, men, or women. There is space to develop evaluation tools to support health information assessment for specific populations.
Future Work: Increasing the actionability of mental health information for needed populations can significantly improve the quality of current mental health services in both developed and developing countries. To achieve this goal, the development of quantitative and machine learning-based evaluation tools and instruments will provide healthcare providers with much-needed resources. In our study, we made a useful attempt towards this goal. In future work, we aim to enrich the contents of the classifiers by testing different sets of language features such as sentiment features [34,35]. We also aim to test our methods with mental health resources in languages other than English to help better support mental health organizations working with multicultural, multilingual populations. These useful tools, such as the one we developed, do not assume any prior knowledge of the patients’ languages, which could effectively close the language gap between patients and health professionals supporting them.

5. Conclusions

Our study developed a quantitative instrument to assist with the automatic evaluation of the actionability of mental healthcare information. By combining the insights of linguistics and statistical analyses, we effectively increased the interpretability and the diagnostic utility of the binary classifiers to guide the development and evaluation of the actionability and usability of mental healthcare information.

Author Contributions

M.J. was responsible for research conceptualisation, data interpretation and writing; W.X. responsible for formal analysis and development of machine learning models; X.Q. and R.H. responsible for data curation and collection. All authors have read and agreed to the published version of the manuscript.

Funding

This research received no external funding.

Institutional Review Board Statement

Not applicable.

Informed Consent Statement

Not applicable.

Data Availability Statement

The raw data supporting the conclusions of this article will be made available by the authors, without undue reservation.

Conflicts of Interest

The authors declare no conflict of interest.

References

  1. Lipari, M.; Berlie, H.; Saleh, Y.; Hang, P.; Moser, L. Understandability, actionability, and readability of online patient education materials about diabetes mellitus. Am. J. Health Syst. Pharm. 2019, 76, 182–186. [Google Scholar] [CrossRef] [PubMed]
  2. Mac, O.A.; Thayre, A.; Tan, S.; Dodd, R.H. Web-based health information following the renewal of the cervical screening program in Australia: Evaluation of readability, understandability, and credibility. J. Med. Internet Res. 2020, 22, e16701. [Google Scholar] [CrossRef] [PubMed]
  3. Caballero, A.; Leath, K.; Watson, J. COVID-19 consumer health information needs improvement to be readable and actionable by high-risk populations. Front. Commun. 2020, 5, 56. [Google Scholar] [CrossRef]
  4. Leung, J.-Y.; Ni Riordain, R.; Porter, S. Readability and quality of online information regarding dental treatment for patients with ischaemic heart disease. Br. Dent. J. 2020, 228, 609–614. [Google Scholar] [CrossRef] [PubMed]
  5. Murphy, J.; Vaughn, J.; Gelber, K.; Geller, A.; Zakowski, M. Readability, content, quality and accuracy assessment of internet-based patient education materials relating to labor analgesia. Int. J. Obstet. Anesth. 2019, 39, 82–87. [Google Scholar] [CrossRef]
  6. Mc Laughlin, G.H. SMOG grading-a new readability formula. J. Read. 1969, 12, 639–646. [Google Scholar]
  7. Coleman, M.; Liau, T.L. A computer readability formula designed for machine scoring. J. Appl. Psychol. 1975, 60, 283–284. [Google Scholar] [CrossRef]
  8. Klare, G.R.; Rowe, P.P.; John, M.G.S.; Stolurow, L.M. Automation of the Flesch reading ease readability formula, with various options. Read. Res. Q. 1969, 4, 550–559. [Google Scholar] [CrossRef]
  9. Philip, P.G.; Karen, S. FOGINDEX: A readability formula program for microcomputers. J. Read. 1985, 28, 614–618. [Google Scholar]
  10. Edward, F. A readability formula that saves time. J. Read. 1968, 11, 513–578. [Google Scholar]
  11. Martínez, P.; Martínez, J.L.; Segura-Bedmar, I.; Moreno-Schneider, J.; Luna, A.; Revert, R. Turning user generated health-related content into actionable knowledge through text analytics services. Comput. Ind. 2016, 78, 43–56. [Google Scholar] [CrossRef]
  12. Baur, C. Calling the nation to act: Implementing the national action plan to improve health literacy. Nurs. Outlook 2011, 59, 63–69. [Google Scholar] [CrossRef]
  13. Robinson, M.; Robertson, S. Health information needs of men. Health Educ. J. 2014, 73, 150–158. [Google Scholar] [CrossRef]
  14. Schardt, C. Health information literacy meets evidence-based practice. J. Med. Libr. Assoc. 2011, 99, 1–2. [Google Scholar] [CrossRef] [Green Version]
  15. Ivanitskaya, L.; O’Boyle, I.; Casey, A.M. Health information literacy and competencies of information age students: Results from the interactive online Research Readiness Self-Assessment (RRSA). J. Med. Internet Res. 2006, 8, e6. [Google Scholar] [CrossRef] [PubMed]
  16. Helitzer, D.; Hollis, C.; Cotner, J.; Oestreicher, N. Health literacy demands of written health information materials: An assessment of cervical cancer prevention materials. Cancer Control 2009, 16, 70–78. [Google Scholar] [CrossRef] [Green Version]
  17. Giuse, N.B.; Koonce, T.Y.; Storrow, A.B.; Kusnoor, S.V.; Ye, F. Using health literacy and learning style preferences to optimize the delivery of health information. J. Health Commun. 2012, 17 (Suppl. S3), 122–140. [Google Scholar] [CrossRef]
  18. Kirby, P.L.; Reynolds, K.A.; Walker, J.R.; Furer, P.; Pryor, T.A.M. Evaluating the quality of perinatal anxiety information available online. Arch. Womens Ment. Health 2018, 21, 813–820. [Google Scholar] [CrossRef] [PubMed]
  19. Ferreira-Lay, P.; Miller, S. The quality of internet information on depression for lay people. Psychiatrist 2008, 32, 170–173. [Google Scholar] [CrossRef] [Green Version]
  20. Shoemaker, S.J.; Wolf, M.S.; Brach, C. Development of the patient education materials assessment tool (PEMAT): A new measure of understandability and actionability for print and audiovisual patient information. Patient Educ. Couns. 2014, 96, 395–403. [Google Scholar] [CrossRef] [PubMed] [Green Version]
  21. Vishnevetsky, J.; Walters, C.B.; Tan, K.S. Interrater reliability of the patient education materials assessment Tool (PEMAT). Patient Educ. Couns. 2018, 101, 490–496. [Google Scholar] [CrossRef]
  22. Carey, T.A. Beyond patient-centered care: Enhancing the patient experience in mental health services through patient-perspective care. Patient Exp. J. 2016, 3, 8. Available online: https://pxjournal.org/journal/vol3/iss2/8 (accessed on 1 August 2021). [CrossRef]
  23. Johnston, J.N.; Ridgway, L.; Cary-Barnard, S.; Allen, J.; Sanchez-Lafuente, C.L.; Reive, B.; Kalynchuk, L.E.; Caruncho, H.J. Patient oriented research in mental health: Matching laboratory to life and beyond in Canada. Res. Involv. Engagem. 2021, 7, 21. [Google Scholar] [CrossRef]
  24. Schünemann, H.J.; Fretheim, A.; Oxman, A.D. Improving the use of research evidence in guideline development: 10. Integrating values and consumer involvement. Health Res. Policy Syst. 2006, 4, 22. Available online: https://pubmed.ncbi.nlm.nih.gov/17147811 (accessed on 1 August 2021). [CrossRef]
  25. Korp, P. Health on the Internet: Implications for health promotion. Health Educ. Res. 2006, 21, 78–86. [Google Scholar] [CrossRef] [PubMed]
  26. Prabhu, A.V.; Gupta, R.; Kim, C.; Kashkoush, A.; Hansberry, D.R.; Agarwal, N.; Koch, E. Patient education materials in dermatology: Addressing the health literacy needs of patients. JAMA Dermatol. 2016, 152, 946–947. [Google Scholar] [CrossRef] [PubMed] [Green Version]
  27. Kasabwala, K.; Agarwal, N.; Hansberry, D.R.; Baredes, S.; Eloy, J.A. Readability Assessment of Patient Education Materials from the American Academy of Otolaryngology—Head and Neck Surgery Foundation. Otolaryngol.—Head Neck Surg. 2012, 147, 466–471. [Google Scholar] [CrossRef]
  28. Rayson, P.; Archer, D.; Piao, S.; McEnery, A.M. The UCREL semantic analysis system. In Proceedings of the Beyond Named Entity Recognition Semantic Labeling for NLP Tasks Workshop, Lisbon, Portugal, 25 May 2004. [Google Scholar]
  29. McIntyre, D.; Archer, D. A corpus-based approach to mind style. J. Lit. Semant. 2010, 39, 167–182. [Google Scholar] [CrossRef]
  30. Piao, S.S.; Rayson, P.; Archer, D.; McEnery, T. Comparing and combining a semantic tagger and a statistical tool for MWE extraction. Comput. Speech Lang. 2005, 19, 378–397. [Google Scholar] [CrossRef]
  31. Bolton, K.; Graddol, D.; Mesthrie, R. Tom McArthur’s english today. Engl. Today 2009, 25, 3–8. [Google Scholar] [CrossRef]
  32. Archer, D.; Rayson, P.; Piao, S.; McEnery, A. Comparing the UCREL semantic annotation scheme with lexicographical taxonomies. In Proceedings of the EURALEX-2004 Conference, Lorient, France, 6–10 July 2004. [Google Scholar]
  33. Chang, J.J.S.; Chen, J.-N.; Sheng, H.-H.; Ker, S.-J. Combining Machine Readable Lexical Resources and Bilingual Corpora for Broad Word Sense Disambiguation. In Proceedings of the 2nd Conferences of the Association for Machine Translation in the Americas, Montreal, QC, Canada, 2–5 October 1996. [Google Scholar]
  34. Roccetti, M.; Marfia, G.; Salomoni, P.; Prandi, C.; Zagari, R.M.; Kengni, F.L.G.; Bazzoli, F.; Montagnani, M. Attitudes of Crohn’s disease patients: Infodemiology case study and sentiment analysis of facebook and twitter posts. JMIR Public Health Surveill. 2017, 3, e51. [Google Scholar] [CrossRef] [PubMed]
  35. D’Souza, R.S.; Hooten, W.M.; Murad, M.H. A Proposed Approach for Conducting Studies that Use Data From Social Media Platforms. Mayo Clin. Proc. 2021, 96, 2218–2229. [Google Scholar] [CrossRef] [PubMed]
Figure 1. Factor Analysis Scree Plot.
Ijerph 18 10743 g001
Table 1. Mann–Whitney U test, Effect Sizes (dCoheN) and Common language effect sizes (CLES) of structural features (TOF).
Structural Language Features (TOF)PASGENMann–Whitney UdCohenCLES
MeanStd.
Deviation
MeanStd.
Deviation
ZPgHedges95% C.I
Readability Measurements
Flesch Reading Ease66.7412.2746.7111.92−27.940.000−1.659−1.766, −1.5510.880
FORCAST9.940.9311.300.82−26.7050.0001.5621.456, 1.6680.865
Gunning Fog Index9.021.9312.462.03−28.7080.0001.7321.623, 1.8410.890
SMOG Index10.121.6012.501.50−26.7100.0001.5401.435, 1.6460.862
Lexical Complexity
Medical jargons5.147.8411.2512.12−15.4900.0000.5850.49, 0.680.661
Number of unique words329.19148.56426.45171.48−13.3740.0000.6010.506, 0.6970.665
Repeated words0.020.160.020.14−0.3420.7320.000−0.093, 0.0930.500
Article mismatches0.030.390.030.19−2.2780.0230.000−0.093, 0.0930.500
Redundant phrases0.150.440.160.59−0.0680.9450.019−0.074, 0.1120.505
Overused words9.9711.0316.4912.56−15.7940.0000.5480.453, 0.6420.651
Wordy items18.4117.8242.2427.64−22.9410.0001.0020.903, 1.1010.761
Cliché0.120.420.120.40−0.4050.6850.000−0.093, 0.0930.500
Number of proper nouns16.7427.3726.0527.88−11.9900.0000.3370.243, 0.430.594
Number of numerals6.0512.226.7012.07−8.5930.0000.054−0.039, 0.1470.515
Morphological Complexity
Average number of characters4.640.355.160.32−27.1390.0001.5581.452, 1.6640.865
Average number of syllables1.500.141.730.14−27.3290.0001.6431.536, 1.750.877
Number of monosyllabic words620.35419.24660.40382.71−3.8520.0000.1000.007, 0.1930.528
Number of unique monosyllabic words157.8656.43162.4058.75−1.6880.0910.079−0.014, 0.1720.522
Number of complex (3+ syllable) words114.6896.87218.95133.45−20.7940.0000.8790.782, 0.9770.733
Number of unique 3+ syllable words67.8146.31127.2061.92−22.5130.0001.0700.97, 1.1690.775
Number of long (6+ characters) words283.58210.03434.95251.32−16.1230.0000.6470.552, 0.7430.676
Number of unique long words157.5890.18245.87111.59−18.6290.0000.8600.763, 0.9570.729
Syntactic Complexity
Average number of sentences per paragraph2.588.091.540.36−7.6470.000−0.193−0.286, −0.0990.554
Number of difficult sentences (more than 22 words)8.687.8814.6910.37−14.8470.0000.6430.548, 0.7380.675
Average sentence length12.732.8213.802.93−8.2810.0000.3710.278, 0.4650.604
Passive voice2.793.855.224.84−15.2800.0000.5490.454, 0.6440.651
Sentences that begin with conjunctions1.642.671.111.88−4.8170.000−0.234−0.327, −0.1410.566
Number of interrogative sentences (questions)4.304.702.814.46−10.0050.000−0.326−0.42, −0.2330.591
Number of exclamatory sentences1.353.350.080.40−15.7090.000−0.564−0.658, −0.4690.655
Table 2. Mann–Whitney U test, Effect Sizes (dCoheN) and CLES of semantic features (SOF).
Semantic
Language Features (SOF)
PASGENMann–Whitney UdCohenCLES
MeanStd.
Deviation
MeanStd.
Deviation
ZPgHedges95% C.I
A
General/abstract terms
192.704136.215236.460137.767−8.9860.0000.3190.226, 0.4130.589
B
Medicine/Health
36.17048.76683.12270.517−20.3410.0000.760.663, 0.8560.704
C
Arts and Culture
1.0862.1770.8341.892−2.3200.020−0.125−0.218, −0.0310.535
E
Emotion
27.78924.82640.55931.436−10.5170.0000.4450.351, 0.5390.624
F
Food
6.58317.4418.79422.006−2.9000.0040.110.017, 0.2030.531
G
Government
3.3136.2113.4216.271−2.9860.0030.017−0.076, 0.110.505
H
Dwelling
3.0714.7973.4795.305−4.0730.0000.08−0.013, 0.1730.523
I
Employment
8.12117.7099.36313.094−8.1080.0000.081−0.012, 0.1740.523
K
Sports
4.1766.5934.9007.616−3.1120.0020.1010.008, 0.1940.528
L
Living Things
4.3896.4085.7119.871−5.9670.0000.1550.062, 0.2480.544
M
Locations
26.35920.49624.88919.908−2.1360.033−0.073−0.166, 0.020.521
N
Measurements
44.08933.88562.39641.667−12.0430.0000.4770.382, 0.5710.632
O
General substances
13.13812.47516.96017.421−5.9550.0000.2480.155, 0.3410.57
P
Education
4.29010.2624.6148.682−4.6740.0000.034−0.059, 0.1270.51
Q
Speech Acts
28.16825.28824.31018.601−2.0070.045−0.177−0.27, −0.0840.55
S
Social Actions
72.78159.73773.06252.393−2.2200.0260.005−0.088, 0.0980.501
T
Time
34.45328.92637.98528.055−4.3120.0000.1240.031, 0.2170.535
W
Environment
1.2683.3271.8794.366−6.0580.0000.1550.062, 0.2480.544
X
Psychology
62.99943.38367.29445.263−2.3350.0200.0970.004, 0.190.527
Y
Science/Tech
2.5906.0862.6904.975−3.3170.0010.018−0.075, 0.1110.505
Z
Names/Grammar
359.010247.561389.823222.817−4.9700.0000.1320.039, 0.2250.537
Z99
Out of Dictionary
16.81017.38333.90930.551−16.8180.0000.6690.574, 0.7650.682
Table 3. Factor Analysis—Total Variance Explained.
ComponentInitial Eigenvalues Extraction Sums of Squared LoadingsRotation Sums of Squared Loadings
Total% of
Variance
Cumulative %Total% of
Variance
Cumulative %Total% of
Variance
Cumulative %
1237,794.14487.16587.16513.06068.73668.7368.04942.36142.361
224,898.1239.12796.2911.90410.02278.7586.91536.39778.758
Table 4. Factor Analysis—Rotated component loadings of variables.
VariablesComponent
12
Number of complex (3+ syllable) words0.9220.331
Number of unique 3+ syllable words0.9100.332
Number of long (6+ characters) words0.8820.459
Number of unique long words0.8800.433
Wordy items0.8250.304
Number of unique words0.8150.519
Overused words (x sentence)0.7560.273
Number of difficult sentences (more than 22 words)0.7130.460
B Medicine/Health0.6860.250
Passive voice0.6630.211
Z Names/Grammar0.4310.901
Z99 Out of Dictionary words0.4650.884
X Psychology0.3510.820
A general/abstract term0.5240.816
Q Speech Acts0.1680.775
M Locations0.1920.756
S Social Actions0.3740.748
T Time0.3630.674
N measurements0.5880.653
Table 5. Area under the receiver operator curve of readability formula and binary classifiers.
Test Result
Variable(s)
AUCStd. Error aAsymptotic Sig. bAsymptotic 95%
Confidence Interval
Lower BoundUpper Bound
Gunning Fog0.8930.0080.0000.8780.908
Flesch Reading Ease0.8820.0080.0000.8660.898
SMOG0.8650.0090.0000.8480.882
FORCAST0.8650.0090.0000.8480.882
Structural Variables Only0.8070.0090.0000.7880.825
Semantic Variables Only0.7850.0100.0000.7660.804
All variables0.8720.0080.0000.8570.888
Logistic Regression0.8630.0080.0000.8470.879
a. Under the nonparametric assumption; b. Null hypothesis: true area = 0.5.
Table 6. Paired-sample t-test of differences in area under the ROC curves.
PairsTest Result Pair(s)AsymptoticAUC DifferenceStd. Error Difference bAsymptotic 95% Confidence Interval
zSig. (2-Tail) aLower BoundUpper Bound
1FORCAST vs. Gunning Fog−4.3310.00001483 **−0.02820.128−0.041−0.015
2FORCAST vs. SMOG−0.0210.98340065−0.00010.132−0.0140.014
3FORCAST vs. Structural Variables8.32000.05870.1340.0450.073
4FORCAST vs. Factor Analysis−0.8650.386964−0.00710.129−0.0230.009
5FORCAST vs. All Variables0.2140.830318320.00190.130−0.0160.020
6FORCAST vs. Flesch Reading Ease−4.6300.00000365 **−0.0170.130−0.024−0.010
7FORCAST vs. Semantic Variables6.9940 **0.08030.1360.0580.103
8Gunning Fog vs. SMOG7.3640 **0.0280.1280.0210.036
9Gunning Fog vs. Structural Variables11.6190 **0.08690.1300.0720.102
10Gunning Fog vs. Factor Analysis2.8440.0004462020.02110.1250.0070.036
11Gunning Fog vs. All Variables3.7620.00016845 **0.03010.1260.0140.046
12Gunning Fog vs. Flesch Reading Ease2.5810.009852790.01120.1260.0030.020
13Gunning Fog vs. Semantic Variables9.6400 **0.10850.1320.0860.131
14SMOG vs. Structural Variables7.7360 **0.05890.1340.0440.074
15SMOG vs. Factor Analysis−0.8660.38625534−0.00690.129−0.0230.009
16SMOG vs. All Variables0.2440.80725720.00210.130−0.0150.019
17SMOG vs. Flesch Reading Ease−3.7500.0001769 **−0.01680.130−0.026−0.008
18SMOG vs. Semantic Variables6.8670 **0.08050.1360.0570.103
19Structural Variables vs. Factor Analysis−7.9640 **−0.06580.132−0.082−0.050
20Structural Variables vs. All Variables−6.4080 **−0.05680.132−0.074−0.039
21Structural Variables vs. Flesch Reading Ease−11.5630 **−0.07570.132−0.089−0.063
22Structural Variables vs. Semantic Variables1.8310.067068090.02160.138−0.0020.045
23Factor Analysis vs. All Variables1.2020.229212970.0090.127−0.0060.024
24Factor Analysis vs. Flesch Reading Ease−1.3300.18366955−0.00990.127−0.0240.005
25Factor Analysis vs. Semantic Variables7.6020 **0.08740.1330.0650.110
26All Variables vs. Flesch Reading Ease−2.2390.02512841−0.01890.128−0.035−0.002
27All Variables vs. Semantic Variables7.3420 **0.07840.1340.0570.099
28Flesch Reading Ease vs. Semantic Variables8.5480 **0.09730.1340.0750.120
a. Null hypothesis: true area difference = 0; b. Under the nonparametric assumption, ** P is significant at the adjusted Bonferroni correction 0.00179.
Table 7. Sensitivity and specificity of the readability formula under different thresholds.
FormulaThresholdsSensitivitySensitivityFormulaThresholdsSensitivitySensitivity
Gunning Fog9.75000.9190.685Flesch Reading Ease37.50000.9060.690
9.85000.9080.70538.50000.8890.713
9.95000.8970.72039.50000.8680.744
10.05000.8930.73940.50000.8510.764
10.15000.8820.75541.50000.8280.788
10.25000.8740.77142.50000.8070.811
10.35000.8620.78543.50000.7790.825
10.45000.8440.79944.50000.7630.845
10.55000.8310.80445.50000.7290.856
10.65000.8210.81546.50000.7000.871
10.75000.8070.82947.50000.6750.879
10.85000.7920.83948.50000.6430.891
10.95000.7690.85111.95000.6440.866
11.05000.7530.86312.05000.6120.881
Table 8. Mean and SD of Sensitivity and Specificity of Binary Classifiers.
VariablesSensitivity Mean (SD)Specificity Mean (SD)
Semantic Variables Only0.795 (0.015)0.762 (0.029)
Structural Features0.843 (0.011)0.776 (0.027)
All variables (49)0.907 (0.012)0.853 (0.034)
Factor Analysis (19)0.890 (0.005)0.860 (0.007)
Table 9. Paired-sample t-test of differences in sensitivity.
PairsVariablesMean
Difference
S.D.95% Confidence Interval of DifferencetSig. (2-Tailed)
LowerUpper
Pair 1Semantic Variables vs.
Structural Variables
−0.04780.0153−0.0668−0.0288−6.97700.0020 **
Pair 2Semantic Variables vs.
Factor Analysis
−0.07440.0134−0.0911−0.0577−12.37300.0000 **
Pair 3Semantic Variables vs.
All Variables
−0.11160.0180−0.1340−0.0892−13.84700.0000 **
Pair 4Structural Variables vs.
Factor Analysis
−0.02660.0085−0.0372−0.0160−6.99500.0020 **
Pair 5Structural Variables
vs.All Variables
−0.06380.0182−0.0864−0.0412−7.84500.0010 **
Pair 6Factor Analysis vs.
All Variables
−0.01700.007−0.0011−0.0329−2.61540.0398
** P significant at adjusted Bonferroni 0.00833.
Table 10. Paired-sample t-test of differences in specificity.
PairsVariablesMean
Difference
S.D.95% Confidence Interval
of Difference
tSig. (2-Tailed)
LowerUpper
Pair 1Semantic Variables vs.
Structural Variables
−0.0140.047−0.0730.045−0.6640.543
Pair 2Semantic Variables vs.
Factor Analysis
−0.0980.028−0.132−0.063−7.8900.001 **
Pair 3Semantic Variables vs.
All Variables
−0.0910.045−0.147−0.035−4.5200.011
Pair 4Structural Variables vs.
Factor Analysis
−0.0840.027−0.117−0.050−6.9270.002 **
Pair 5Structural Variables vs.
All Variables
−0.0770.022−0.104−0.050−7.9150.001 **
Pair 6Factor Analysis vs. All Variables0.0070.034−0.0360.0490.4340.687
** P significant at adjusted Bonferroni 0.00833.
Publisher’s Note: MDPI stays neutral with regard to jurisdictional claims in published maps and institutional affiliations.

