
Biomonitoring of Exposure to Metals in a Population Residing in an Industrial Area in Brazil: A Feasibility Study

 , , , , and
Abstract
:1. Introduction
2. Methods
- (1)
- Recruitment capacity and characteristics of study participants;
- (2)
- Data collection procedures and outcome measurements;
- (3)
- Acceptability and adaptation of study procedures;
- (4)
- Resources and ability to manage and implement the study;
- (5)
- Preliminary evaluation of participants’ responses.
2.1. Human Biomonitoring Study
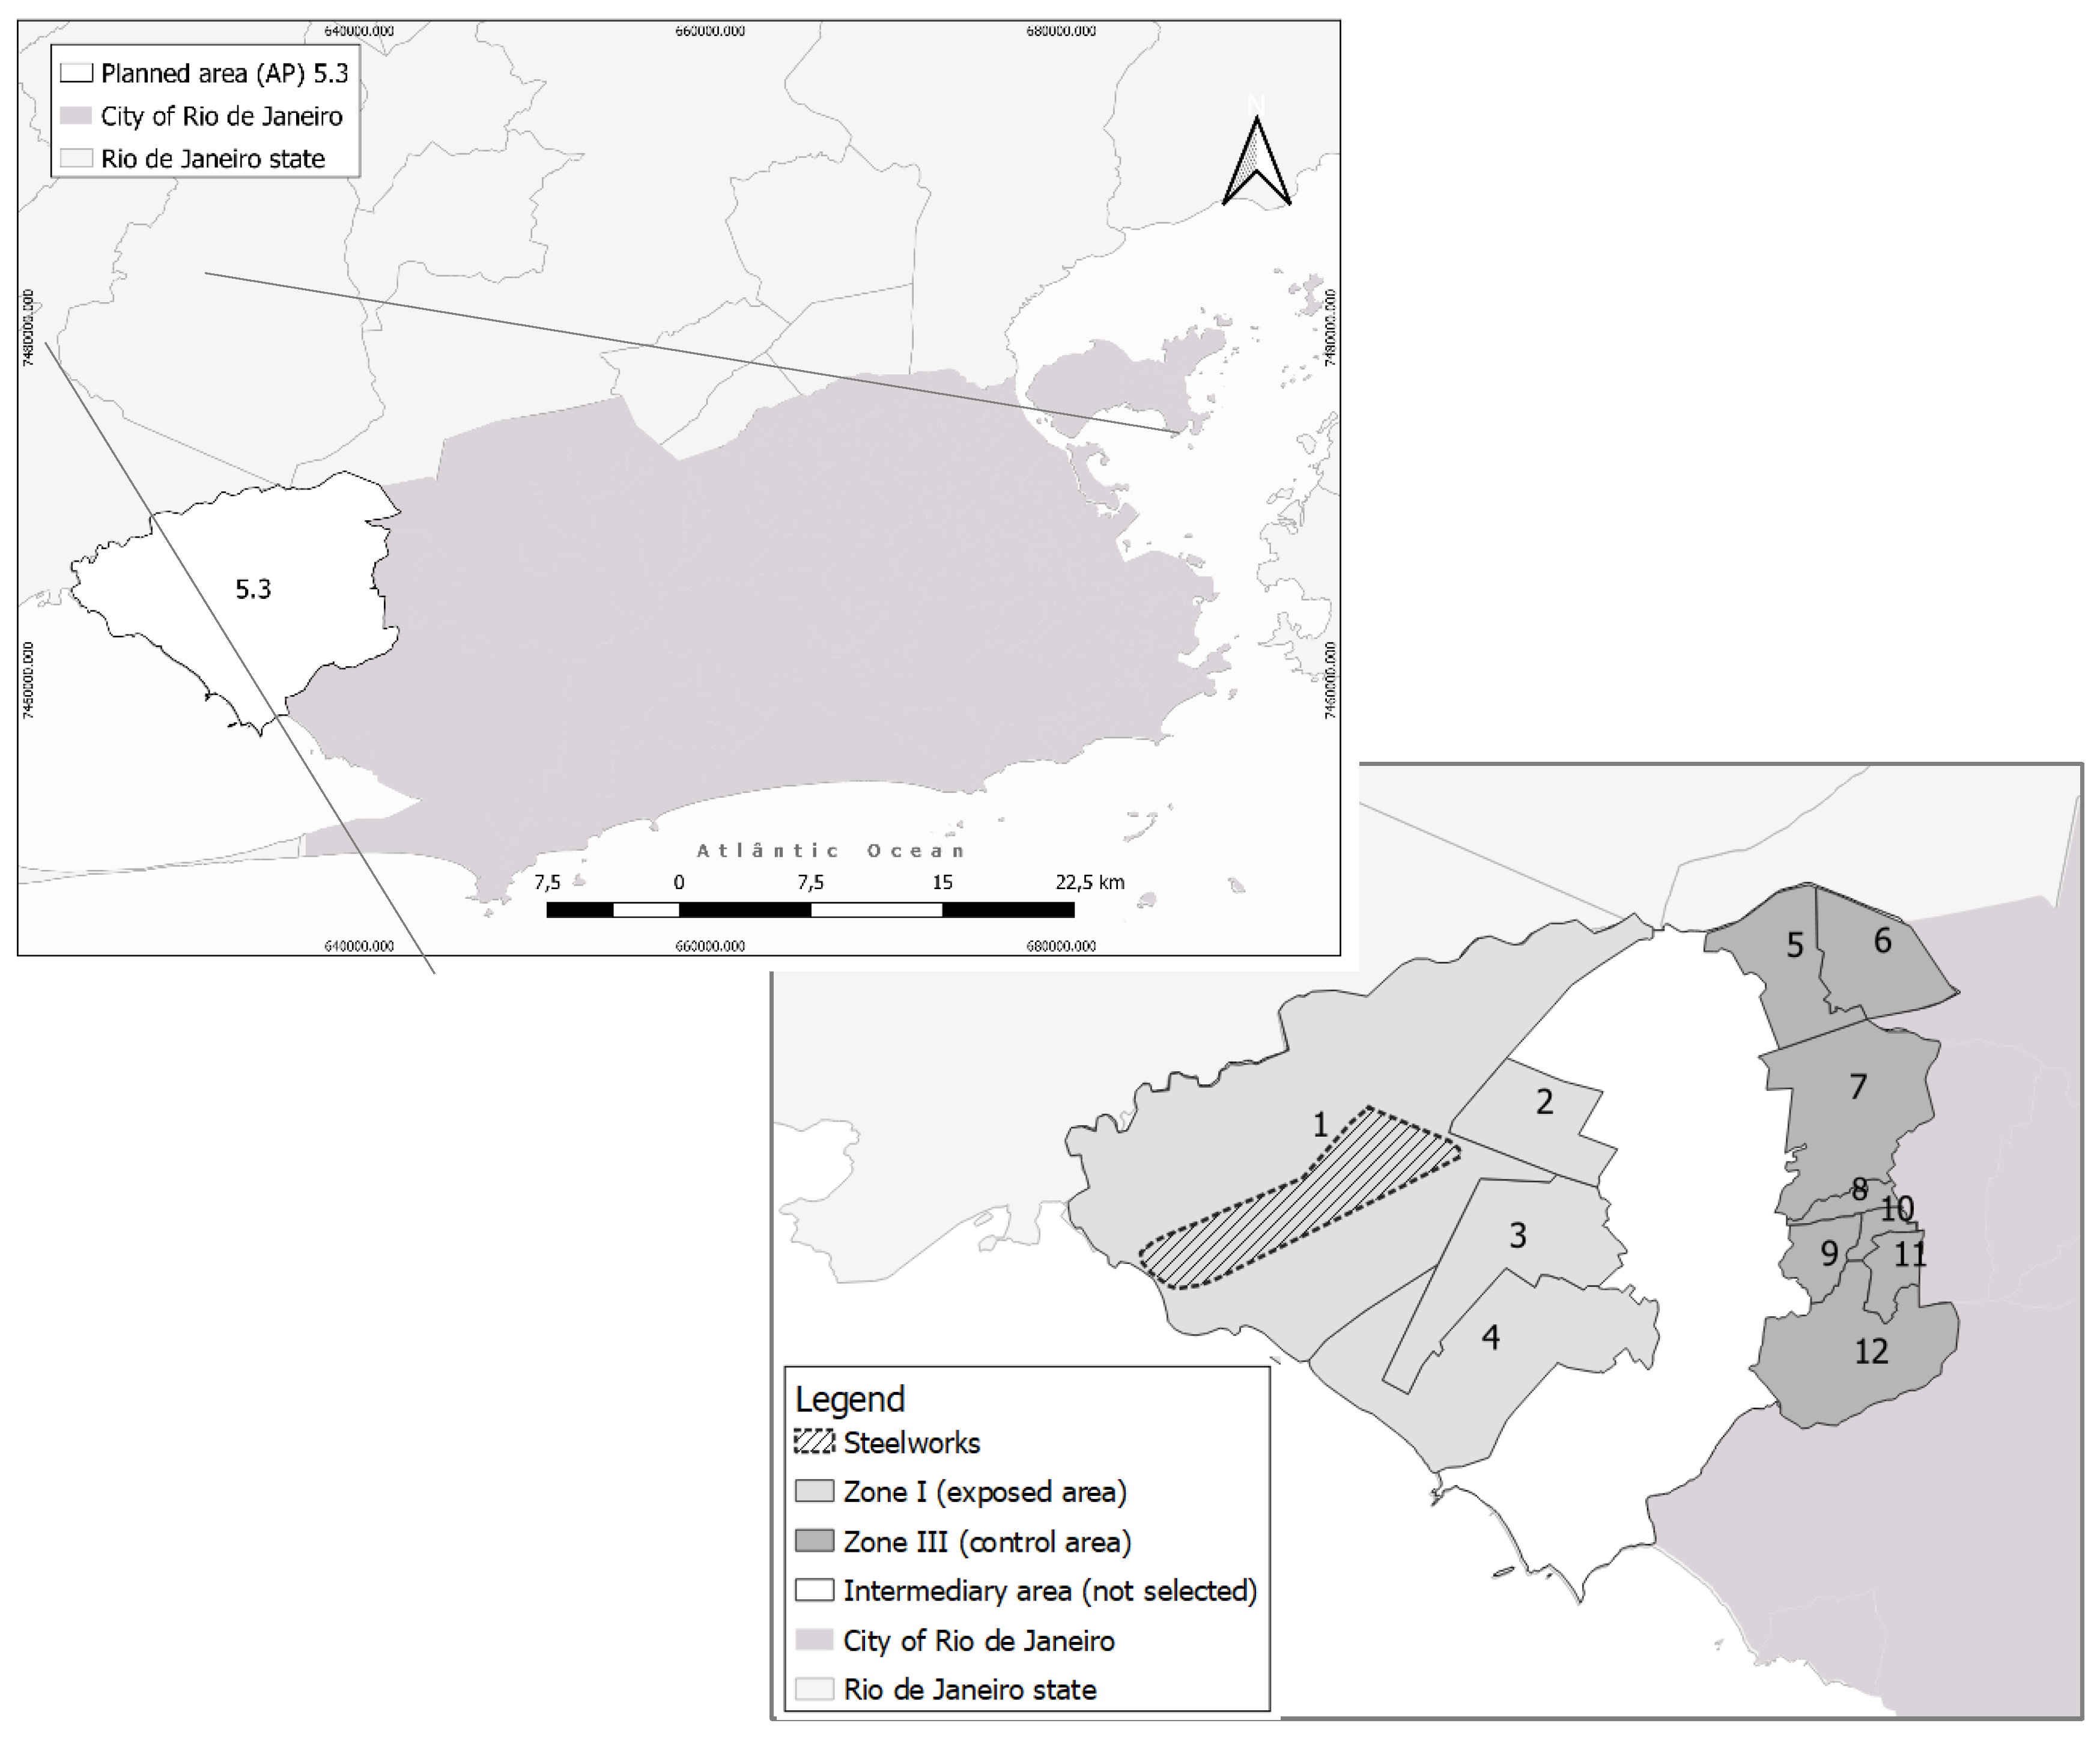
2.1.1. Study Location
2.1.2. Study Population
2.1.3. Population Sampling and Recruitment
2.1.4. Research Questionnaires and Forms
2.1.5. Fieldwork Team Training
2.1.6. Approach at Participants’ Residences and the Health Unit
2.1.7. Blood Collection and Analysis
2.1.8. Supervision of the Fieldwork
2.1.9. Pilot Study and Statistical Analysis
3. Results
3.1. Execution and Adjustments
3.2. Preliminary Results: A Pilot Study
4. Discussion
5. Conclusions
Supplementary Materials
Author Contributions
Funding
Institutional Review Board Statement
Informed Consent Statement
Data Availability Statement
Acknowledgments
Conflicts of Interest
References
- Karagulian, F.; Belis, C.A.; Dora, C.F.C.; Prüss-Ustün, A.M.; Bonjour, S.; Adair-Rohani, H.; Amann, M. Contributions to cities’ ambient particulate matter (PM): A systematic review of local source contributions at global level. Atoms. Environ. 2015, 120, 475–483. [Google Scholar] [CrossRef]
- Das, P.; Mondal, G.C.; Singh, S.; Singh, A.K.; Prasad, B.; Singh, K.K. Effluent Treatment Technologies in the Iron and Steel Industry-A State of the Art Review. Water Environ. Res. Res. Publ. Water Environ. Fed. 2018, 90, 395–408. [Google Scholar] [CrossRef]
- Campos, É.; da Silva, I.F.; Freire, C. Exposição a metais em população adulta residente em áreas industriais: Revisão sistemática da literatura. Cienc. Saude Co. 2019, 26, 2253–2270. [Google Scholar] [CrossRef]
- Chen, Y.; Xu, X.; Zeng, Z.; Lin, X.; Qin, Q.; Huo, X. Blood lead and cadmium levels associated with hematological and hepatic functions in patients from an e-waste-polluted area. Chemosphere 2019, 220, 531–538. [Google Scholar] [CrossRef]
- Chung, S.M.; Moon, J.S.; Yoon, J.S.; Won, K.C.; Lee, H.W. Sex-specific effects of blood cadmium on thyroid hormones and thyroid function status: Korean nationwide cross-sectional study. J. Trace Elem. Med. Biol. 2019, 53, 55–61. [Google Scholar] [CrossRef]
- Sun, X.; Liu, W.; Zhang, B.; Shen, X.; Hu, C.; Chen, X.; Jin, S.; Jiang, Y.; Liu, H.; Cao, Z.; et al. Maternal heavy metal exposure, thyroid hormones, and birth outcomes: A prospective cohort study. J. Clin. Endocrinol. Metab. 2019, 104, 5043–5052. [Google Scholar] [CrossRef] [PubMed]
- CDC. Fourth National Report on Human Exposure to Environmental Chemicals [Internet]. In Atlanta, GA: CDC-Centers for Disease Control and Prevention; Report No.: 4; 2009; p. 519. Available online: http://www.cdc.gov/exposurereport/ (accessed on 8 October 2013).
- IARC. Monographs on the Evaluation of Carcinogenic Risks to Humans [Internet]. 2012. Available online: http://monographs.iarc.fr/ENG/Classification/latest_classif.php (accessed on 19 December 2015).
- Porto, M.F.; Milanez, B. Eixos de desenvolvimento econômico e geração de conflitos socioambientais no Brasil: Desafios para a sustentabilidade e a justiça ambiental. Ciênc. Amp. Saúde Coletiva 2009, 14, 1983–1994. [Google Scholar] [CrossRef]
- CDC. Fourth National Report on Human Exposure to Environmental Chemicals-Updated Tables, January 2019, Volume One [Internet]. Atlanta, GA: CDC-Centers for Disease Control and Prevention; 2019; p. 866. Available online: https://www.cdc.gov/exposurereport/index.html (accessed on 19 December 2015).
- Becker, K.; Müssig-Zufika, M.; Conrad, A.; Lüdecke, A.; Schulz, C.; Seiwert, M.; Kolossa-Gehring, M. German Environmental Survey for Children 2003/06-GerES IV-Human Biomonitoring. Levels of Selected Substances in Blood and Urine of Children in Germany [Internet]. Dessau-Roßlau: Umweltbundesamt. Report No.: 202 62 219. 2008, pp. 1–85. Available online: http://www.umweltbundesamt.de/publikationen/german-environmental-survey-for-children-200306 (accessed on 8 October 2013).
- Becker, K.; Schulz, C.; Kaus, S.; Seiwert, M.; Seifert, B. German Environmental Survey 1998 (GerES III): Environmental pollutants in the urine of the German population. Int. J. Hyg. Environ. Health 2003, 206, 15–24. [Google Scholar] [CrossRef] [PubMed]
- Becker, K.; Kaus, S.; Krause, C.; Lepom, P.; Schulz, C.; Seiwert, M.; Seifert, B. German Environmental Survey 1998 (GerES III): Environmental pollutants in blood of the German population. Int. J. Hyg. Environ. Health 2002, 205, 297–308. [Google Scholar] [CrossRef] [PubMed]
- Haines, D.A.; Saravanabhavan, G.; Werry, K.; Khoury, C. An overview of human biomonitoring of environmental chemicals in the Canadian Health Measures Survey: 2007–2019. Int. J. Hyg. Environ. Health 2017, 220 (2 Pt A), 13–28. [Google Scholar] [CrossRef] [Green Version]
- Freire, C.; Koifman, R.J.; Fujimoto, D.; de Oliveira Souza, V.C.; Barbosa, F.; Koifman, S. Reference values of cadmium, arsenic and manganese in blood and factors associated with exposure levels among adult population of Rio Branco, Acre, Brazil. Chemosphere 2015, 128, 70–78. [Google Scholar] [CrossRef]
- Freire, C.; Koifman, R.J.; Fujimoto, D.; de Oliveira Souza, V.C.; Barbosa, F.; Koifman, S. Reference values of lead in blood and related factors among blood donors in the Western Amazon, Brazil. J. Toxicol. Environ. Health A 2014, 77, 426–440. [Google Scholar] [CrossRef] [PubMed]
- Miranda, S.A. Níveis Séricos de Níquel na População Adulta: Estudo em Doadores de Sangue em Rio Branco, Acre; Universidade Federal do Acre: Rio Branco, Brazil, 2012. [Google Scholar]
- Kira, C.S. Determinação de Valores de Referência Para Chumbo, Cádmio, Mercúrio e Níquel em Sangue de Crianças e Adultos da Cidade de São Paulo [Internet]. [São Paulo-SP]: Universidade de Medicina de São Paulo. 2014. Available online: File:///C:/Users/%C3%89lida%20Campos/Downloads/CarmenSilviaKira%20(1).pdf (accessed on 9 October 2016).
- Kira, C.S.; Sakuma, A.M.; De Capitani, E.M.; de Freitas, C.U.; Cardoso, M.R.A.; Gouveia, N. Associated factors for higher lead and cadmium blood levels, and reference values derived from general population of São Paulo, Brazil. Sci. Total Environ. 2016, 543, 628–635. [Google Scholar] [CrossRef] [PubMed]
- Kuno, R.; Roquetti, M.H.; Becker, K.; Seiwert, M.; Gouveia, N. Reference values for lead, cadmium and mercury in the blood of adults from the metropolitan area of Sao Paulo, Brazil. Int. J. Hyg. Environ. Health 2013, 216, 243–249. [Google Scholar] [CrossRef]
- Olympio, K.P.K.; da Silva, J.P.; da Silva, A.S.; da Souza, V.C.; Buzalaf, M.A.R.; Barbosa, F., Jr.; Cardoso, M.R.A. Blood lead and cadmium levels in preschool children and associated risk factors in São Paulo, Brazil. Environ. Pollut. 2018, 240, 831–838. [Google Scholar] [CrossRef] [PubMed]
- Takeda, S.H.K.; Kuno, R.; Barbosa, F.; Gouveia, N. Trace element levels in blood and associated factors in adults living in the metropolitan area of São Paulo, Brazil. J. Trace Elem. Med. Biol. Organ. Soc. Miner. Trace Elem. GMS 2017, 44, 307–314. [Google Scholar] [CrossRef]
- Da Silva, A.L.C.; Urbano, M.R.; De Almeida Lopes, A.C.B.; de Fatima H Carvalho, M.; Buzzo, M.L.; Peixe, T.S.; Aschner, M.; Mesas, A.E.; Paoliello, M.M.B. Blood manganese levels and associated factors in a population-based study in Southern Brazil. J. Toxicol. Environ. Health A 2017, 80, 1064–1077. [Google Scholar] [CrossRef]
- Rocha, G.H.O.; Steinbach, C.; Munhoz, J.R.; Madia, M.A.O.; Faria, J.K.; Hoeltgebaum, D.; Barbosa, F.; Batista, B.L.; Souza, V.C.O.; Nerilo, S.B. Trace metal levels in serum and urine of a population in southern Brazil. J. Trace Elem. Med. Biol. Organ. Soc. Miner. Trace Elem. GMS 2016, 35, 61–65. [Google Scholar] [CrossRef]
- Nunes, J.A.; Batista, B.L.; Rodrigues, J.L.; Caldas, N.M.; Neto, J.A.G.; Barbosa, F. A simple method based on ICP-MS for estimation of background levels of arsenic, cadmium, copper, manganese, nickel, lead, and selenium in blood of the Brazilian population. J. Toxicol. Environ. Health A 2010, 73, 878–887. [Google Scholar] [CrossRef]
- Dos Santos, C.R.; da Silva, C.S.; Nascimento, E.S. Assessment of exposure to cadmium, lead, manganese, and nickel in workers from foundries. Toxicol. Ind. Health 2016, 32, 1784–1790. [Google Scholar] [CrossRef]
- Paoliello, M.M.B.; De Capitani, E.M. Occupational and environmental human lead exposure in Brazil. Environ. Res. 2007, 103, 288–297. [Google Scholar] [CrossRef]
- Rocha, G.H.O.; Lini, R.S.; Barbosa, F.; Batista, B.L.; de Oliveira Souza, V.C.; Nerilo, S.B.; Bando, E.; Mossini, S.A.G.; Nishiyama, P. Exposure to heavy metals due to pesticide use by vineyard farmers. Int. Arch. Occup. Environ. Health 2015, 88, 875–880. [Google Scholar] [CrossRef]
- de Viana, G.F.; de Carvalho, C.F.; Nunes, L.S.; Rodrigues, J.L.G.; Ribeiro, N.S.; de Almeida, D.A.; Ferreira, J.R.D.; Abreu, N.; Menezes-Filho, J.A. Noninvasive biomarkers of manganese exposure and neuropsychological effects in environmentally exposed adults in Brazil. Toxicol. Lett. 2014, 231, 169–178. [Google Scholar] [CrossRef]
- Gil, F.; Hernández, A.F. Toxicological importance of human biomonitoring of metallic and metalloid elements in different biological samples. Food Chem. Toxicol. Int. J. Publ. Br. Ind. Biol. Res. Assoc. 2015, 80, 287–297. [Google Scholar] [CrossRef] [PubMed]
- Chen, L.; Xu, Z.; Liu, M.; Huang, Y.; Fan, R.; Su, Y.; Hu, G.; Peng, X.; Peng, X. Lead exposure assessment from study near a lead-acid battery factory in China. Sci. Total Environ. 2012, 429, 191–198. [Google Scholar] [CrossRef]
- Aguilera, I.; Daponte, A.; Gil, F.; Hernández, A.F.; Godoy, P.; Pla, A.; Ramos, J.L. Biomonitoring of urinary metals in a population living in the vicinity of industrial sources: A comparison with the general population of Andalusia, Spain. Sci. Total Environ. 2008, 407, 669–678. [Google Scholar] [CrossRef] [PubMed]
- Bråtveit, M.; Magerøy, N.; Gundersen, H.; Vahter, M.; Moen, B.E. Biomarker of chronic cadmium exposure in a population residing in the vicinity of a zinc producing plant. Sci. Total Environ. 2011, 409, 4222–4228. [Google Scholar] [CrossRef]
- Alonso, E.; Cambra, K.; Martinez, T. Lead and cadmium exposure from contaminated soil among residents of a farm area near an industrial site. Arch. Environ. Health 2001, 56, 278–282. [Google Scholar] [CrossRef]
- Lie, A.; Gundersen, N.; Korsgaard, K.J. Mercury in urine--Sex, age and geographic differences in a reference population. Scand. J. Work Environ. Health 1982, 8, 129–133. [Google Scholar] [CrossRef] [Green Version]
- Orsmond, G.I.; Cohn, E.S. The Distinctive Features of a Feasibility Study: Objectives and Guiding Questions. OTJR Occup. Particip. Health 2015, 35, 169–177. [Google Scholar] [CrossRef] [PubMed]
- Instituto Politicas Alternativas para o Cone Sul. TKCSA-Companhia Siderúrgica do Atlântico. Impactos e irregularidades na Zona Oeste do Rio de Janeiro [Internet]. In PACS-Instituto Politicas Alternativas para o Cone Sul; 2012; Available online: http://www.pacs.org.br/files/2013/01/TKCSA.pdf (accessed on 19 December 2015).
- FIOCRUZ. Análise Atualizada dos Problemas Socioambientais e de Saúde Decorrentes da Instalação e Operação da Empresa TKCSA [Internet]. In Rio de Janeiro, RJ: FIOCRUZ-Fundação Oswaldo Cruz; 2014; p. 363. Available online: File:///C:/Users/%C3%89lida%20Campos/Downloads/TKCSA_relatorio_problemas_socioambientais_2014.pdf (accessed on 21 March 2016).
- FIOCRUZ. Avaliação dos Impactos Sócioambientais e de Saúde em Santa Cruz Decorrentes da Instalação E Operação da Empresa TKCSA [Internet]. In Rio de Janeiro, RJ: FIOCRUZ-Fundação Oswaldo Cruz; 2011; p. 66. Available online: http://www.epsjv.fiocruz.br/upload/d/Relatorio_TKCSA.pdf (accessed on 19 December 2015).
- IPP. Bairros Cariocas [Internet]. Armazém de Dados-Instituto Pereira Passos. 2003. Available online: http://portalgeo.rio.rj.gov.br/bairroscariocas/index_ra.htm (accessed on 20 December 2015).
- IBGE. Censo Demográfico 2010 [Internet]. Sistema IBGE de Recuperação Automática-SIDRA. 2010. Available online: https://sidra.ibge.gov.br/pesquisa/censo-demografico/demografico-2010/universo-caracteristicas-da-populacao-e-dos-domicilios (accessed on 28 June 2019).
- Blanton, C.A.; Moshfegh, A.J.; Baer, D.J.; Kretsch, M.J. The USDA Automated Multiple-Pass Method accurately estimates group total energy and nutrient intake. J. Nutr. 2006, 136, 2594–2599. [Google Scholar] [CrossRef] [PubMed]
- Nordberg, G.; Fowler, B.; Nordberg, M.; Friberg. Handbook on the Toxicology of Metals, 3rd ed.; Academic Press: Amsterdam, The Netherlands; Boston, MA, USA, 2007; 975p. [Google Scholar]
- Batista, B.L.; Rodrigues, J.L.; Nunes, J.A.; Souza VC de, O.; Barbosa, F. Exploiting dynamic reaction cell inductively coupled plasma mass spectrometry (DRC-ICP-MS) for sequential determination of trace elements in blood using a dilute-and-shoot procedure. Anal. Chim. Acta. 2009, 639, 13–18. [Google Scholar] [CrossRef]
- International Equipment Trading. Performance Specifications Perkin Elmer ELAN DRC II ICP-MS. Available online: http://www.ietltd.com/pdf_datasheets/Elan%20DRC%20II%20Data%20Sheet%20.pdf (accessed on 4 February 2021).
- Rodrigues, J.L. Avaliação de Técnicas Acopladas à Espectrometria de Massas Com Plasma (ICP-MS) Visando o Fracionamento e a Especiação Química de Mercúrio em Sangue e Plasma [Internet]. In [Ribeirão Preto]: Universidade de São Paulo; 2010; Available online: https://www.teses.usp.br/teses/disponiveis/60/60134/tde-13082010-100725/pt-br.php (accessed on 16 January 2021).
- IBGE. Pesquisa Nacional por Amostra de Domicílios Contínua-PNAD Contínua [Internet]. Pesquisa Nacional por Amostra de Domicílios Contínua-PNAD Contínua|IBGE. 2018. Available online: https://www.ibge.gov.br/estatisticas/sociais/habitacao/17270-pnad-continua.html?edicao=24437&t=resultados (accessed on 28 June 2019).
- Neri, M.C. Desigualdade e Favelas Cariocas: A Cidade Partida Está se Integrando? [Internet]. 2010. Available online: http://bibliotecadigital.fgv.br/dspace/handle/10438/21948 (accessed on 5 July 2019).
- Coswig, V.S.; Neves, A.H.S.; Del Vecchio, F.B. Efeitos do tempo de prática nos parâmetros bioquímicos, hormonais e hematológicos de praticantes de jiu-jitsu brasileiro: Efectos del tiempo de práctica en los parámetros bioquímicos, hormonales y hematológicos de practicantes de jiu-jitsu brasileño. Rev. Andal. Med. Deporte 2013, 6, 17–23. [Google Scholar] [CrossRef] [Green Version]
- Camargo, T.M.; Rocha-Junior, D.S.; Rostelato-Ferreira, S.; Vasconcelos, E.M.A.; Oliveira, S.J.; Shitara, E.S.; Oshima-Franco, Y. Influência do tabagismo sobre as análises laboratoriais de rotina: Um estudo piloto em adultos jovens. Rev. Ciênc. Farm Básica E Apl. 2006, 27, 247–251. [Google Scholar]
- Santos, I.S.; Goulart, A.C.; Pereira, A.C.; Lotufo, P.A.; Benseñor, I.M. Association between Cardiovascular Health Score and Carotid Intima-Media Thickness: Cross-Sectional Analysis of the Brazilian Longitudinal Study of Adult Health (ELSA-Brasil) Baseline Assessment. J. Am. Soc. Echocardiogr. Off. Publ. Am. Soc. Echocardiogr. 2016, 29, 1207–1216.e4. [Google Scholar] [CrossRef]
- Harada, P.H.; Bensenõr, I.J.M.; Drager, L.F.; Goulart, A.C.; Mill, J.G.; Lotufo, P.A. Non-alcoholic fatty liver disease presence and severity are associated with aortic stiffness beyond abdominal obesity: The ELSA-Brasil. Atherosclerosis 2019, 284, 59–65. [Google Scholar] [CrossRef]
- Benseñor, I.M.; Nunes, M.A.; Sander Diniz, M.d.F.; Santos, I.S.; Brunoni, A.R.; Lotufo, P.A. Subclinical thyroid dysfunction and psychiatric disorders: Cross-sectional results from the Brazilian Study of Adult Health (ELSA-Brasil). Clin. Endocrinol. 2016, 84, 250–256. [Google Scholar] [CrossRef]
- Nisse, C.; Tagne-Fotso, R.; Howsam, M.; Members of Health Examination Centres of the Nord−Pas-de-Calais Region Network; Richeval, C.; Labat, L.; Leroyer, A. Blood and urinary levels of metals and metalloids in the general adult population of Northern France: The IMEPOGE study, 2008-2010. Int. J. Hyg. Environ. Health 2017, 220, 341–363. [Google Scholar] [CrossRef]
- Zeng, H.-L.; Li, H.; Lu, J.; Guan, Q.; Cheng, L. Assessment of 12 Metals and Metalloids in Blood of General Populations Living in Wuhan of China by ICP-MS. Biol. Trace Elem. Res. 2019, 189, 344–353. [Google Scholar] [CrossRef]
- Khlifi, R.; Olmedo, P.; Gil, F.; Feki-Tounsi, M.; Hammami, B.; Rebai, A.; Hamza-Chaffai, A. Biomonitoring of cadmium, chromium, nickel and arsenic in general population living near mining and active industrial areas in Southern Tunisia. Environ. Monit. Assess 2014, 186, 761–779. [Google Scholar] [CrossRef]
- Ancona, C.; Bauleo, L.; Biscotti, G.; Bocca, B.; Caimi, S.; Cruciani, F.; Di Lorenzo, S.; Petrolati, M.; Pino, A.; Piras, G.; et al. A survey on lifestyle and level of biomarkers of environmental exposure in residents in Civitavecchia (Italy). Ann. Ist. Super Sanita 2016, 52, 488–494. [Google Scholar]
- De Coster, S.; Koppen, G.; Bracke, M.; Schroijen, C.; Den Hond, E.; Nelen, V.; van de Mieroop, E.; Bruckers, L.; Bilau, M.; Baeyens, W.; et al. Pollutant effects on genotoxic parameters and tumor-associated protein levels in adults: A cross sectional study. Environ. Health Glob. Access Sci. Source 2008, 7, 26. [Google Scholar] [CrossRef] [PubMed] [Green Version]
- Dhooge, W.; Den Hond, E.; Koppen, G.; Bruckers, L.; Nelen, V.; Van De Mieroop, E.; Bilau, M.; Croes, K.; Baeyens, W.; Schoeters, G.; et al. Internal exposure to pollutants and body size in Flemish adolescents and adults: Associations and dose-response relationships. Environ. Int. 2010, 36, 330–337. [Google Scholar] [CrossRef]
- Madeddu, R.; Tolu, P.; Asara, Y.; Farace, C.; Forte, G.; Bocca, B. Blood biomonitoring of metals in subjects living near abandoned mining and active industrial areas. Environ. Monit. Assess 2013, 185, 5837–5846. [Google Scholar] [CrossRef]
- van Larebeke, N.A.; Bracke, M.E.; Nelen, V.; Koppen, G.; Schoeters, G.; Van Loon, H.; Vlietinck, R. Differences in Tumor-Associated Protein Levels among Middle-Age Flemish Women in Association with Area of Residence and Exposure to Pollutants. Environ. Health Perspect. 2006, 114, 887–892. [Google Scholar] [CrossRef] [PubMed] [Green Version]
- Chen, X.; Zhou, H.; Li, X.; Wang, Z.; Zhu, G.; Jin, T. Effects of lead and cadmium co-exposure on hemoglobin in a Chinese population. Environ. Toxicol. Pharmacol. 2015, 39, 758–763. [Google Scholar] [CrossRef]
- Fierens, S.; Mairesse, H.; Heilier, J.-F.; Focant, J.-F.; Eppe, G.; De Pauw, E.; Bernard, A. Impact of iron and steel industry and waste incinerators on human exposure to dioxins, PCBs, and heavy metals: Results of a cross-sectional study in Belgium. J. Toxicol. Environ. Health A 2007, 70, 222–226. [Google Scholar] [CrossRef] [PubMed]
- Valente, O. Rastreamento Diagnóstico Das Principais Disfunções Da Tireoide. Diagn Trat [Internet]. 2013, p. 18. Available online: http://bases.bireme.br/cgi-bin/wxislind.exe/iah/online/?IsisScript=iah/iah.xis&src=google&base=LILACS&lang=p&nextAction=lnk&exprSearch=670597&indexSearch=ID (accessed on 28 June 2019).


| Adversities | Adjustments |
|---|---|
| ➢ Recruitment and characteristics of the sample | |
| - Sample composed mostly by older people. | - Matching by age. |
| - High number of refusals in areas closest to the steel plant. | - Retraining of interviewers. |
| - Clarification of the project objectives in the recruitment process. | |
| - Informative posters at the health units. | |
| ➢ Procedure of data collection and measurement of biological parameters | |
| - Missing data in the responses. | - Retraining of interviewers, laboratory and biological sample transportation team. |
| - Difficulty recovering “missing” subjects. | - Limiting the team of interviewers to those who identified themselves with the work. |
| - Deterioration of the relationship with the participants. | - Editing and reorganizing the interview questionnaire. |
| - Clotted blood samples. | - Elaboration and printing blood collection protocols for the laboratory teams. |
| - Strained relationship with health unit managers. | - Regular visits to health units to evaluate the conditions of the blood collection rooms and sample storage areas. |
| - Meeting of the central level of the Municipality Health Secretary’s Office with the managers of the health units. | |
| ➢ Acceptability and adaptation of study procedures | |
| - Population’s fear of losing services and jobs provided by the local industries. | - More promotion of the survey in the region. |
| - Need for covering bigger distances to collect blood during the strike of the municipality’s healthcare workers. | - Handing out invitation to participate in the study at home (in cases when the subject was not found home on the days and times of the home visit). |
| - Failure to show up on the scheduled days for blood collection. | - Blood collection at home. |
| - Difficulty locating the selected participants (absent when the house call was made). | |
| ➢ Resources and ability to manage and implement the study | |
| - Strike of part of the municipality’s healthcare workers. | - Temporary reallocation of blood collection to a single unit whose staff was not affected. |
| Variables | Total n (%) | Micro Area I n (%) | Micro Area II n (%) | Micro Area III n (%) |
|---|---|---|---|---|
| Sex | ||||
| Male | 114 (45.6) | 45 (46.4) | 32 (45.1) | 37 (45.1) |
| Female | 136 (54.4) | 52 (53.6) | 39 (54.9) | 45 (54.9) |
| Age | ||||
| 18–59 years | 170 (68.3) | 59 (61.5) | 52 (73.2) | 59 (72.0) |
| ≥60 years | 79 (31.7) | 37 (38.5) | 19 (26.8) | 23 (28.0) |
| Skin color | ||||
| Black | 36 (14.5) | 15 (15.5) | 12 (16.9) | 9 (11.1) |
| Brown | 146 (58.6) | 55 (56.7) | 44 (62.0) | 47 (58.0) |
| White | 65 (26.1) | 25 (25.8) | 15 (21.1) | 25 (30.9) |
| Yellow | 2 (0.8) | 2 (2.1) | 0 (0.0) | 0 (0.0) |
| Marital status | ||||
| Married/Living together | 148 (59.2) | 61 (62.9) | 42 (52.9) | 45 (54.9) |
| Divorced | 22 (8.8) | 7 (7.2) | 5 (7.0) | 10 (12.2) |
| Widower | 23 (9.2) | 13 (13.4) | 4 (5.6) | 6 (7.3) |
| Single | 57 (22.8) | 16 (16.5) | 20 (28.2) | 21 (25.6) |
| Education level | ||||
| University | 20 (8.1) | 10 (10.5) | 5 (7.0) | 5 (6.2) |
| High school | 123 (49.8) | 49 (51.6) | 26 (36.6) | 48 (59.6) |
| Elementary school | 96 (38.9) | 34 (35.8) | 38 (53.5) | 24 (29.6) |
| Illiterate | 8 (3.2) | 2 (2.1) | 2 (2.8) | 4 (4.9) |
| Household income | ||||
| <USD 285 | 66 (26.7) | 21 (21.6) | 21 (30.9) | 24 (29.3) |
| USD 285–570 | 81 (32.8) | 24 (24.7) | 26 (38.2) | 31 (37.8) |
| >USD 570 | 100 (40.5) | 52 (53.6) a | 21 (30.9) b | 27 (32.9) b |
| Income per capita | ||||
| up to USD 285 | 187 (77.3) | 71 (76.3) | 54 (80.6) | 62 (75.6) |
| USD 285.01–570 | 38 (15.7) | 13 (14.0) | 8 (11.9) | 17 (20.7) |
| >USD 570 | 17 (7.0) | 9 (9.7) | 5 (7.5) | 3 (3.7) |
| Years residing in AP5.3 | ||||
| 1–10 | 26 (10.4) | 13 (13.5) | 7 (9.9) | 6 (7.3) |
| 11–30 | 102 (41.0) | 37 (38.5) | 32 (41.5) | 33 (40.2) |
| >30 | 121 (48.6) | 46 (47.9) | 32 (45.1) | 43 (52.4) |
| Busy road/s near the residence | ||||
| No | 85 (34.4) | 42 (44.2) a | 22 (31.0) a,b | 21 (25.9) b |
| Yes | 162 (65.6) | 53 (55.8) a | 49 (69.0) a,b | 60 (74.1) b |
| Time spent outdoors near the industrial district of Santa Cruz | ||||
| <3 h/day | 41 (20.2) | 15 (21.7) | 11 (18.3) | 15 (20.3) |
| 3–8 h/day | 117 (57.6) | 41 (59.4) | 32 (53.3) | 44 (59.5) |
| >8 h/day | 45 (22.2) | 13 (18.8) | 17 (28.3) | 15 (20.3) |
| Water used to drink and cook | ||||
| Bottled water | 5 (2.0) | 0 (0.0) | 1 (1.4) | 4 (4.9) |
| Tap water | 242 (96.8) | 96 (99.0) | 69 (97.2) | 77 (93.9) |
| Reservoir | 1 (0.4) | 1 (1.0) | 0 (0.0) | 0 (0.0) |
| Other | 2 (0.8) | 0 (0.0) | 1 (1.4) | 1 (1.2) |
| Consumption of home-grown food | ||||
| No | 194 (78.5) | 79 (81.4) | 59 (83.1) | 56 (68.3) |
| Yes | 53 (21.5) | 16 (16.5) | 11 (15.5) | 26 (31.7) |
| Irrigation water used for home-grown vegetables | ||||
| Tap water | 30 (93.8) | 13 (86.7) | 7 (100) | 10 (100) |
| Well water | 2 (6.3) | 2 (13.3) | 0 (0.0) | 0 (0.0) |
| Smokes or has smoked cigarettes or cigars for at least 1 year | ||||
| Never smoked | 166 (66.4) | 61 (62.9) | 50 (70.4) | 55 (67.1) |
| Yes, currently smokes | 30 (12.0) | 18 (18.6) a | 4 (5.6) b | 8 (9.8) a,b |
| Yes, smoked in the past | 54 (21.6) | 18 (18.6) | 17 (23.9) | 19 (23.2) |
| Has been married to/has lived with a smoker | ||||
| No | 121 (72.9) | 43 (70.5) | 39 (78.0) | 39 (70.9) |
| Yes | 45 (27.1) | 18 (29.5) | 11 (22.0) | 16 (29.1) |
| Works or has worked indoors with smokers | ||||
| No | 134 (79.3) | 49 (81.7) | 43 (86.0) | 42 (80.8) |
| Yes | 35 (20.7) | 11 (18.3) | 7 (14.0) | 10 (19.2) |
| Chews gum on a regular basis | ||||
| No | 213 (85.2) | 84 (86.6) | 57 (80.3) | 72 (87.8) |
| Yes | 37 (14.8) | 13 (13.4) | 14 (19.7) | 10 (12.2) |
| Has any dental amalgam filling | ||||
| No | 162 (66.4) | 62 (64.6) | 51 (76.1) | 49 (60.5) |
| Yes | 82 (33.6) | 34 (35.4) | 16 (23.9) | 32 (39.5) |
| Work status | ||||
| Formal job with contract | 31 (12.7) | 9 (9.6) | 13 (18.6) | 9 (11.1) |
| Job without contract | 6 (2.4) | 1 (1.1) | 2 (2.9) | 3 (3.7) |
| Self-employed | 32 (13.1) | 12 (12.8) | 12 (17.1) | 8 (9.9) |
| Retired | 51 (20.8) | 23 (24.5) | 12 (17.1) | 16 (19.8) |
| Unemployed | 72 (29.4) | 23 (24.5) | 20 (28.6) | 29 (35.8) |
| Other | 53 (21.6) | 26 (27.7) | 11 (15.7) | 16 (19.8) |
| Works outdoors | ||||
| No | 50 (57.5) | 20 (58.8) | 18 (60.0) | 12 (52.2) |
| Yes | 37 (42.5) | 14 (41.2) | 12 (40.0) | 11 (47.8) |
| Time spent working outdoors | ||||
| <30% | 4 (18.11) | 3 (25.0) | 0 (0.0) | 1 (9.1) |
| 31–50% | 12 (35.6) | 1 (8.3) | 6 (54.5) | 5 (45.5) |
| >50% | 18 (52.9) | 8 (66.7) | 5 (45.5) | 5 (45.5) |
| Busy road near the workplace | ||||
| No | 21 (25.6) | 11 (34.4) | 7 (25.5) | 3 (13.6) |
| Yes | 61 (74.4) | 21 (65.6) | 21 (75.0) | 19 (86.4) |
| Works or has worked in/with: | ||||
| Paint factory | ||||
| No | 235 (96.3) | 90 (94.7) | 65 (95.6) | 80 (98.8) |
| Yes | 9 (3.7) | 5 (5.3) | 3 (4.4) | 1 (1.2) |
| Plastic factory | ||||
| No | 237 (96.0) | 94 (97.9) | 67 (95.7) | 76 (93.8) |
| Yes | 10 (4.0) | 2 (2.1) | 3 (4.3) | 5 (6.2) |
| Glass factory | ||||
| No | 245 (99.2) | 95 (99.0) | 70 (100) | 80 (98.8) |
| Yes | 2 (0.8) | 1 (1.0) | 0 (0.0) | 1 (1.2) |
| Gas station | ||||
| No | 236 (95.5) | 93 (96.9) | 67 (95.7) | 76 (93.8) |
| Yes | 11 (4.5) | 3 (3.1) | 3 (4.3) | 5 (6.2) |
| Electroplating | ||||
| No | 232 (94.3) | 87 (90.6) | 67 (95.7) | 78 (97.5) |
| Yes | 14 (5.7) | 9 (9.4) | 3 (4.3) | 2 (2.5) |
| Prosthetics | ||||
| No | 245 (99.6) | 95 (99.0) | 70 (100) | 80 (100) |
| Yes | 1 (0.4) | 1 (1.0) | 0 (0.0) | 0 (0.0) |
| Mining activities | ||||
| No | 248 (100) | 97 (100) | 70 (100) | 81 (100) |
| Yes | 0 (0.0) | 0 (0.0) | 0 (0.0) | 0 (0.0) |
| Ceramics | ||||
| No | 236 (94.8) | 94 (96.9) | 67 (94.4) | 75 (92.6) |
| Yes | 13 (5.2) | 3 (3.1) | 4 (5.6) | 6 (7.4) |
| Fixing batteries | ||||
| No | 248 (99.2) | 97 (100) | 70 (98.6) | 81 (98.8) |
| Yes | 2 (0.8) | 0 (0.0) | 1 (1.4) | 1 (1.2) |
| Developing photographs | ||||
| No | 248 (99.2) | 95 (97.9) | 71 (100) | 82 (100) |
| Yes | 2 (0.8) | 2 (2.1) | 0 (0.0) | 0 (0.0) |
| Metal welding | ||||
| No | 241 (96.4) | 93 (95.9) | 69 (97.2) | 79 (96.3) |
| Yes | 9 (3.6) | 4 (4.1) | 2 (2.8) | 3 (3.7) |
| Fertilizers | ||||
| No | 239 (95.6) | 92 (94.8) | 65 (91.5) | 82 (100) |
| Yes | 11 (4.4) | 5 (5.2) | 6 (8.5) | 0 (0.0) |
| Agriculture and/or livestock farming | ||||
| No | 237 (94.8) | 89 (91.8) | 68 (95.8) | 80 (97.6) |
| Yes | 13 (5.2) | 8 (8.2) | 3 (4.2) | 2 (2.4) |
| Pesticides | ||||
| No | 246 (98.4) | 94 (96.9) | 71 (100) | 81 (98.8) |
| Yes | 4 (1.6) | 3 (3.1) | 0 (0.0) | 1 (1.2) |
| Firearms | ||||
| No | 232 (92.8) | 88 (90.7) | 69 (97.2) | 75 (91.5) |
| Yes | 18 (7.2) | 9 (9.3) | 2 (2.8) | 7 (8.5) |
| Fishing activities | ||||
| No | 246 (98.4) | 94 (96.9) | 70 (98.6) | 82 (100) |
| Yes | 4 (1.6) | 3 (3.1) | 1 (1.4) | 0 (0.0) |
| Parameters | N | Total | Micro Areas | Parameters | N | Total | Micro Areas | ||||||||||
|---|---|---|---|---|---|---|---|---|---|---|---|---|---|---|---|---|---|
| N | I | N | II | N | III | N | I | N | II | N | III | ||||||
| Red blood cells (106/µL) | 239 | 4.6 (0.6) | 93 | 4.6 (0.6) | 70 | 4.5 (0.5) | 76 | 4.5 (0.6) | Lymphocytes (%) | 231 | 35.2 (8.6) | 92 | 35.5 (9.2) | 68 | 35.8 (8.3) | 71 | 34.2 (8.1) |
| <RV | 35 | 14.6 | 10 | 10.8 | 16 | 29.9 | 9 | 11.8 | <RV | 9 | 3.9 | 12 | 4.3 | 3 | 4.4 | 2 | 2.8 |
| >RV | 1 | 0.4 | 0 | 0.0 | 0 | 0.0 | 1 | 1.3 | >RV | 171 | 74.0 | 65 | 70.7 | 53 | 77.9 | 53 | 74.6 |
| Hemoglobin (g/dL) | 244 | 13.7 (1.4) | 93 | 13.8 (1.4) | 70 | 13.6 (1.4) | 81 | 13.8 (1.5) | Lymphocytes (103/µL) | 231 | 2.28 (0.6) | 92 | 2.3 (0.6) | 68 | 2.4 (0.6) | 71 | 2.1 (0.6) |
| <RV | 25 | 10.2 | 10 | 10.8 | 9 | 12.9 | 6 | 7.4 | <RV | 1 | 0.4 | 0 | 0.0 | 0 | 0.0 | 1 | 1.4 |
| >RV | 2 | 0.8 | 1 | 1.1 | 0 | 0.0 | 1 | 1.2 | >RV | 33 | 14.3 | 16 | 17.4 | 11 | 16.2 | 6 | 8.5 |
| Hematocrit (%) | 244 | 41.0 (4.8) | 93 | 41.4 (4.3) | 70 | 40.6 (3.9) | 81 | 41.0 (5.8) | Monocytes (%) | 231 | 6.9 (5.5–8.5) | 92 | 7.2 (5.9–9.4) a | 68 | 6.7 (5.3–8.0) b | 71 | 6.5 (4.4–8.4) b |
| <RV | 27 | 11.1 | 9 | 9.7 | 8 | 11.4 | 10 | 12.3 | <RV | 2 | 0.9 | 1 | 1.1 | 1 | 1.5 | 0 | 0.0 |
| >RV | 4 | 1.6 | 2 | 2.2 | 0 | 0.0 | 2 | 2.5 | >RV | 14 | 6.1 | 11 | 12.0 | 0 | 0.0 | 3 | 6.1 |
| MCV (fL) | 244 | 89.7 (6.0) | 93 | 89.0 (6.4) | 70 | 90.6 (5.3) | 81 | 89.8 (6.2) | Monocytes (103/µL) | 231 | 0.5 (0.2) | 92 | 0.5 (0.2) | 68 | 0.5 (0.2) | 71 | 0.4 (0.2) |
| <RV | 12 | 4.9 | 7 | 7.5 | 2 | 2.9 | 3 | 3.7 | <RV | 1 | 0.4 | 0 | 0.0 | 0 | 0.0 | 1 | 1.4 |
| >RV | 10 | 4.1 | 4 | 4.3 | 2 | 2.9 | 4 | 4.9 | >RV | 9 | 3.9 | 3 | 3.3 | 3 | 4.4 | 3 | 4.2 |
| MCH (pg) | 244 | 30.1 (2.3) | 93 | 29.6 (2.4) a | 70 | 30.4 (2.0) a,b | 81 | 30.2 (2.4) b | Platelets (103/µL) | 244 | 243 (60.6) | 93 | 250 (62.3) | 70 | 246 (63.2) | 81 | 234 (55.6) |
| <RV | 19 | 7.8 | 9 | 9.7 | 6 | 8.6 | 4 | 4.9 | <RV | 12 | 4.9 | 5 | 5.4 | 4 | 5.7 | 3 | 3.7 |
| >RV | 41 | 16.8 | 12 | 12.9 | 14 | 20.0 | 15 | 18.5 | >RV | 0 | 0.0 | 0 | 0.0 | 0 | 0.0 | 0 | 0.0 |
| ACHC (g/dL) | 244 | 33.5 (1.1) | 93 | 33.2 (1.1) | 70 | 33.6 (1.0) | 81 | 33.6 (1.0) | Urea (mg/dL) | 241 | 30.0 (26.0–36.0) | 92 | 32.0 (27.0–38.0) | 70 | 28.5 (26.0–34.3) | 79 | 31.0 (25.0–36.0) |
| <RV | 20 | 8.2 | 12 | 12.9 | 4 | 5.7 | 4 | 4.9 | <RV | 1 | 0.4 | 0 | 0.0 | 1 | 1.4 | 0 | 0.0 |
| >RV | 0 | - | - | - | - | - | - | - | >RV | 11 | 4.6 | 5 | 5.4 | 2 | 2.9 | 4 | 5.1 |
| RDW (%) | 244 | 13.5 (1.4) | 93 | 13.6 (1.5) | 70 | 13.7 (1.4) | 81 | 13.4 (1.4) | Creatinine (mg/dL) | 244 | 0.8 (0.7–0.9) | 94 | 0.8 (0.7–0.9) | 70 | 0.8 (0.7–0.9) | 80 | 0.8 (0.7–1.0) |
| >RV | 30 | 12.3 | 15 | 16.1 | 8 | 11.4 | 7 | 8.6 | <RV | 5 | 2.0 | 1 | 1.1 | 2 | 2.9 | 2 | 2.5 |
| >RV | 2 | 0.8 | 1 | 1.1 | 1 | 1.4 | 0 | 0.0 | |||||||||
| White blood cells (%) | 244 | 100 (100–100) | 93 | 100 (100–100) | 70 | 100 (100–100) | 81 | 100 (100–100) | AST (U/L) | 239 | 22.0 (19.0–27.0) | 90 | 21.5 (18.0–27.0) | 70 | 21.0 (18.8–25.0) | 79 | 24.0 (10.0–29.0) |
| <RV | 0 | - | - | - | - | - | - | - | <RV | 8 | 3.3 | 3 | 3.3 | 3 | 4.3 | 2 | 2.5 |
| >RV | 13 | 5.4 | 4 | 4.4 | 2 | 2.9 | 7 | 8.9 | |||||||||
| White blood cells (103/µL) | 237 | 6.7 (2.1) | 93 | 6.9 (2.3) | 70 | 6.8 (1.9) | 74 | 6.6 (2.1) | ALT (U/L) | 239 | 20.0 (14.0–28.0) | 90 | 18.0 (14.0–28.0) | 70 | 19.5 (13.8–26.3) | 79 | 21.0 (16.0–28.0) |
| <RV | 7 | 3.0 | 4 | 4.3 | 0 | 0.0 | 3 | 4.1 | <RV | 4 | 1.7 | 2 | 2.2 | 1 | 1.4 | 1 | 1.3 |
| >RV | 7 | 3.0 | 3 | 3.2 | 1 | 1.4 | 3 | 4.1 | >RV | 19 | 7.9 | 5 | 5.6 | 8 | 11.4 | 6 | 7.6 |
| Neutrophils (%) | 224 | 54.1 (9.7) | 92 | 53.1 (10.2) | 68 | 53.7 (9.5) | 64 | 55.9 (9.2) | Alkaline phosphatase (U/L) | 243 | 76.0 (65.0–88.0) | 94 | 72.0 (60.0–84.0) a | 70 | 74.5 (66.8–84.5) a,b | 79 | 81.0 (68.0–93.0) b |
| <RV | 71 | 31.7 | 30 | 32.6 | 26 | 38.2 | 15 | 23.4 | <RV | 1 | 0.4 | 1 | 1.1 | 0 | 0.0 | 0 | 0.0 |
| >RV | 10 | 4.5 | 3 | 3.3 | 3 | 4.4 | 4 | 6.3 | >RV | 33 | 13.6 | 13 | 13.8 | 9 | 12.9 | 11 | 13.9 |
| Neutrophils (103/µL) | 224 | 3.6 (2.7–4.5) | 92 | 3.7 (2.7–4.6) | 68 | 3.4 (2.7–4.4) | 64 | 3.5 (2.7–4.4) | Total cholesterol (mg/dL) | 246 | 203 (44.6) | 95 | 207 (45.3) | 70 | 203 (39.7) | 81 | 196 (47.4) |
| <RV | 39 | 17.4 | 15 | 16.3 | 11 | 16.2 | 13 | 20.3 | Borderline | 76 | 30.9 | 26 | 27.4 | 27 | 38.6 | 23 | 28.4 |
| >RV | 11 | 4.9 | 4 | 4.3 | 4 | 5.9 | 3 | 4.7 | High | 45 | 18.3 | 20 | 21.1 | 12 | 17.1 | 13 | 16.0 |
| Eosinophils (%) | 230 | 2.2 (1.5–3.2) | 92 | 2.4 (1.6–3.7) | 68 | 2.4 (1.7–3.5) | 70 | 2.0 (1.4–2.7) | Triglycerides (mg/dL) | 245 | 121 (85.0–170) | 94 | 115 (85.0–167) | 70 | 128 (88.8–175) | 81 | 123 (80.0–173) |
| <RV | 14 | 6.1 | 7 | 7.6 | 4 | 5.9 | 3 | 4.3 | Borderline | 37 | 15.1 | 17 | 18.1 | 7 | 10.0 | 13 | 16.0 |
| >RV | 12 | 5.2 | 8 | 8.7 | 1 | 1.5 | 3 | 4.3 | High | 44 | 18.0 | 14 | 14.9 | 16 | 22.9 | 14 | 17.3 |
| Very high | 4 | 1.6 | 2 | 2.1 | 0 | 0.0 | 2 | 2.5 | |||||||||
| Eosinophils (103/µL) | 230 | 0.2 (0.1–0.2) | 92 | 0.2 (0.1–0.2) | 68 | 0.2 (0.1–0.2) | 70 | 0.1 (0.1–0.2) | TSH (µUI/mL) | 242 | 1.9 (1.3–2.9) | 93 | 1.8 (1.2–2.6) | 70 | 1.8 (1.2–3.0) | 79 | 2.1 (1.5–2.9) |
| <RV | 52 | 22.6 | 16 | 17.4 | 12 | 17.6 | 24 | 34.3 | <RV | 4 | 1.7 | 1 | 1.1 | 1 | 1.4 | 2 | 2.5 |
| >RV | 12 | 5.2 | 5 | 5.4 | 1 | 1.5 | 6 | 8.6 | >RV | 18 | 7.4 | 6 | 6.5 | 6 | 8.6 | 6 | 7.6 |
| Basophils (%) | 223 | 0.6 (0.4–1.0) | 91 | 0.6 (0.4–1.0) | 67 | 0.7 (0.5–1.0) | 65 | 0.7 (0.5–1.0) | TT3 (ng/dL) | 110 | 114 (21.1) | 12 | 117 (25.0) | 68 | 115 (21.5) | 30 | 111 (18.7) |
| >RV | 2 | 0.9 | 1 | 1.1 | 1 | 1.5 | 0 | 0.0 | <RV | 1 | 0.9 | 0 | 0.0 | 1 | 1.5 | 0 | 0.0 |
| >RV | 0 | 0.0 | 0 | 0.0 | 0 | 0.0 | 0 | 0.0 | |||||||||
| Basophils (103/µL) | 224 | 0.04 (0.03–0.06) | 91 | 0.04 (0.03–0.06) | 68 | 0.04 (0.03–0.06) | 65 | 0.04 (0.03–0.06) | FT4 (ng/dL) | 33 | 1.1 (0.1) | 13 | 1.1 (0.2) | 0 | - | 20 | 1.1 (0.1) |
| >RV | 1 | 0.4 | 1 | 1.1 | 0 | 0.0 | 0 | 0.0 | <RV | 0 | 0.0 | 0 | 0.0 | 0 | 0.0 | 0 | 0.0 |
| >RV | 0 | 0.0 | 0 | 0.0 | 0 | 0.0 | 0 | 0.0 | |||||||||
| % > LD | GM | GSD | MIN | MAX | P25 | P50 | P75 | GM | GSD | P25 | P50 | P75 | GM | GSD | P25 | P50 | P75 | GM | GSD | P25 | P50 | P75 | |
| Blood | Total (n = 248) | Micro Area I (n = 95) | Micro Area II (n = 71) | Micro Area III (n = 82) | |||||||||||||||||||
| As | 100 | 4.82 | 1.21 | 3.35 | 13.3 | 4.75 | 4.75 | 5.21 | 5.01 a | 1.19 | 4.52 | 5.02 | 5.38 | 4.82 b | 1.21 | 4.27 | 4.75 | 5.13 | 4.59 c | 1.22 | 4.02 | 4.48 | 4.99 |
| Cd | 100 | 0.25 | 1.78 | 0.06 | 3.21 | 0.17 | 0.24 | 0.36 | 0.19 a | 1.88 | 0.12 | 0.18 | 0.26 | 0.20 a | 1.51 | 0.17 | 0.20 | 0.26 | 0.38 b | 1.40 | 0.29 | 0.39 | 0.50 |
| Cu * | 100 | 878 | 1.19 | 568 | 1460 | 775 | 869 | 985 | 884 | 1.18 | 786 | 881 | 991 | 880 | 1.18 | 765 | 873 | 991 | 869 | 1.20 | 782 | 864 | 971 |
| Hg | 100 | 0.92 | 2.28 | 0.14 | 10.5 | 0.48 | 0.87 | 1.54 | 1.00 | 2.33 | 0.53 | 0.93 | 1.85 | 0.87 | 2.14 | 0.49 | 0.86 | 1.43 | 0.90 | 2.36 | 0.47 | 0.80 | 1.40 |
| Mn | 100 | 21.1 | 1.82 | 9.20 | 2508 | 15.5 | 18.6 | 23.3 | 22.6 a | 1.75 | 17.4 | 20.0 | 24.5 | 19.0 b | 1.57 | 13.9 | 17.3 | 21.7 | 21.3 a,b | 2.07 | 15.0 | 17.8 | 23.3 |
| Ni | 100 | 3.21 | 2.35 | 0.14 | 90.6 | 1.91 | 2.89 | 5.60 | 4.43 a | 1.87 | 2.57 | 5.15 | 6.45 | 3.41 b | 2.09 | 1.99 | 2.82 | 4.93 | 2.09 c | 2.70 | 1.16 | 1.93 | 3.33 |
| Pb | 100 | 20.8 | 1.68 | 7.21 | 138 | 14.8 | 20.4 | 27.5 | 24.4 a | 1.76 | 16.8 | 24.1 | 33.8 | 18.1 b | 1.49 | 13.8 | 17.9 | 22.5 | 19.5 b | 1.67 | 13.5 | 19.0 | 24.1 |
| Zn | 100 | 3960 | 1.63 | 1043 | 10,211 | 2765 | 3953 | 6024 | 6142 a | 1.29 | 5351 | 6233 | 7298 | 3420 b | 1.54 | 2447 | 3351 | 4962 | 2703 c | 1.38 | 2252 | 2799 | 3228 |
| % > LD | GM | GSD | MIN | MAX | P25 | P50 | P75 | GM | GSD | P25 | P50 | P75 | GM | GSD | P25 | P50 | P75 | GM | GSD | P25 | P50 | P75 | |
| Plasma | Total (n = 246) | Micro area I (n = 93) | Micro area II (n = 71) | Micro area III (n = 82) | |||||||||||||||||||
| Al | 100 | 24.2 | 1.62 | 5.34 | 132 | 17.8 | 23.4 | 31.0 | 29.3 a | 1.44 | 23.5 | 27.6 | 34.9 | 21.2 b | 1.71 | 15.6 | 19.6 | 26.3 | 21.9 b | 1.61 | 16.0 | 20.7 | 29.1 |
| As | 100 | 8.33 | 1.16 | 5.30 | 19.8 | 7.66 | 8.37 | 9.00 | 7.77 a | 1.15 | 7.05 | 7.81 | 8.36 | 8.60 b | 1.11 | 8.17 | 8.71 | 9.28 | 8.76 b | 1.17 | 8.17 | 8.76 | 9.38 |
| Cd | 99.6 | 0.03 | 1.78 | 0.002 | 0.53 | 0.02 | 0.03 | 0.04 | 0.04 a | 1.48 | 0.03 | 0.04 | 0.05 | 0.03 b | 2.07 | 0.02 | 0.03 | 0.04 | 0.03 b | 1.70 | 0.02 | 0.03 | 0.04 |
| Cu * | 100 | 969 | 1.34 | 484 | 2301 | 819 | 1022 | 1167 | 1103 a | 1.28 | 1020 | 1130 | 1282 | 888 b | 1.34 | 685 | 930 | 1076 | 902 b | 1.34 | 755 | 933 | 1086 |
| Hg | 84.1 | 0.17 | 2.36 | 0.04 | 2.92 | 0.11 | 0.17 | 0.28 | 0.16 | 2.44 | 0.11 | 0.17 | 0.26 | 0.17 | 2.30 | 0.10 | 0.19 | 0.29 | 0.18 | 2.34 | 0.12 | 0.18 | 0.30 |
| Mg (mg/L) | 100 | 14.2 | 1.35 | 5.02 | 23.8 | 10.8 | 13.3 | 19.1 | 18.6 a | 1.20 | 17.5 | 19,5 | 20.8 | 14.1 b | 1.26 | 11.3 | 13.8 | 17.5 | 10.6 c | 1.14 | 10.1 | 10.7 | 11.4 |
| Mn | 100 | 3.55 | 1.79 | 0.85 | 46.1 | 2.52 | 3.27 | 4.64 | 4.23 a | 1.74 | 3.00 | 3.94 | 5.21 | 2.52 b | 1.59 | 1.78 | 2.54 | 3.28 | 3.90 a | 1.81 | 2.60 | 3.26 | 4.83 |
| Ni | 100 | 1.51 | 2.09 | 0.01 | 46.8 | 1.34 | 1.74 | 2.12 | 1.51 a | 1.53 | 1.30 | 1.56 | 1.93 | 1.02 a | 2.89 | 0.52 | 1.36 | 2.20 | 2.12 b | 1.58 | 1.71 | 1.89 | 2.34 |
| Pb | 100 | 1.46 | 2.36 | 0.15 | 18.1 | 0.80 | 1.46 | 2.43 | 1.93 a | 2.14 | 1.09 | 1.71 | 3.06 | 0.99 b | 2.20 | 0.55 | 0.90 | 1.79 | 1.48 a | 2.46 | 0.80 | 1.58 | 2.49 |
| Zn | 100 | 1022 | 1.27 | 628 | 6389 | 895 | 1014 | 1143 | 1130 a | 1.36 | 1005 | 1120 | 1223 | 958 b | 1.16 | 849 | 944 | 1067 | 965 b | 1.17 | 881 | 947 | 1084 |
| Metals | Present Study | Brazil | Europe | Asia | North America | Africa | |||||
|---|---|---|---|---|---|---|---|---|---|---|---|
| General Population | Near Industries | General Population | Near Industries | General Population | Near Industries | General Population | Near Industries | General Population | Near Industries | ||
| As | 4.8 | 1.1–4.2 | - | 1.7 | - | 2.3 | - | 0.9 | - | - | 1.6 |
| Cd | 0.3 | 0.1–21.6 | - | 0.4 | 0.2–0.8 | 0.7 | 1.8–9.1 | 0.2–0.3 | - | - | 0.9 |
| Cu | 878.0 | 890.0–999.0 | - | - | - | 784.0 | - | 900.0 | - | - | - |
| Hg | 0.9 | 1.0–1.4 | - | 0.6–1.4 | - | 1.9 | - | 0.7–0.8 | - | - | - |
| Mn | 21.1 | 9.6–12.8 | - | 7.7 | 12.2 | 12.4 | - | 9.6–9.8 | - | - | 28.5 |
| Ni | 3.2 | 0.7–2.1 | - | 1.3 | - | - | - | 0.5 | - | - | - |
| Pb | 20.8 | 0.5–65.4 | - | 1.1–18.8 | 19.7–98.0 | 17.8 | 164.8–173.7 | 8.2–11.0 | - | - | - |
| Zn | 3960.0 | - | - | 5805.0 | - | 5850.0 | - | 6400.0 | - | - | - |
Publisher’s Note: MDPI stays neutral with regard to jurisdictional claims in published maps and institutional affiliations. |
© 2021 by the authors. Licensee MDPI, Basel, Switzerland. This article is an open access article distributed under the terms and conditions of the Creative Commons Attribution (CC BY) license (https://creativecommons.org/licenses/by/4.0/).
Share and Cite
Campos, É.; Freire, C.; Barbosa, F., Jr.; Lemos, C.; Saraceni, V.; Koifman, R.J.; Pinheiro, R.d.N.; da Silva, I.F. Biomonitoring of Exposure to Metals in a Population Residing in an Industrial Area in Brazil: A Feasibility Study. Int. J. Environ. Res. Public Health 2021, 18, 12455. https://0-doi-org.brum.beds.ac.uk/10.3390/ijerph182312455
Campos É, Freire C, Barbosa F Jr., Lemos C, Saraceni V, Koifman RJ, Pinheiro RdN, da Silva IF. Biomonitoring of Exposure to Metals in a Population Residing in an Industrial Area in Brazil: A Feasibility Study. International Journal of Environmental Research and Public Health. 2021; 18(23):12455. https://0-doi-org.brum.beds.ac.uk/10.3390/ijerph182312455
Chicago/Turabian StyleCampos, Élida, Carmen Freire, Fernando Barbosa, Jr., Cristina Lemos, Valéria Saraceni, Rosalina J. Koifman, Rafael do Nascimento Pinheiro, and Ilce Ferreira da Silva. 2021. "Biomonitoring of Exposure to Metals in a Population Residing in an Industrial Area in Brazil: A Feasibility Study" International Journal of Environmental Research and Public Health 18, no. 23: 12455. https://0-doi-org.brum.beds.ac.uk/10.3390/ijerph182312455