
Acceptance of Digital Sports: A Study Showing the Rising Acceptance of Digital Health Activities Due to the SARS-CoV-19 Pandemic


Abstract
:1. Introduction
2. Best Practices in Digital Sports
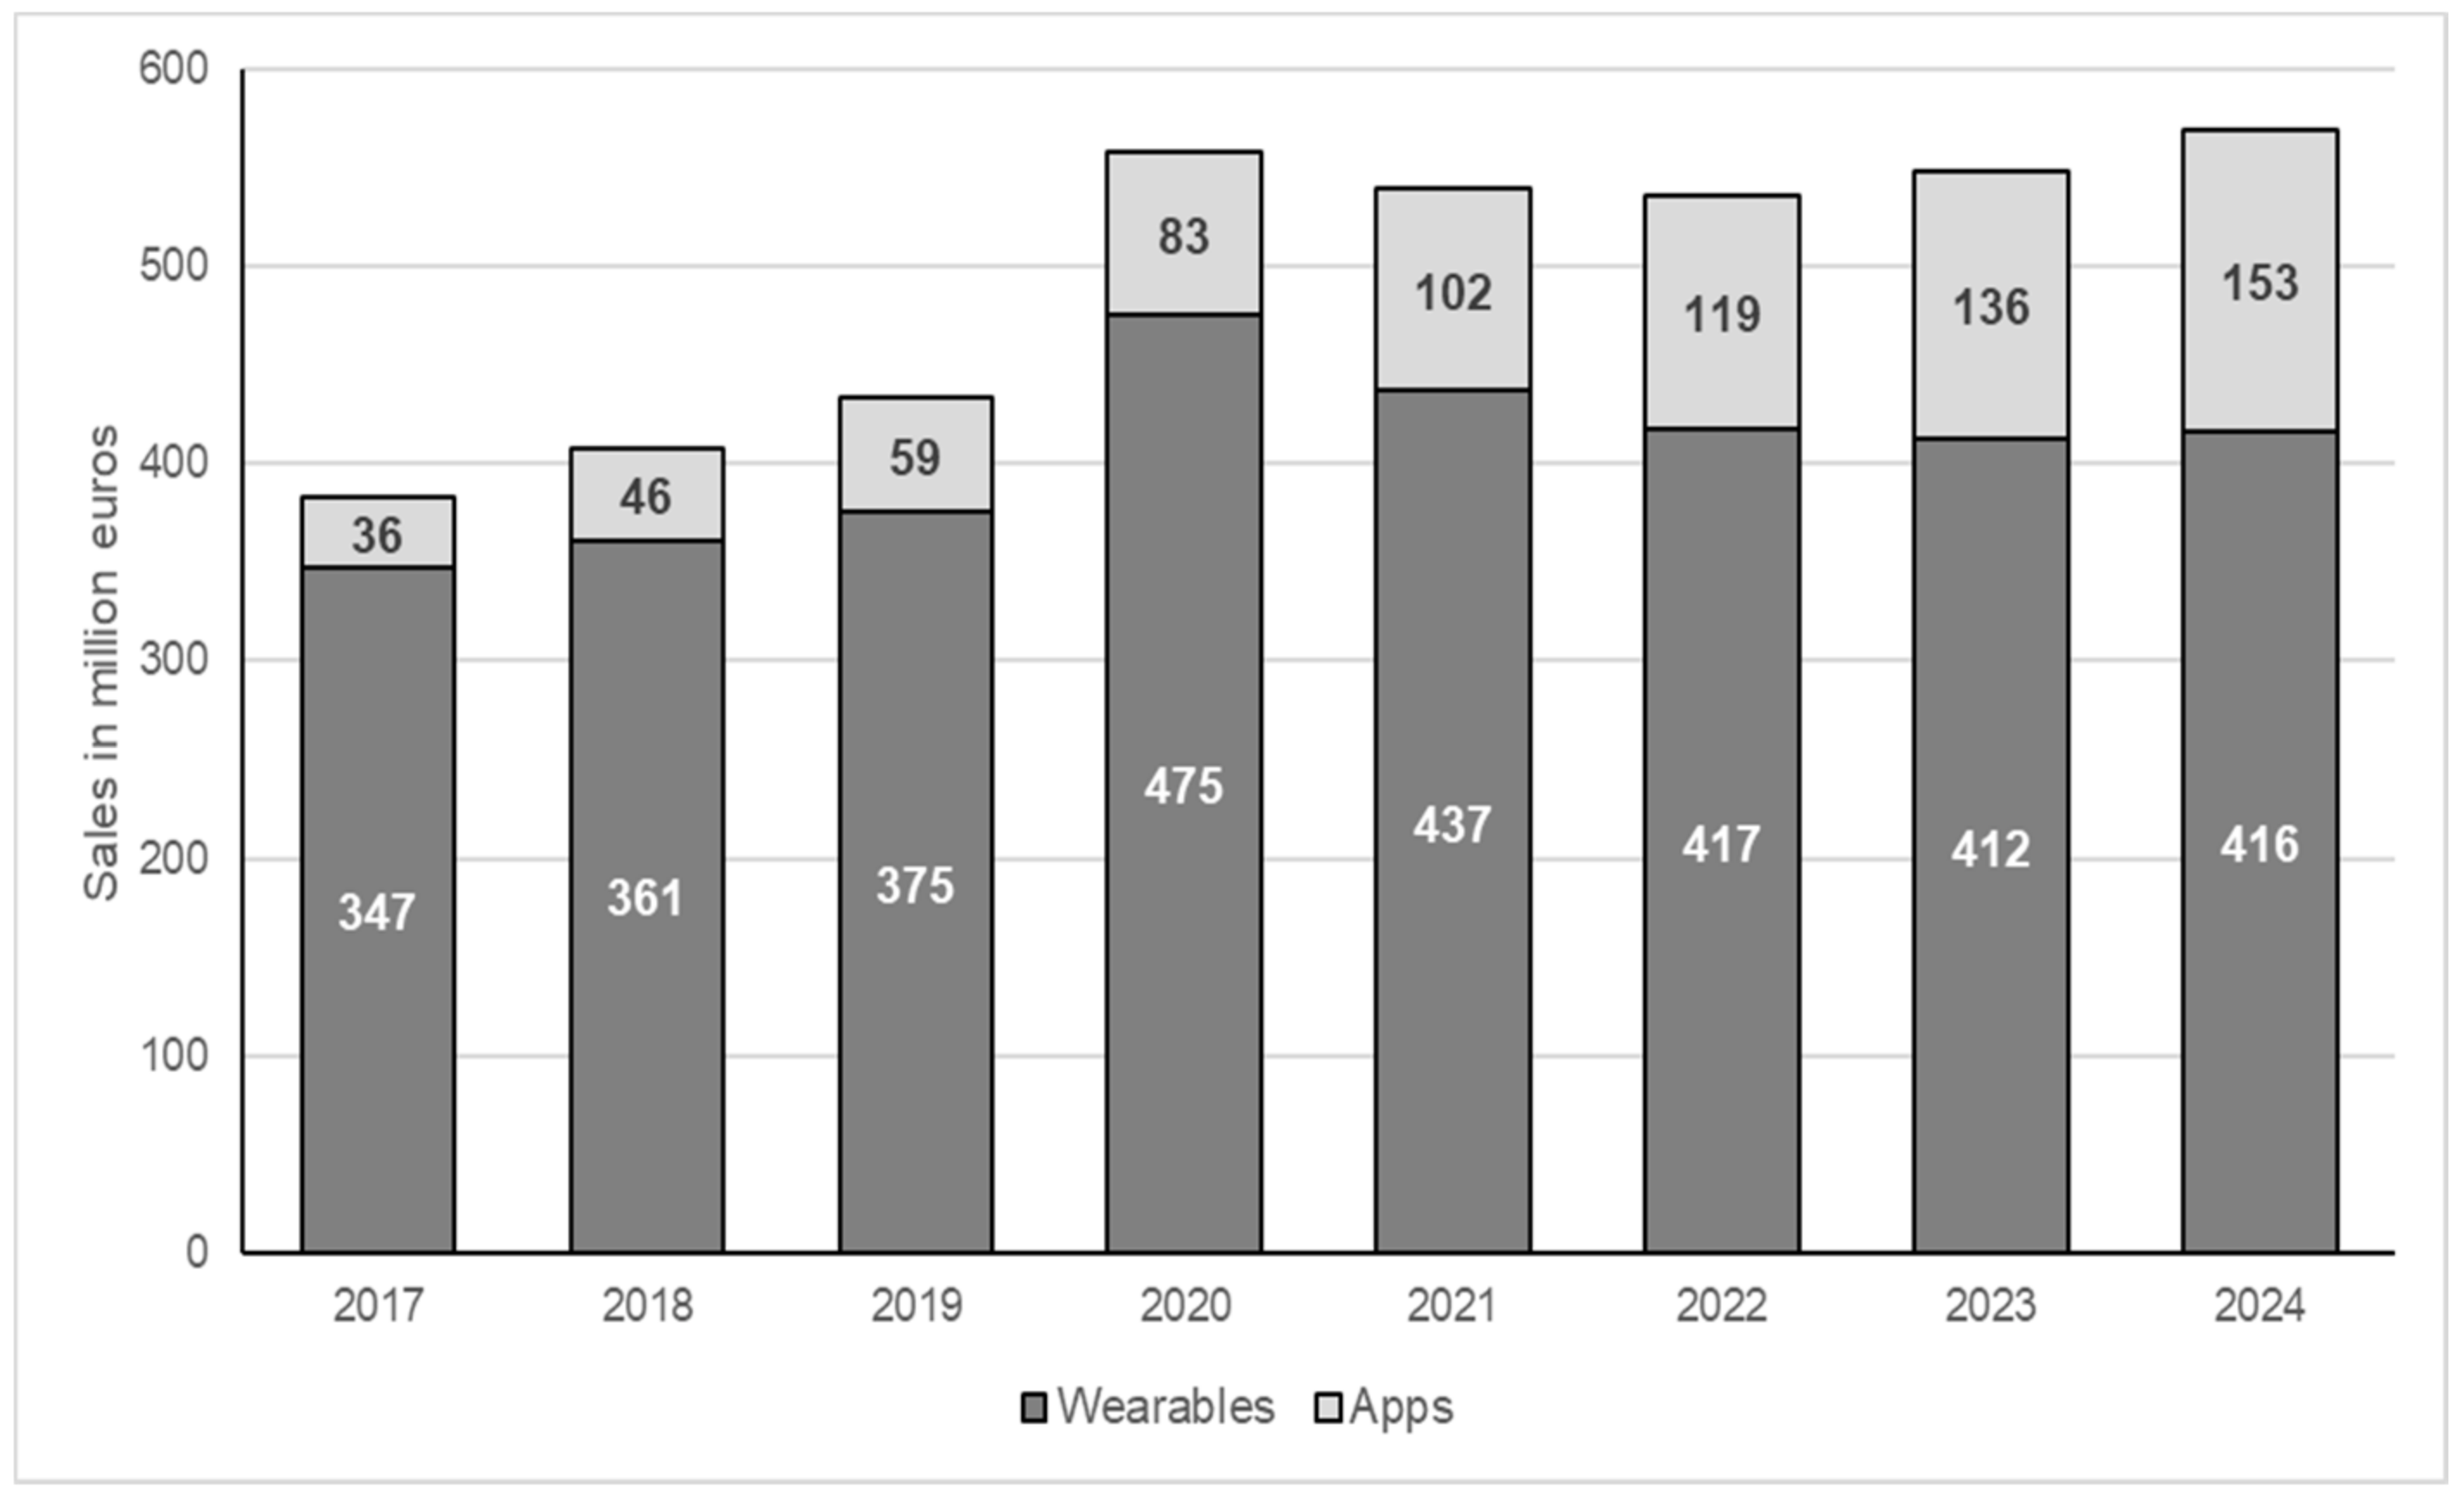
2.1. Digital Technologies in the Fitness and Health Market
2.2. Peloton Bike
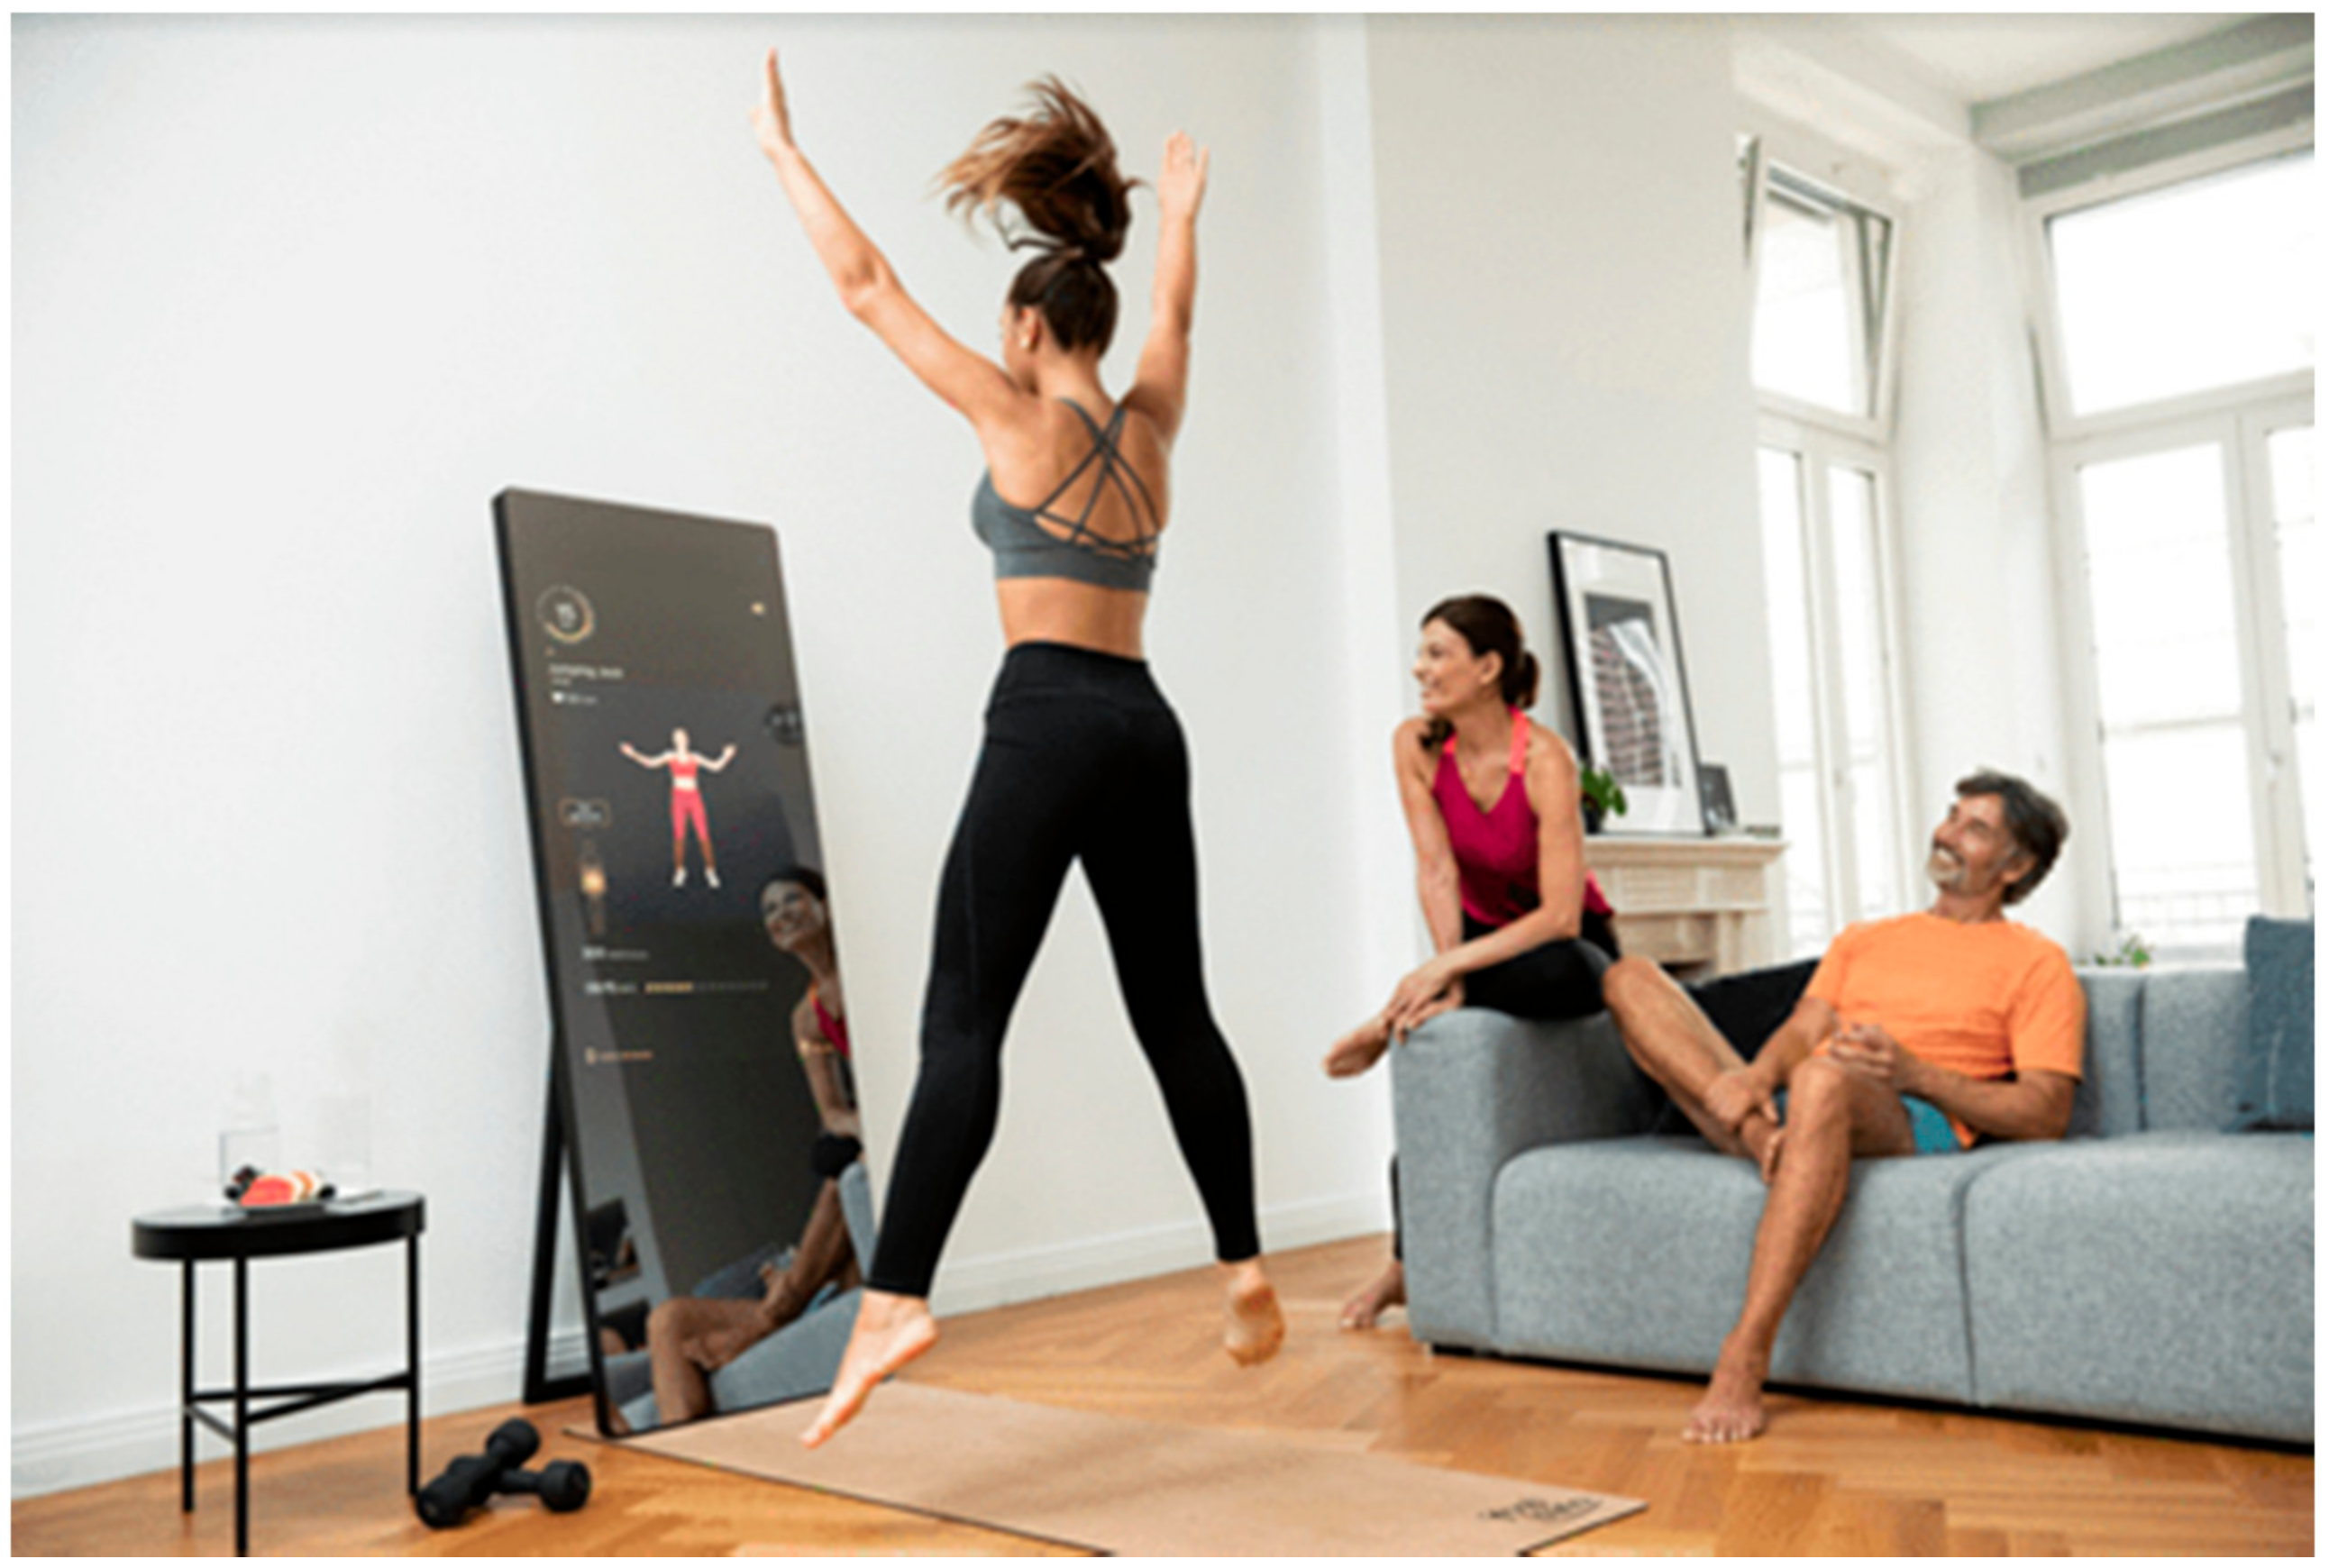
2.3. Vaha Fitness Mirror
2.4. Nintendo Ring Fit Adventure
3. Related Work
3.1. Technology Acceptance
3.2. Related Studies
4. Study
4.1. Method
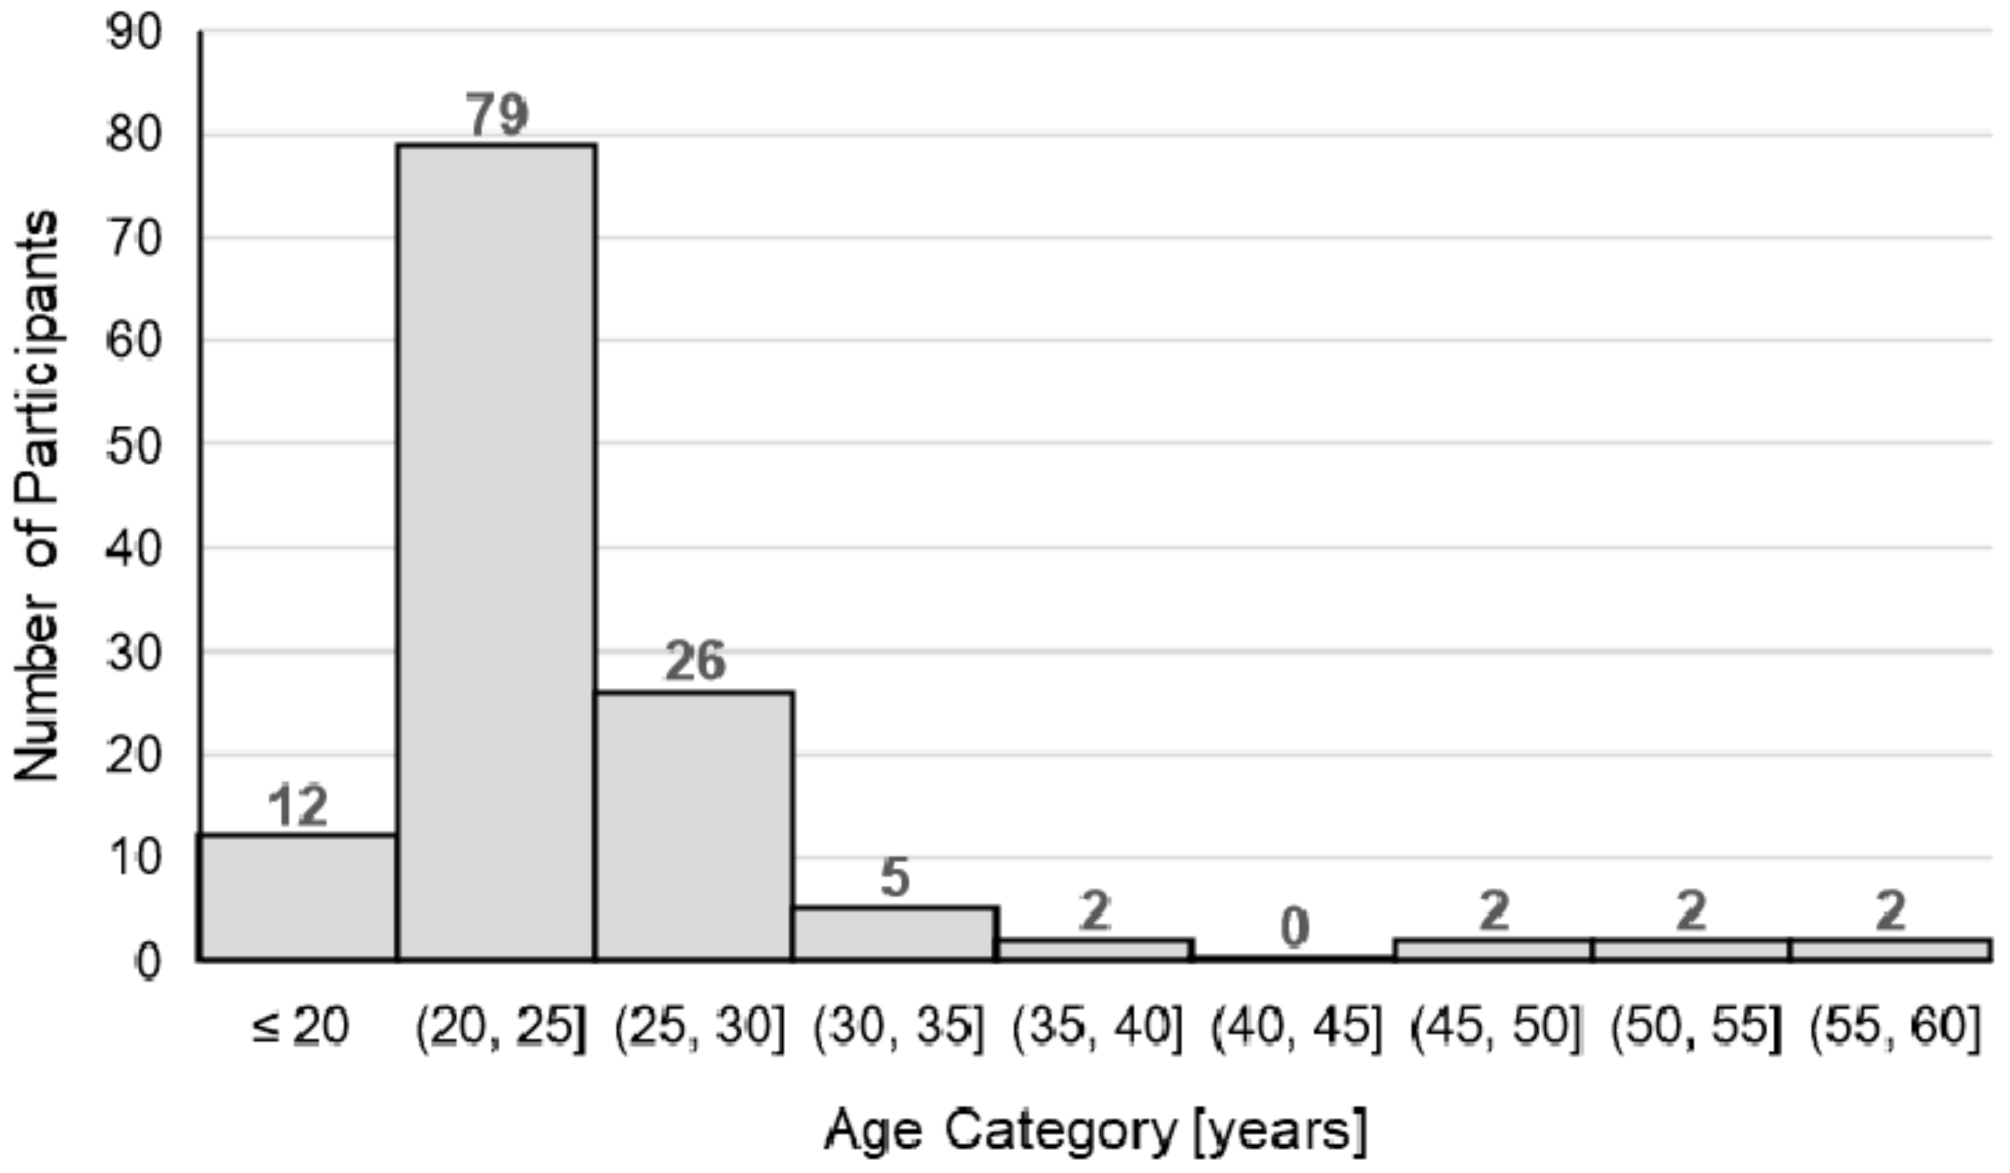
4.2. Sample
4.3. Data Processing and Statistics
5. Results and Discussion
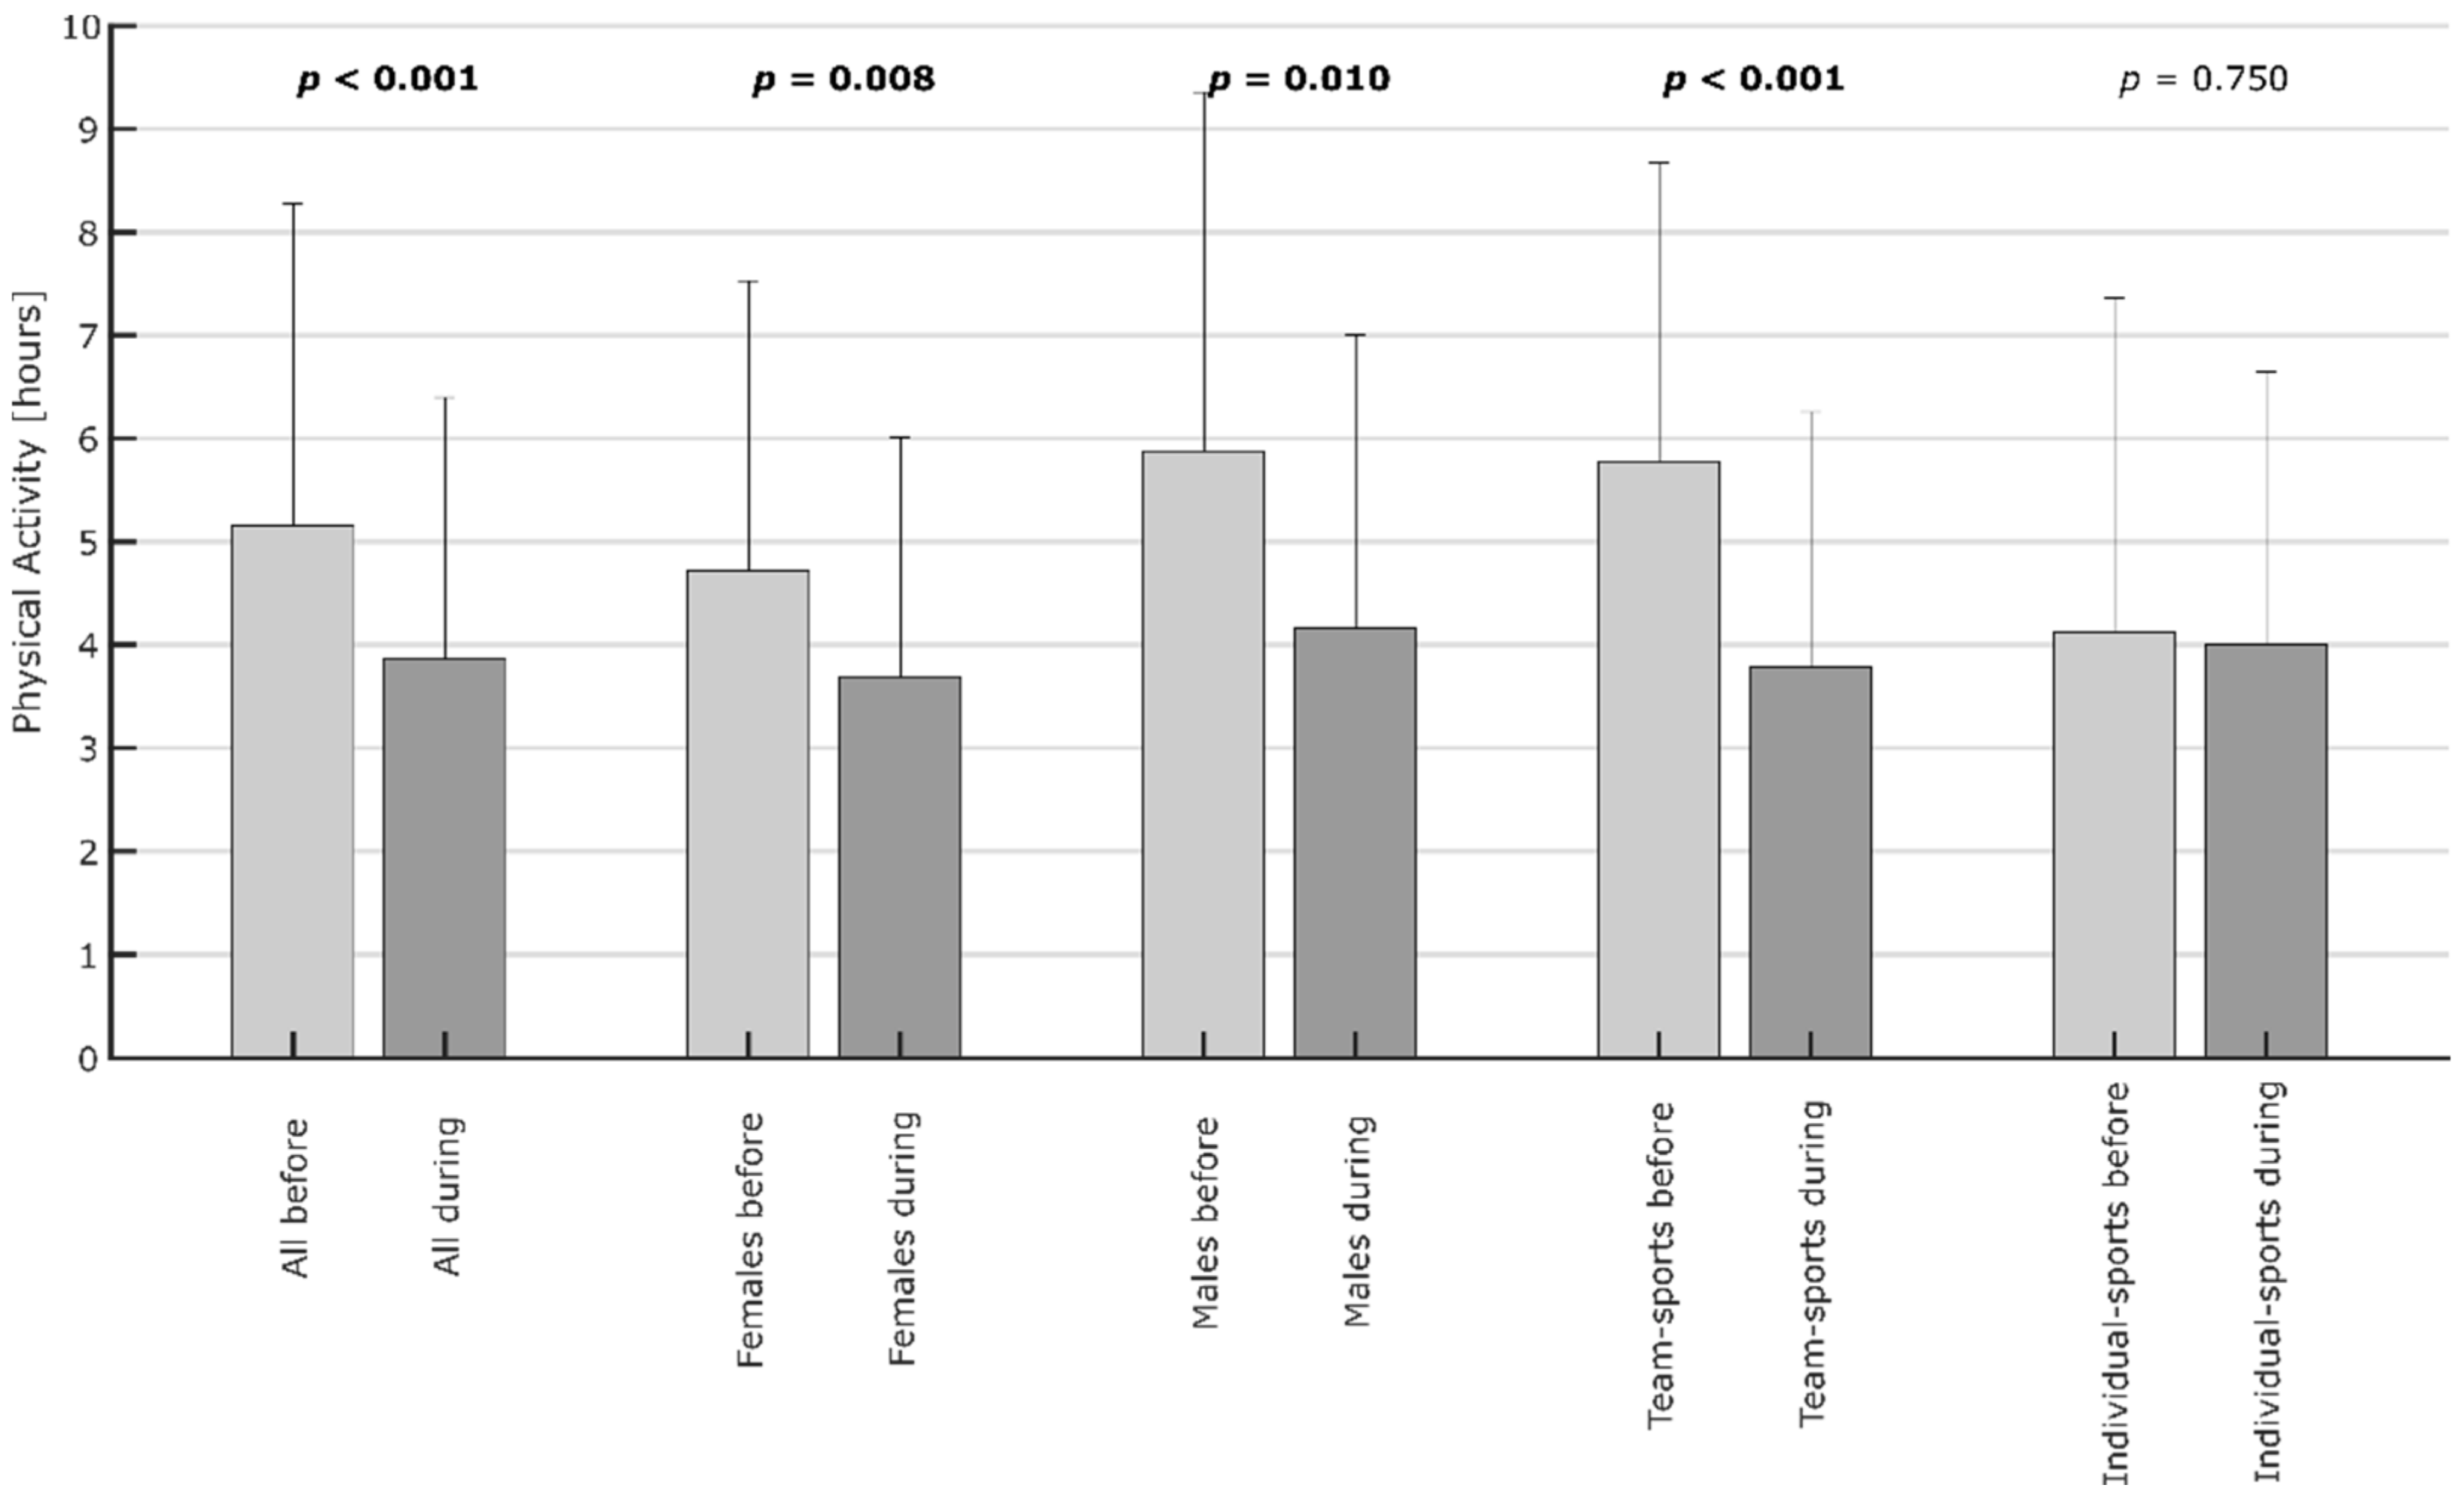
5.1. Time Spent with Physical Activity
5.2. Digital Sports Acceptance
6. Conclusions
- The study results highlight different needs between those with preferences for individual and team sports for maintaining physical activity levels. These should be considered when planning digital or non-digital sports intervention programs during pandemic restrictions.
- Future digital sports solutions should integrate more collaborative challenges to increase both the sense of belonging through collaboration and the ability to compete with others.
- This is especially true for men and for persons who prefer team sports. Male team players were most affected by the pandemic and experienced the greatest decrease in health activities, and thus they should be especially targeted by new digital sport solutions.
Limitations and Future Work
Author Contributions
Funding
Institutional Review Board Statement
Informed Consent Statement
Data Availability Statement
Conflicts of Interest
References
- Wilke, J.; Mohr, L.; Tenforde, A.S.; Edouard, P.; Fossati, C.; González-Gross, M.; Sánchez Ramírez, C.; Laiño, F.; Tan, B.; Pillay, J.D.; et al. A Pandemic within the Pandemic? Physical Activity Levels Substantially Decreased in Countries Affected by COVID-19. Int. J. Environ. Res. Public. Health 2021, 18, 2235. [Google Scholar] [CrossRef]
- World Health Organization. WHO Guideline: Recommendations on Digital Interventions for Health System Strengthening; World Health Organization: Geneva, Switzerland, 2021; ISBN 978-92-4-001275-2. [Google Scholar]
- Fadahunsi, K.P.; O’Connor, S.; Akinlua, J.T.; Wark, P.A.; Gallagher, J.; Carroll, C.; Car, J.; Majeed, A.; O’Donoghue, J. Information Quality Frameworks for Digital Health Technologies: Systematic Review. J. Med. Internet Res. 2021, 23, e23479. [Google Scholar] [CrossRef] [PubMed]
- Speicher, M.; Hall, B.D.; Nebeling, M. What is Mixed Reality? In Proceedings of the 2019 CHI Conference on Human Factors in Computing Systems, Glasgow, UK, 4–9 May 2019; ACM: Glasgow, UK, 2019; pp. 1–15. [Google Scholar] [CrossRef]
- Sawan, N.; Eltweri, A.; De Lucia, C.; Pio Leonardo Cavaliere, L.; Faccia, A.; Roxana Moşteanu, N. Mixed and Augmented Reality Applications in the Sport Industry. In Proceedings of the 2020 2nd International Conference on E-Business and E-commerce Engineering, Bangkok, Thailand, 29–31 December 2021; ACM: Bangkok, Thailand, 2020; pp. 55–59. [Google Scholar] [CrossRef]
- Thompson, W.R. Worldwide Survey of Fitness Trends for 2021. ACSM’s Health Fit. J. 2021, 25, 10–19. Available online: https://journals.lww.com/acsm-healthfitness/Fulltext/2021/01000/Worldwide_Survey_of_Fitness_Trends_for_2021.6.aspx (accessed on 19 November 2021). [CrossRef]
- Henriksen, A.; Haugen Mikalsen, M.; Woldaregay, A.Z.; Muzny, M.; Hartvigsen, G.; Hopstock, L.A.; Grimsgaard, S. Using Fitness Trackers and Smartwatches to Measure Physical Activity in Research: Analysis of Consumer Wrist-Worn Wearables. J. Med. Internet Res. 2018, 20, e110. [Google Scholar] [CrossRef] [PubMed]
- Statista, S.D.M. Umsatz mit Wearables und Fitness-Apps in Deutschland in den Jahren 2017 bis 2024. 2020. Available online: https://de.statista.com/outlook/dmo/eservices/fitness/Deutschland (accessed on 14 March 2021).
- Abonnentenanzahl von Peloton Weltweit Bis 2021|Statista. Available online: https://de.statista.com/statistik/daten/studie/1218425/umfrage/abonnenten-von-peloton-weltweit/ (accessed on 19 November 2021).
- Hüber, F. Peloton Bike+: Neues Spinning-Bike und neue Kurse für Deutschland. ComputerBase GmbH. February 2020. Available online: https://www.computerbase.de/2020-09/peloton-bike-neues-spinning-bike-kurse-deutschland/ (accessed on 28 March 2021).
- Hänssler, M. Peloton im Test: Lohnt sich das Luxus-Spinning-Bike für zu Hause? Fit for Fun (FOCUS Online Group GmbH). December 2020. Available online: https://www.fitforfun.de/tests/produkttest/peloton-im-test-lohnt-sich-das-luxus-spinningbike-426171.html (accessed on 28 March 2021).
- Peloton, I.S. Weltweiter Umsatz des Fitnessanbieters Peloton von 2017 bis 2020 (in Millionen US-Dollar). September 2020. Available online: https://de.statista.com/statistik/daten/studie/1218644/umfrage/peloton-umsatz-weltweit/ (accessed on 27 March 2021).
- Klostermeier, T. VAHA im Test: Überzeugt der smarte Workout-Spiegel für zu Hause? Fit for Fun (FOCUS Online Group GmbH). December 2020. Available online: https://www.fitforfun.de/tests/produkttest/vaha-smarter-fitness-spiegel-mit-personal-training-fuer-zu-hause-im-test-458428.html (accessed on 28 March 2021).
- Seils, L. Fit durch Gaming? Ring Fit Adventure für die Nintendo Switch im Test. Fit for Fun (FOCUS Online Group GmbH). November 2020. Available online: https://www.fitforfun.de/tests/produkttest/fit-durch-gaming-das-spiel-ring-fit-adventure-fuer-nintendo-switch-458043.html (accessed on 28 March 2021).
- Davis, F.D. Perceived Usefulness, Perceived Ease of Use, and User Acceptance of Information Technology. MIS Q. 1989, 13, 319–340. [Google Scholar] [CrossRef] [Green Version]
- Venkatesh, V.; Thong, J.; Xu, X. Unified Theory of Acceptance and Use of Technology: A Synthesis and the Road Ahead. J. Assoc. Inf. Syst. 2016, 17, 328–376. [Google Scholar] [CrossRef]
- Sohn, K.; Kwon, O. Technology acceptance theories and factors influencing artificial Intelligence-based intelligent products. Telemat. Inform. 2020, 47, 101324. [Google Scholar] [CrossRef]
- Ajzen, I. The theory of planned behavior. Organ. Behav. Hum. Decis. Process. 1991, 50, 179–211. [Google Scholar] [CrossRef]
- Venkatesh, V.; Morris, M.G.; Davis, G.B.; Davis, F.D. User Acceptance of Information Technology: Toward a Unified View. MIS Q. 2003, 27, 425–478. [Google Scholar] [CrossRef] [Green Version]
- Kim, H.-W.; Chan, H.C.; Gupta, S. Value-based Adoption of Mobile Internet: An empirical investigation. Decis. Support Syst. 2007, 43, 111–126. [Google Scholar] [CrossRef]
- Yang, H.; Lee, H.; Zo, H. User acceptance of smart home services: An extension of the theory of planned behavior. Ind. Manag. Data Syst. 2017, 117, 68–89. [Google Scholar] [CrossRef]
- Hsieh, P.-J. Healthcare professionals’ use of health clouds: Integrating technology acceptance and status quo bias perspectives. Int. J. Med. Inf. 2015, 84, 512–523. [Google Scholar] [CrossRef]
- Mutz, M.; Gerke, M. Sport and exercise in times of self-quarantine: How Germans changed their behaviour at the beginning of the COVID-19 pandemic. Int. Rev. Sociol. Sport 2020, 56, 305–316. [Google Scholar] [CrossRef]
- Wilke, J.; Hollander, K.; Mohr, L.; Edouard, P.; Fossati, C.; González-Gross, M.; Sánchez Ramírez, C.; Laiño, F.; Tan, B.; Pillay, J.D.; et al. Drastic Reductions in Mental Well-Being Observed Globally During the COVID-19 Pandemic: Results from the ASAP Survey. Front. Med. 2021, 8, 578959. [Google Scholar] [CrossRef]
- Mutz, M.; Müller, J.; Reimers, A.K. Use of Digital Media for Home-Based Sports Activities during the COVID-19 Pandemic: Results from the German SPOVID Survey. Int. J. Environ. Res. Public Health 2021, 18, 4409. [Google Scholar] [CrossRef] [PubMed]
- Parker, K.; Uddin, R.; Ridgers, N.D.; Brown, H.; Veitch, J.; Salmon, J.; Timperio, A.; Sahlqvist, S.; Cassar, S.; Toffoletti, K.; et al. The Use of Digital Platforms for Adults’ and Adolescents’ Physical Activity During the COVID-19 Pandemic (Our Life at Home): Survey Study. J. Med. Internet Res. 2021, 23, e23389. Available online: https://www.jmir.org/2021/2/e23389 (accessed on 19 November 2021). [CrossRef]
- Wilke, J.; Mohr, L.; Tenforde, A.S.; Edouard, P.; Fossati, C.; González-Gross, M.; Ramirez, C.S.; Laiño, F.; Tan, B.; Pillay, J.D.; et al. Restrictercise! Preferences Regarding Digital Home Training Programs during Confinements Associated with the COVID-19 Pandemic. Int. J. Environ. Res. Public. Health 2020, 17, 6515. [Google Scholar] [CrossRef]
- Chaloupský, D.; Hrušová, D.; Chaloupská, P. Use of Fitness Trackers in Fitness Running Classes to Enhance Students’ Motivation. In Blended Learning: Educational Innovation for Personalized Learning; Cheung, S.K.S., Lee, L.-K., Simonova, I., Kozel, T., Kwok, L.-F., Eds.; Springer International Publishing: Cham, Germany, 2019; Volume 11546, pp. 303–315. ISBN 978-3-030-21561-3. [Google Scholar] [CrossRef]
- Gowin, M.; Cheney, M.; Gwin, S.; Wann, T. Health and Fitness App Use in College Students: A Qualitative Study. Am. J. Health Educ. 2015, 46, 223–230. [Google Scholar] [CrossRef]
- Mokmin, N.A.M.; Jamiat, N. The effectiveness of a virtual fitness trainer app in motivating and engaging students for fitness activity by applying motor learning theory. Educ. Inf. Technol. 2020, 26, 1847–1864. [Google Scholar] [CrossRef]
- Chen, Y.; Pu, P. HealthyTogether: Exploring social incentives for mobile fitness applications. In Proceedings of the Second International Symposium of Chinese CHI on-Chinese CHI ’14, Toronto, ON, Canada, 26–27 April 2014; ACM Press: Toronto, ON, Canada, 2014; pp. 25–34. [Google Scholar] [CrossRef]
- Lewis, Z.H.; Pritting, L.; Picazo, A.-L.; JeanMarie-Tucker, M. The utility of wearable fitness trackers and implications for increased engagement: An exploratory, mixed methods observational study. Digit. Health 2020, 6, 205520761990005. [Google Scholar] [CrossRef]
- Lunney, A.; Cunningham, N.; Eastin, M. Wearable fitness technology: A structural investigation into acceptance and perceived fitness outcomes. Comput. Hum. Behav. 2016, 65, 114–120. [Google Scholar] [CrossRef]
- Maher, C.; Ryan, J.; Ambrosi, C.; Edney, S. Users’ experiences of wearable activity trackers: A cross-sectional study. BMC Public Health 2017, 17, 880. [Google Scholar] [CrossRef] [Green Version]
- Vooris, R.; Blaszka, M.; Purrington, S. Understanding the wearable fitness tracker revolution. Int. J. Sociol. Leis. 2019, 2, 421–437. [Google Scholar] [CrossRef]
- Alturki, M. A Systematic Review on What Features Should be Supported by Fitness Apps and Wearables to Help Users Overcome Obesity. Int. J. Res. Eng. Technol. 2016, 5, 197–206. [Google Scholar]
- Frimming, R.E.; Polsgrove, M.J.; Bower, G.G. Evaluation of a Health and Fitness Social Media Experience. Am. J. Health Educ. 2011, 42, 222–227. [Google Scholar] [CrossRef]
- Al-Eisa, E.; Al-Rushud, A.; Alghadir, A.; Anwer, S.; Al-Harbi, B.; Al-Sughaier, N.; Al-Yoseef, N.; Al-Otaibi, R.; Al-Muhaysin, H.A. Effect of Motivation by “Instagram” on Adherence to Physical Activity among Female College Students. BioMed Res. Int. 2016, 2016, 1546013. [Google Scholar] [CrossRef] [Green Version]
- Teodoro, R.; Naaman, M. Fitter with Twitter: Understanding Personal Health and Fitness Activity in Social Media. In Proceedings of the International AAAI Conference on Web and Social Media, Stanford, CA, USA, 25–28 June 2018; Volume 7. Available online: https://ojs.aaai.org/index.php/ICWSM/article/view/14417 (accessed on 20 November 2021).
- Raggatt, M.; Wright, C.J.C.; Carrotte, E.; Jenkinson, R.; Mulgrew, K.; Prichard, I.; Lim, M.S.C. “I aspire to look and feel healthy like the posts convey”: Engagement with fitness inspiration on social media and perceptions of its influence on health and wellbeing. BMC Public Health 2018, 18, 1002. [Google Scholar] [CrossRef]
- Hale, T.; Angrist, N.; Goldszmidt, R.; Kira, B.; Petherick, A.; Phillips, T.; Webster, S.; Cameron-Blake, E.; Hallas, L.; Majumdar, S.; et al. A global panel database of pandemic policies (Oxford COVID-19 Government Response Tracker). Nat. Hum. Behav. 2021, 5, 529–538. [Google Scholar] [CrossRef] [PubMed]
- Zeng, H.Z. The differences between anxiety and self-confidence between team and individual sports college varsity athletes. Int. Sports J. 2003, 7, 28. [Google Scholar]
- Pluhar, E.; McCracken, C.; Griffith, K.L.; Christino, M.A.; Sugimoto, D.; Meehan, W.P. Team Sport Athletes May Be Less Likely To Suffer Anxiety or Depression than Individual Sport Athletes. J. Sports Sci. Med. 2019, 18, 490–496. [Google Scholar]
- Nia, M.E.; Besharat, M.A. Comparison of athletes’ personality characteristics in individual and team sports. Procedia Soc. Behav. Sci. 2010, 5, 808–812. [Google Scholar] [CrossRef] [Green Version]
- Kajbafnezhad, H.; Ahadi, H.; Heidarie, A.R.; Askari, P.; Enayati, M. Difference between team and individual sports with respect to psychological skills, overall emotional intelligence and athletic success motivation in Shiraz city athletes. J. Phys. Educ. Sport 2011, 11, 249. [Google Scholar]
- Van de Pol, P.K.C.; Kavussanu, M. Achievement motivation across training and competition in individual and team sports. Sport Exerc. Perform. Psychol. 2012, 1, 91–105. [Google Scholar] [CrossRef]
- Cohen, J. Statistical Power Analysis for the Behavioral Sciences; Routledge: London, UK, 2013; ISBN 978-1-134-74277-6. [Google Scholar]
- Gignac, G.E.; Szodorai, E.T. Effect size guidelines for individual differences researchers. Personal. Individ. Differ. 2016, 102, 74–78. [Google Scholar] [CrossRef]


| S1 | Before the pandemic, I spent x hours for sports activities per week. (number) |
| S2 | During the pandemic, I spent x hours for sports activities per week. (number) |
| S3 | Before the pandemic, I did the following sports. (free text) |
| S4 | I use the following digital sport solutions. (free text) |
| Q1 | Regardless of the restrictions during the pandemic, I am just as active in sports as I was before. |
| Q2 | Since the start of the pandemic, I use more digital sports solutions than before. |
| Q3 | Digital sports solutions motivate me to stay active in sports even in times of pandemic. |
| Q4 | My goal is to use the time during lock down to not lose overall fitness level. |
| Q5 | Online fitness challenges and live online sports in groups increase the motivation to do sports. |
| Q6 | Online fitness challenges and live online sports in groups increase the sense of belonging in times of pandemic. |
| Q7 | I own a fitness tracker/smart watch; by using it, I give more attention to my daily exercise. |
| Q8 | By using digital sports solutions, I was able to improve my personal performance. |
| Q9 | I will continue to use digital sports solutions after the pandemic. |
| ID | Questions (Q) | All (n = 130) M (SD) | Female (n = 81) M (SD) | Male (n = 49) M (SD) | Team Sports (n = 81) M (SD) | Individual (n = 49) M (SD) |
|---|---|---|---|---|---|---|
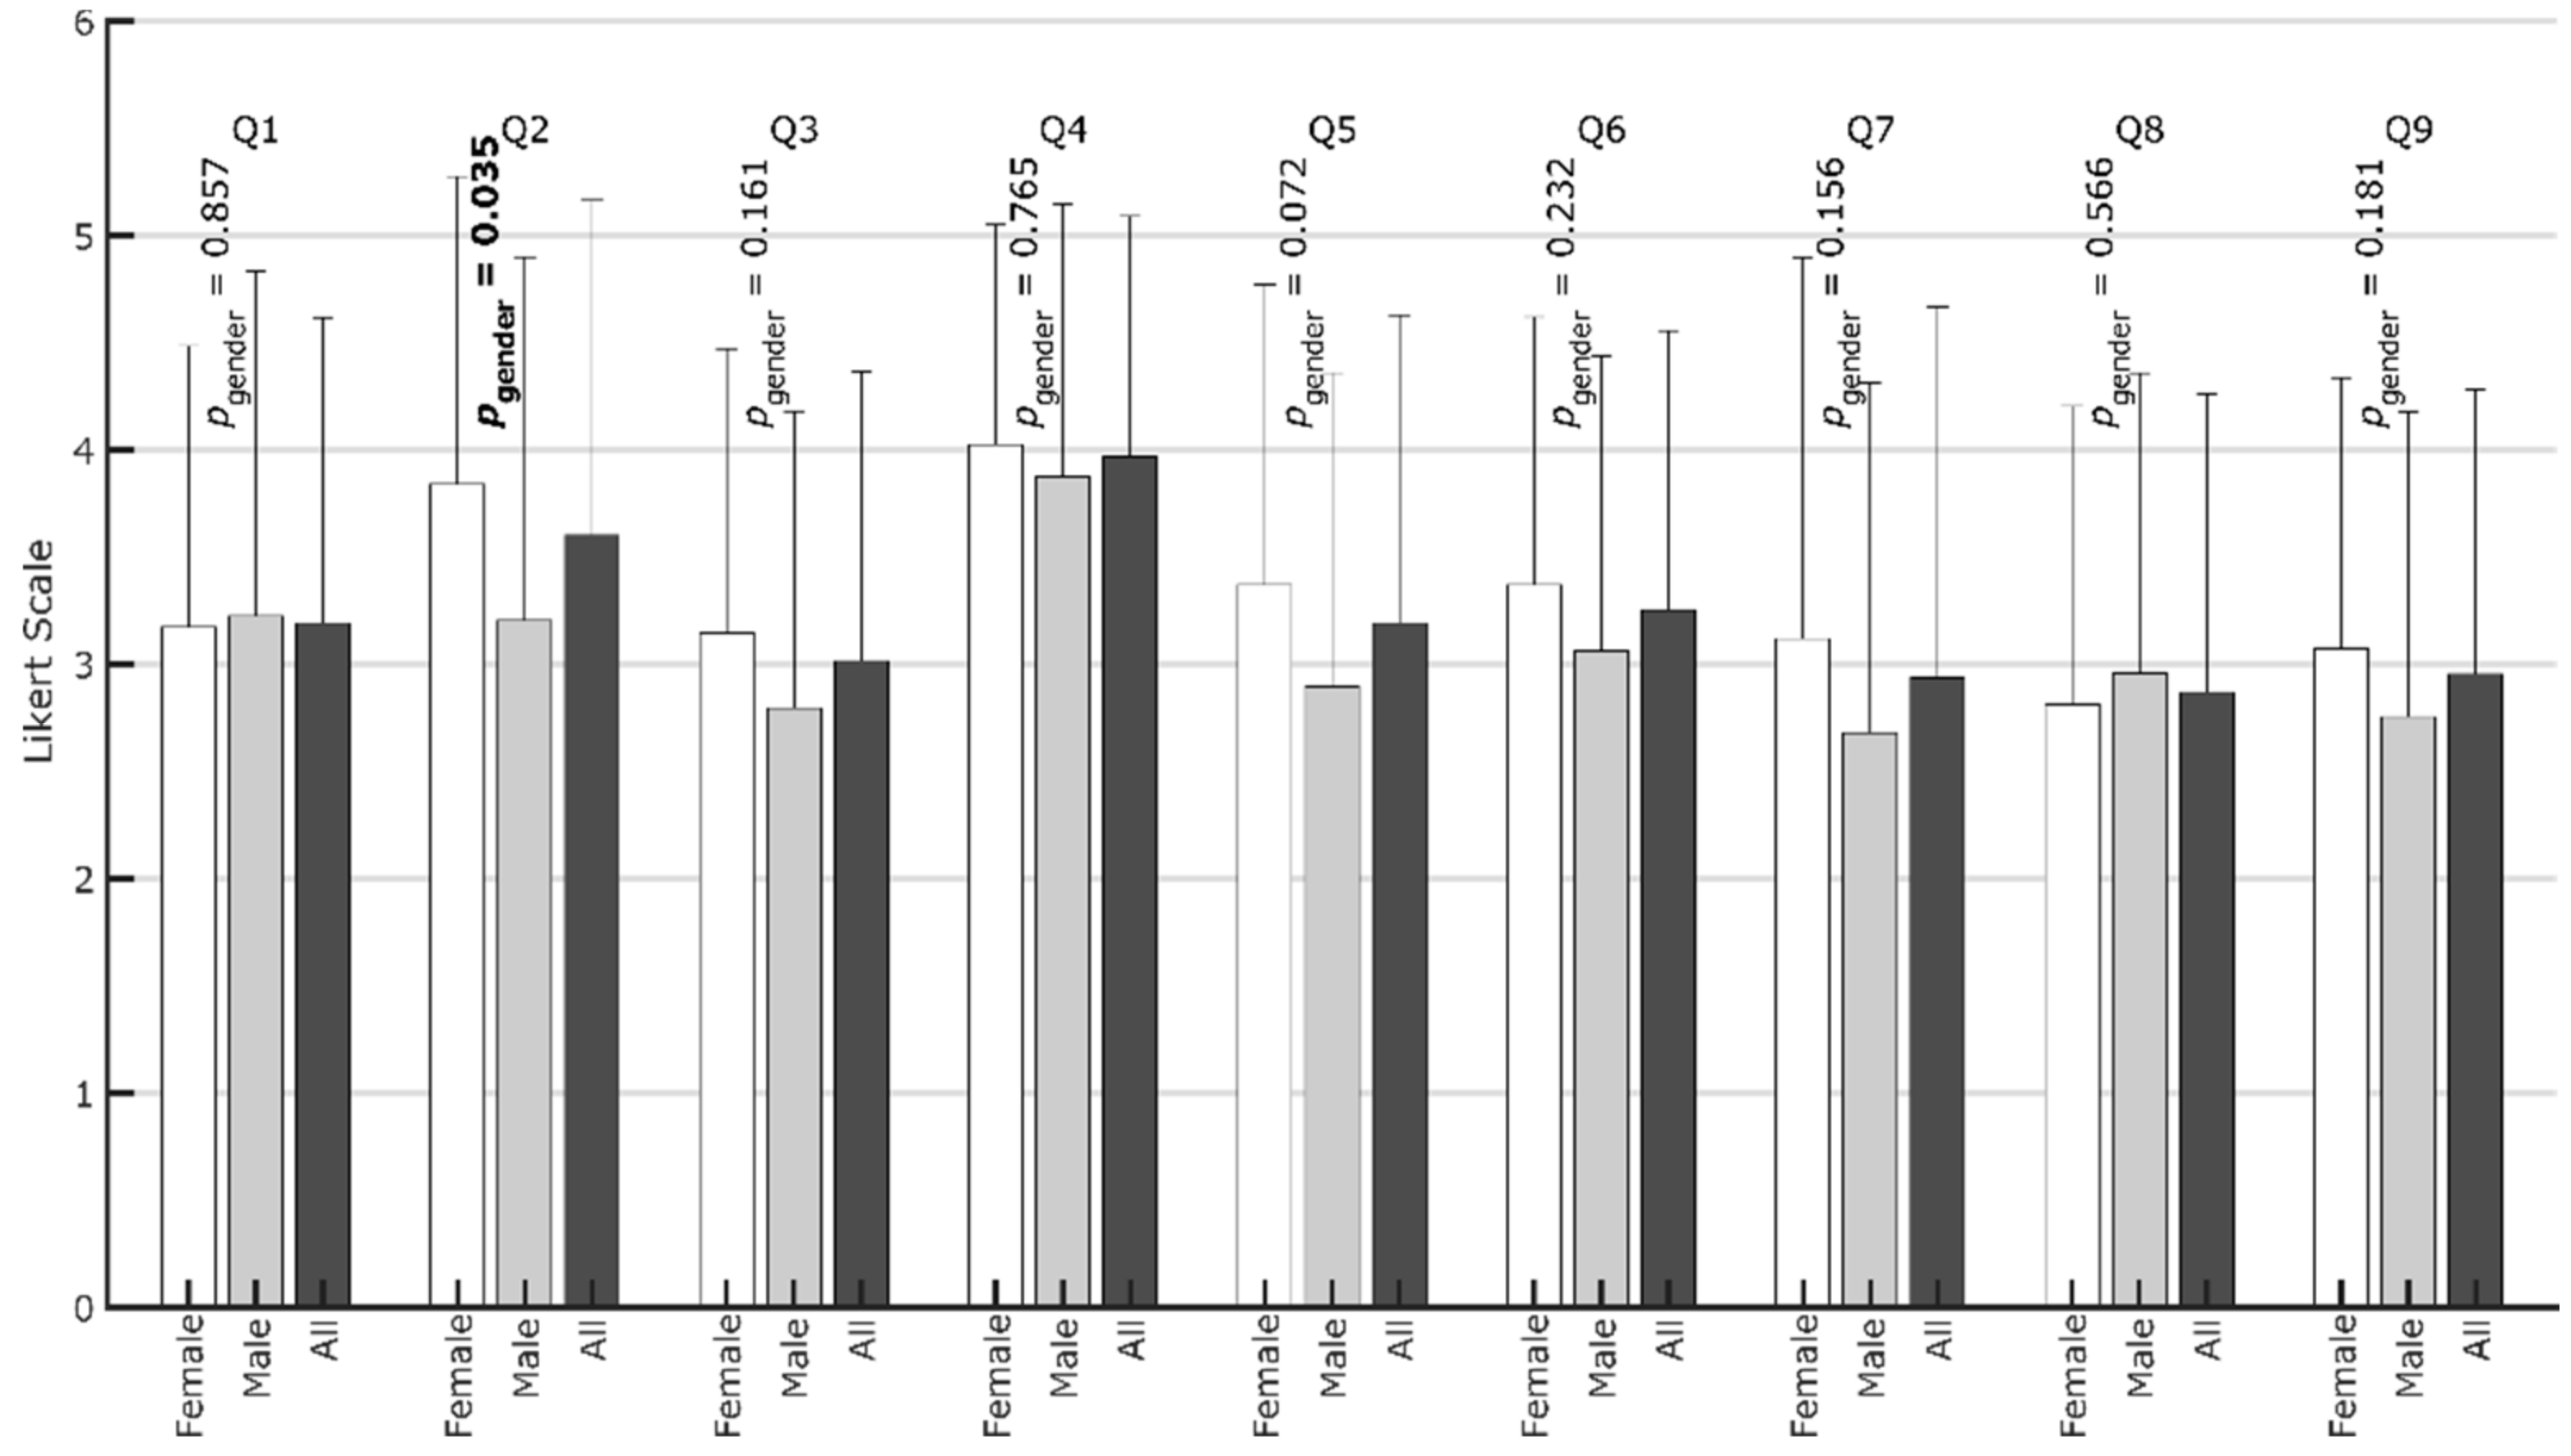
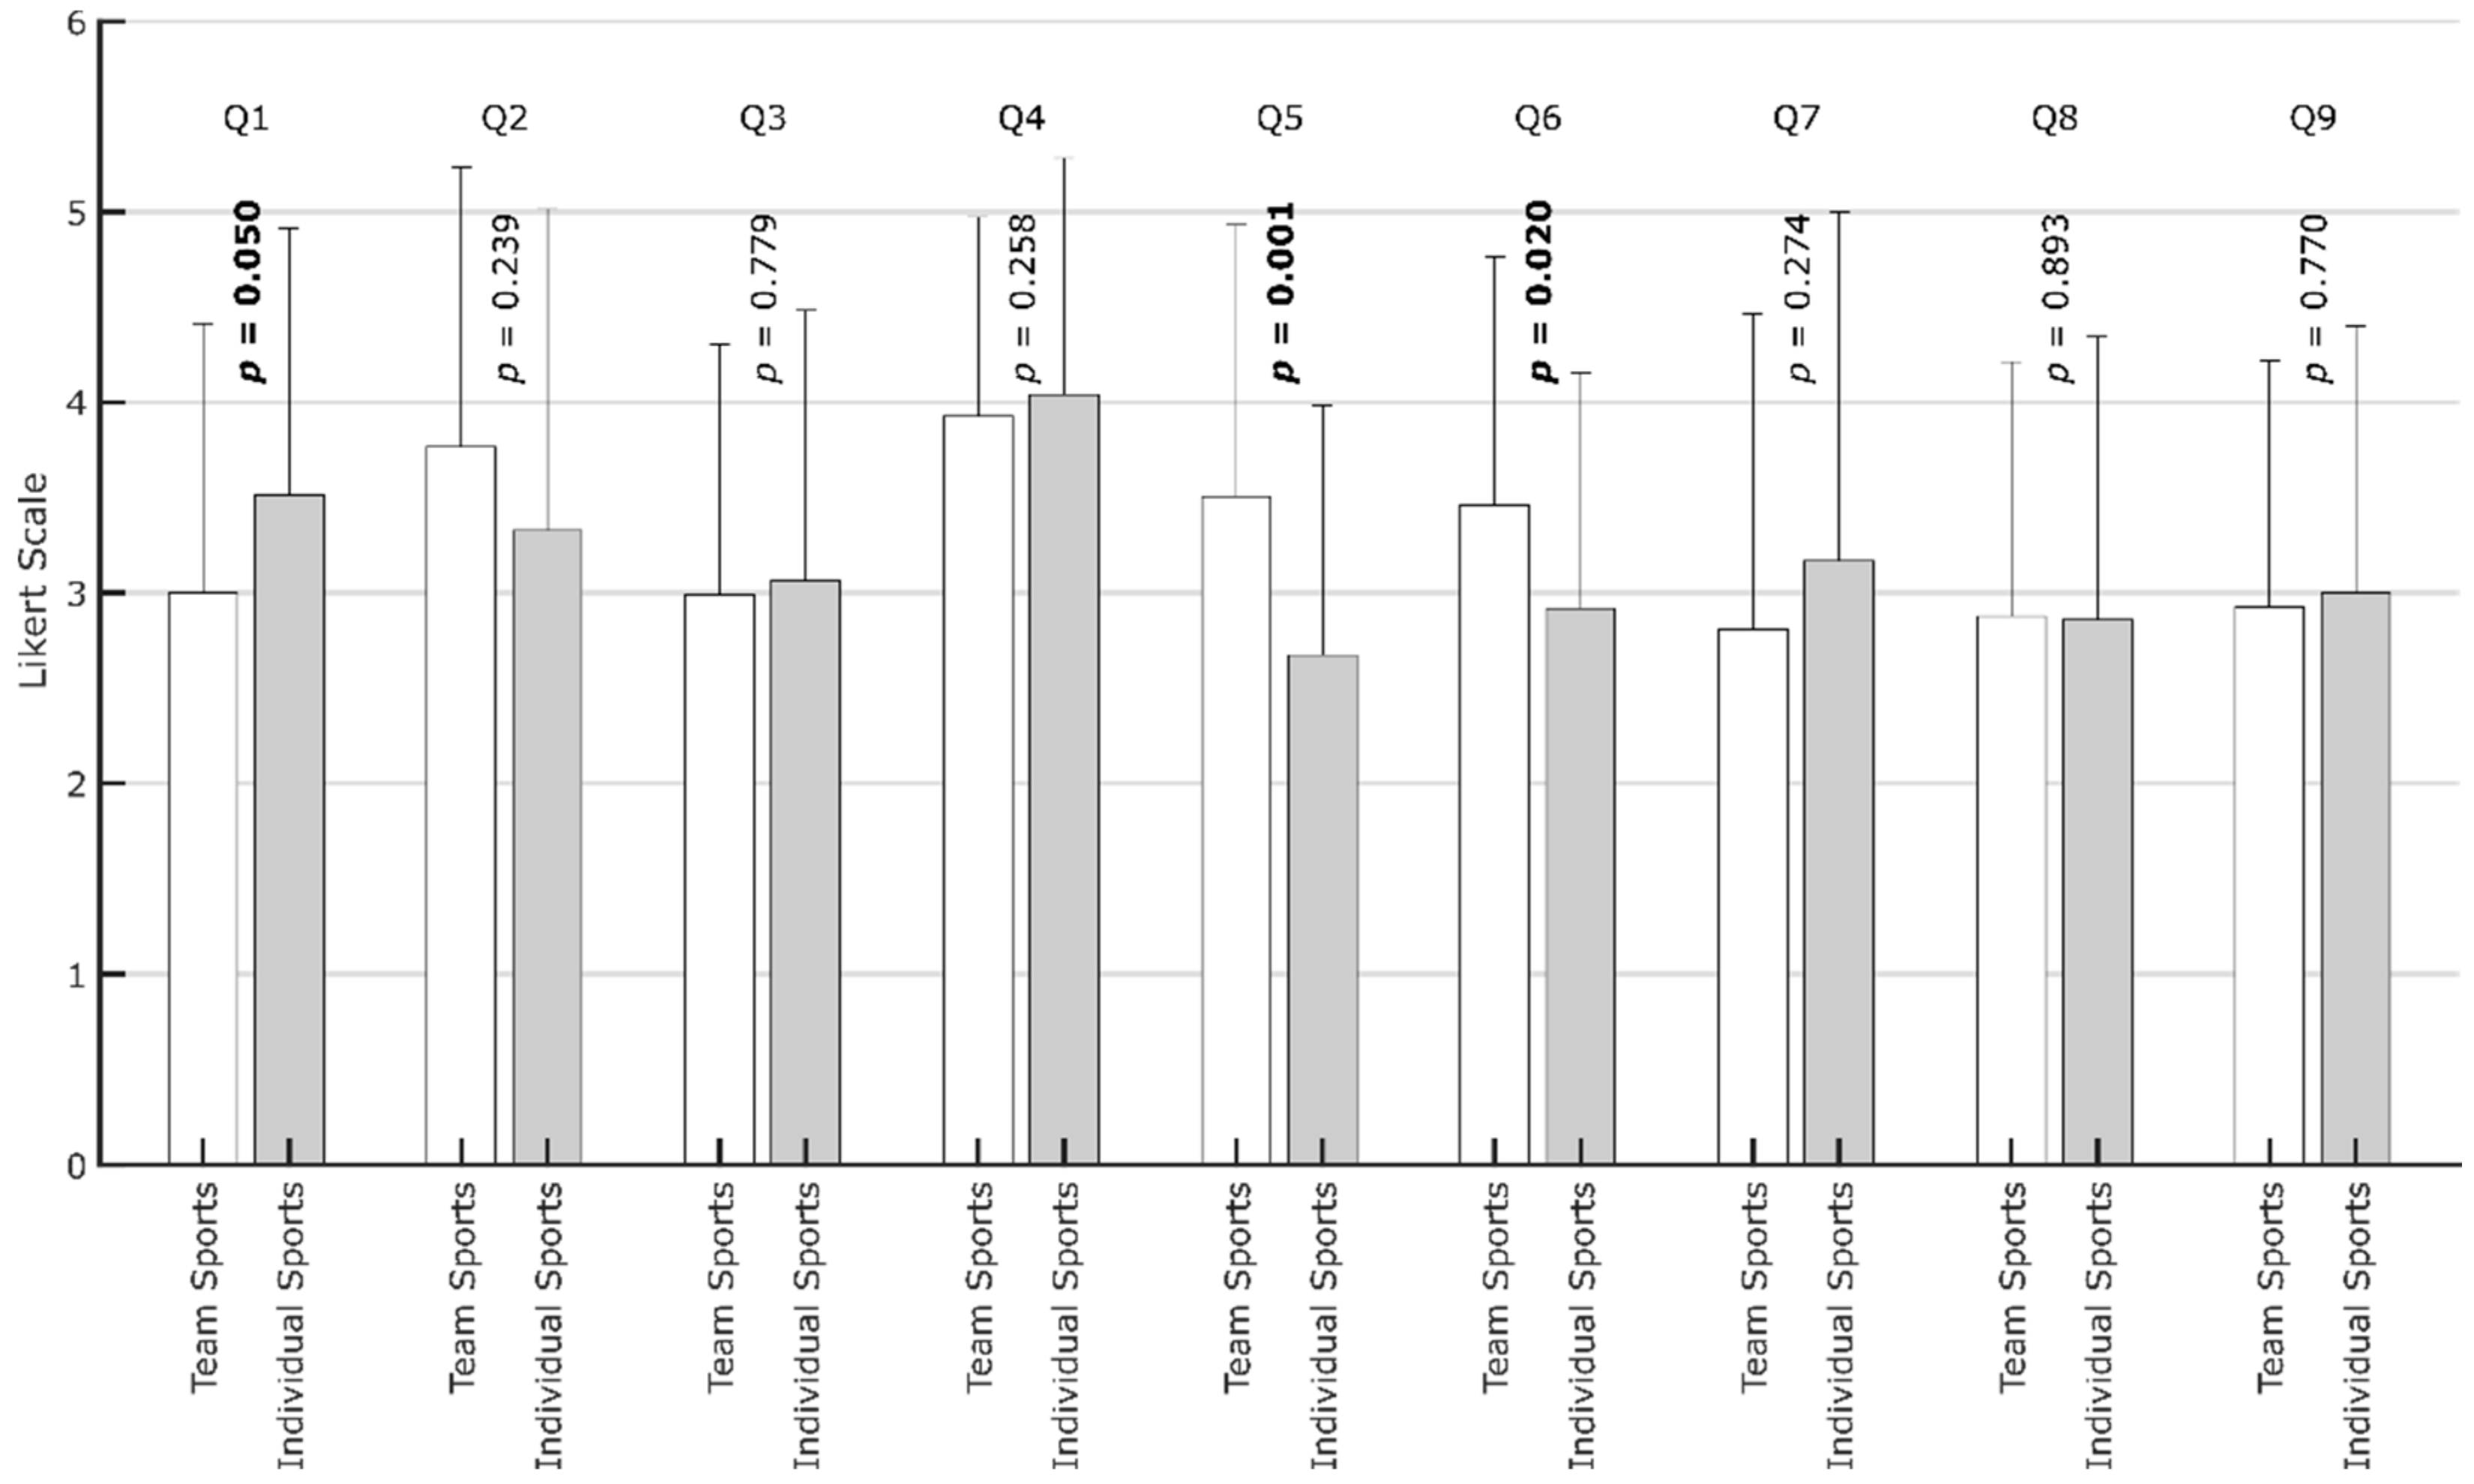
| Q1 | Regardless of the restrictions during the pandemic, I am just as active in sports as I was before. | 3.2 (1.4) | 3.2 (1.3) | 3.2 (1.6) | 3.0 (1.4) | 3.5 (1.5) |
| Q2 | Since the start of the pandemic, I use more digital sports solutions than before. | 3.6 (1.6) | 3.8 (1.4) | 3.2 (1.7) | 3.8 (1.5) | 3.3 (1.7) |
| Q3 | Digital sports solutions motivate me to stay active in sports even in times of pandemic. | 3.0 (1.4) | 3.1 (1.3) | 2.8 (1.4) | 3.0 (1.3) | 3.1 (1.4) |
| Q4 | My goal is to use the time during lockdown to not lose overall fitness level. | 4.0 (1.1) | 4.0 (1.0) | 3.9 (1.3) | 3.9 (1.0) | 4.0 (1.2) |
| Q5 | Online fitness challenges and live online sports in groups increase the motivation to do sports. | 3.2 (1.4) | 3.4 (1.4) | 2.9 (1.5) | 3.5 (1.4) | 2.7 (1.3) |
| Q6 | Online fitness challenges and live online sports in groups increase the sense of belonging in times of pandemic. | 3.3 (1.3) | 3.4 (1.2) | 3.1 (1.4) | 3.5 (1.3) | 2.9 (1.2) |
| Q7 | I own a fitness tracker/smart watch: by using it, I give more attention to my daily exercise. | 2.9 (1.7) | 3.1 (1.8) | 2.7 (1.6) | 2.8 (1.7) | 3.2 (1.8) |
| Q8 | By using digital sports solutions, I was able to improve my personal performance. | 2.9 (1.4) | 2.8 (1.4) | 3.0 (1.4) | 2.9 (1.3) | 2.9 (1.5) |
| Q9 | I will continue to use digital sports solutions after the pandemic. | 3.0 (1.3) | 3.1 (1.3) | 2.8 (1.4) | 2.9 (1.3) | 3.0 (1.4) |
| Hypothesis | Correlation between | Correlation Coefficient |
|---|---|---|
| H3 | Q1, Q3 | r = 0.33 medium |
| H4 | Q3, Q9 | r = 0.65 large |
Publisher’s Note: MDPI stays neutral with regard to jurisdictional claims in published maps and institutional affiliations. |
© 2022 by the authors. Licensee MDPI, Basel, Switzerland. This article is an open access article distributed under the terms and conditions of the Creative Commons Attribution (CC BY) license (https://creativecommons.org/licenses/by/4.0/).
Share and Cite
Ruth, J.; Willwacher, S.; Korn, O. Acceptance of Digital Sports: A Study Showing the Rising Acceptance of Digital Health Activities Due to the SARS-CoV-19 Pandemic. Int. J. Environ. Res. Public Health 2022, 19, 596. https://0-doi-org.brum.beds.ac.uk/10.3390/ijerph19010596
Ruth J, Willwacher S, Korn O. Acceptance of Digital Sports: A Study Showing the Rising Acceptance of Digital Health Activities Due to the SARS-CoV-19 Pandemic. International Journal of Environmental Research and Public Health. 2022; 19(1):596. https://0-doi-org.brum.beds.ac.uk/10.3390/ijerph19010596
Chicago/Turabian StyleRuth, Jacqueline, Steffen Willwacher, and Oliver Korn. 2022. "Acceptance of Digital Sports: A Study Showing the Rising Acceptance of Digital Health Activities Due to the SARS-CoV-19 Pandemic" International Journal of Environmental Research and Public Health 19, no. 1: 596. https://0-doi-org.brum.beds.ac.uk/10.3390/ijerph19010596